Abstract
Lenvatinib is a multikinase inhibitor approved as a first‐line therapy for advanced hepatocellular carcinoma (HCC). However, the development of drug resistance is common, and the underlying mechanisms governing this resistance are largely unknown. In this study, we established two lenvatinib‐resistant (LR) HCC cell lines and identified integrin subunit beta 8 (ITGB8) as a critical contributor to lenvatinib resistance in HCC. The elevated expression of ITGB8 was observed in LR HCC cells. Furthermore, silencing of ITGB8 reversed lenvatinib resistance in vitro and in vivo, whereas ectopic expression of ITGB8 in lenvatinib‐sensitive parental HCC cells exhibited increased resistance to lenvatinib. Mechanistically, ITGB8 regulated lenvatinib resistance through an HSP90‐mediated stabilization of AKT and enhanced AKT signaling. In support of this model, either an AKT inhibitor MK‐2206 or an HSP90 inhibitor 17‐AAG resensitized LR HCC cells to lenvatinib treatment. Conclusion: Collectively, our results establish a crucial role of ITGB8 in lenvatinib resistance, and suggest that targeting the ITGB8/HSP90/AKT axis is a promising therapeutic strategy in patients with HCC exhibiting lenvatinib resistance.
In this study, our results establish a crucial role of ITGB8 in lenvatinib resistance in HCC, and suggest that targeting the ITGB8/HSP90/AKT axis is a promising therapeutic strategy in patients with HCC exhibiting lenvatinib resistance.

INTRODUCTION
Hepatocellular carcinoma (HCC) is the sixth most common tumor worldwide and the fourth most common cause of cancer‐related death.[ 1 ] Patients with advanced HCC represent a serious clinical challenge. Sorafenib was the first targeted multikinase inhibitor (TKI) approved by the Food and Drug Administration in 2008 for patients with advanced HCC.[ 2 ] However, it only increased overall survival by 2.8 months.[ 3 ] A decade passed before lenvatinib, another TKI was approved as a second first‐line systemic therapy for nonresectable HCC.[ 4 ] Lenvatinib targets multiple kinases, including endothelial growth factor receptors 1 through 3, fibroblast growth factor receptors 1 through 4, platelet‐derived growth factor receptor α, kit proto‐oncogene, and ret proto‐oncogene.[ 5 , 6 , 7 ] Lenvatinib exhibited noninferiority to sorafenib and increased progression‐free survival by 3.7 months compared with sorafenib.[ 8 ] However, although a total of 85% of patients achieved a partial response or disease stabilization, many patients did not respond or later acquired resistance,[ 8 ] which reduced lenvatinib’s overall therapeutic efficacy.
Several studies have proposed potential mechanisms modulating lenvatinib resistance in HCC. For example, phosphoglycerate dehydrogenase, the first committed enzyme in the serine synthesis pathway, was identified as a critical mediator of lenvatinib resistance in HCC cells.[ 9 ] Also, KEAP1 inactivation has been shown to contribute to lenvatinib resistance in human HCC cells through up‐regulation of nuclear erythroid 2 p45‐related factor 2 downstream genes and decreased reactive oxygen species levels.[ 10 ] In addition, the activation of human growth factor/ mesenchymal epithelial transition factor axis promoted lenvatinib resistance in HCC cells.[ 11 ] However, the exact mechanisms underlying lenvatinib resistance in HCC are complicated and remain undercharacterized, especially for the acquired resistance to lenvatinib. Therefore, further investigation into the molecular basis of lenvatinib resistance is needed to guide the development of strategies to prevent or overcome resistance to lenvatinib therapy in HCC.
In the present study, we generated two lenvatinib resistant HCC cell lines and performed RNA sequencing (RNA‐seq) to identify critical factors contributing to lenvatinib resistance comprehensively. We discovered integrin subunit beta 8 (ITGB8) as a crucial driver of lenvatinib resistance in HCC cells. Elevated expression of ITGB8 was found in lenvatinib‐resistant (LR) HCC cells. Knockdown of ITGB8 overcame lenvatinib resistance in vitro and in xenograft models, whereas ectopic expression of ITGB8 in lenvatinib‐sensitive cells led to increased resistance to lenvatinib. Mechanically, ITGB8 regulates lenvatinib resistance through an HSP90/AKT‐dependent signaling pathway. Notably, inhibition of AKT or HSP90 with MK‐2206 or 17‐AAG, respectively, resensitized LR cells to lenvatinib treatment. Overall, our results demonstrate that targeting the ITGB8/HSP90/AKT signaling axis could be a practical approach to overcome lenvatinib resistance in HCC, and both AKT and HSP90 inhibitors may be beneficial to patients with HCC showing lenvatinib resistance.
METHODS
Reagents
Lenvatinib was purchased from LC Laboratories. MK‐2206 and 17‐AAG were purchased from Selleck Chemicals. Ganetespib was purchased from MedChemExpress.
In vitro studies
Hep3B, PLC/PRF/5, SNU387, SNU423, SNU449, SNU475, and 293T cells were purchased from ATCC. Huh7 cells were purchased from JCRB Cell Bank. All cells were cultured as described previously.[ 12 , 13 , 14 , 15 ] All cells have been verified to be free of mycoplasma by polymerase chain reaction (PCR) testing.
To determine the drug sensitivity of HCC cells to lenvatinib treatment, Hep3B, Huh7, PLC/PRF/5, SNU387, SNU423, SNU449, and SNU475 cells were treated with different doses of lenvatinib (0–10 µM) for 72 hours. The cell viability was assessed using Cell Counting Kit‐8 (Dojindo Laboratories) based on the manufacturer’s protocol.
For knockdown experiments, Hep3B, Huh7, SNU449, and SNU423 cells were infected with lentiviral pLKO.1 particles, which contained ITGB8 or scrambled short hairpin RNA (shRNA) and selected with 2 μg/mL puromycin for 7 days. Lentiviral pLKO.1 plasmids for shITGB8 (Table S1) or scrambled shRNA (SHC002; Sigma‐Aldrich) were packaged with pCMV‐dr8.2 (Addgene) and pCMV‐VSVG (Addgene) in 293T cells to produce lentiviral particles as previously described.[ 15 ]
For ITGB8 overexpression, the expression plasmid pLenti6.3/V5‐DEST‐ITGB8, and the control plasmid pLenti6.3/V5‐DEST‐GFP were purchased from Addgene, and were packaged with pCMV‐dR8.2 dvpr and pCMV‐VSVG in 293T cells to produce lentiviral particles. After infection with the lentiviral particles, Hep3B and Huh7 cells expressing ITGB were selected with 2 μg/ml blasticidin. The viability of these cells was then analyzed using sulforhodamine B (SRB) assay as previously described.[ 12 , 16 ]
For AKT inhibitor experiments, HCC cells were seeded in 24‐well plates. After 24 hours, cells were treated with MK‐2206 and/or lenvatinib. Cell viability was analyzed using SRB assay after 72 hours. For HSP90 inhibitor experiments, HCC cells were seeded in 24‐well plates. After 24 hours, cells were treated with 17‐AAG, ganetespib, and/or lenvatinib, and cell viability was assessed by crystal violet staining assay[ 17 ] after 72 hours.
In vivo studies
All animals received humane care according to the “Guide for the Care and Use of Laboratory Animals.” The procedures for all animal experiments detailed subsequently were approved by the Institutional Animal Care and Use Committee of Loyola University Chicago. All mice were housed in micro‐isolator cages in a room illuminated from 7:00 a.m. to 7:00 p.m. (12:12‐hours light‐dark cycle) and were given access to water and chow ad libitum.
For the xenograft model, Huh7 cells, Huh7_LR cells, Ctrl‐shRNA Huh7_LR cells, or ITGB8‐shRNA Huh7_LR cells (5 × 10⁶ in 100 μl serum‐free medium) were subcutaneously injected into the right or left flank of the 8–12‐week‐old SCID‐bg mice. Once tumors reached approximately 100 mm3, mice were given vehicle or lenvatinib (10 mg/kg) by oral gavage daily for 21 days. For the combination therapy experiments, 5 × 10⁶ Huh7_LR cells were subcutaneously injected into the right flank of the 8–12‐week‐old NSG‐A2 mice. Once tumors reached approximately 100 mm3, the mice were given vehicle, lenvatinib (10 mg/kg), 17‐AAG (10 mg/kg), MK‐2206 (120 mg/kg), lenvatinib (10 mg/kg) + 17‐AAG (10 mg/kg), or lenvatinib (10 mg/kg) + MK‐2206 (120 mg/kg) by oral gavage every other day for 2 weeks. Tumor volumes were measured every 3 days using a caliper until the day of euthanasia, when tumors were harvested for further analysis. Tumor volume was calculated using the following formula: volume (mm3) = L × W2 × 0.5.
Cell cycle and apoptosis analysis
Cell cycle progression was evaluated using propidium iodide staining. Cell apoptosis was examined using an Annexin V‐FITC/PI apoptosis kit (#88‐8005‐72; eBioscience) based on the manufacturer’s protocol. Data analyses were performed with the BD FACSCalibur flow cytometry system.
Western blotting
Western blotting was performed as previously described.[ 13 ] Information on primary antibodies is given in Table S2.
Quantitative real‐time PCR
Cellular or tissue messenger RNA (mRNA) was extracted using Zymo mini‐columns, and quantitative real‐time PCR was performed as previously described.[ 13 ] Primers used for quantitative real‐time PCR are listed in Table S3.
RNA‐seq and analysis
The mRNA was extracted using RNeasy Plus Micro Kit (Qiagen). RNA‐seq was performed by Novogene Corporation. The data sets and code used in this study are available at GEO (GSE186191). Gene‐set enrichment analysis (GSEA) was performed using the GSEA 3.0 software as described previously.[ 13 ]
Proteome Profiler Human Phospho‐Kinase array
Relative phosphorylation levels of 37 kinase phosphorylation sites and two related total proteins were detected with the Proteome Profiler Human Phospho‐Kinase Array Kit (R&D Systems). Images were acquired with an iBright CL1000 Imager. Dot intensity was quantified with ImageJ.
Immunoprecipitation
Cell lysates were subjected to immunoprecipitation using the Invitrogen Dynabeads Protein G Immunoprecipitation Kit (Catalog number: 10007D). Immunoprecipitated samples were subjected to sodium dodecyl sulfate–polyacrylamide gel electrophoresis followed by western blotting. Information on primary antibodies is provided in Table S2.
Immunofluorescence
Immunofluorescence of ITGB8, HSP90, and AKT was performed as previously described.[ 12 ] Information on primary antibodies is given in Table S2.
Tissue microarray and immunohistochemistry
HCC tissue microarray (TMA; LV1502) was purchased from US Biomax. LV1512 contains 62 cases of HCC (TNM stage I–III). Immunohistochemistry staining of ITGB8, HSP90, and AKT and scoring were performed as previously described.[ 12 ] Information on primary antibodies is found in Table S2.
Statistical analysis
Statistical analyses were performed using GraphPad Prism software. Experimental data were presented as means ± SD. Statistical significance was calculated using the two‐tailed Student’s t test, two‐way analysis of variance test, or Mann‐Whitney U test wherever appropriate. The chi‐square test was used to determine the significance of correlations in TMA. A p value < 0.05 was considered significant.
RESULTS
Establishment and verification of LR HCC cells
To investigate the molecular mechanisms of acquired resistance to lenvatinib, we sought to establish HCC cell lines by chronic exposure to lenvatinib at progressively increasing doses for an extended period of time, as described.[ 18 ] Briefly, the drug sensitivity of seven HCC cells to lenvatinib treatment was initially determined (Figure 1A). Hep3B and Huh7 cells were chosen as lenvatinib‐sensitive cells and were treated with lenvatinib. The concentration of lenvatinib was gradually increased weekly up to 10 µM. After 6 months of treatment, two lenvatinib‐resistant cell lines (with mixed cell populations, not from a single clone) were obtained (Figure 1B), termed Hep3B_LR and Huh7_LR. The successful development of LR cells was evidenced by the persistent cell viability under lenvatinib treatment (Figure 1C,D). These results were further verified using crystal violet staining (Figure 1E,F). Consistently, flow cytometry analysis indicated that lenvatinib treatment induced cell cycle arrest at the G2/M phase and promoted apoptosis in Hep3B parental cells, but not in LR cells (Figures S1 and S2). Moreover, LR cells retain their resistant phenotype following drug withdrawal for 12 weeks (data not shown). Furthermore, lenvatinib resistance of LR cells was further confirmed in vivo, as demonstrated by xenograft modeling (Figure 1G,H). A recent study showed that epidermal growth factor receptor (EGFR) activation contributes to lenvatinib resistance in HCC.[ 19 ] Consistently, we found EFGR activation to be enhanced in our generated LR cell lines (Figure S3A,B). Treatment with the EGFR inhibitor erlotinib resensitized LR cells to lenvatinib (Figure S3C–F). Overall, our data indicated that two LR HCC cell lines were successfully established.
FIGURE 1.
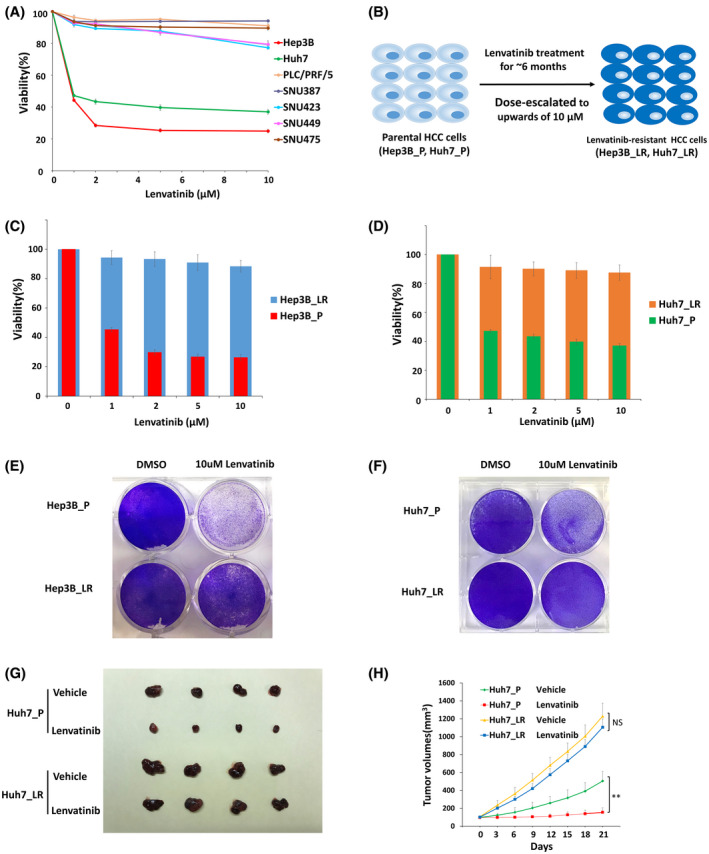
Establishment and verification of lenvatinib‐resistant (LR) hepatocellular carcinoma (HCC) cells. (A) The effect of lenvatinib on cell viability of seven HCC cell lines was assessed after 72 hours of treatment using CCK‐8 assay. (B) A schematic model for generating LR cells. (C) Cell viability was evaluated in parental and resistant Hep3B cells by CCK‐8 assay. (D) Cell viability was evaluated in parental and resistant Huh7 cells by CCK‐8 assay. (E) Cell viability was evaluated in parental and resistant Hep3B cells by crystal violet staining. (F) Cell viability was evaluated in parental and resistant Huh7 cells by crystal violet staining. (G) Representative picture of tumors extracted from SCID‐bg mice 21 days after vehicle or lenvatinib (10 mg/kg) treatment. n = 4 mice in each group. (H) Primary tumor size was recorded every 3 days. Values are presented as mean ± SD; **p < 0.01
ITGB8 expression is elevated in LR cells
To identify crucial factors contributing to lenvatinib resistance in HCC cells, we performed RNA‐seq to comprehensively examine the transcriptomic changes of Hep3B_LR and Huh7‐LR cells compared with their parental counterparts (Figure 2A,B). A total of 827 up‐regulated and 1051 down‐regulated differentially expressed genes were identified in Hep3B_LR and Huh7_LR cells compared with their parental counterparts (Figure 2C,D, Figures S4 and S5, and Tables S4 and S5). Heatmap analysis indicated that ITGB8 was the most significantly up‐regulated gene in both LR cell lines (Figure 2C,D). The increased expression of ITGB8 was further validated using quantitative real‐time PCR (Figure 2E) and western blot analysis (Figure 2F). ITGB8 plays a crucial role in cancer development and drug resistance in both bladder and ovarian cancers.[ 20 , 21 ] Although the role of ITGB8 in HCC remains unclear, our results suggested that ITGB8 may be a critical contributor to the development of lenvatinib resistance in HCC cells.
FIGURE 2.
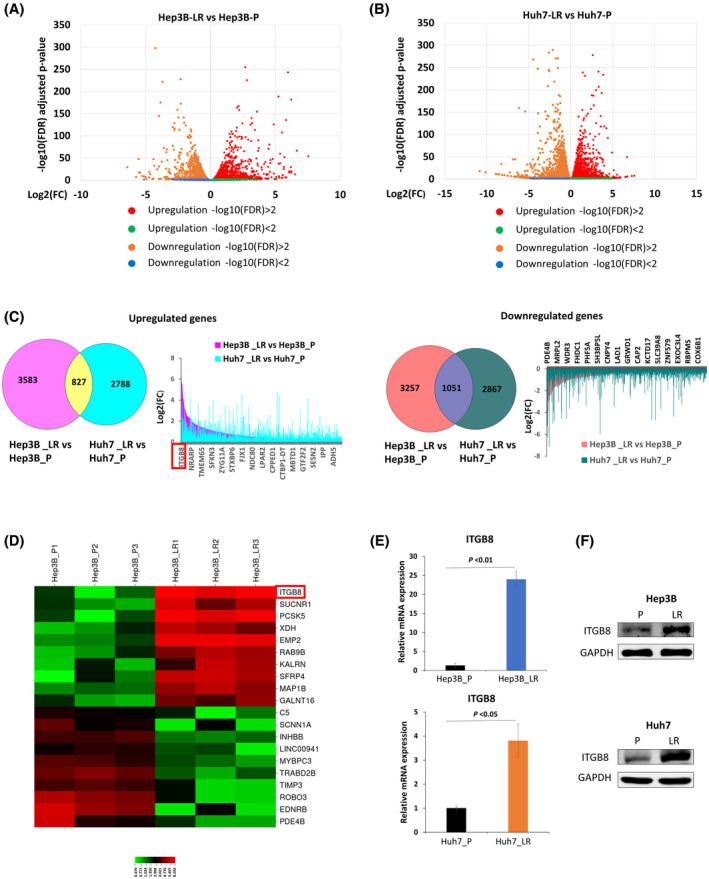
Expression of integrin subunit beta 8 (ITGB8) is elevated in LR cells. (A) Volcano plot of differentially expressed genes (Hep3B_LR vs. Hep3B_P). (B) Volcano plot of differentially expressed genes (Huh7_LR vs. Huh7_P). (C) Differentially expressed genes (DEGs) were identified both in Hep3B_LR and Huh7_LR cells compared with their parental counterparts. (D) Heatmap of top 20 DEGs in comparison to Hep3B_LR and Hep3B_P cells. (E) Real‐time polymerase chain reaction (PCR) analysis validated the up‐regulation of ITGB8 messenger RNA (mRNA) level in LR cells. Transcript levels were normalized to β‐actin. (F) Western blot validated the up‐regulation of ITGB8 protein in LR cells. Glyceraldehyde 3‐phosphate dehydrogenase (GAPDH) was used as a loading control. FDR, false discovery rate. ADH5, alcohol dehydrogenase 5; CAP2, cyclase associated actin cytoskeleton regulatory protein 2; CNPY4, canopy FGF signaling regulator 4; COX6B1, cytochrome C oxidase subunit 6B1; CPPED1, calcineurin like phosphoesterase domain containing 1; CTBP1‐DT, CTBP1 divergent transcript; C5, complement C5; EDNRB, endothelin receptor type B; EMP2, epithelial membrane protein 2; EXOC3L4, exocyst complex component 3 like 4; FHDC1, FH2 domain containing 1; FJX1, four‐jointed box kinase 1; GALNT16, polypeptide N‐acetylgalactosaminyltransferase 16; GRWD1, glutamate rich WD repeat containing 1; GTF2F2, general transcription factor IIF subunit 2; INHBB, inhibin subunit beta B; IPP, intracisternal A particle‐promoted polypeptide; ITGB8, integrin subunit beta 8; KALRN, kalirin RhoGEF kinase; KCTD17, potassium channel tetramerization domain containing 17; LAD1, ladinin 1; LINC00941, long intergenic non‐protein coding RNA 941; LPAR2, lysophosphatidic acid receptor 2; MAP1B, microtubule associated protein 1B; MBTD1, Mbt domain containing 1; MRPL2, mitochondrial ribosomal protein L2; MYBPC3, myosin binding protein C3; NDC80, NDC80 kinetochore complex component; NRARP, NOTCH regulated ankyrin repeat protein; PCSK5, proprotein convertase subtilisin/kexin type 5; PDE4B, phosphodiesterase 4B; PHF5A, PHD finger protein 5A; RAB9B, ras‐related protein rab‐9B; RBBP5, RB binding protein 5; ROBO3, roundabout guidance receptor 3; SCNN1A, sodium channel epithelial 1 subunit alpha; SESN2, sestrin 2; SFRP4, secreted frizzled related protein 4; SFXN3, sideroflexin 3; SH3BP5L, SH3 binding domain protein 5 like; SLC39A8, solute carrier family 39 member 8; STXBP6, syntaxin binding protein 6; SUCNR1, succinate receptor 1; TIMP3, TIMP metallopeptidase inhibitor 3; TMEM65, transmembrane protein 65; TRABD2B, TraB domain containing 2B; XDH, xanthine dehydrogenase; ZNF579, zinc finger protein 579; ZYG11A, Zyg‐11 family member A, cell cycle regulator
Targeting ITGB8 overcomes lenvatinib resistance in vitro and in vivo
To test whether ITGB8 up‐regulation contributes to lenvatinib resistance in LR cells, we used shRNA strategies to knock down the expression of ITGB8. Five ITGB8‐targeting shRNAs and a nontargeting control (Ctrl shRNA) were used to transiently transfect into Hep3B LR cells. ITGB8‐shRNA1 and ITGB8‐shRNA3 efficiently knocked down both ITGB8 protein (Figure 3A) and mRNA expression (Figure 3B). Using lentiviral transduction, we subsequently generated two stable ITGB8 knockdown LR cell lines. Western blotting further confirmed that ITGB8‐shRNA1 and ITGB8‐shRNA3 were able to effectively knock down ITGB8 both in Hep3B_LR cells and Huh7_LR cells (Figure 3C).
FIGURE 3.
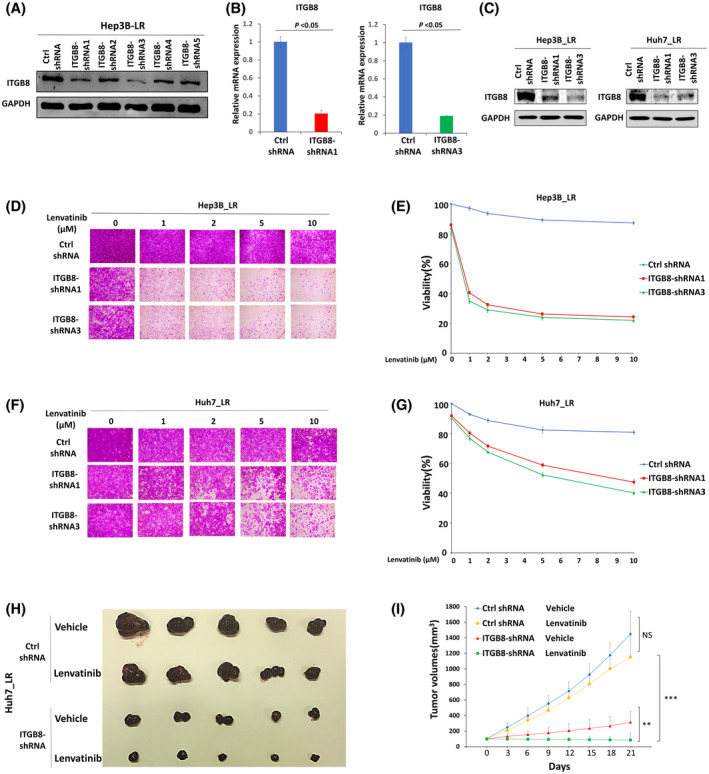
Targeting ITGB8 overcomes lenvatinib resistance in vitro and in vivo. (A) Western blot analysis of ITGB8 knockdown efficiency of five ITGB8‐targeting short hairpin RNAs (shRNAs) following transient transfection of Hep3B_LR cells. GAPDH was used as a loading control. (B) Real‐time PCR analysis of ITGB8‐shRNA1 and ITGB8‐shRNA3 LR cells. Transcript levels were normalized to β‐actin expression. (C) Western blot analysis of ITGB8 knockdown efficiency in LR cells after lentiviral transduction of two independent ITGB8 shRNAs 7 days after puromycin selection. GAPDH was used as a loading control. (D, E) Sulforhodamine B (SRB) assay of cell viability of nontargeting control (Ctrl shRNA) and ITGB8 shRNA stable knockdown Hep3B_LR cells: representative pictures (D) and Qualification (E). (F,G) SRB assay of cell viability of Ctrl shRNA and ITGB shRNA stable knockdown Huh7_LR cells using the SRB assay: representative pictures (F) and qualification (G). (H) Representative pictures of tumors extracted from SCID‐bg mice 21 days after vehicle or lenvatinib (10 mg/kg) treatment. n = 5 mice in each group. (I) Primary tumor size was measured every 3 days. Values are presented as mean ± SD; **p < 0.01, ***p < 0.001
Furthermore, SRB assays demonstrated that shRNA‐mediated knockdown of ITGB8 sensitized both LR cells to lenvatinib treatment (Figure 3D–G). Flow cytometry analysis indicated that knockdown of ITGB8 led to cell cycle arrest at the G2/M phase and significantly promoted apoptosis in Hep3B_LR cells treated with lenvatinib (Figures S6 and S7). Notably, knockdown of ITGB8 only slightly decreased LR cell growth without lenvatinib treatment (Figure 3D,F). Next, we sought to confirm this observation using a mouse xenograft model. Remarkably, while tumors raised from Ctrl shRNA cells grew steadily, lenvatinib treatment completely retarded tumor growth of ITGB8 knockdown cells in mice (Figure 3H,I). These results demonstrate that functional inhibition of ITGB8 sensitizes LR HCC cells to lenvatinib treatment.
ITGB8 overexpression increases lenvatinib resistance in parental lenvatinib‐sensitive HCC cells
Given that genetic targeting of ITGB8 overcomes lenvatinib resistance, we speculated that ectopic expression of ITGB8 in lenvatinib‐sensitive cells would increase resistance to lenvatinib treatment. The basal expression levels of ITGB8 in lenvatinib‐sensitive Hep3B and Huh7 cells were low (Figure 4A). We further generated Hep3B and Huh7 cell lines that stably overexpressed either green fluorescent protein (control) or ITGB8 (Figure 4B). As expected, ectopic expression of ITGB8 in both cell lines promoted lenvatinib resistance, further indicating ITGB8 as a crucial mediator of lenvatinib resistance (Figure 4C–F).
FIGURE 4.
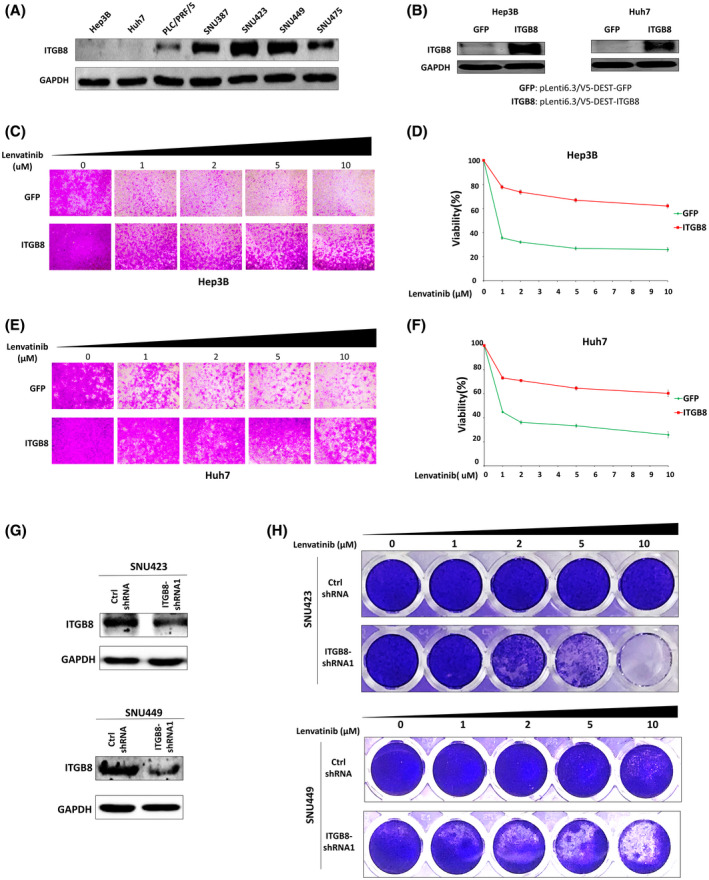
ITGB8 is overexpressed in HCC cells with intrinsic lenvatinib resistance, which is reversed by ITGB8 knockdown. (A) Western blot analysis of ITGB8 basal expression in seven HCC cell lines. GAPDH was used as a loading control. (B) Western blot analysis of ITGB8 expression in Hep3B and Huh7 cells with transduction of pLenti6.3/V5‐DEST–green fluorescent protein (GFP) or pLenti6.3/V5‐DEST‐ITGB8 lentiviral particles. (C, D) Cell viability was evaluated in Hep3B cells with stable overexpression of GFP (control) or ITGB8 using the SRB assay: representative pictures (C) and quantification (D). (E, F) Cell viability was evaluated in Huh7 cells with stable overexpression of GFP or ITGB8 using the SRB assay: representative pictures (E) and quantification (F). (G) Expression of ITGB8 was examined by western blot in control or ITGB8 stably knockdown SNU423 and SNU449 cells. (H) Cell viability was evaluated in control or ITGB8 stably knockdown SNU423 and SNU449 cells by crystal violet staining
ITGB8 knockdown overcomes endogenous lenvatinib resistance in LR HCC cells
We further examined whether high expression of ITGB8 contributes to intrinsic resistance to lenvatinib treatment in LR HCC cells. With the exception of PLC/PRF/5 cells, most of the LR HCC cell lines that we tested (Figure 1A) had a high expression of ITGB8 (Figure 4A). We then used shRNAs to knock down ITGB8 in SNU423 and SNU449 cells, which expressed the highest level of ITGB8 (Figure 4G). Strikingly, knockdown of ITGB8 sensitized both cell lines to lenvatinib treatment (Figure 4H). Overall, these data suggest that high expression of ITGB8 contributes to intrinsic lenvatinib resistance in HCC cells.
ITGB8‐mediated resistance to lenvatinib is through the activation of the AKT signaling pathway
Integrins often function through the regulation of phosphokinases.[ 22 ] To understand how ITGB8 promotes lenvatinib resistance in HCC cells, we performed the Proteome Profiler Human Phospho‐Kinase Array, which detects phosphorylation of 37 human kinases in Hep3B_LR cells with or without stable ITGB8 knockdown (Figure 5A). Intriguingly, phosphorylation of AKT and p53 was most significantly altered in ITGB8 KD Hep3B_LR cells compared with control scrambled cells (Figure 5A). However, only the decreased phosphorylation of AKT (Figure 5B), but not p53 (Figure S8), was observed in Huh7_LR cells. Thus, we focused on a possible role of AKT in ITGB8‐mediated lenvatinib resistance. Previous reports showed a close regulatory link between ITGB8 and AKT signaling.[ 23 ] Therefore, we hypothesized that ITGB8 overexpression in HCC cells promoted resistance to lenvatinib by modulating the AKT signaling. In support of this hypothesis, we found that both Hep3B_LR and Huh7_LR HCC cells showed significant up‐regulation of AKT signaling compared with parental cells (Figure 5B), indicated by the higher levels of p‐AKT (Ser473 and Thr308) and AKT. In addition, the expression levels of p‐AKT (Ser473 and Thr308) and AKT were also increased in ITGB8‐overexpressed Hep3B and Huh7 cells (Figure 5C). MK‐2206, a highly selective non–adenosine triphosphate (ATP) competitive allosteric inhibitor of AKT, showed effective inhibition of AKT activity in LR and parental HCC cells (Figure 5D,E and Figure S9A). MK‐2206 treatment alone did not effectively suppress HCC cell growth either in parental or LR cells (Figure 5F–I and Figure S9B,C), suggesting AKT inhibition alone is not sufficient to kill HCC cells. However, MK‐2206 significantly sensitized the LR and parental HCC cells to lenvatinib treatment (Figure 5F–I and Figure S9B,C). Overall, these results indicate that up‐regulation of ITGB8 contributes to lenvatinib resistance through the activation of the AKT signaling pathway, and the AKT inhibitor MK‐2206 could be an effective adjuvant for overcoming lenvatinib resistance in HCC.
FIGURE 5.
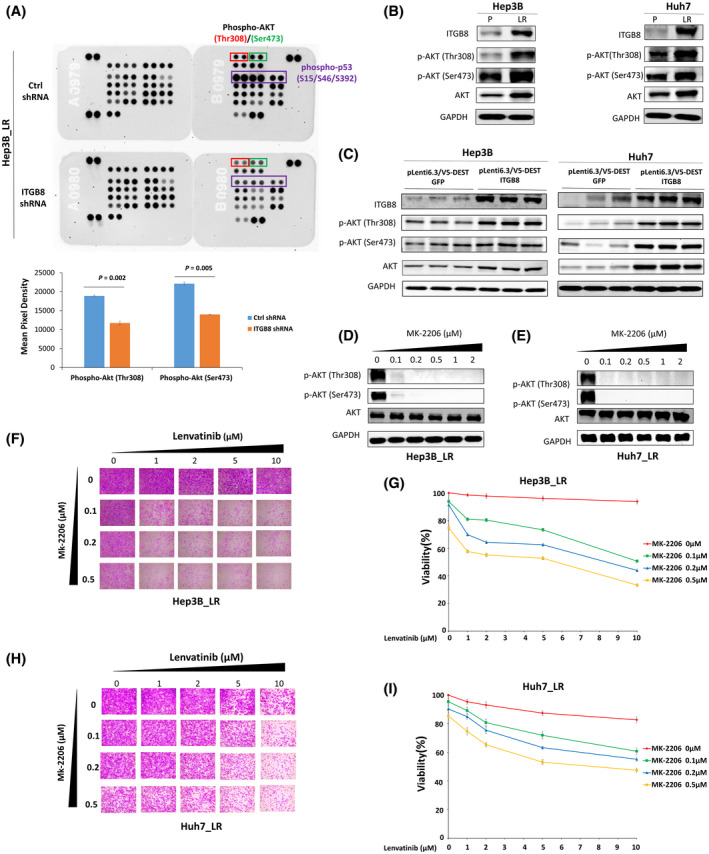
ITGB8 overexpression promotes lenvatinib resistance in HCC cells through the activation of the AKT signaling pathway. (A) Phospho‐kinase antibody array blots using whole cell lysates of Ctrl shRNA and ITGB8 shRNA stably knockdown Hep3B_LR cells. Phospho‐AKT(Thr308), phospho‐AKT(Ser473), and phospho‐p53(S15/S46/S392) are marked in rectangles. (B) Western blot analysis of parental and LR cells for ITGB8, AKT, p‐AKT (Thr308), p‐AKT (Ser473), and GAPDH. (C) Western blot analysis of GFP control and ITGB‐overexpressing cells for ITGB8, AKT, p‐AKT (Thr308), p‐AKT (Ser473), and GAPDH. (D) Western blot analysis of Hep3B_LR cells treated MK‐2206 for AKT, p‐AKT (Thr308), p‐AKT (Ser473), and GAPDH. (E) Western blot analysis of Huh7_LR cells treated MK‐2206 for AKT, p‐AKT (Thr308), p‐AKT (Ser473), and GAPDH. (F, G) Cell viability was evaluated and qualified in Hep3B_LR cells co‐treated with MK‐2206 and lenvatinib by SRB assay. (H, I) Cell viability was evaluated and qualified in Huh7_LR cells co‐treated with MK‐2206 and lenvatinib by SRB assay
ITGB8 up‐regulation increases AKT expression and signaling through increased expression of HSP90 in LR cells
We further explored how ITGB8 modulates the AKT signaling pathway in LR cells. We found that the levels of both AKT and p‐AKT were reduced by ITGB8 knockdown in Hep3B_LR and Huh7_LR cells (Figure 6A). This finding was further validated in xenograft tumors (Figure 6B). Analysis of AKT mRNA expression in ITGB8 knockdown LR cells did not reveal significant changes to any of the three AKT isoforms (Figure S10A–F), suggesting that ITGB8 does not regulate AKT in a transcriptional manner, but potentially at the level of protein expression. Previous reports have indicated that ubiquitination is an essential mechanism in regulating AKT protein levels.[ 24 ] Notably, knockdown of ITGB8 destabilized AKT in LR cells (Figure S11) and increased the ubiquitination of AKT (Figure 6C). HSP90 is known to play an essential role in inhibiting AKT ubiquitination and promoting AKT stabilization.[ 25 , 26 ] Intriguingly, we found that HSP90 expression was significantly enhanced in both LR HCC cells compared with parental cells (Figure 6D), and was increased by the overexpression of ITGB8 in parental HCC cells (Figure 6E). Conversely, HSP90 expression was down‐regulated following ITGB8 knockdown LR HCC cells (Figure 6F,G). Interestingly, we did not observe any significant changes in HSP90 mRNA levels in LR cells compared with parental cells (data not shown), suggesting that this regulation occurs at the post‐transcriptional level. In contrast, we found that HSP90 protein levels were increased in LR cell lines in an ITGB8‐dependent manner, and these two proteins physically interacted (Figure S12), suggesting a translational or post‐translational regulation.
FIGURE 6.
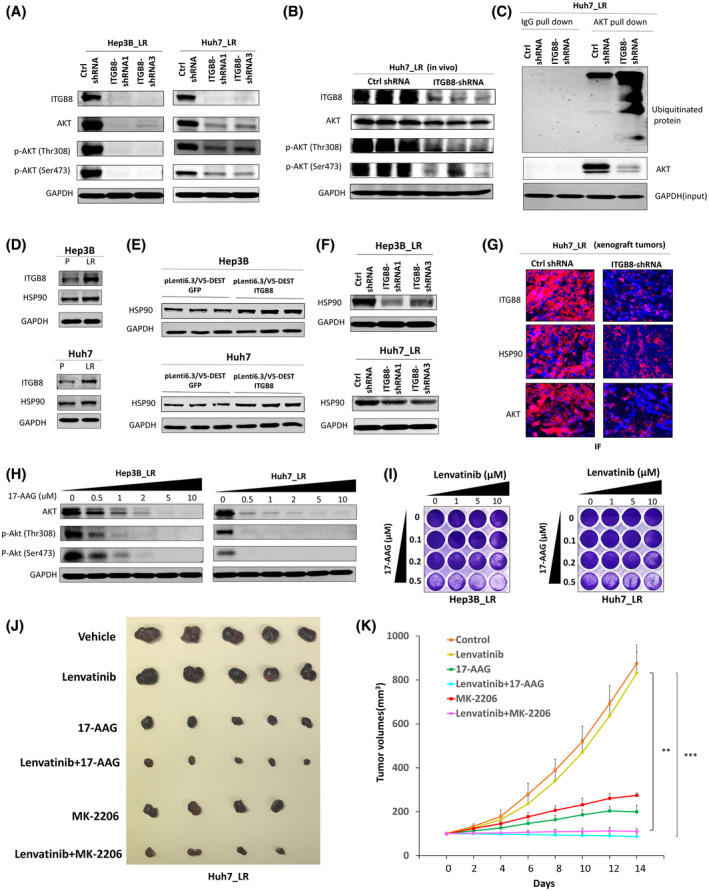
ITGB8 up‐regulation increases AKT expression and activation through increased expression of HSP90 in LR cells. (A) Western blot analysis of ITGB8 knockdown LR cells for ITGB8, AKT, p‐AKT (Thr308), p‐AKT (Ser473), and GAPDH. (B) Western blot analysis of tissue lysate from tumors (Figure 3H) for ITGB8, AKT, and p‐AKT (Thr308), and p‐AKT (Ser473). GAPDH as a loading control. (C) Immunoprecipitation AKT and western blot analysis of ubiquitin and AKT. GAPDH was used as an input control. (D) Western blot analysis of parental and LR cells for ITGB8, HSP90, and GAPDH. (E) Western blot analysis of GFP control and ITGB‐overexpression cells for ITGB8, HSP90, and GAPDH. (F) Western blot analysis of ITGB8 knockdown LR cells for HSP90 and GAPDH. (G) Immunofluorescence analysis of ITGB8, HSP90, and AKT in tissue from Huh7_LR xenograft tumors (Figure 3H). Nuclei were stained with 4´,6‐diamidino‐2‐phenylindole (blue). (H) Western blot analysis of AKT and p‐AKT (Thr308) and p‐AKT (Ser473) at the selected concentration of 17‐AAG in LR cells. GAPDH was used as a loading control. (I) Cell viability was evaluated in LR cells co‐treated with 17‐AAG and lenvatinib using crystal violet staining. (J) Representative pictures of tumors extracted from NSG‐A2 mice 14 days after single or combination treatment for 2 weeks. (K) Tumor measurements of xenograft mice treated with lenvatinib, MK‐2206, and 17‐AAG. Values are presented as mean ± SD; **p < 0.01, ***p < 0.001
Furthermore, HSP90‐selective inhibitors 17‐AAG or ganetespib significantly decreased the levels of AKT and p‐AKT in LR cells (Figure 6H and Figure S13A). Consistently, HSP90 inhibitors dramatically sensitized LR HCC cells to lenvatinib treatment (Figure 6I and Figure S13B). These data indicate that ITGB8 up‐regulation stabilizes AKT expression through the regulation of HSP90 in LR HCC cells. Remarkably, the combination treatment of either lenvatinib+17‐AAG or lenvatinib+MK‐2206 completely retarded tumor growth of LR cells in mice (Figure 6J,K). Therefore, combination therapy with an HSP90 inhibitor or AKT inhibitor may provide another therapeutic option for patients with HCC with acquired lenvatinib resistance.
ITGB8 expression may be up‐regulated through NF‐κB in LR HCC cells
How ITGB8 is up‐regulated in lenvatinib‐resistant cells remains unknown. Previous reports revealed that transcription factors such as E2F transcription factor 1 transcriptionally up‐regulates ITGA1 expression in HCC.[ 27 ] In line with this, we analyzed the promoter of human ITGB8 using an online transcription factor binding sites prediction tool Consite. We found that many putative transcriptional factors, including E2F and nuclear factor‐κB (NF‐κB), are located in the human ITGB8 promoter (Figure S14). Consistent with these findings, GSEA analysis of RNA‐seq data revealed that the NF‐κB signaling pathway was significantly enriched in both LR cell lines (Figure S15). Moreover, increased phosphorylation and the nuclear‐cytoplasmic ratio of p65 were found in LR cells compared with parental cells (Figure S16), suggesting enhanced p65 activation in LR cells. Overall, these data suggest that the up‐regulated ITGB8 expression may be regulated through transcriptional factors such as NF‐κB in LR HCC cells.
ITGB8, HSP90, and AKT expression arepositively correlated in HCC specimens, and positively associated with prognosis of HCC
Because of the risk of bleeding and tumor seeding, liver biopsy is not a standard procedure for patients with advanced HCC after targeted therapies in the USA. Therefore, LR HCC patient specimens are not available for research on drug resistance. However, although we are not able to demonstrate that ITGB8 is up‐regulated in patients with HCC who have received lenvatinib treatment herein due to unavailability of clinical samples, we were able to assess ITGB8, HSP90, and AKT expression in primary HCC specimens using TMAs of initial biopsies. We found that ITGB8, HSP90, and AKT are all positively correlated (Figure 7). In addition, ITGB8, HSP90, and AKT were positively associated with the prognosis of patients with HCC from The Cancer Genome Atlas database (Figure S17).
FIGURE 7.
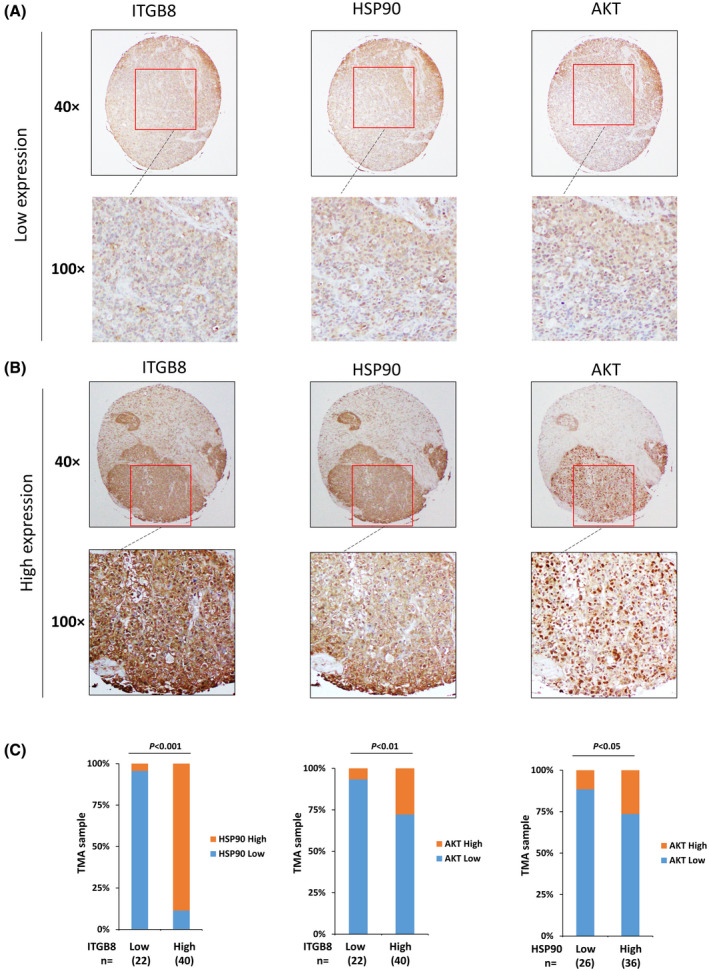
ITGB8, HSP90, and AKT expression are positively correlated in HCC specimens. (A) Representative immunohistochemistry (IHC) images of low expression of ITGB8, AKT, and HSP90. (B) Representative IHC images of high expression of ITGB8, AKT, and HSP90. (C) Correlation analysis of all HCC tissue microarray tissues between ITGB8 and HSP90, ITGB8 and AKT, and HSP90 and AKT
DISCUSSION
Lenvatinib was approved as a first‐line treatment for advanced HCC due to noninferior overall survival and improved progression‐free survival compared with sorafenib.[ 8 ] However, many patients with HCC either do not respond or later acquire resistance to lenvatinib,[ 28 ] which reduces its effectiveness. Consequently, establishing an understanding of the molecular mechanisms underlying lenvatinib resistance is essential to the development of effective treatment strategies for patients with HCC who either acquire resistance or exhibit intrinsic resistance lenvatinib therapy.
To study the poorly characterized molecular mechanisms of lenvatinib resistance, we generated two LR HCC cell lines by using progressively escalating doses of lenvatinib, which mimicked the progression of acquired resistance. Therefore, these resistant cell models are more suitable for studying the acquired resistance mechanisms, which remain poorly understood. A recent study showed that EGFR activation limits the response of liver cancer to lenvatinib, and the combination of the EGFR inhibitor gefitinib and lenvatinib displays potent anti‐proliferative effects both in in vitro and in vivo HCC models.[ 19 ] Significantly, 12 patients with advanced HCC who were previously unresponsive to lenvatinib had meaningful clinical responses when treated with the combination of lenvatinib plus gefitinib.[ 19 ] However, this study did not show whether EGFR activation also contributes to the acquired resistance to lenvatinib treatment in HCC. To address this question, we examined the activation status of EGFR in our generated LR cell lines, and we found EFGR activation was enhanced (Figure S3). Consistent with these clinical findings, treatment with the EGFR inhibitor erlotinib resensitized LR cells to lenvatinib (Figure S3). These data suggest that EGFR hyperactivation also contributes to acquired resistance to lenvatinib in HCC. Thus, EGFR inhibitors could also be useful to treat the patients who initially respond to lenvatinib but later acquire resistance. In addition, these data indicate that the LR cell lines we generated could be an excellent preclinical tool to study the other potential mechanisms of acquired lenvatinib resistance and test the efficacy of different therapeutic strategies to overcome lenvatinib resistance.
Using these LR cells, we revealed that elevated expression of ITGB8 contributes to lenvatinib resistance in HCC cells, which was supported by the results that genetic silencing of ITGB8 partially attenuates lenvatinib resistance in in vitro and in vivo models, and ectopic expression of ITGB8 promotes lenvatinib resistance to previously lenvatinib‐sensitive cells. This finding is exciting but not surprising. As critical players in numerous cancer hallmarks, integrins have been well recognized as valuable tumor therapeutic targets[ 29 , 30 , 31 , 32 ] because of their essential roles in cell adhesion, migration, proliferation, differentiation, and tumor progression.[ 22 , 33 , 34 ] Moreover, there is accumulated evidence that several integrins, including ITGB8, play essential roles in chemoresistance.[ 35 ] Of note, ITGB8 is up‐regulated in gefitinib‐resistant human hepatic cancer HepG2 cells, and silencing of ITGB8 reverses gefitinib resistance.[ 23 ] Also, miR‐199a‐3p enhances cisplatin sensitivity of ovarian cancer cells by targeting ITGB8.[ 21 ] Although the precise role of ITGB8 in liver cancer remains elusive, our data suggest that ITGB8 promotes HCC growth (Figure 3H,I). Importantly, functional inhibition of ITGB8 overcomes acquired lenvatinib resistance and sensitizes intrinsically resistant HCC cells to lenvatinib treatment, suggesting that targeting ITGB8 provides a means to address lenvatinib therapy. Because ITGB8 inhibitors are unavailable, developing selective inhibitors of ITGB8 is warranted in our future studies.
Mechanistically, we found that up‐regulation of ITGB8 promotes lenvatinib resistance through an AKT‐dependent signaling pathway. Interestingly, we found that ITGB8 regulates AKT expression at the protein level, specifically via a previously undescribed ITGB8‐dependent ubiquitination of AKT. The mechanisms dictating AKT stability are actively being investigated. Several reports have indicated that AKT protein can be degraded by the ubiquitin‐proteasome pathway, caspase‐mediated cleavage, and caspase‐dependent ubiquitination.[ 26 ] Among these, the regulation of AKT stability by HSP90 has been well‐characterized.[ 36 , 37 ] Briefly, active AKT has been shown to form a complex with HSP90 and Cdc37. Inhibition of the ATP‐binding pocket of HSP90 by small molecule inhibitors promotes the ubiquitination of AKT and its degradation, thus inhibiting AKT’s activity.[ 36 ] In conjunction with the data presented in our study, these findings support our current working model that in the context of acquired lenvatinib resistance, ITGB8 inhibition leads to repression of HSP90 and subsequent increased AKT ubiquitination and degradation (Figure 8).
FIGURE 8.
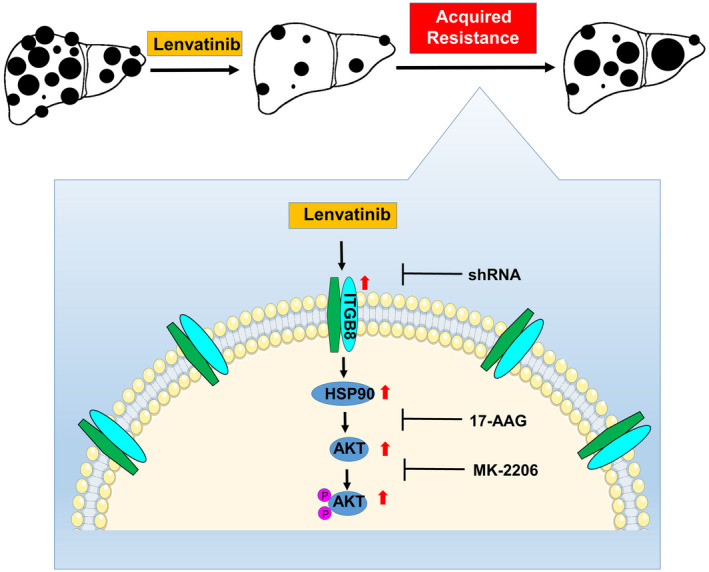
A schematic model for ITGB8‐mediated lenvatinib resistance in HCC. Lenvatinib treatment kills HCC cells and suppresses HCC development. However, HCC cells acquire resistance to lenvatinib treatment by increasing the expression of ITGB8. ITGB8 increases the expression of HSP90, which stabilizes AKT expression and enhances AKT activity, thus leading to lenvatinib resistance. In support of this model, functional inhibition of ITGB8 by shRNA, AKT inhibitor MK‐2206, or HSP90 inhibitor 17‐AAG resensitizes LR HCC cells to lenvatinib treatment. TMA, tissue microarray
Further supporting our model are the findings that pharmacologic inhibition of either AKT or HSP90 resensitize LR cells to lenvatinib, potentially providing clinicians with additional therapeutic options for patients who have become refractory to single‐agent lenvatinib treatment. With regard to AKT inhibition, MK‐2206 has been assessed in several clinical trials of various cancer types. Despite the drug being generally well‐tolerated, MK‐2206 exhibited limited clinical benefit.[ 38 , 39 , 40 ] Consistent with these trials, we found that MK‐2206 treatment alone had only a modest effect on the growth and survival of both parental and LR cells, but combination treatment of MK‐2206 and lenvatinib markedly suppressed HCC cell growth (Figure 5 and Figure S9). These promising data support the clinical investigation to assess the combined therapy of MK‐2206 and lenvatinib in patients with advanced HCC who have developed resistance to lenvatinib. Of note, several AKT inhibitors, including AZD5363, GSK2110183 and GSK2141795, are being investigated in clinical trials for treating different types of cancers, including HCC.[ 41 ] The HSP90 inhibitor 17‐AAG (tanespimycin) has been tested in over 50 phase 2 clinical trials for its efficacy in numerous cancer types, but not liver cancer.[ 42 ] Our data strongly support a clinical investigation of HSP90 inhibitors to combat lenvatinib resistance in HCC.
Many questions remain to be answered, including how ITGB8 regulates HSP90 expression. We found that levels of HSP90 protein, but not mRNA, were increased in LR cell lines in an ITGB8‐dependent manner, and these two proteins physically interacted (Figure S16), suggesting a translational or post‐translational regulation. Post‐translational modifications, including phosphorylation, acetylation, methylation, S‐nitrosylation, SUMOylation and ubiquitylation, are critical for regulating the level of HSP90.[ 43 , 44 ] For example, phosphorylation of HSP90 by Saccharomyces Wee1 tyrosine kinase in yeast leads to HSP90 polyubiquitination and subsequent degradation by cytoplasmic proteasomes.[ 45 ] In addition, overexpression of integrin receptors can activate many tyrosine kinases such as Src and FAK.[ 46 ] Thus, up‐regulated ITGB8 in LR HCC cells may alter the phosphorylation of HSP90, leading to its ubiquitination and subsequent degradation. Nevertheless, it will be intriguing to explore the underlying mechanisms by which ITGB8 regulates HSP90 in future studies.
In addition to the ITGB8/HSP90/AKT pathway highlighted in the current study, differential expression and Kyoto Encyclopedia of Genes and Genomes analyses also revealed changes in other genes such as succinate receptor 1 (SUCNR1), proprotein convertase subtilisin/kexin type 5 (PCSK5), xanthine dehydrogenase (XDH), and epithelial membrane protein 2 (EMP2) (Figure 2D), and oncogenic pathways such as mitogen‐activated protein kinase signaling, focal adhesion, and WNT signaling in LR cell lines when compared with their isogenic parental cells (Figure S18).The contributions of these genes and pathways in lenvatinib resistance in HCC warrant further exploration and will be the subject of investigation in our future studies.
In conclusion, our results establish a crucial role of ITGB8 in lenvatinib resistance, and suggest that targeting the ITGB8/HSP90/AKT axis is a promising therapeutic strategy in patients with HCC exhibiting lenvatinib resistance. The clinical significance of the ITGB8/HSP90/AKT axis in patients with HCC, especially those with lenvatinib resistance, should be highlighted.
CONFLICTS OF INTEREST
Nothing to report.
Supporting information
Fig S1
Fig S2
Fig S3
Fig S4
Fig S5
Fig S6
Fig S7
Fig S8
Fig S9
Fig S10
Fig S11
Fig S12
Fig S13
Fig S14
Fig S15
Fig S16
Fig S17
Fig S18
Table S1‐S5
Supplementary Material
ACKNOWLEDGMENT
We thank Dr. Nancy Zeleznik‐Le and Dr. Mitch Denning for their helpful advice on this project. The project described was supported by NIH R01CA197128 (W. Qiu) from the National Cancer Institute and RSG‐18‐107 (W. Qiu) from the American Cancer Society. The content is solely the authors' responsibility and does not necessarily represent the official views of the National Institutes of Health or the American Cancer Society.
Hou W, Bridgeman B, Malnassy G, Ding X, Cotler SJ, Dhanarajan A, et al. Integrin subunit beta 8 contributes to lenvatinib resistance in HCC. Hepatol Commun. 2022;6:1786–1802. 10.1002/hep4.1928
Funding information
American Cancer Society (RSG‐18‐107) and National Institutes of Health (R01CA197128)
REFERENCES
- 1. Villanueva A. Hepatocellular carcinoma. N Engl J Med. 2019;380:1450–62. [DOI] [PubMed] [Google Scholar]
- 2. Koulouris A, Tsagkaris C, Spyrou V, Pappa E, Troullinou A, Nikolaou M. Hepatocellular carcinoma: an overview of the changing landscape of treatment options. J Hepatocell Carcinoma. 2021;8:387–401. [DOI] [PMC free article] [PubMed] [Google Scholar]
- 3. Llovet JM, Ricci S, Mazzaferro V, Hilgard P, Gane E, Blanc J‐F, et al. Sorafenib in advanced hepatocellular carcinoma. N Engl J Med. 2008;359:378–90. [DOI] [PubMed] [Google Scholar]
- 4. Rehman O, Jaferi U, Padda I, Khehra N, Atwal H, Mossabeh D, et al. Overview of lenvatinib as a targeted therapy for advanced hepatocellular carcinoma. Clin Exp Hepatol. 2021;7:249–57. [DOI] [PMC free article] [PubMed] [Google Scholar]
- 5. Matsui J, Yamamoto Y, Funahashi Y, Tsuruoka A, Watanabe T, Wakabayashi T, et al. E7080, a novel inhibitor that targets multiple kinases, has potent antitumor activities against stem cell factor producing human small cell lung cancer H146, based on angiogenesis inhibition. Int J Cancer. 2008;122:664–71. [DOI] [PubMed] [Google Scholar]
- 6. Matsui J, Funahashi Y, Uenaka T, Watanabe T, Tsuruoka A, Asada M. Multi‐kinase inhibitor E7080 suppresses lymph node and lung metastases of human mammary breast tumor MDA‐MB‐231 via inhibition of vascular endothelial growth factor‐receptor (VEGF‐R) 2 and VEGF‐R3 kinase. Clin Cancer Res. 2008;14:5459–65. [DOI] [PubMed] [Google Scholar]
- 7. Okamoto K, Kodama K, Takase K, Sugi NH, Yamamoto Y, Iwata M, et al. Antitumor activities of the targeted multi‐tyrosine kinase inhibitor lenvatinib (E7080) against RET gene fusion‐driven tumor models. Cancer Lett. 2013;340:97–103. [DOI] [PubMed] [Google Scholar]
- 8. Kudo M, Finn RS, Qin S, Han K‐H, Ikeda K, Piscaglia F, et al. Lenvatinib versus sorafenib in first‐line treatment of patients with unresectable hepatocellular carcinoma: a randomised phase 3 non‐inferiority trial. Lancet. 2018;391:1163–73. [DOI] [PubMed] [Google Scholar]
- 9. Wei L, Lee D, Law C‐T, Zhang MS, Shen J, Chin D‐C, et al. Genome‐wide CRISPR/Cas9 library screening identified PHGDH as a critical driver for Sorafenib resistance in HCC. Nat Commun. 2019;10:4681. [DOI] [PMC free article] [PubMed] [Google Scholar]
- 10. Zheng A, Chevalier N, Calderoni M, Dubuis G, Dormond O, Ziros PG, et al. CRISPR/Cas9 genome‐wide screening identifies KEAP1 as a sorafenib, lenvatinib, and regorafenib sensitivity gene in hepatocellular carcinoma. Oncotarget. 2019;10:7058–70. [DOI] [PMC free article] [PubMed] [Google Scholar]
- 11. Fu R, Jiang S, Li J, Chen H, Zhang X. Activation of the HGF/c‐MET axis promotes lenvatinib resistance in hepatocellular carcinoma cells with high c‐MET expression. Med Oncol. 2020;37:24. [DOI] [PubMed] [Google Scholar]
- 12. Wang F, Hou W, Chitsike L, Xu Y, Bettler C, Perera A, et al. ABL1, overexpressed in hepatocellular carcinomas, regulates expression of NOTCH1 and promotes development of liver tumors in mice. Gastroenterology. 2020;159:289–305.e216. [DOI] [PMC free article] [PubMed] [Google Scholar]
- 13. Wang H, Hou W, Perera A, Bettler C, Beach JR, Ding X, et al. Targeting EphA2 suppresses hepatocellular carcinoma initiation and progression by dual inhibition of JAK1/STAT3 and AKT signaling. Cell Rep. 2021;34:108765. [DOI] [PMC free article] [PubMed] [Google Scholar]
- 14. Shang N, Wang H, Bank T, Perera A, Joyce C, Kuffel G, et al. Focal adhesion kinase and beta‐catenin cooperate to induce hepatocellular carcinoma. Hepatology. 2019;70:1631–45. [DOI] [PMC free article] [PubMed] [Google Scholar]
- 15. Shang N, Arteaga M, Zaidi A, Stauffer J, Cotler SJ, Zeleznik‐Le NJ, et al. FAK is required for c‐Met/beta‐catenin‐driven hepatocarcinogenesis. Hepatology. 2015;61:214–26. [DOI] [PMC free article] [PubMed] [Google Scholar]
- 16. Orellana EA, Kasinski A. Sulforhodamine B (SRB) assay in cell culture to investigate cell proliferation. Bio Protoc. 2016;6:e1984. [DOI] [PMC free article] [PubMed] [Google Scholar]
- 17. Feoktistova M, Geserick P, Leverkus M. Crystal violet assay for determining viability of cultured cells. Cold Spring Harb Protoc. 2016;2016:pdb.prot087379. [DOI] [PubMed] [Google Scholar]
- 18. McDermott M, Eustace AJ, Busschots S, Breen L, Crown J, Clynes M, et al. In vitro development of chemotherapy and targeted therapy drug‐resistant cancer cell lines: a practical guide with case studies. Front Oncol. 2014;4:40. [DOI] [PMC free article] [PubMed] [Google Scholar]
- 19. Jin H, Shi Y, Lv Y, Yuan S, Ramirez CFA, Lieftink C, et al. EGFR activation limits the response of liver cancer to lenvatinib. Nature. 2021;595:730–4. [DOI] [PubMed] [Google Scholar]
- 20. Liu S, Chen L, Zhao H, Li Q, Hu R, Wang H. Integrin beta8 facilitates tumor growth and drug resistance through a Y‐box binding protein 1‐dependent signaling pathway in bladder cancer. Cancer Sci. 2020;111:2423–30. [DOI] [PMC free article] [PubMed] [Google Scholar]
- 21. Cui Y, Wu F, Tian D, Wang T, Lu T, Huang X, et al. miR‐199a‐3p enhances cisplatin sensitivity of ovarian cancer cells by targeting ITGB8. Oncol Rep. 2018;39:1649–57. [DOI] [PMC free article] [PubMed] [Google Scholar]
- 22. Hamidi H, Ivaska J. Every step of the way: integrins in cancer progression and metastasis. Nat Rev Cancer. 2018;18:533–48. [DOI] [PMC free article] [PubMed] [Google Scholar]
- 23. Wang WW, Wang YB, Wang DQ, Lin Z, Sun RJ. Integrin beta‐8 (ITGB8) silencing reverses gefitinib resistance of human hepatic cancer HepG2/G cell line. Int J Clin Exp Med. 2015;8:3063–71. [PMC free article] [PubMed] [Google Scholar]
- 24. Yang WL, Wu CY, Wu J, Lin HK. Regulation of Akt signaling activation by ubiquitination. Cell Cycle. 2010;9:487–97. [DOI] [PMC free article] [PubMed] [Google Scholar]
- 25. Sato S, Fujita N, Tsuruo T. Modulation of Akt kinase activity by binding to Hsp90. Proc Natl Acad Sci U S A. 2000;97:10832–7. [DOI] [PMC free article] [PubMed] [Google Scholar]
- 26. Liao Y, Hung MC. Physiological regulation of Akt activity and stability. Am J Transl Res. 2010;2:19–42. [PMC free article] [PubMed] [Google Scholar]
- 27. Liu X, Tian H, Li H, Ge C, Zhao F, Yao M, et al. Derivate isocorydine (d‐ICD) suppresses migration and invasion of hepatocellular carcinoma cell by downregulating ITGA1 expression. Int J Mol Sci. 2017;18:514. [DOI] [PMC free article] [PubMed] [Google Scholar]
- 28. Vogel A, Qin S, Kudo M, Su Y, Hudgens S, Yamashita T, et al. Lenvatinib versus sorafenib for first‐line treatment of unresectable hepatocellular carcinoma: patient‐reported outcomes from a randomised, open‐label, non‐inferiority, phase 3 trial. Lancet Gastroenterol Hepatol. 2021;6:649–58. [DOI] [PubMed] [Google Scholar]
- 29. Blandin AF, Renner G, Lehmann M, Lelong‐Rebel I, Martin S, Dontenwill M. Beta1 integrins as therapeutic targets to disrupt hallmarks of cancer. Front Pharmacol. 2015;6:279. [DOI] [PMC free article] [PubMed] [Google Scholar]
- 30. Ley K, Rivera‐Nieves J, Sandborn WJ, Shattil S. Integrin‐based therapeutics: biological basis, clinical use and new drugs. Nat Rev Drug Discov. 2016;15:173–83. [DOI] [PMC free article] [PubMed] [Google Scholar]
- 31. Raab‐Westphal S, Marshall JF, Goodman SL. Integrins as therapeutic targets: successes and cancers. Cancers (Basel). 2017;9:110. [DOI] [PMC free article] [PubMed] [Google Scholar]
- 32. Alday‐Parejo B, Stupp R, Ruegg C. Are integrins still practicable targets for anti‐cancer therapy? Cancers (Basel). 2019;11:978. [DOI] [PMC free article] [PubMed] [Google Scholar]
- 33. Valdembri D, Serini G. The roles of integrins in cancer. Fac Rev. 2021;10:45. [DOI] [PMC free article] [PubMed] [Google Scholar]
- 34. Cooper J, Giancotti FG. Integrin signaling in cancer: mechanotransduction, stemness, epithelial plasticity, and therapeutic resistance. Cancer Cell. 2019;35:347–67. [DOI] [PMC free article] [PubMed] [Google Scholar]
- 35. Su C‐Y, Li J‐Q, Zhang L‐L, Wang H, Wang F‐H, Tao Y‐W, et al. The biological functions and clinical applications of integrins in cancers. Front Pharmacol. 2020;11:579068. [DOI] [PMC free article] [PubMed] [Google Scholar]
- 36. Basso AD, Solit DB, Chiosis G, Giri B, Tsichlis P, Rosen N. Akt forms an intracellular complex with heat shock protein 90 (Hsp90) and Cdc37 and is destabilized by inhibitors of Hsp90 function. J Biol Chem. 2002;277:39858–66. [DOI] [PubMed] [Google Scholar]
- 37. Lai R, Li W, Hu P, Xie D, Wen J. Role of Hsp90/Akt pathway in the pathogenesis of gentamicin‐induced hearing loss. Int J Clin Exp Pathol. 2018;11:4431–8. [PMC free article] [PubMed] [Google Scholar]
- 38. Konopleva MY, Walter RB, Faderl SH, Jabbour EJ, Zeng Z, Borthakur G, et al. Preclinical and early clinical evaluation of the oral AKT inhibitor, MK‐2206, for the treatment of acute myelogenous leukemia. Clin Cancer Res. 2014;20:2226–35. [DOI] [PMC free article] [PubMed] [Google Scholar]
- 39. Yap TA, Yan LI, Patnaik A, Fearen I, Olmos D, Papadopoulos K, et al. First‐in‐man clinical trial of the oral pan‐AKT inhibitor MK‐2206 in patients with advanced solid tumors. J Clin Oncol. 2011;29:4688–95. [DOI] [PubMed] [Google Scholar]
- 40. Ma BBY, Goh BC, Lim WT, Hui EP, Tan EH, Lopes GDL, et al. Multicenter phase II study of the AKT inhibitor MK‐2206 in recurrent or metastatic nasopharyngeal carcinoma from patients in the mayo phase II consortium and the cancer therapeutics research group (MC1079). Invest New Drugs. 2015;33:985–91. [DOI] [PubMed] [Google Scholar]
- 41. Shariati M, Meric‐Bernstam F. Targeting AKT for cancer therapy. Expert Opin Investig Drugs. 2019;28:977–88. [DOI] [PMC free article] [PubMed] [Google Scholar]
- 42. Sanchez J, Carter TR, Cohen MS, Blagg BSJ. Old and new approaches to target the hsp90 chaperone. Curr Cancer Drug Targets. 2020;20:253–70. [DOI] [PMC free article] [PubMed] [Google Scholar]
- 43. Prodromou C. Regulatory mechanisms of Hsp90. Biochem Mol Biol J. 2017;3:2. [DOI] [PMC free article] [PubMed] [Google Scholar]
- 44. Mollapour M, Neckers L. Post‐translational modifications of Hsp90 and their contributions to chaperone regulation. Biochim Biophys Acta. 2012;1823:648–55. [DOI] [PMC free article] [PubMed] [Google Scholar]
- 45. Mollapour M, Tsutsumi S, Donnelly AC, Beebe K, Tokita MJ, Lee M‐J, et al. Swe1Wee1‐dependent tyrosine phosphorylation of Hsp90 regulates distinct facets of chaperone function. Mol Cell. 2010;37:333–43. [DOI] [PMC free article] [PubMed] [Google Scholar]
- 46. Cruz da Silva E, Dontenwill M, Choulier L, Lehmann M. Role of integrins in resistance to therapies targeting growth factor receptors in cancer. Cancers (Basel). 2019;11:692. [DOI] [PMC free article] [PubMed] [Google Scholar]
Associated Data
This section collects any data citations, data availability statements, or supplementary materials included in this article.
Supplementary Materials
Fig S1
Fig S2
Fig S3
Fig S4
Fig S5
Fig S6
Fig S7
Fig S8
Fig S9
Fig S10
Fig S11
Fig S12
Fig S13
Fig S14
Fig S15
Fig S16
Fig S17
Fig S18
Table S1‐S5
Supplementary Material


