Abstract
Major histocompatibility complex I (MHC‐I) molecules present epitopes on the cellular surface of antigen‐presenting cells to prime cytotoxic clusters of differentiation 8 (CD8)+ T cells (CTLs), which then identify and eliminate other cells such as virus‐infected cells bearing the antigen. Human hepatitis virus cohort studies have previously identified MHC‐I molecules as promising predictors of viral clearance. However, the underlying functional significance of these predictions is not fully understood. Here, we show that expression of single MHC‐I isomers promotes virus‐induced liver immunopathology. Specifically, using the lymphocytic choriomeningitis virus (LCMV) model system, we found MHC‐I proteins to be highly up‐regulated during infection. Deletion of one of the two MHC‐I isomers histocompatibility antigen 2 (H2)–Db or H2‐Kb in C57Bl/6 mice resulted in CTL activation recognizing the remaining MHC‐I with LCMV epitopes in increased paucity. This increased CTL response resulted in hepatocyte death, increased caspase activation, and severe metabolic changes in liver tissue following infection with LCMV. Moreover, depletion of CTLs abolished LCMV‐induced pathology in these mice with resulting viral persistence. In turn, natural killer (NK) cell depletion further increased antiviral CTL immunity and clearance of LCMV even in the presence of a single MHC‐I isomer. Conclusion: Our results suggest that uniform MHC‐I molecule expression promotes enhanced CTL immunity during viral infection and contributes to increased CTL‐mediated liver cell damage that was alleviated by CD8 or NK cell depletion.
The liver is a vital organ with a variety of functions in metabolism including carbohydrate, lipid, and nitrogen metabolism.( 1 , 2 ) Moreover, the liver is involved in plasma protein expression and detoxifications.( 3 ) Venous blood from the gut directly feeds into the liver via the portal vein, potentially exposing the liver to a great variety of pathogens.( 4 ) Hepatotropic pathogens such as hepatitis B virus (HBV) or hepatitis C virus (HCV) can establish chronic infections and can cause life‐threatening liver disease in hundreds of millions of people worldwide.( 1 , 5 , 6 ) The liver consists of multiple cell types including hepatocytes, hepatic stellate cells, Kupffer cells, and liver sinusoidal endothelial cells (LSECs).( 7 ) Under inflammatory conditions, myeloid cell–derived inflammatory monocytes named iMATEs can also be found in liver tissues to promote anti‐pathogen immunity.( 8 )
Cytotoxic T cell (CTL) immunity contributes to the clearance of viral infections by eliminating infected cells. Major histocompatibility complex I (MHC‐I) molecules along with their cofactor beta‐2‐microglobulin present peptides on the cell surface of nucleated cells to make them recognizable to CTLs. All hepatic cell types express MHC‐I with varying functions.( 7 ) While antigen presentation via MHC‐I on iMATEs leads to enhanced T‐cell proliferation,( 8 ) hepatocyte‐derived MHC‐I presentation may contribute to deletion of CTLs.( 9 ) The contact of CTL and LSECs via MHC‐I can determine the formation of long‐lived memory CD8+ T cells.( 10 ) Moreover, although increased MHC‐I expression can increase T‐cell activation, prolonged viral infection with the presentation of high antigen levels on MHC‐I molecules can contribute to exhaustion of antiviral T cells and consequently cause the establishment of chronic viral infection.( 11 , 12 )
Three maternal and three paternal inherited MHC‐I isomers define an individual’s set of antigen‐presenting molecules called human leukocyte antigen (HLA) class in humans and histocompatibility antigen 2 (H2) in mice.( 13 ) An increased repertoire of peptide presentation by heterozygous expression of HLA molecules can trigger a broader T‐cell response, preventing viral escape and accordingly benefit viral clearance, and therefore is referred to as the HLA heterozygosity advantage. Previous studies have highlighted the importance of HLA in human chronic infectious diseases. Specifically, heterozygous expression of HLA class II molecules showed better viral clearance than homozygous expression in patients suffering from HBV or HCV infection.( 14 , 15 , 16 ) Consistently, disease progression during human immunodeficiency virus (HIV) infection is inversely correlated with heterozygous HLA class I expression.( 17 ) However, during infection with hepatitis viruses, the role of heterozygous HLA class I expression is less clear. Only a minor correlation between HLA class I heterozygosity and HCV viral clearance was observed.( 16 ) Furthermore, progression to liver fibrosis was not associated with heterozygous or homozygous expression of HLA –A, –B, or –C.( 18 ) However, the expression of certain HLA class I genes can influence the outcome of infections with hepatitis viruses. Analysis of HLA class I alleles during HCV infection between patients who cleared infection or who developed chronic infections revealed that the alleles B*15, B*27, B*57, and C*01 were associated with effective HCV clearance. In contrast, expression of HLA‐A*23 was associated with viral persistence of HCV.( 19 , 20 , 21 , 22 , 23 ) Taken together, while there is evidence that MHC‐I molecule expression influences the course of viral infection in the liver, the role of their expression on the course of infection and pathology during viral infections is insufficiently understood. The inbred, genetically homozygous mouse strain C57BL/6 expresses only the two MHC‐I molecules H2‐Db and H2‐Kb.( 24 ) In mice, infection with the noncytopathic lymphocytic choriomeningitis virus (LCMV) can also affect hepatocytes, which results in antiviral CTL‐dependent hepatitis.( 25 ) Accordingly, LCMV can be used as a model to investigate CTL‐mediated liver immunopathogenesis.( 26 ) Notably, H2‐Db and H2‐Kb share the similar immunodominant epitope gp33 and gp34 of LCMV, respectively,( 27 ) which reduces the probability of viral escape in experimental model systems in which specific MHC‐I molecules are deleted.
In this study, we show that MHC‐I expression is highly up‐regulated following chronic LCMV infection in liver tissue. Moreover, the expression of uniform MHC‐I molecules in H2‐Db‐deficient and H2‐Kb‐deficient mice resulted in severe liver immunopathology. Although T‐cell immunity was only restricted to the remaining MHC‐I isomer, increased T‐cell numbers were detected. The liver pathology was associated with increased liver cell death and slightly accelerated clearance of LCMV, indicating an increased CTL immunity. Depletion of CTLs abolished LCMV‐mediated immune pathology, while natural killer (NK) cell depletion boosted the uniform CTL response to clear LCMV in absence of severe pathology.
Materials and Methods
Mice, Viruses, Virus Titration, and Cell Depletion
H2‐D1−/− , H2‐K1−/− mice were bred in a C57BL/6 background and maintained under specific pathogen‐free conditions. Experiments were performed under the authorization of LANUV in accordance with German laws for animal protection. LCMV strain Docile was originally obtained from Dr. C. J. Pfau (Troy, New York). Viruses were propagated in L929 cells (obtained from ATCC; NCTC clone 929) and virus titers were measured using a plaque‐forming assay as previously described.( 28 ) Briefly, organs were harvested into Hank’s balanced salt solution and homogenized with a tissuelyser (Qiagen, Hilden, Germany). Diluted virus samples were mixed with MC57 cells in 24‐well plates. After 3 hours, methylcellulose 1% medium was added. After 2 days of incubation, viruses were visualized by staining against LCMV nucleoprotein via an anti‐LCNV‐NP antibody (clone VL‐4). CD8+ T cells were depleted with intravenous (i.v.) injection of anti‐CD8 antibody (clone YTS169.4),( 28 ) and NK1.1+ cells (clone PK136) were depleted with i.v. injection of anti‐NK1.1 antibody.( 29 )
Histology
Histological analysis of snap‐frozen tissue was performed as previously described.( 28 ) Antibodies against cleaved caspase‐3 (Casp3), cleaved caspase‐8 (Casp8; Cell Signaling, Danvers, MA), and self‐made anti‐LCMV monoclonal antibody (clone VL4) were used. Terminal deoxynucleotidyl transferase–mediated deoxyuridine triphosphate nick‐end labeling (TUNEL) staining was performed using the in situ cell death detection kit, fluorescein (Roche) as per manufacturers’ instructions. Images were acquired with the ZEISS LSM 880 or ZEISS Axio Observer Z1 microscopes. Cleaved Casp3, cleaved Casp8, and TUNEL quantifications were analyzed by ImageJ software.
Flow Cytometric Analysis
Experiments were performed using fluorescence‐activated cell sorting (Fortessa) and analyzed using FlowJo software. For cell subsets and surface molecule staining, single suspended cells were incubated with antibodies (anti‐CD19, CD3, CD4, CD8, F4/80, CD202b, HNF4a, H2Db, and H2Kb [Thermo Fisher Scientific, Waltham, MA]) for 30 minutes at 4°C. Tetramer and intracellular cytokine staining were performed as described previously.( 29 ) For tetramer staining, single suspended cells were incubated with tetramer‐gp33 or tetramer‐gp34 (CD8) for 15 minutes at 37°C. After incubation, surface antibodies (anti‐CD8, interleukin [IL]‐7R, killer cell lectin‐like receptor subfamily G, member 1 [KLRG1], CD44, CD62L, programmed cell death protein 1 [PD‐1], 2B4, T‐cell immunoglobulin mucin‐3 [TIM‐3], lymphocyte‐activation gene 3 [LAG‐3], and C‐X‐C chemokine receptor type 5) were added for 30 minutes at 4°C. For intracellular cytokine restimulation, single suspended cells were stimulated with LCMV‐specific peptides gp33, gp34( 27 ) for 1 hour. Brefeldin A (Thermo Fisher Scientific) was added for another 5‐hour incubation at 37°C followed by staining with anti‐CD8 antibody (Thermo Fisher Scientific). After surface staining, cells were fixed with 2% formalin, followed by permeabilization with 0.1% Saponin, and stained with anti‐interferon γ (IFN‐γ) for 30 minutes at 4°C.
RNA Purification and Real‐Time Polymerase Chain Reaction
RNA was isolated using Trizol according to the manufacturer’s instructions (Thermo Fisher Scientific). Real‐time polymerase chain reaction (PCR) was performed using the iTaq Universal SYBR GreenOne‐Step RT‐qPCR Kit (Bio‐Rad, Hercules, CA) as previously described. For analysis, expression levels were normalized to glyceraldehyde 3‐phosphate dehydrogenase.
Immunoblotting
Liver tissue was smashed using a tissue lyser (TissueLyser II; Qiagen) and lysed using sodium dodecyl sulfate (SDS) lysis buffer (1.1% SDS, 11% glycerol, 0.1 mol/L Tris, pH 6.8) with 10% β‐mercaptoethanol. Blots were probed with anti‐α‐tubulin (Merck, Kenilworth, NJ), anti‐cleaved Casp3, anti‐cleaved Casp8, or anti‐beta‐2 microglobulin (Cell Signaling) followed by detection with the Odyssey infrared imaging system (Odyssey Fc; LI‐COR Biosciences, Lincoln, NE). Immunoblots were quantified using ImageJ.
Metabolomics
Targeted metabolomics profiling of liver samples was performed using the AbsoluteIDQ p180 Kit (Biocrates Life Sciences AG, Innsbruck, Australia). This kit allows for absolute quantification of 188 metabolites. The measurements were carried on a Xevo TQ‐S tandem mass spectrometer coupled to an Acquity UPLC‐I class system (ultraperformance liquid chromatography). Blood glucose levels were measured using a Bayer Contour Blood Glucose Meter.
Statistical Analysis
Data are expressed as mean ± SEM. For analysis of statistical significance between two groups, a Student t test was used. For analysis of multiple time‐point experiments, two‐way analysis of variance with an additional Bonferroni post hoc test was used. *P < 0.05, **P < 0.01, ***P < 0.001 was considered statistically significant. Survival curves were analyzed by log‐rank (Mantel‐Cox) test.
Results
Uniform MHC‐I Expression Results in Liver Tissue Damage Following Infection With LCMV
Liver cell apoptosis can be induced by CTLs during noncytolytic LCMV infection.( 30 ) To study the role of heterozygous MHC expression following CTL‐induced liver damage during infection, we infected H2‐Db‐deficient mice on a C57Bl/6 background with LCMV. In this model system, H2‐D1−/− mice will only express H2‐Kb as MHC‐I, while C57Bl/6 mice will express H2‐Db and H2‐Kb. We observed a decrease in glucose levels in both wild‐type (WT) and H2‐Db‐deficient animals after infection. However, glucose levels were restored in control animals but not H2‐Db‐deficient mice 9 days following infection, suggesting an impairment of liver function in the absence of H2‐Db (Fig. 1A). Notably, 8‐9 days following infection, we observed that H2‐D1−/− mice exhibited hypothermia, hypoactivity, and had a noticeably sullied coat following what is usually an asymptomatic LCMV infection in WT animals (Fig. 1B). H2‐K1−/− animals, which only exhibit uniform expression of H2‐Db, also appeared in a moribund state, but to a lesser extent than mice expressing H2‐Kb (Fig. 1B). Damaged liver tissue can be detected by an increase of hepatic enzymes in the bloodstream. Elevated liver enzymes can be observed during LCMV infection as a result of CD8+ T cell–mediated immunopathology.( 25 ) We found increased alanine aminotransferase (ALT), aspartate aminotransferase (AST), and lactate dehydrogenase (LDH) enzyme activities in the serum of LCMV‐infected H2‐Db deficient mice compared with WT mice (Fig. 1C). Serum ALT levels were under the detection limit in naïve WT, H2‐Db‐deficient, or H2‐Kb‐deficient mice (Fig. S1A). Liver tissue damage may lead to liver metabolic dysfunction.( 30 ) Consistently, we observed that glycerophospholipids were highly increased in WT‐infected liver tissue when compared with H2‐Db‐deficient liver tissue (Supporting Fig. S1B). In turn, long‐chain acyl‐carnitines were highly increased in the liver tissue of LCMV‐infected H2‐Db‐deficient mice when compared with WT counterparts (Supporting Fig. S1C). Additionally, we found most of the amino acids were down‐regulated in liver tissues when H2‐Db was missing (Supporting Fig. S1D). These data suggest a decreased metabolic function following infection in the presence of uniform MHC‐I expression. Biogenic amines showed a mixed expression pattern: 4‐hydroxyproline, methionine sulfoxide, and asymmetric dimethylarginine expression were decreased, whereas kynurenine, serotonin, and aminoadipic acid expression were increased in H2‐Db‐deficient liver tissue (Supporting Fig. S1E). High kynurenine expression might be associated with increased hepatic inflammation during LCMV infection.( 31 ) However, serotonin can affect T‐cell immunity and is associated with increased liver pathology.( 28 ) Taken together, these data suggest that uniform MHC‐I expression results in severe liver damage, hepatic metabolic dysfunction, and severe pathology following infection with LCMV.
FIG. 1.
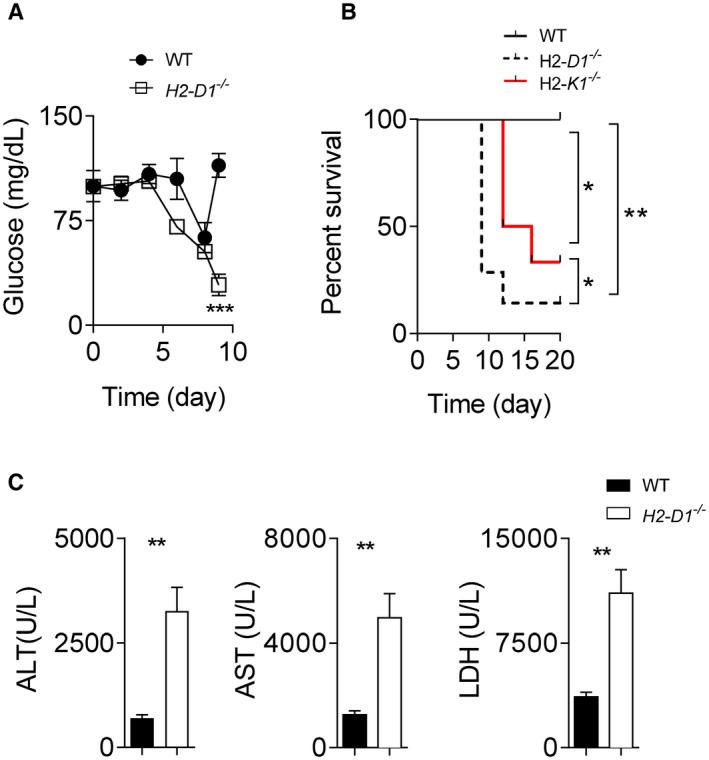
H2‐Db expression protects animals from lethal LCMV‐induced liver pathology. (A) WT and H2‐D1−/− mice were infected with 2 × 10⁴ pfu of LCMV Docile. (A) Blood glucose concentration was monitored (starting with n = 7 animals). (B) WT, H2‐D1−/− , and H2‐K1−/− mice were infected with 2 × 10⁴ pfu of LCMV Docile, and survival was monitored (n = 6‐7). (C) WT and H2‐D1−/− mice were infected with 2 × 10⁴ pfu of LCMV Docile. At day 9 following infection, ALT, AST, and LDH activity in the serum of control and H2‐D1−/− mice was determined (n = 6). Error bars show SEM. *P < 0.05, **P < 0.01, and ***P < 0.001, between the indicated groups).
MHC‐I Expression Is Up‐Regulated After LCMV Infection in Liver Tissue
Because H2‐Db‐deficient animals exhibited severe liver pathology following LCMV infection, we wondered whether hepatic MHC‐I protein expression changed after infection. Previous findings have shown that MHC‐I can be up‐regulated in the central nervous system during LCMV infection.( 32 ) Consistently, liver H2‐D1 and H2‐K1 messenger RNA expression increased after LCMV infection (Fig. 2A). Furthermore, we observed that the beta‐2 microglobulin expression levels were significantly increased in liver tissue following infection (Fig. 2B). Using flow cytometry, H2‐Db and H2‐Kb expression was observed on F4/80+ (Kupffer cells), Tie2+ endothelial cells, and HNF4a+ hepatocytes following infection in the liver tissue (Fig. 3B; Supporting Fig. S2A,B). These data indicate that MHC‐I expression is increased during LCMV‐induced liver inflammation, and this increase is observed on multiple hepatic cell types. H2‐Db and H2‐Kb expression was also confirmed on several immune cell subsets in single‐cell suspended splenocytes, including CD19+ B cells, CD4+ T cells, CD8+ T cells, and F4/80+ macrophages following infection (Fig. 2D; Supporting Fig. S2C,D). Taken together, these data indicate that MHC‐I molecules are highly and ubiquitously up‐regulated following infection on multiple cells, including immune subsets in liver and spleen tissue.
FIG. 2.
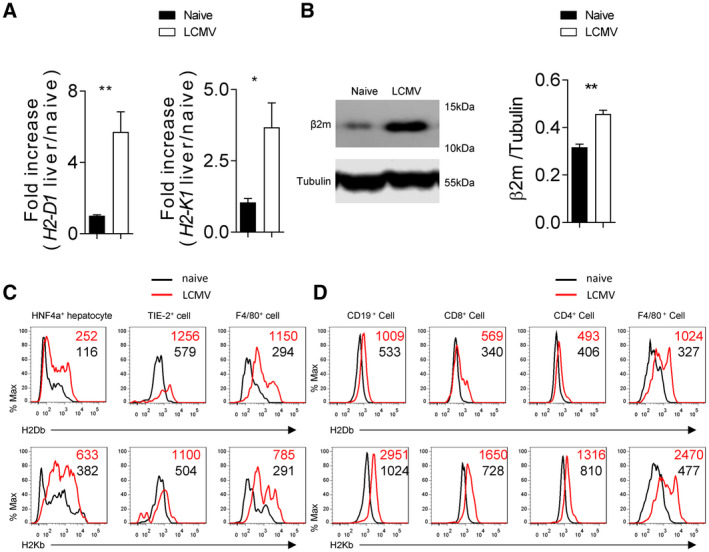
H2‐Db is rapidly up‐regulated in liver tissue following LCMV infection. C57BL/6 mice (H2‐b) were infected with 2 × 10⁴ pfu of LCMV Docile. Four days following infection, H2‐D1 and H2‐K1 messenger RNA was quantified by real‐time PCR using RNA isolated from liver tissue (n = 6) (A). (B) Beta‐2 microglobulin protein expression in liver tissue was determined by immunoblot analysis (n = 3). (C) Expression of H2‐Db (upper panels) and H2‐Kb (lower panels) was measured in different cell types of single cell suspended liver tissue from infected and naïve animals by flow cytometry (n = 7 for Kupffer cells and hepatocytes; n = 6 for endothelial cells; average of mean fluorescence intensity (MFI) is listed on the upper‐right corner). (D) Expression of H2‐Db (upper panel) and H2‐Kb (lower panel) was determined by flow cytometry in different immune cells in spleen tissue (n = 7; average of MFI is listed on the upper‐right corner). Error bars show SEM. *P < 0.05 and **P < 0.01 between the indicated groups.
FIG. 3.
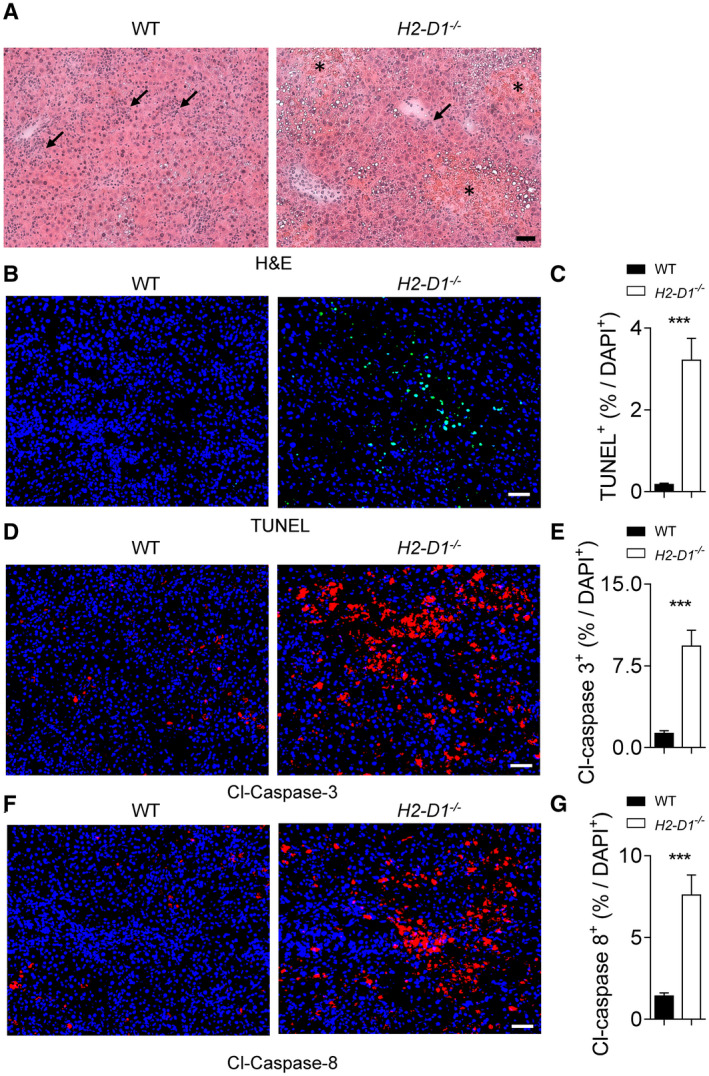
H2‐Db protects liver tissue during LCMV infection. WT and H2‐D1−/− mice were infected with 2 × 10⁴ pfu of LCMV Docile. (A‐I) At day 9 following infection, sections of snap‐frozen liver tissue were analyzed using H&E staining (one representative set of images of n = 5 is shown; scale bar = 50 µm; stars indicate the necrotic areas; arrows indicate the inflammatory infiltrates) (A). Sections of snap‐frozen liver tissue were analyzed for TUNEL (B,C), cleaved Casp3 (D,E), and cleaved Casp8 (F,G); expression was determined and quantified using fluorescent staining of tissue sections. One representative set of images of n = 8 is shown; scale bar = 50 μm; three fields of each section were analyzed for the frequency of TUNEL, cleaved Casp3, or cleaved casp8 positive cells out of the total 4´,6‐diamidino‐2‐phenylindole (DAPI)–positive cells (n = 24). Error bars show SEM; ***P < 0.001 between the indicated groups. Abbreviation: Cl, cleaved.
H2‐Db Expression Prevents Liver Cell Apoptosis During LCMV Infection
MHC‐I molecules can recruit antiviral CD8+ T cells, which mediate liver cell death during LCMV infection.( 25 ) Specifically, LSECs can contribute to CD8+ T‐cell stimulation and CTL‐mediated TNF production.( 33 ) Moreover, CD8+ T cells can crawl along liver sinusoids in scanning hepatocellular antigen to induce caspase activation and liver cell death.( 34 ) Accordingly, we hypothesized that during uniform MHC‐I expression, liver cell death was increased. In hematoxylin and eosin (H&E) tissue sections, liver damage can be observed by diffuse hemorrhagic necrotic areas, which were more common and extensive in H2‐D1−/− mice than in controls, whereas pericellular and perivascular inflammatory infiltrates were observed in both groups (Fig. 3A). Notably, we did not observe any significant difference in LCMV‐infected liver cells or LCMV titers between H2‐D1−/− and WT animals in this setting (Supporting Fig. S3A,B). Next, we checked whether the absence of H2‐Db triggered increased apoptosis in liver tissue following infection with LCMV. In line with the elevated liver enzymes in H2‐D1−/− mice, we also observed increased staining of DNA fragmentation by TUNEL in liver tissue of H2‐Db‐deficient mice when compared with WT controls (Fig. 3B,C; Supporting Fig. S4A,B). DNA fragmentation can result from the activation of effector caspases such as Casp3.( 35 ) As expected, we found increased Casp3 activation in snap‐frozen liver sections of H2‐Db‐deficient mice when compared with WT controls following LCMV infection (Fig. 3D,E; Supporting Fig. S4C‐F). Notably, no Casp3 cleavage differences were observed in WT, H2‐D1−/− , and H2‐K1−/− liver tissue under naïve conditions, suggesting that H2‐Db or H2‐Kb deficiency does not directly cause liver cell apoptosis (Supporting Fig. S4E,F). Effector caspases are activated by initiator caspases such as Casp8 during tumor necrosis factor receptor 1–mediated cell death.( 36 ) Consistently, active Casp8 was also highly expressed in the absence of H2‐Db when compared with control animals in tissue sections as well as protein samples from liver tissue (Fig. 3F,G; Supporting Fig. S4G‐J). These data confirm that the absence of H2‐Db resulted in increased liver cell death following LCMV infection.
Effective CTL Immunity Promotes Immunopathology in H2‐D1−/− Mice Following LCMV Infection
Hepatocyte death is induced by CTL during LCMV infection. Therefore, we investigated the CTL response in H2‐Db‐deficient mice after LCMV infection. Indeed, we observed an increased frequency of KLRG1+CD62L−IL‐7R− effector LCMV‐gp34+tet+CD8+ (H2‐Kb‐restricted) T cells in the peripheral blood of H2‐D1−/− mice compared with WT animals (Fig. 4A; Supporting Fig. S5A). KLRG1− CD62L+IL‐7R+ memory T‐cell frequency was also increased in H2‐D1−/− mice (Fig. 4A; Supporting Fig. S5A). A lower dose of LCMV also resulted in increased LCMV‐gp34+tet+CD8+ T cells in H2‐D1−/− mice (Fig. 4B). KLRG1+CD62L−IL‐7R− effector T cells were also increased in this setting (Fig. 4C; Supporting Fig. S5B). We did not observe major differences in expression of exhaustion molecules including PD‐1, LAG‐3, TIM‐3, and 2B4 between WT and H2‐D1−/− LCMV‐specific T cells (Fig. 4D; Supporting Fig. S5C). However, when we restimulated splenocytes ex vivo with a variety of LCMV‐specific peptides, we detected increased IFN‐γ production in CD8+ T cells harvested from H2‐Db‐deficient mice compared with WT controls (Fig. 4E). Consistently, LCMV infection also resulted in increased LCMV‐gp33+tet+CD8+ (H2‐Db‐restricted) and LCMV‐np396+tet+CD8+ (H2‐Db‐restricted) T‐cell frequencies in H2‐K1−/− animals (Supporting Fig. S5D). We also observed increased KLRG1+CD62L−IL‐7R− effector T cells in H2‐K1−/− mice compared with WT controls (Supporting Fig. S5E). Consistent with increased effector T‐cell function, we observed accelerated LCMV control in H2‐Db‐deficient animals in this setting, although both WT and H2‐Db‐deficient animals eventually eliminated LCMV (Fig. 4F; Supporting Fig. S5F). These data indicate that uniform MHC‐I expression results in increased CTL immunity against the MHC‐I isomer restricted peptides.
FIG. 4.
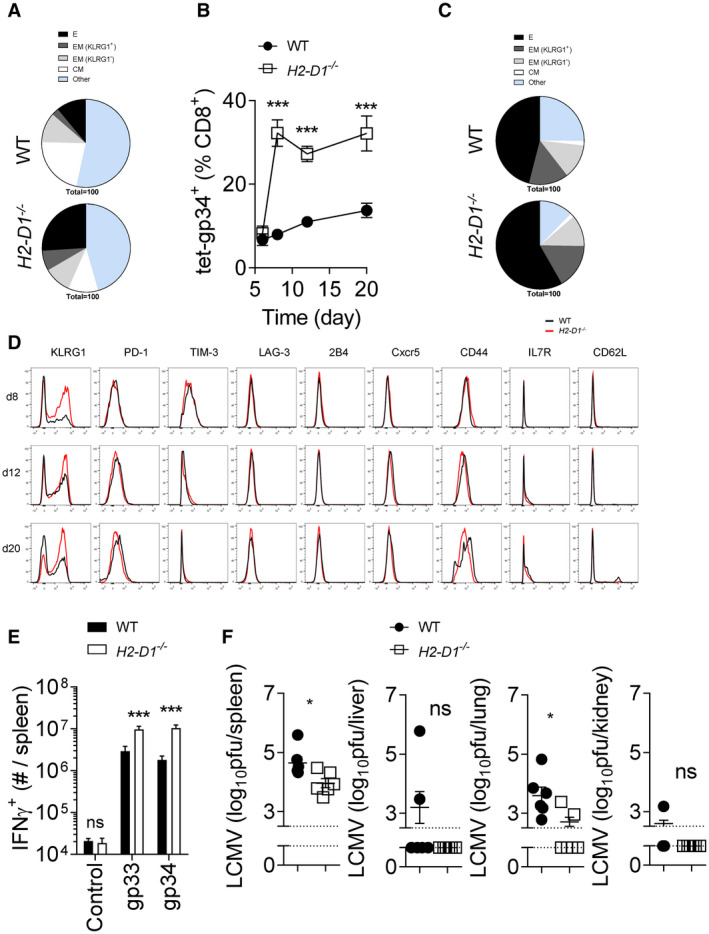
H2‐Db knockout mice exhibited enhanced CTL immunity during LCMV infection. (A) WT and H2‐D1−/− mice were infected with 2 × 10⁴ pfu of LCMV Docile. Effector (KLRG1+ IL‐7R− CD62L−), effector memory (KLRG1+ IL‐7R+ CD62L−, KLRG1− IL‐7R+ CD62L−), and central memory (KLRG1− IL‐7R+ CD62L+) markers were measured on tet‐gp34+ T cells in the blood at day 6 following infection (mean of n = 13‐14 is shown). (B‐G) WT and H2‐D1−/− mice were infected with 200 pfu of LCMV Docile. (B) Tet‐gp34+ T cells were determined in the blood at the indicated time points (n = 11). (C) Effector, effector memory, and central memory T‐cell subsets shown as a proportion of tet‐gp34+ T cells were determined in the blood of WT and H2‐D1−/− mice at day 12 following infection (mean of n = 11 is shown). (D) Surface molecule expression was measured on tet‐gp34+ T cells as indicated (one representative set of n = 11 is shown). (E) Twelve days after infection, single cell suspended splenocytes were restimulated with LCMV‐specific epitopes, as indicated, followed by staining for IFN‐γ (n = 8‐9). (F) Eight days following infection, virus titers were determined in the spleen, liver, lung, and kidney tissues (n = 6). Error bars show SEM; *P < 0.05, ***P < 0.001. Abbreviations: C, central; CM, central memory; CXCR5, C‐X‐C chemokine receptor type 5; E, effector; EM, effector memory; ns, not significant.
Considering the hyper CTL response in H2‐Db knockout mice after LCMV infection, we investigated whether depletion of CTL in H2‐Db‐deficient mice can revert the immunopathology. Depletion of CTLs using a CD8+ T‐cell depleting antibody, reduced active Casp8, cleaved Casp3, and TUNEL levels in snap‐frozen liver tissue following infection (Fig. 5A‐F). Moreover, neither necroses nor inflammatory infiltrates were observed in liver tissues of CD8+ T cell–depleted H2‐D1−/− mice (Fig. 5G). ALT, AST, and LDH activity following LCMV infection were reduced in the absence of CD8+ T cells in H2‐D1−/− mice, despite high LCMV titers (Fig. 5H; Supporting Fig. S6). These data indicate that CTL immunity following uniform MHC‐I expression caused severe hepatic immunopathology.
FIG. 5.
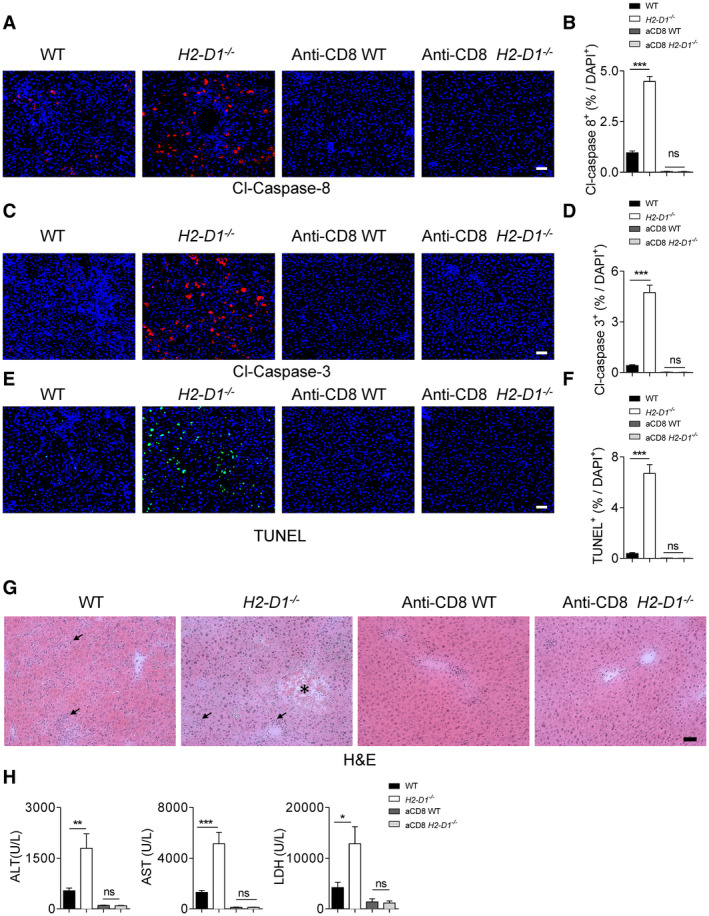
CD8+ T cells trigger liver cell apoptosis in H2‐Db‐infected knockout mice. CD8+ T cell–depleted, non‐depleted WT and H2‐D1−/− mice were infected with 2 × 10⁴ pfu of LCMV Docile. At day 9 following infection, sections of snap‐frozen liver tissue were analyzed for cleaved Casp8 (n = 7‐9) (A,B), cleaved Casp3 (n = 8) (C,D), and TUNEL (n = 8) (E,F). One representative set of images is shown; scale bar = 50 μm; for quantification, three fields of each section were analyzed for the frequency of cleaved Casp8 (n = 21‐27), cleaved Casp3 (n = 24), or TUNEL (n = 24) positive cells out of the total DAPI‐positive cells). (G) Sections of snap‐frozen liver tissue were analyzed for H&E staining at day 9 following infection. One representative set of images of n = 4 is shown; scale bar = 50 µm; the star indicates a necrotic area, and arrows indicate the inflammatory infiltrates, which are mostly not observed in the CD8+ T cell–depleted mice. (H) ALT, AST, and LDH activities in the serum at day 9 following infection were measured (n = 7‐9). Error bars show SEM; *P < 0.05, **P < 0.01, and ***P < 0.001.
Overproduction of IFN‐γ and/or tumor necrosis factor α (TNF‐α) is associated with inflammation, tissue damage, and death in human or animal infection models.( 37 , 38 ) We observed increased levels of serum IFN‐γ but not TNF‐α in H2‐Db knockout animals (Fig. 6A; Supporting Fig. S7). When mice were treated with an anti‐CD8 depletion antibody, IFN‐γ was reduced in both WT and H2‐Db knockout mice at day 4 following infection (Fig. 6A). This finding suggests that CD8+ T cells in H2‐Db mice were the source of IFN‐γ and likely activated to a greater extent than their WT counterparts during the early phase of viral infection. Furthermore, ablation of CTLs restored glucose levels in both WT and H2‐D1−/− mice (Fig. 6B). Furthermore, survival and liver immunopathology observed in H2‐Db‐deficient mice following LCMV infection were rescued by depletion of CD8+ T cells (Fig. 6C). Taken together, these data suggest that uniform MHC‐I can trigger increased T‐cell activation and result in severe immunopathology. Consistently, CD8+ T‐cell depletion could block immunopathology but promoted LCMV persistence. Next, we wondered whether CD8+ T‐cell immunity could be further boosted to eliminate LCMV and alleviate immunopathology during uniform MHC‐I expression. Specifically, NK cells are known to suppress CD8+ T‐cell immunity during LCMV infection. Accordingly, depletion of NK cells leads to faster viral clearance due to enhanced CD8+ T‐cell responses and reduced immunopathology.( 39 , 40 , 41 ) In our model system, NK cell–depleted H2‐D1−/− mice showed increased CD8+ T‐cell immunity than NK‐cell competent H2‐D1−/− mice (Fig. 6D). As a consequence, LCMV was eliminated in all tissues harvested from NK cell–depleted H2‐D1−/− mice, but also WT animals (Supporting Fig. S8). However, NK‐cell depletion prevented severe immunopathology following LCMV infection when compared with NK cell–competent H2‐Db‐deficient mice (Fig. 6E). These data suggest that viral replication in liver cells targeted by CD8+ T cells resulted in increased liver immunopathology in H2‐Db‐deficient mice. Following NK‐cell depletion, antiviral T‐cell immunity can be promoted to prevent severe symptoms during hepatic viral infection even during uniform MHC‐I expression. Accordingly, MHC‐I molecule expression can influence the equilibrium between immunity and pathology during CTL‐mediated antiviral defense (Fig. 7).
FIG. 6.
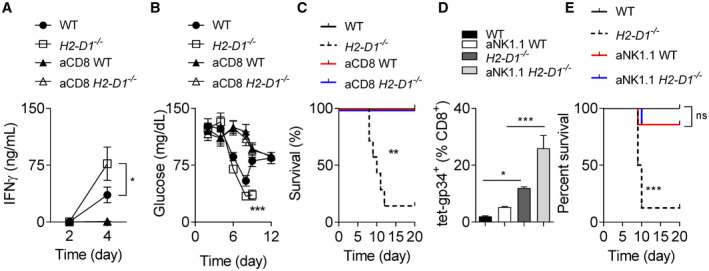
CD8+ T‐cell depletion restores the survival of chronically infected H2‐Db deficient mice. CD8+ T cell–depleted, nondepleted WT, and H2‐D1−/− mice were infected with 2 × 10⁴ pfu of LCMV Docile. (A) IFN‐γ was measured in serum at the indicated time points following infection (n = 3‐8). (B) Blood glucose concentration was monitored over the course of infection (starting with n = 6‐7 animals). (C) Survival was monitored over time (n = 7). (D,E) NK1.1+ cell–depleted, nondepleted WT, and H2‐D1−/− mice were infected with 2 × 10⁴ pfu of LCMV Docile. (D) tet‐gp34+ T cells were determined at day 8 following infection (n = 3‐4). (E) Survival was monitored (starting animals n = 7‐8). Error bars show SEM; *P < 0.05, **P < 0.01, and ***P < 0.001.
FIG. 7.
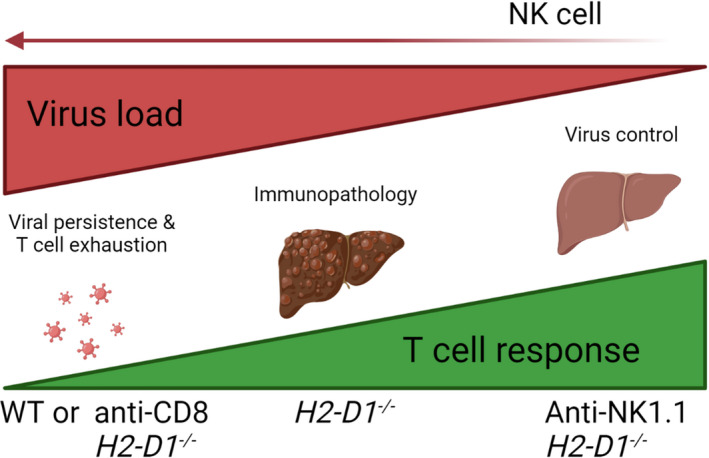
Postulated mechanism: MHC‐I molecule expression and NK cells influence the equilibrium between immunity and pathology during CTL‐mediated antiviral defense. During LCMV infection, if CTL response in the early phase of the infection is limited, resulting in viral persistence and T‐cell exhaustion, little CTL‐mediated immunopathology in the liver is observed (left). In H2‐D1−/− deficient animals, an increased CTL immunity is induced while the viruses are still replicating, and virus‐infected liver cells are attacked by CTL; this leads to enhanced immunopathology (middle). NK‐cell depletion triggers rapid induction of CTL response. This leads to CTL mediated elimination of LCMV viruses in liver tissue and limited CTL mediated immunopathology (right).
Discussion
The present study identified that uniform expression of MHC‐I molecules can affect liver cell death, and severe CTL induced immunopathology following infection with LCMV. Mice lacking the MHC‐I molecules H2‐Db, and to a lesser extent H2‐Kb, exhibited enhanced CTL immunity. However, the enhanced CD8+ T‐cell response did not result in a strikingly augmented clearance of the virus in the H2‐D1−/− mice compared with WT mice during chronic LCMV infection. Instead, the hyper CTL cell immunity caused sustained liver pathology and severe disease. Ablation of CTL in H2‐D1 knockout mice prevented virus‐induced liver pathology. Moreover, a further boost of antiviral T‐cell immunity by NK‐cell depletion prevented pathology in absence of H2‐Db. Collectively, our data provide evidence that during chronic infection, diverse MHC‐I expression can prevent a hyperresponsive CD8+ T‐cell immunity and protect the host from severe virus‐induced immunopathology.
A narrow expression range of MHC‐I molecules might influence immunopathology during viral infection. During infection with HIV homozygous expression of HLA molecules correlates with a rapid decline in CD4+ T cells compared to patients with heterozygous HLA expression.( 17 ) Considering our data, the rapid decline of CD4+ T‐cell count in HLA homozygote individuals may be due to an increased anti‐HIV CTL response targeting HIV‐infected CD4+ T cells.( 17 ) Our data showed that H2‐Db knockout mice exhibited a transient faster viral clearance during LCMV infection when compared with WT animals. In line with these data, no major significant viral clearance difference was observed from patients infected with HCV or HBV between HLA class I heterozygote and HLA class I homozygote groups.( 15 , 16 , 17 ) Furthermore, establishment of liver fibrosis during infection with HCV was not associated with homozygous expression of HLA –A, –B, or –C alleles.( 18 ) Our data show that expression of a single MHC‐I molecule is associated with increased liver immunopathology following infection with LCMV in comparison to expression of H2‐Db and H2‐Kb. While overall our data support that heterozygote expression of MHC‐I might be beneficial and prevents pathology during chronic infection, a detailed analysis of large patient cohorts and potentially overlapping effects need to be tested to validate these findings during human disease.
Furthermore, expression of specific HLA molecules are associated with disease progression and outcome during HCV infections. Immunodominant HCV CTL epitopes of HLA‐B*27, HLA‐B*57, and HLA‐B*15 required several mutations to escape from CTL recognition. Therefore, HCV clearance was observed in most of the patients who express HLA‐B*27, HLA‐B*57, and HLA‐B*15.( 19 ) On the contrary, HLA‐A*01 CTL epitopes only require one mutation to escape from CTL recognition. Consequently, HLA‐A*01 has not been identified as a protective HLA class I allele in HCV infection.( 19 ) In the LCMV setting, both H2‐Db and H2‐Kb present the immunodominant epitope gp33 and gp34, respectively. Both H2‐Db and H2‐Kb can be considered as protective alleles in single MHC‐I expression animals, as enhanced CTL function was observed in H2‐D1−/− or H2‐K1−/− mice when compared with WT controls. However, we also observed slight but significant differences between H2‐Db and H2‐Kb expressing animals, suggesting that expression of different MHC‐I molecules can affect immunopathology and disease progression during viral infection. Notably, depletion of CD8+ T cells abolished liver pathology, indicating that the functional CTL response in the presence of a single MHC‐I molecule expression setting triggered the pathology.
MHC expression can affect the outcome of human chronic viral infection. Specifically, transporter associated with antigen processing deficiency can cause global loss of HLA expression in humans, and these patients may suffer from bacterial infections.( 42 ) During HIV, HBV, and HCV infections, the HLA heterozygous advantage can be observed.( 14 , 15 , 16 , 17 ) These studies indicate that homozygous expression of MHC molecules correlate with decreased immunity and prolonged disease. Our finding further strengthens this conclusion in our animal model system that limited MHC isomer expression during a viral infection can cause severe immunopathology—even if it is CTL‐mediated. In our model system, liver pathology is mediated by CTLs, which is consistent with the literature.( 25 ) Specifically, we observe reduced immunopathology in H2D1−/− mice following CTL depletion. However, the strength of the CTL response is also mediated by NK‐cell activation.( 39 , 40 , 43 , 44 ) As in human hepatic viral infections, inhibitory NK‐cell receptor expression and their ligands, the HLA‐C group 1 alleles are beneficial for viral clearance.( 45 ) The HLA‐C1 allele is only effective in HCV clearance when KIR2DL3 but not KIR2DL2 is expressed.( 45 ) Notably, expression of other HLA molecules including HLA‐B*27, HLA‐B*57, and HLA‐B*15 are also associated with HCV clearance.( 19 ) Whether these correlations are mechanistically mediated by NK cell–T cell interaction, or even direct T‐cell interaction, remains to be further studied.( 46 ) Overall, these data support the conclusion that expression of MHC‐I molecules can affect the outcome of a viral infection, and this equilibrium is further triggered by CTL and NK cell immunity (Fig. 7).
Taken together, we show that diverse expression of MHC‐I molecules can prevent virus‐induced, CTL‐mediated liver immunopathology during chronic LCMV infection.
Supporting information
Fig S1
Fig S2
Fig S3
Fig S4
Fig S5
Fig S6
Fig S7
Fig S8
Xu HC, Huang J, Pandyra AA, Pandey P, Wang R, Zhang Z, et al. Single MHC‐I Expression Promotes Virus‐Induced Liver Immunopathology. Hepatol Commun. 2022;6:1620–1633. 10.1002/hep4.1913
References
Author names in bold designate shared co‐first authorship.
- 1. Protzer U, Maini MK, Knolle PA. Living in the liver: hepatic infections. Nat Rev Immunol 2012;12:201‐213. [DOI] [PubMed] [Google Scholar]
- 2. Bechmann LP, Hannivoort RA, Gerken G, Hotamisligil GS, Trauner M, Canbay A. The interaction of hepatic lipid and glucose metabolism in liver diseases. J Hepatol 2012;56:952‐964. [DOI] [PubMed] [Google Scholar]
- 3. Reinke H, Asher G. Circadian clock control of liver metabolic functions. Gastroenterology 2016;150:574‐580. [DOI] [PubMed] [Google Scholar]
- 4. Macpherson AJ, Heikenwalder M, Ganal‐Vonarburg SC. The liver at the nexus of host‐microbial interactions. Cell Host Microbe 2016;20:561‐571. [DOI] [PubMed] [Google Scholar]
- 5. Rehermann B. Pathogenesis of chronic viral hepatitis: differential roles of T cells and NK cells. Nat Med 2013;19:859‐868. [DOI] [PMC free article] [PubMed] [Google Scholar]
- 6. Rehermann B, Nascimbeni M. Immunology of hepatitis B virus and hepatitis C virus infection. Nat Rev Immunol 2005;5:215‐229. [DOI] [PubMed] [Google Scholar]
- 7. Knolle PA. Staying local‐antigen presentation in the liver. Curr Opin Immunol 2016;40:36‐42. [DOI] [PubMed] [Google Scholar]
- 8. Huang L‐R, Wohlleber D, Reisinger F, Jenne CN, Cheng R‐L, Abdullah Z, et al. Intrahepatic myeloid‐cell aggregates enable local proliferation of CD8(+) T cells and successful immunotherapy against chronic viral liver infection. Nat Immunol 2013;14:574‐583. [DOI] [PubMed] [Google Scholar]
- 9. Benseler V, Warren A, Vo M, Holz LE, Tay SS, Le Couteur DG, et al. Hepatocyte entry leads to degradation of autoreactive CD8 T cells. Proc Natl Acad Sci U S A 2011;108:16735‐16740. [DOI] [PMC free article] [PubMed] [Google Scholar]
- 10. Böttcher J, Schanz O, Wohlleber D, Abdullah Z, Debey‐Pascher S, Staratschek‐Jox A, et al. Liver‐primed memory T cells generated under noninflammatory conditions provide anti‐infectious immunity. Cell Rep 2013;3:779‐795. [DOI] [PubMed] [Google Scholar]
- 11. Mueller SN, Ahmed R. High antigen levels are the cause of T cell exhaustion during chronic viral infection. Proc Natl Acad Sci U S A 2009;106:8623‐8628. [DOI] [PMC free article] [PubMed] [Google Scholar]
- 12. Moskophidis D, Lechner F, Pircher H, Zinkernagel RM. Virus persistence in acutely infected immunocompetent mice by exhaustion of antiviral cytotoxic effector T cells. Nature 1993;362:758‐761. [DOI] [PubMed] [Google Scholar]
- 13. McDevitt HO. Discovering the role of the major histocompatibility complex in the immune response. Annu Rev Immunol 2000;18:1‐17. [DOI] [PubMed] [Google Scholar]
- 14. Singh R, Kaul R, Kaul A, Khan K. A comparative review of HLA associations with hepatitis B and C viral infections across global populations. World J Gastroenterol 2007;13:1770‐1787. [DOI] [PMC free article] [PubMed] [Google Scholar]
- 15. Thursz MR, Thomas HC, Greenwood BM, Hill AV. Heterozygote advantage for HLA class‐II type in hepatitis B virus infection. Nat Genet 1997;17:11‐12. [DOI] [PubMed] [Google Scholar]
- 16. Hraber P, Kuiken C, Yusim K. Evidence for human leukocyte antigen heterozygote advantage against hepatitis C virus infection. Hepatology 2007;46:1713‐1721. [DOI] [PubMed] [Google Scholar]
- 17. Carrington M, Nelson GW, Martin MP, Kissner T, Vlahov D, Goedert JJ, et al. HLA and HIV‐1: heterozygote advantage and B*35‐Cw*04 disadvantage. Science 1999;283:1748‐1752. [DOI] [PubMed] [Google Scholar]
- 18. Patel K, Norris S, Lebeck L, Feng A, Clare M, Pianko S, et al. HLA class I allelic diversity and progression of fibrosis in patients with chronic hepatitis C. Hepatology 2006;43:241‐249. [DOI] [PubMed] [Google Scholar]
- 19. Nitschke K, Luxenburger H, Kiraithe MM, Thimme R, Neumann‐Haefelin C. CD8+ T‐cell responses in hepatitis B and C: the (HLA‐) A, B, and C of hepatitis B and C. Dig Dis 2016;34:396‐409. [DOI] [PubMed] [Google Scholar]
- 20. Liang TJ, Block TM, McMahon BJ, Ghany MG, Urban S, Guo J‐T, et al. Present and future therapies of hepatitis B: from discovery to cure. Hepatology 2015;62:1893‐1908. [DOI] [PMC free article] [PubMed] [Google Scholar]
- 21. Baumert TF, Fauvelle C, Chen DY, Lauer GM. A prophylactic hepatitis C virus vaccine: a distant peak still worth climbing. J Hepatol 2014;61:S34‐S44. [DOI] [PubMed] [Google Scholar]
- 22. Thimme R, Wieland S, Steiger C, Ghrayeb J, Reimann KA, Purcell RH, et al. CD8(+) T cells mediate viral clearance and disease pathogenesis during acute hepatitis B virus infection. J Virol 2003;77:68‐76. [DOI] [PMC free article] [PubMed] [Google Scholar]
- 23. Lechner F, Wong DKH, Dunbar PR, Chapman R, Chung RT, Dohrenwend P, et al. Analysis of successful immune responses in persons infected with hepatitis C virus. J Exp Med 2000;191:1499‐1512. [DOI] [PMC free article] [PubMed] [Google Scholar]
- 24. Pérarnau B, Saron M‐F, San Martin BR, Bervas N, Ong H, Soloski MJ, et al. Single H2Kb, H2Db and double H2KbDb knockout mice: peripheral CD8+ T cell repertoire and anti‐lymphocytic choriomeningitis virus cytolytic responses. Eur J Immunol 1999;29:1243‐1252. [DOI] [PubMed] [Google Scholar]
- 25. Zinkernagel RM, Haenseler E, Leist T, Cerny A, Hengartner H, Althage A. T cell‐mediated hepatitis in mice infected with lymphocytic choriomeningitis virus. Liver cell destruction by H‐2 class I‐restricted virus‐specific cytotoxic T cells as a physiological correlate of the 51Cr‐release assay? J Exp Med 1986;164:1075‐1092. [DOI] [PMC free article] [PubMed] [Google Scholar]
- 26. Lang PA, Recher M, Haussinger D, Lang KS. Genes determining the course of virus persistence in the liver: lessons from murine infection with lymphocytic choriomeningitis virus. Cell Physiol Biochem 2010;26:263‐272. [DOI] [PubMed] [Google Scholar]
- 27. Masopust D, Murali‐Krishna K, Ahmed R. Quantitating the magnitude of the lymphocytic choriomeningitis virus‐specific CD8 T‐cell response: it is even bigger than we thought. J Virol 2007;81:2002‐2011. [DOI] [PMC free article] [PubMed] [Google Scholar]
- 28. Lang PA, Contaldo C, Georgiev P, El‐Badry AM, Recher M, Kurrer M, et al. Aggravation of viral hepatitis by platelet‐derived serotonin. Nat Med 2008;14:756‐761. [DOI] [PubMed] [Google Scholar]
- 29. Xu H, Grusdat M, Pandyra A, Polz R, Huang J, Sharma P, et al. Type I interferon protects antiviral CD8+ T cells from NK cell cytotoxicity. Immunity 2014;40:949‐960. [DOI] [PubMed] [Google Scholar]
- 30. Gautheron J, Gores GJ, Rodrigues CMP. Lytic cell death in metabolic liver disease. J Hepatol 2020;73:394‐408. [DOI] [PMC free article] [PubMed] [Google Scholar]
- 31. Iwamoto N, Ito H, Ando K, Ishikawa T, Hara A, Taguchi A, et al. Upregulation of indoleamine 2,3‐dioxygenase in hepatocyte during acute hepatitis caused by hepatitis B virus‐specific cytotoxic T lymphocytes in vivo. Liver Int 2009;29:277‐283. [DOI] [PubMed] [Google Scholar]
- 32. Rua R, Lee JY, Silva AB, Swafford IS, Maric D, Johnson KR, et al. Infection drives meningeal engraftment by inflammatory monocytes that impairs CNS immunity. Nat Immunol 2019;20:407‐419. [DOI] [PMC free article] [PubMed] [Google Scholar]
- 33. Wohlleber D, Kashkar H, Gärtner K, Frings M, Odenthal M, Hegenbarth S, et al. TNF‐induced target cell killing by CTL activated through cross‐presentation. Cell Rep 2012;2:478‐487. [DOI] [PubMed] [Google Scholar]
- 34. Guidotti L, Inverso D, Sironi L, Di Lucia P, Fioravanti J, Ganzer L, et al. Immunosurveillance of the liver by intravascular effector CD8(+) T cells. Cell 2015;161:486‐500. [DOI] [PubMed] [Google Scholar]
- 35. Lakhani SA, Masud A, Kuida K, Porter GA, Booth CJ, Mehal WZ, et al. Caspases 3 and 7: key mediators of mitochondrial events of apoptosis. Science 2006;311:847‐851. [DOI] [PMC free article] [PubMed] [Google Scholar]
- 36. Brenner D, Blaser H, Mak TW. Regulation of tumour necrosis factor signalling: live or let die. Nat Rev Immunol 2015;15:362‐374. [DOI] [PubMed] [Google Scholar]
- 37. Karki R, Sharma BR, Tuladhar S, Williams EP, Zalduondo L, Samir P, et al. COVID‐19 cytokines and the hyperactive immune response: synergism of TNF‐alpha and IFN‐gamma in triggering inflammation, tissue damage, and death. bioRxiv 2020. [Google Scholar]
- 38. Jordan MB, Hildeman D, Kappler J, Marrack P. An animal model of hemophagocytic lymphohistiocytosis (HLH): CD8+ T cells and interferon gamma are essential for the disorder. Blood 2004;104:735‐743. [DOI] [PubMed] [Google Scholar]
- 39. Lang PA, Lang KS, Xu HC, Grusdat M, Parish IA, Recher M, et al. Natural killer cell activation enhances immune pathology and promotes chronic infection by limiting CD8+ T‐cell immunity. Proc Natl Acad Sci U S A 2012;109:1210‐1215. [DOI] [PMC free article] [PubMed] [Google Scholar]
- 40. Waggoner SN, Cornberg M, Selin LK, Welsh RM. Natural killer cells act as rheostats modulating antiviral T cells. Nature 2011;481:394‐398. [DOI] [PMC free article] [PubMed] [Google Scholar]
- 41. Cook KD, Whitmire JK. The depletion of NK cells prevents T cell exhaustion to efficiently control disseminating virus infection. J Immunol 2013;190:641‐649. [DOI] [PMC free article] [PubMed] [Google Scholar]
- 42. Zimmer J, Andres E, Donato L, Hanau D, Hentges F, de la Salle H. Clinical and immunological aspects of HLA class I deficiency. QJM 2005;98:719‐727. [DOI] [PubMed] [Google Scholar]
- 43. Boni C, Lampertico P, Talamona L, Giuberti T, Invernizzi F, Barili V, et al. Natural killer cell phenotype modulation and natural killer/T‐cell interplay in nucleos(t)ide analogue‐treated hepatitis e antigen‐negative patients with chronic hepatitis B. Hepatology 2015;62:1697‐1709. [DOI] [PubMed] [Google Scholar]
- 44. Peppa D, Gill US, Reynolds G, Easom NJW, Pallett LJ, Schurich A, et al. Up‐regulation of a death receptor renders antiviral T cells susceptible to NK cell‐mediated deletion. J Exp Med 2013;210:99‐114. [DOI] [PMC free article] [PubMed] [Google Scholar]
- 45. Khakoo SI, Thio CL, Martin MP, Brooks CR, Gao X, Astemborski J, et al. HLA and NK cell inhibitory receptor genes in resolving hepatitis C virus infection. Science 2004;305:872‐874. [DOI] [PubMed] [Google Scholar]
- 46. Seich Al Basatena NK, Macnamara A, Vine AM, Thio CL, Astemborski J, Usuku K, et al. KIR2DL2 enhances protective and detrimental HLA class I‐mediated immunity in chronic viral infection. PLoS Pathog 2011;7:e1002270. [DOI] [PMC free article] [PubMed] [Google Scholar]
Associated Data
This section collects any data citations, data availability statements, or supplementary materials included in this article.
Supplementary Materials
Fig S1
Fig S2
Fig S3
Fig S4
Fig S5
Fig S6
Fig S7
Fig S8


