

Abstract
Objective:
While the overall health system burden of alcohol is large and increasing in Canada, little is known about how this burden differs by sociodemographic factors. The objectives of this study were to assess sociodemographic patterns and temporal trends in emergency department (ED) visits due to alcohol to identify emerging and at-risk subgroups.
Methods:
We conducted a retrospective population-level cohort study of all individuals aged 10 to 105 living in Ontario, Canada. We identified ED visits due to alcohol between 2003 and 2017 using defined International Classification of Diseases, 10th edition, codes from a pre-existing indicator. We calculated annual age- and sex-standardized, and age- and sex-specific rates of ED visits and compared overall patterns and changes over time between urban and rural settings and income quintiles.
Results:
There were 829,662 ED visits due to alcohol over 15 years. Rates of ED visits due to alcohol were greater for individual living in the lowest- compared to the highest-income quintile neighbourhoods, and disparities (rate ratio lowest to highest quintile) increased with age from 1.22 (95% CI, 1.19 to 1.25) in 15- to 18-year-olds to 4.17 (95% CI, 4.07 to 4.28) in 55- to 59-year-olds. Rates of ED visits due to alcohol were significantly greater in rural settings (56.0 per 10,000 individuals, 95% CI, 55.7 to 56.4) compared to urban settings (44.8 per 10,000 individuals, 95% CI, 44.7 to 44.9), particularly for young adults. Increases in rates of visits between 2003 and 2017 were greater in rural versus urban settings (82 vs. 68% increase in age- and sex-standardized rates) and varied across sociodemographic subgroups with the largest annual increases in rates of visits in young (15 to 29) low-income women (6.9%, 95%CI, 6.7 to 7.3) and the smallest increase in older (45 to 59) high-income men (2.7, 95%CI, 2.4 to 3.0).
Conclusion:
Alcohol harms display unique patterns with the highest burden in rural and lower-income populations. Rural–urban and income-based disparities differ by age and sex and have increased over time, which offers an imperative and opportunity for further interventions by clinicians and policy makers.
Keywords: alcohol, rural, emergency department visits, epidemiology, ICES, problematic substance use
Abrégé
Objectif:
Bien que la charge de l’alcool sur le système de santé en général au Canada soit importante et s’accroisse, on en sait peu sur la façon dont cette charge diffère selon les facteurs sociodémographiques. La présente étude avait pour objectifs d’évaluer les modèles sociodémographiques et les tendances temporelles des visites au service d’urgence (SU) attribuables à l’alcool pour repérer les sous-groupes émergents et à risque.
Méthodes:
Nous avons mené une étude de cohorte rétrospective dans la population de toutes les personnes de 10 à 105 ans habitant en Ontario, Canada. Nous avons identifié les visites au SU attribuables à l’alcool entre 2003 et 2017 à l’aide des codes définis de la CIM-10 d’un indicateur préexistant. Nous avons calculé les taux normalisés selon l’âge et le sexe et spécifiques pour l’âge et le sexe des visites au SU et comparé les modèles et les changements globaux au fil du temps entre les milieux urbains et ruraux et les quintiles de revenu.
Résultats:
Il y avait 829 662 visites au SU attribuables à l’alcool sur 15 ans. Les taux des visites au SU attribuables à l’alcool étaient les plus grands pour les personnes vivant dans des quartiers au quintile de revenu le plus faible comparé au plus élevé, et les disparités (Taux Ratio du quintile le plus bas au quintile le plus élevé) augmentaient avec l’âge de 1,22 (IC à 95% 1,19 à 1,25) chez les 15 à 18 ans à 4,17 (IC à 95% 4,07 à 4,28) chez les 55 à 59 ans. Les taux des visites au SU attribuables à l’alcool étaient significativement plus grands dans les milieux ruraux (56,0 par 10 000 personnes, IC à 95% 55,7 à 56,4) comparativement aux milieux urbains (44,8 par 10 000 personnes, IC à 95% 44,7 à 44,9), particulièrement pour les jeunes adultes. Les augmentations des taux de visites entre 2003 et 2017 étaient plus importantes dans les milieux ruraux plutôt qu’urbains (augmentation de 82 c. 68% dans les taux normalisés selon l’âge et le sexe) et variaient dans les sous-groupes sociodémographiques; les augmentations annuelles les plus importantes se situant dans les taux de visites des jeunes (15-29) femmes à faible revenu (6,9%, IC à 95% 6,7 à 7,3) et l’augmentation la plus faible chez les hommes âgés (45-59) au revenu élevé (2,7, IC à 95% 2,4 à 3,0).
Conclusion:
Les méfaits de l’alcool démontrent des modèles uniques, la charge la plus élevée portant sur les populations à faible revenu en milieu rural. Les disparités rurales et urbaines diffèrent selon l’âge et le sexe et ont augmenté avec le temps, ce qui offre un impératif et une occasion d’autres interventions par des cliniciens et des décideurs.
Introduction
Alcohol use has negative impacts on the health of Canadians and is a leading cause of death and disability in Canada and globally. 1 A growing body of evidence has documented that morbidity and mortality from alcohol have increased in high-income countries, particularly in Canada and the United States. 2 –5 Several recent studies have found that alcohol-related health-care visits have been disproportionately increasing in younger adults and women. 2,4,6 Evidence from the United States has also highlighted how deaths from drug and alcohol poisonings and alcoholic liver disease have been increasing faster in rural compared to urban America particularly among younger (aged 35 to 44) Caucasian individuals. 7 In Canada, there is a general understanding that certain sociodemographic groups experience a higher burden of alcohol harms (e.g., low-income individuals and middle-aged men) and larger increases in harms over time (e.g., women and young adults). However, there is a limited knowledge about alcohol-related harms in rural populations in Canada as well as less understanding of trends in socioeconomic and geographic disparities over time. In light of a growing epidemic of alcohol-related harms, such data are urgently needed to identify gaps in the delivery of clinical services and better target alcohol control policies based on evidence.
Multiple studies and reports have documented that alcohol-related harms are generally greater for lower-income individuals in Canada and internationally. 8,9 Problematic alcohol use and hospitalizations due to alcohol are also higher in rural areas of Canada. 8 However, almost no data are available on how these geographic and socioeconomic disparities differ by sex and age. 8,10 In addition, contemporary data are lacking whether income and geographic disparities are widening over time, as seen in the United States, and their potential contribution to the observed increases in alcohol harms in Canada. 10 In this study, we examined rates of emergency department (ED) visits due to alcohol by sex, age, neighbourhood income quintiles, and rurality of individuals. We described how the rates of ED visits due to alcohol in subpopulations changed over a 15-year time period by examining trends in rates of visits in Ontario, Canada, between 2003 and 2017. Finally, we examined the interactions among these sociodemographic factors (e.g., young women living in low-income and rural regions) to identify populations with the greatest rates of ED visits due to alcohol. We chose to examine ED visits due to alcohol as both a measure of the burden of alcohol on our health systems and as repeat visits have recently been found to be strongly associated with increased risk of mortality. 11
Methods
Study Design and Population
We conducted a retrospective population-level study in Ontario, Canada. We used linked administrative data collected from the province’s universal health-care system. We created 15 consecutive and contiguous annual cohorts between the years 2003 and 2017. Each year, all Ontario residents between the ages of 10 and 105 (as of July 1 of the calendar year) who were eligible for provincial health insurance were included in the study. Individuals were assessed each year and excluded from that year if they were missing data on age, sex, neighbourhood income, or rurality. Overall, 182,345 individuals (1.18% of eligible Ontarians) were excluded in one or more study years due to missing data. Furthermore, 5,060 individuals (0.03%) were missing one or more covariates in all years of eligibility and, therefore, entirely excluded from the study. In total, our study included 15,444,489 unique individuals.
Data Sources and Covariates
We used the following datasets: (1) the National Ambulatory Care Reporting System database, which contains complete records from all ED visits in Ontario 12 ; (2) the Ontario Registered Persons Database, a registry of all individuals eligible for the provincial health insurance plan containing individual demographic information; (3) the Postal Code Conversion File Plus (PCCF+), which contains information on individuals’ neighbourhood income and the rurality of their home address. We used the Statistics Canada census definition for rurality, which defines a rural residence as living in a town or municipality outside of the commuting zone of census metropolitan areas (CMA, population of 100,000 or more) or census agglomeration (CA, population of 10,000 or more). 13 We characterized neighbourhood income using the Quintile of Annual Income Per Person Equivalent (QAIPPE) from the PCCF+. QAIPPE divides neighbourhoods into quintiles based on the average before-tax income, which is adjusted for household size and is relative to other neighbourhoods either within the same CMA or CA or in rural Ontario. 14
Outcomes
Our primary outcome was an ED visit due to alcohol, defined using the Canadian Institute for Health Information’s indicator on “hospitalizations entirely due to alcohol.” 15 ED visits due to alcohol were identified using diagnostic codes from the 10th edition of the International Classification of Diseases (ICD-10); see Online Appendix A for the list of ICD-10 codes. Visits were included when an ICD-10 code from the indicator was listed as the main reason for the visit or having contributed to the visit. Our secondary outcome was “all-cause” or ED visit for any reason.
Statistical Analyses
We present descriptive statistics to characterize and compare the rates of ED visits due to alcohol across age groups, sex, and neighbourhood income quintiles. We calculated event rates as the number of events in the population divided by the number of individuals in the population on July 1 of that year. Rates were directly standardized by age and sex using the latest Census (2016 Census) population as the reference. We present rate ratios (RRs) with 95% confidence intervals to compare crude rates of ED visits due to alcohol between the lowest- and highest-neighbourhood-income quintiles for different subgroups (e.g., men and women, urban and rural and by age).
We examined temporal trends using age- and sex-stratified Poisson regression models. We categorized age into 3 groups (ages 15 to 29, 30 to 44, and 45 to 59). These age groups were selected to allow examination of differences in the burden of visits at different life stages of adulthood and to allow sufficient visits per subgroup for stable rates. We assessed trends in each subgroup by running stratified models examining the count of ED visits, the years of observation (specified as a continuous variable), and the population of the subgroup (e.g., number of highest-neighbourhood-income quintile urban men). We interpreted the incident RRs obtained from the time covariate in our Poisson models as the average annual change in the rate of hospitalizations. All tests were 2-sided, and P values less than 0.05 were considered significant. Statistical analyses were performed using SAS version 9.4 statistical software.
Results
There were 829,662 ED visits due to alcohol over the 15-year study period. Visits due to alcohol were greater for individuals in the lowest-neighbourhood-income quintile (35% of visits, n = 293,233), who experienced 2.5 times the number of visits due to alcohol than individuals in the highest-neighbourhood-income quintile (13.5% of visits, n = 112,336). The disparity by neighbourhood income quintiles was greater for men (2.9 times) than women (2.1 times; see Table 1).
Table 1.
Characteristics of Ontario Residents Who Visited the Emergency Department because of Alcohol Use (2003 to 2017).a
| Characteristic | No. (%) of All Patients | No. (%) of All Patients | ||||
|---|---|---|---|---|---|---|
| Women | Men | |||||
| Q1 (Lowest), n = 34,596 | Q5 (Highest), n = 23,073 | Standardized Difference | Q1 (Lowest), n = 61,906 | Q5 (Highest), n = 34,320 | Standardized Difference | |
| No. of visits due to alcohol use (% of total visits due to alcohol over study) | 88,879 (10.7) | 41,983 (5.0) | — | 203,543 (24.5) | 69,614 (8.4) | — |
| Age at first visit, yr | ||||||
| Age, mean ± SD | 34.9 ± 17.5 | 32.7 ± 18.5 | .12 | 39.9 ± 17.5 | 36.6 ± 18.7 | .18 |
| 10 to 18b | 6,269 (18.1) | 6,488 (28.1) | .24 | 5,948 (9.6) | 6,223 (18.1) | .25 |
| 19 to 29 | 10,812 (31.3) | 6,930 (30.0) | .03 | 16,153 (26.1) | 10,234 (29.8) | .08 |
| 30 to 39 | 4,715 (13.6) | 2,150 (9.3) | .14 | 9,349 (15.1) | 3,845 (11.2) | .12 |
| 40 to 49 | 5,279 (15.3) | 2,624 (11.4) | .11 | 11,203 (18.1) | 4,664 (13.6) | .12 |
| 50 to 59 | 3,886 (11.2) | 2,379 (10.3) | .03 | 9,946 (16.1) | 4,435 (12.9) | .09 |
| 60+ | 3,635 (10.5) | 2,502 (10.8) | .01 | 9,307 (15.0) | 4,919 (14.3) | .02 |
| No. of all-cause ED visits in year of initial visit, mean ± SD | 3.3 ± 4.9 | 2.3 ± 3.2 | .23 | 3.0 ± 4.9 | 2.3 ± 3.2 | .16 |
| No. of ED visits due to alcohol in the year of initial visit, mean ± SD | 1.2 ± 0.9 | 1.1 ± 0.6 | .07 | 1.2 ± 1.2 | 1.2 ± 0.8 | .08 |
| 1 visit | 31,063 (89.8) | 21,249 (92.1) | .08 | 54,305 (87.7) | 31,219 (91.0) | .11 |
| 2 visits | 2,463 (7.1) | 1,334 (5.8) | .05 | 5,111 (8.3) | 2,193 (6.4) | .07 |
| 3 visits | 581 (1.7) | 290 (1.3) | .04 | 1,220 (2.0) | 483 (1.4) | .04 |
| ≥4 visits | 489 (1.4) | 200 (0.9) | .05 | 1,270 (2.1) | 425 (1.2) | .06 |
| No. of visits due to alcohol in rural settings (% of visits in column) | 5,246 (15.2) | 3,061 (13.3) | .05 | 8,620 (13.9) | 4,909 (14.3) | .01 |
a The characteristics (age, sex, income quintile, rurality, and number of ED visits) of individuals with 1 ED visit due to alcohol during the study were determined at the time of the visit. Characteristics of individuals who had multiple visits (multiple visits in the same year or visits over multiple years) were counted 1 time at the time of the first visit in the study.
b19 is the legal drinking age in Ontario.
Age and Sex Differences in Geographic and Neighbourhood Income Disparities
Figure 1 depicts the influence of age and sex on the relationship between neighbourhood income and rates of ED visits due to alcohol. For both men and women, neighbourhood income–based disparities in rates of ED visits due to alcohol increased with age. The RR between rates of ED visits due to alcohol for individuals living in the lowest- compared to the highest-neighbourhood-income quintiles was 1.22 (95% CI, 1.19 to 1.25) for those aged 15 to 18, 2.45 (95% CI, 2.38 to 2.51) for those aged 30 to 34, 4.17 (95% CI, 4.07 to 4.28) for those aged 55 to 59, and 2.51 (95% CI, 2.45 to 2.57) for those aged 65+.
Figure 1.

Rates of emergency department (ED) due to alcohol across 5 income quintiles (Q1 = poorest quintile and Q5 = wealthiest quintile), overall for all years (2003 to 2017) in 5-year age increments for men and women.
Sex also modified the relationship between age, neighbourhood income, and ED visits due to alcohol. Among individuals aged 15 to 29, the RRs for the lowest- versus highest-neighbourhood-income quintiles was similar for men (1.56, 95% CI, 1.54 to 1.58) and women (1.47, 95% CI, 1.41 to 1.45). In comparison, among individuals aged 45 to 59, the RR for lowest- versus highest-neighbourhood-income quintiles was greater in men (4.35, 95% CI, 4.29 to 4.41) than women (3.05, 95% CI, 2.99 to 3.11). Age and sex did not modify disparities between lowest- and highest-income neighbourhoods for all-cause ED visits (see Online Appendix B Figure 1). Much of the disparities in ED visits related to neighbourhood income was related to being in the lowest-income quintile. For example, among men aged 45 to 59, each quintile decrease in neighbourhood income from Q5 (highest) to Q2 (second lowest) was on average associated with a 1.30 times (95% CI, 1.27 to 1.33) increase in rates of ED visits due to alcohol. In contrast, the decrease in neighbourhood income from the second lowest to lowest quintile was associated with a 1.98 (95% CI, 1.94 to 2.02) increase in the rate of ED visits.
Figure 2 depicts the influence of age and sex on the geographic disparities in rates of ED visits due to alcohol. Overall, the age- and sex-standardized rate of ED visits due to alcohol per 10,000 individuals was greater in rural (56.0, 95% CI, 55.7 to 56.4) than in urban (44.8, 95% CI, 44.7 to 44.9) regions. The rate of ED visits due to alcohol per 10,000 individuals for those aged 10 to 29 was 42.3% higher in rural (62.0, 95% CI, 61.4 to 62.7) compared to urban regions (43.9, 95% CI, 43.7 to 44.1). In contrast, the rate among those aged 40 or older in rural (46.1, 95% CI, 45.7 to 46.5) and urban regions (46.2, 95% CI, 46.1 to 46.3) was comparable.
Figure 2.
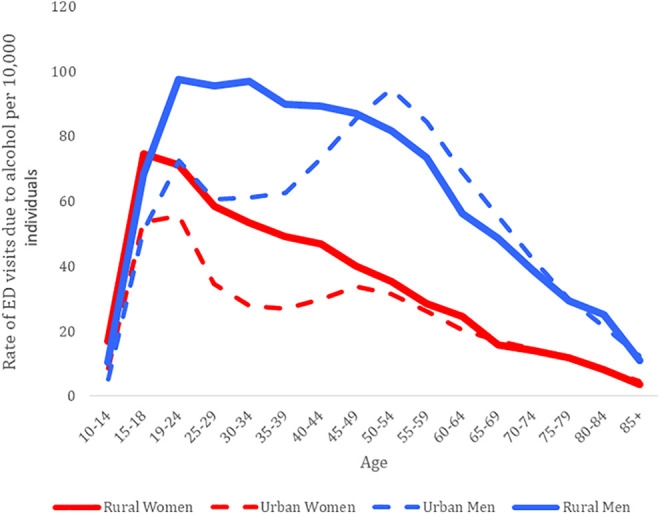
Rates of emergency department (ED) visits due to alcohol depicting the unadjusted rates of visits in urban and rural settings, overall for all years (2003 to 2017) in 5-year age increments for men and women.
Interaction of Risk Factors and High-risk Groups
Figure 3 shows the interaction between age, sex, neighbourhood income, and geography on rates of ED visits due to alcohol in the year 2017. We found that among youth and young adults (aged 15 to 29), the neighbourhood income gradient (i.e., RR comparing the lowest to the highest quintile) was greater in rural (RR: 2.83, 95% CI, 2.53 to 3.17) compared to urban regions (RR: 1.54, 95% CI, 1.47 to 1.61). Among those aged 30 to 44, the neighbourhood income gradient was greater in rural compared to urban regions, particularly in women (RR: 3.17, 95% CI, 2.90 to 3.45 for urban women vs. 8.03 95% CI, 6.24 to 10.35 for rural women in this age group only). Finally, among middle-aged adults (aged 45 to 59), we observed a larger neighbourhood income gradient for men in urban (RR: 5.57, 95% CI, 5.25 to 5.91) compared to rural settings (RR: 3.27, 95% CI, 2.83 to 3.77).
Figure 3.

Rates of emergency department (ED) visits due to alcohol for men and women aged 15 to 29, 30 to 44, and 45 to 54, living in urban or rural settings in 2017. Rate ratios with 95 percent confidence intervals between the lowest (Q1)-neighbourhood-income quintile and highest (Q5)-neighbourhood-income quintile are presented above the bars.
Temporal Changes for Lowest and Highest Neighbourhood Income and Urban and Rural Regions
Figure 4 shows how rates of ED visits due to alcohol have changed over time. Annual rates increased significantly in all 24 subgroups over our study period. The increases in visits, between 2003 and 2017, were greater in rural compared to urban settings (82% vs. 68% increase in age- and sex-standardized rates); this may be attributable to the relatively larger increase in age-standardized rates among women (114% rural vs. 85% urban) compared to men (60% rural vs. 63% urban). The greatest increase in rates of annual visits was women aged 15 to 29 living in the lowest-neighbourhood-income quintile (6.9% average increase per year, 95% CI, 6.7 to 7.3), while the smallest relative increase in rates was in men aged 45 to 59 living in the highest-neighbourhood-income quintile (2.7% average increase per year, 95% CI, 2.4 to 3.0).
Figure 4.

Changes in rates of emergency department visits due to alcohol for men and women in 3 age groups (15 to 29, 30 to 44, and 45 to 59) between urban and rural settings and for the lowest-income quintile (Q1) and the highest-income quintile (Q5) across 4 cross-sectional time periods (2003 to 2005, 2007 to 2009, 2011 to 2013, and 2015 to 2017). A test of linear trend (year as a continuous variable) for change in rates of visits for each group was significant.
We note 2 key trends; first, by 2017, neighbourhood income became a stronger indicator of rates of visits due to alcohol than sex. The rates of visits in lowest-neighbourhood-income women were 1.54 (95% CI, 1.48 to 1.59) times greater than in highest-neighbourhood-income men. Second, increases in ED visits were evenly distributed across age groups in lowest-neighbourhood-income individuals but concentrated in young adults in highest-neighbourhood-income individuals. For example, between 2003 and 2017, men aged 15 to 29 were responsible for 39% (1,099 visits) of the total increase in ED visits due to alcohol that occurred in the highest-neighbourhood-income quintile (2,823 visits) compared to 21% (2,129) of the total increase that occurred in lowest-neighbourhood-income quintile (10,208 visits; see Online Appendix B Figure 2).
Interpretation
We found that individuals living in the lowest-income neighbourhoods and rural individuals experience far greater burden from ED visits due to alcohol than urban or highest-income-neighbourhood individuals. Importantly, these disparities were modified by age and sex. Neighbourhood income disparities were minimal in younger adults while in older age groups, especially men, those living in lowest-income neighbourhoods had much higher rates than those in highest-income neighbourhoods. In contrast, urban–rural disparities were greater in youth compared to older adults. The demographics of individuals experiencing an ED visit due to alcohol have changed over time, with the greatest increases occurring in rural compared to urban settings for young individuals living in the lowest-income neighbourhoods and the smallest increases occurring in older adults living in highest-income neighbourhoods.
Our findings of neighbourhood income–based disparities are consistent with a large body of international work showing that individuals of lower socioeconomic status experience greater harms from alcohol. 16,17 Adding to the literature, we found that alcohol-related disparities in ED visits increase with age, particularly in men. A potential explanation for these findings may be a greater accumulation of comorbid conditions or social circumstances in lower-income individuals over time, which may decrease their resiliency to or increase the consequences of heavy drinking. 18 This possibility is supported by multiple studies showing that despite experiencing greater alcohol-related harms, alcohol consumption is generally lower or comparable in lower socioeconomic groups than individuals with higher socioeconomic status. 19 This finding may also partially be the result of reverse causation, where adults who display harmful patterns of alcohol consumption gravitate to low-income areas over time—a pattern that could worsen with age. 17 Individuals of lower socioeconomic status have almost universally been found to have worse health outcomes; our results also indicate larger income-based disparities in ED visits due to alcohol than in rates of all-cause ED visits, especially in older adults—a finding that requires further investigation.
We found that rates of ED visits due to alcohol were higher in rural compared to urban regions of Ontario. These observations are consistent with surveys of drinking behaviour, which have found that high-risk drinking is more prevalent in residents of rural areas, particularly youth, see Online Appendix C for further details. 19,20 While there is little research into potential contributing factors, they are likely influenced by differences in demographic makeup and socioeconomic factors. There is also evidence demonstrating distinct drinking cultures across urban and rural Canada, with rural school-aged youth reporting greater alcohol-impaired driving and heavy drinking than their urban counterparts. 21,22 Further, important considerations are how government policies, such as alcohol pricing and the availability of alcohol stores, may promote harmful drinking in rural settings. 23,24 Policies that increase the price of alcohol have been shown to reduce alcohol use and harms, particularly for high-risk drinkers. 23 Alcohol policies in Ontario maintain the same alcohol pricing in rural and urban regions 25 while other household commodities, which are typically not price-controlled, are more expensive in rural and northern areas of Ontario compared to urban regions. 26 These policies may both make alcohol more affordable (e.g., less expensive) in rural regions than it would be in their absence and create a relative price difference between alcohol and other goods making alcohol purchases feel more affordable and appealing. Greater access to off-premise stores (i.e. liquor stores) has previously been shown to increase alcohol use and consequent harms. 24 Public health units (PHUs) in rural Ontario have over 2.5 times more off-premise alcohol stores per capita than urban and mainly urban PHUs (4.00 vs. 1.50 stores per 10,000 individuals in 2014), which may be contributing to urban–rural disparities. 26
To our knowledge, this is the first study to examine changes over time in health-care visits due to alcohol in rural regions of Canada. We observed a greater increase in alcohol harms in rural compared to urban Ontario, which is consistent with data showing that high-risk drinking in rural regions has increased significantly over time while remaining steady in urban regions. 19,20 The cause of this increasing disparity in Canada is unknown but mirrors a number of studies from the United States showing a widening urban–rural gap in mortality related to suicides, drug poisoning, and alcohol liver disease collectively known as “deaths of despair.” 27 Increasing deaths of despair in the rural United States have been attributed to a growing socioeconomic gulf, including growing poverty and unemployment and lack of social opportunity. 7 Available information supports that similar patterns may be occurring in rural Ontario where rural men have experienced almost no increase in wages between 2001 and 2015 and rural regions have seen greater declines in labour force participation than urban regions. 28
Our findings highlight that further health service and policy interventions are required to reduce rising alcohol-related harms in Ontario. Screening for problematic alcohol use and offering counselling and referral for treatment in high-risk patients is an effective but underutilized intervention to reduce alcohol harms. 29,30,31 Our study has identified several groups that may benefit from improved access to screening and addiction service, including women living in low-income neighbourhoods who now experience higher rates of harms than men living in high-income neighbourhoods; younger individuals in rural and remote settings, where harms are rapidly increasing; and older men in lower-income neighbourhoods who have the greatest overall burden of harms. Importantly, concerted effort should be made to increase access to these screening interventions specifically for high-risk populations to avoid inadvertently exacerbating health inequities. Additionally, a number of alcohol control policies including minimum unit pricing, restricting the availability of alcohol sales, and limiting alcohol promotion have been found to be highly effective at reducing problematic alcohol use and consideration should be given to strengthening these policies. 24
Limitations
Our study has several limitations. First, we used an area-based measure to characterize income. Consequently, we cannot determine whether our observations are due to (a) living in a low-income neighbourhood, (b) individuals themselves having a low income, or (c) a combination or interaction between these 2 factors. Second, our study uses an ecological design that limits inferences about individual-level risk factors. Third, our inclusion criteria (valid Ontario Health Insurance Plan [OHIP] and home address) likely excluded a portion of individual experiencing homelessness or precarious housing. Research has found that individuals experiencing homelessness are more likely to live in urban settings and have problematic alcohol use; exclusion of these individuals may have underestimated the burden of ED visits in urban settings. 32 Fourth, the diagnoses included in our main outcome measure likely represented the “tip of the iceberg” in alcohol harms, with other types of direct harms (e.g., cancers related to alcohol) and indirect alcohol harms (e.g., violence) not being captured. Finally, greater rates of ED visits due to alcohol in rural compared to urban regions may be partially explained by different patterns of health-care utilization across geographic settings. 33 However, these patterns would be unlikely to change over time and would not explain the observed widening disparity of ED visits due to alcohol.
Conclusion
We found that that current patterns and temporal trends in ED visits due to alcohol show large disparities between urban and rural regions of Canada and by socioeconomic status. These disparities also vary considerably in different age groups and between men and women. Overall, the burden of alcohol on the health system in Canada appears to be increasing particularly in rural regions. Future studies examining potential drivers of these trends are warranted to better inform clinical services and policy interventions. In the interim, clinicians should consider increasing screening and counselling for patients who have been identified as part of the high-risk groups. In addition, policy makers should increase evidence-based interventions aimed at reducing alcohol use and harms at the population level.
Supplemental Material
Supplemental Material, sj-docx-1-cpa-10.1177_07067437211027321 for Socioeconomic and Geographic Disparities in Emergency Department Visits due to Alcohol in Ontario: A Retrospective Population-level Study from 2003 to 2017: Disparités Socio-Économiques et Géographiques Dans les Visites au Service D’urgence en raison de L’alcool en Ontario: Une étude Rétrospective Dans la Population, de 2003 à 2017 by Daniel Myran, Amy Hsu, Elizabeth Kunkel, Emily Rhodes, Haris Imsirovic and Peter Tanuseputro in The Canadian Journal of Psychiatry
Footnotes
Authors’ Note: The funder of the study had no role in the study design; data collection, analysis, or interpretation; or writing of the report. The opinions, results, and conclusions reported in this article are those of the authors and are independent from the funding sources. No endorsement by the CFPC, FAFM, or the Ontario MOHLTC is intended or should be inferred.
Author Contributions: Daniel Myran conceived the study and is the lead author, corresponding author, and guarantor; searched the literature; had full access to all the data in the study; and had final responsibility for the decision on content and publication submission. Peter Tanuseputro, Amy Hsu, Emily Rhodes, Haris Imsirovic, and Elizabeth Kunkel contributed to study design, data interpretation, and manuscript revisions. Daniel Myran, Elizabeth Kunkel, Amy Hsu, Emily Rhodes, Haris Imsirovic, and Peter Tanuseputro contributed to data analysis. Daniel Myran, Amy Hsu, Elizabeth Kunkel, Emily Rhodes, Haris Imsirovic, and Peter Tanuseputro all contributed to drafting of the manuscript. All authors have seen and approved the final text.
Data Sharing: The dataset from this study is held securely in coded form at the Institute for Clinical Evaluative Sciences (ICES). While data sharing agreements prohibit ICES from making the dataset publicly available, access may be granted to those who meet pre-specified criteria for confidential access, available at www.ices.on.ca/DAS. The full dataset creation plan and underlying analytic code are available from the authors upon request, understanding that the computer programs may rely upon coding templates or macros that are unique to ICES and are therefore either inaccessible or may require modification.
Declaration of Conflicting Interests: The author(s) declared no potential conflicts of interest with respect to the research, authorship, and/or publication of this article.
Funding: The author(s) disclosed receipt of the following financial support for the research, authorship, and/or publication of this article: This study was supported by the College of Family Physicians of Canada (CFPC) Janus research grant through the Foundation for Advancing Family Medicine (FAFM) programme and by the Bruyère Center for Individualized Health. It was also supported by ICES (formerly the Institute for Clinical Evaluative Sciences), which is funded by an annual grant from the Ontario Ministry of Health and Long-Term Care (MOHLTC). Peter Tanuseputro is supported by a PSI Graham Farquharson Knowledge Translation Fellowship. Daniel Myran is supported by a Canadian Institutes of Health Research Fellowship and a University of Ottawa Department of Family Medicine Innovation Fellowship.
Ethical Approval: ICES is a prescribed entity under section 45 of Ontario’s Personal Health Information Protection Act. Section 45 authorizes ICES to collect personal health information, without consent, for the purpose of analysis or compiling statistical information with respect to the management of, evaluation or monitoring of, the allocation of resources to or planning for all or part of the health system. This project was conducted under section 45 and approved by ICES’ Privacy and Compliance Office.
ORCID iD: Emily Rhodes, MSc https://orcid.org/0000-0002-8376-4342
Supplemental Material: Supplemental material for this article is available online.
References
- 1. Griswold MG, Fullman N, Hawley C, et al. Alcohol use and burden for 195 countries and territories, 1990–2016: a systematic analysis for the Global Burden of Disease Study 2016. Lancet [Internet]. 2018;392(10152):1015–1035. [accessed 2020 Mar 30]. http://www.ncbi.nlm.nih.gov/pubmed/30146330. [DOI] [PMC free article] [PubMed] [Google Scholar]
- 2. White AM, Castle IP, Hingson RW, Powell PA. Using death certificates to explore changes in alcohol-related mortality in the United States, 1999 to 2017. Alcohol Clin Exp Res [Internet]. 2020;44(1):178–187. [accessed 2020 Mar 26]. https://onlinelibrary.wiley.com/doi/abs/10.1111/acer.14239. [DOI] [PubMed] [Google Scholar]
- 3. O’Donnell M, Sims S, Maclean MJ, Gonzalez-Izquierdo A, Gilbert R, Stanley FJ. Trends in alcohol-related injury admissions in adolescents in Western Australia and England: population-based cohort study. BMJ Open [Internet]. 2017;7(5). [accessed 2018 Aug 3]. http://www.ncbi.nlm.nih.gov/pubmed/28554923. [DOI] [PMC free article] [PubMed] [Google Scholar]
- 4. Green MA, Strong M, Conway L, Maheswaran R. Trends in alcohol-related admissions to hospital by age, sex and socioeconomic deprivation in England, 2002/03 to 2013/14. BMC Public Health [Internet]. 2017;17(1):412. [accessed 2018 Jun 13]. http://www.ncbi.nlm.nih.gov/pubmed/28482876. [DOI] [PMC free article] [PubMed] [Google Scholar]
- 5. Mullins PM, Mazer-Amirshahi M, Pines JM. Alcohol-related visits to US emergency departments, 2001–2011. Alcohol Alcohol [Internet]. 2017;52(1):119–125 . [accessed 2018 May 20]. https://academic.oup.com/alcalc/article-lookup/doi/10.1093/alcalc/agw074. [DOI] [PubMed] [Google Scholar]
- 6. Myran DT, Hsu AT, Smith G, Tanuseputro P. Increasing emergency department visits due to alcohol in Ontario, a retrospective population-level study from 2003-2016. CMAJ. 2019;191(29): E804–E810. [DOI] [PMC free article] [PubMed] [Google Scholar]
- 7. Stein EM, Gennuso KP, Ugboaja DC, Remington PL. The epidemic of despair among white Americans: trends in the leading causes of premature death, 1999-2015. Am J Public Health [Internet]. 2017;107(10):1541–1547. [accessed 2021 Mar 9]. /pmc/articles/PMC5607670/. [DOI] [PMC free article] [PubMed] [Google Scholar]
- 8. Canadian Institute for Health Information. Alcohol Harm in Canada Examining Hospitalizations Entirely Caused by Alcohol and Strategies to Reduce Alcohol Harm. Ottawa, ON: CIHI; [accessed 2017 Oct 3]. https://www.cihi.ca/sites/default/files/document/report-alcohol-hospitalizations-en-web.pdf. [Google Scholar]
- 9. Tjepkema M, Wilkins R, Long A. Cause-specific mortality by income adequacy in Canada: a 16-year follow-up study. Heal rep [Internet]. 2013;24(7):14–22. [accessed 2019 Mar 17]. http://www.ncbi.nlm.nih.gov/pubmed/24258280. [PubMed] [Google Scholar]
- 10. Erskine S, Maheswaran R, Pearson T, Gleeson D. Socioeconomic deprivation, urban-rural location and alcohol-related mortality in England and Wales. BMC Public Health [Internet]. 2010;10(1):99. [accessed 2020 Mar 26]. http://bmcpublichealth.biomedcentral.com/articles/10.1186/1471-2458-10-99. [DOI] [PMC free article] [PubMed] [Google Scholar]
- 11. Hulme J, Sheikh H, Xie E, Gatov E, Nagamuthu C, Kurdyak P. Mortality among patients with frequent emergency department use for alcohol-related reasons in Ontario: a population-based cohort study. CMAJ [Internet]. 2020;192(47):E1522–E1531. [accessed 2020 Dec 14]. www.cmaj.ca/lookup/doi/10.1503/. [DOI] [PMC free article] [PubMed] [Google Scholar]
- 12. Canadian Institute for Health Information. NACRS emergency department visits and length of stay, 2016–2017 [Internet]. Quick Stats. 2018. [accessed 2018 Jun 28]. https://www.cihi.ca/en/quick-stats.
- 13. Statistics Canada. CMA and CA: detailed definition. 2018. [accessed 2018 Jun 28] https://www150.statcan.gc.ca/n1/pub/92-195-x/2011001/geo/cma-rmr/def-eng.htm.
- 14. Statistics Canada. Postal CodeOM Conversion File Plus (PCCF+) Version 6A; Reference Guide. Ottawa; Minister of Industry, 2013.
- 15. Canadian Institute for Health Information. Hospital stays for harm caused by substance use—appendices to Indicator Library, May 2020. Ottawa, ON: CIHI; 2020. [Google Scholar]
- 16. Probst C, Roerecke M, Behrendt S, Rehm J. Socioeconomic differences in alcohol-attributable mortality compared with all-cause mortality: a systematic review and meta-analysis. Int J Epidemiol [Internet]. 2014;43(4):1314–1327. [accessed 2020 Mar 31]. http://www.ncbi.nlm.nih.gov/pubmed/24618188. [DOI] [PMC free article] [PubMed] [Google Scholar]
- 17. Katikireddi SV, Whitley E, Lewsey J, Gray L, Leyland AH. Socioeconomic status as an effect modifier of alcohol consumption and harm: analysis of linked cohort data. Lancet Public Heal [Internet]. 2017;2(6):e267–e276. [accessed 2020 Mar 31]. http://www.ncbi.nlm.nih.gov/pubmed/28626829. [DOI] [PMC free article] [PubMed] [Google Scholar]
- 18. Roberts KC, Rao DP, Bennett TL, Loukine L, Jayaraman GC. Prevalence and patterns of chronic disease multimorbidity and associated determinants in Canada. Health Promot Chronic Dis Prev Canada [Internet]. 2015;35(6):87–94. [accessed 2020 Oct 7]. /pmc/articles/PMC4910465/?report=abstract. [DOI] [PMC free article] [PubMed] [Google Scholar]
- 19. Public Health Ontario. Alcohol use snapshot [Internet]. 2018. [accessed 2020 Apr 2]. https://www.publichealthontario.ca/en/data-and-analysis/substance-use/alcohol-use.
- 20. Public Health Ontario. Self-reported alcohol use snapshot—Historical [Internet]. 2016. [accessed 2020 Apr 2]. https://www.publichealthontario.ca/en/data-and-analysis/substance-use/alcohol-use/alcohol-use-historical.
- 21. McInnis OA, Young MM, Saewyc E, et al. Urban and rural student substance use, Ottawa, Ont.: Canadian Centre on Substance Abuse [Internet]. 2015. [accessed 2020 Jul 21]. https://www.ccsa.ca/urban-and-rural-student-substance-use-technical-report.
- 22. Stoduto G, Adlaf EM, Mann RE. Adolescents, bush parties and drinking-driving. J Stud Alcohol [Internet]. 1998;59(5):544–548. [accessed 2020 Jul 21]. https://pubmed.ncbi.nlm.nih.gov/9718106/. [DOI] [PubMed] [Google Scholar]
- 23. Giesbrecht N, Wettlaufer A, Thomas G, et al. Pricing of alcohol in Canada: a comparison of provincial policies and harm-reduction opportunities. Drug Alcohol Rev [Internet]. 2016;35(3):289–297. [accessed 2021 May 5]. https://pubmed.ncbi.nlm.nih.gov/26530717/. [DOI] [PubMed] [Google Scholar]
- 24. Giesbrecht N, Stockwell T, Kendall P, Strang R, Thomas G. Alcohol in Canada: reducing the toll through focused interventions and public health policies. CMAJ [Internet]. 2011;183(4):450–455. [accessed 2018 Jul 10]. http://www.ncbi.nlm.nih.gov/pubmed/21324848. [DOI] [PMC free article] [PubMed] [Google Scholar]
- 25. O. Reg. 116/10: Minimum pricing of liquor and other pricing matters [Internet]. 2018. [accessed 2018 Jul 10]. https://www.ontario.ca/laws/regulation/100116/v2.
- 26. Prevention System Quality Index 2016—Cancer Care Ontario [Internet]. 2016. [accessed 2021 May 3]. https://www.cancercareontario.ca/en/statistical-reports/prevention-system-quality-index-2016.
- 27. Case A, Deaton A. Mortality and morbidity in the 21st century [Internet]. Brookings Pap Econ Act. 2017;2017:397–476. [accessed 2019 Mar 17]. https://www.brookings.edu/bpea-articles/mortality-and-morbidity-in-the-21st-century/. [DOI] [PMC free article] [PubMed] [Google Scholar]
- 28. Measuring Ontario’s Urban-Rural Divide—Ontario 360 [Internet]. 2019. [accessed 2021 Mar 10]. https://on360.ca/policy-papers/measuring-ontarios-urban-rural-divide/.
- 29. Babor TF, McRee BG, Kassebaum PA, Grimaldi PL, Ahmed K, Bray J. Screening, brief intervention, and referral to treatment (SBIRT). Subst Abus [Internet]. 2007;28(3):7–30. [accessed 2020 Jul 23]. http://www.tandfonline.com/doi/abs/10.1300/J465v28n03_03. [DOI] [PubMed] [Google Scholar]
- 30. O’Donnell A, Anderson P, Newbury-Birch D, et al. The impact of brief alcohol interventions in primary healthcare: a systematic review of reviews. Alcohol Alcohol [Internet]. 2014;49(1):66–78. [accessed 2020 Jul 23]. http://www.ncbi.nlm.nih.gov/pubmed/24232177. [DOI] [PMC free article] [PubMed] [Google Scholar]
- 31. Moyer A, Finney JW. Brief interventions for alcohol misuse. CMAJ [Internet]. 2015;187(7):502–506. [accessed 2020 Jul 23]. http://www.ncbi.nlm.nih.gov/pubmed/25733735. [DOI] [PMC free article] [PubMed] [Google Scholar]
- 32. Nasmith TE, Gadermann A, Jaworsky D, et al. Clinically significant substance use and residential stability among homeless or vulnerably housed persons in Canada: a longitudinal cohort study. J Public Health [Internet]. 2020. [accessed 2021 Jan 11]. https://pubmed.ncbi.nlm.nih.gov/32076717/. [DOI] [PMC free article] [PubMed]
- 33. Public Health Agency of Canada. Chronic Diseases and Injuries in Canada—Canada.ca [Internet]. 2011. [accessed 2020 May 27]. https://www.canada.ca/en/public-health/services/reports-publications/health-promotion-chronic-disease-prevention-canada-research-policy-practice/vol-31-no-1-2010/supplement/introduction.html.
Associated Data
This section collects any data citations, data availability statements, or supplementary materials included in this article.
Supplementary Materials
Supplemental Material, sj-docx-1-cpa-10.1177_07067437211027321 for Socioeconomic and Geographic Disparities in Emergency Department Visits due to Alcohol in Ontario: A Retrospective Population-level Study from 2003 to 2017: Disparités Socio-Économiques et Géographiques Dans les Visites au Service D’urgence en raison de L’alcool en Ontario: Une étude Rétrospective Dans la Population, de 2003 à 2017 by Daniel Myran, Amy Hsu, Elizabeth Kunkel, Emily Rhodes, Haris Imsirovic and Peter Tanuseputro in The Canadian Journal of Psychiatry