

Abstract
This study characterizes potential soil lead (Pb) exposure risk at the household scale in Greensboro, North Carolina, using an innovative combination of field sampling, statistical analysis, and machine-learning techniques. Soil samples were collected at the dripline, yard, and street side at 462 households (total sample size = 2310). Samples were analyzed for Pb and then combined with publicly available data on potential historic Pb sources, soil properties, and household and neighborhood demographic characteristics. This curated data set was then analyzed with statistical and machine-learning techniques to identify the drivers of potential soil Pb exposure risks and to build predictive models. Among all samples, 43% exceeded current guidelines for Pb in residential gardens. There were significant racial disparities in potential soil Pb exposure risk; soil Pb at the dripline increased by 19% for every 25% increase in the neighborhood population identifying as Black. A machine-learned Bayesian network model was able to classify residential parcels by risk of exceeding residential gardening standards with excellent reproducibility in cross validation. These findings underscore the need for targeted outreach programs to prevent Pb exposure in residential areas and demonstrate an approach for prioritizing outreach locations.
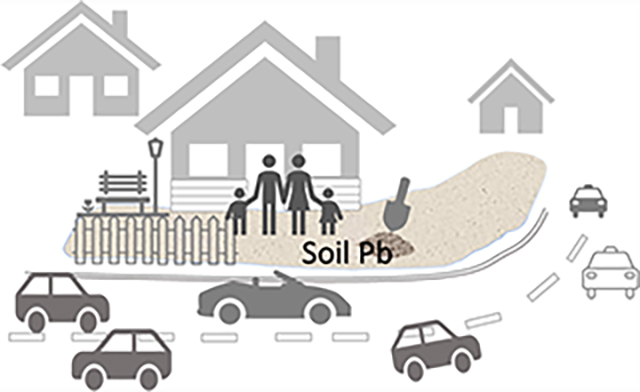
Grapphical Abstract
1. INTRODUCTION
Lead (Pb) poses a critical risk to human health with exposure potentially beginning in utero,1 affecting numerous physiological systems within the human body2–8 and harming the exposed throughout their life course.9–11 Children are most vulnerable because they absorb Pb at a higher rate than adults and because they have higher rates of hand-to-mouth behaviors, increasing their risk of consuming Pb-contaminated soil and dust.12 In addition, early-life Pb exposure, even at low levels, can cause irreversible cognitive damage, leading to decreased performance in school and the workplace.13–16 The Centers for Disease Control and Prevention (CDC) has stated that no level of Pb exposure is safe.17 Each year, an estimated 40 000 U.S. children are diagnosed with elevated blood Pb.17
Even though Pb exposure risk has substantially decreased due to regulations on Pb in industrial and consumer products,18 soil remains an understudied reservoir for Pb.19,20 Soil is a dynamic medium where Pb can persist for extended periods as compared to air and water.21 The residence time for Pb in the soil at a depth of 20 cm can be centuries, and it is decades in the topsoil (5 cm).22–24
In U.S. studies, soil Pb from urbanized residential areas has been, on average, found to be about 7 times greater than samples collected from uncontaminated surface soils.25 The median Pb concentration in uncontaminated surface soils nationwide is 18 ppm;26 the median in North Carolina (NC), where this study is focused, is 19.4 ppm, with an interquartile range of 13.1–26.2 ppm.27 These background concentrations are similar to background Pb observed in other studies around the world.28 Urbanized areas have an increased soil Pb burden because of their higher density of human activity and of historic, anthropogenic Pb sources. These include paint from buildings constructed before the 1978 ban on Pb in paint, deposition of air emissions from motor vehicles that accumulated before the elimination of Pb in gasoline in 1996, and industries (such as smelters) that emitted Pb through their smokestacks.29–31 Pb accumulated in urban soil over the years has been found to potentially contribute more to Pb exposures in urban environments than Pb from residual lead-based paint in buildings, which are typically the focus for Pb interventions.32 Very few studies have examined the distribution of soil Pb risk and the factors that best predict risk at the household scale across an entire city. The majority of prior U.S. studies have been in cities of the Northeast and Midwest that were major centers of steel and other manufacturing activities33–36 that left a large historic footprint of Pb. Understanding soil Pb in other geographic locations with different development histories is important to prevent children’s exposure to Pb because the distinct land-use histories and soil geochemistry of cities in regions that have not been extensively studied may influence exposure patterns.
This study provides what is, to our knowledge, the first thorough assessment of soil Pb in an NC city. We analyze the distribution of Pb in residential areas across Greensboro, NC. Greensboro (with a population of approximately 300 000) developed historically as a railroad transportation hub and textile manufacturing center, distinguishing it from the major industrial cities that have been the focus of most soil Pb studies. It is the third-most populous city in North Carolina, and three major interstate highways pass through it. Understanding the pattern of soil Pb exposure risk in Greensboro is important for NC’s programs to prevent childhood Pb exposure because surveillance data show that Guilford County, where Greensboro is located, has the second most children with elevated blood Pb (defined as >5 μg/dL) behind Wake County among the state’s 100 counties.37 Overall, 1.1% of Guilford County children between ages and 2 years have elevated blood Pb.37
This study has three overall objectives:
Characterize the concentrations of Pb in soil in residential areas across Greensboro.
Identify factors contributing to variation in soil Pb.
Build and test machine-learned models for predicting the risks of exposure to elevated Pb in soil at the household scale.
The study focused on total soil Pb, not on identifying sources (such as the contribution from natural lithologic versus anthropogenic sources). Total exposure is an important factor in guiding targeted public health interventions.
2. MATERIALS AND METHODS
2.1. Objective 1: Characterize Soil Pb Across Greensboro.
To characterize soil Pb across residential areas of Greensboro, 462 homes were recruited for soil Pb testing (Figure 1). To ensure broad representation of the city, households within each of Greensboro’s 16 zip codes were included. Households were recruited via a door-to-door campaign in selected census blocks within each zip code. Inclusion criteria for block selection included at least five residential properties. Exclusion criteria included apartment buildings or building with no soil to sample. The selection was based on participant interest. In many neighborhoods, participants recruited their neighbors, while in others, there was limited interest. The study protocol was reviewed by the NC A&T State University Institutional Review Board (IRB) and exempted from IRB requirements because all participant data were deidentified and risks to participants were judged to be minimal.
Figure 1.

Locations of soil sampling in this study (Greensboro, NC).
At each house agreeing to participate, one soil sample was collected at the dripline (next to the foundation of home), three were retrieved from the yard, and one was taken from the street side. All samples collected were topsoil within the first 5 cm to understand the immediate risk to public health. In total, 2310 samples of bare soil were collected (five samples collected at 462 homes). All sampling was conducted between April and August 2019.
Samples were analyzed using a handheld X-ray fluorescence (XRF) Thermo Niton XL2 800 Analyzer following U.S. EPA method 6200.38 X-ray fluorescence technology has been used by the U.S. EPA and others39–41 in studies similar to this. The samples were dried and tested in Ziploc plastic bags and XRF test cups. All plastic Ziploc bags were tested to ensure that they contained no Pb-containing ink. National Institute for Standards and Technology (NIST) bulk Pb in soil standard, an instrument quality control sample, was tested before XRF testing of samples. Analysis proceeded only if the quality control XRF concentration result was within ±10% of the NIST Pb concentration. Select samples were analyzed via inductively coupled plasma-optical emission spectroscopy (ICP-OES) for those with detection limits near the limit of detection of the XRF. In addition, approximately 10% of all samples were analyzed via ICP-OES to confirm analysis. Briefly, the soil samples were airdried, passed through a 150 micron sieve, and extracted for total Pb concentration using concentrated HCl and HNO3.34 This sample analysis plan was chosen for its accuracy, cost effectiveness, and practicality.
2.2. Objective 2: Analyze Factors Associated with Soil Pb.
To identify factors associated with soil Pb concentrations, soil analysis results for each household were joined to publicly available data on variables hypothesized in advance to be potentially associated with soil Pb, and the resulting data set was analyzed using statistical methods. Four categories of variables were included in the merged data set: characteristics of the individual house, demographic and socioeconomic information about the census block in which the house is located, land use and land cover characteristics for the house location, and soil properties and soil type at the house location. These variables were chosen based on a review of prior literature on factors associated with soil Pb and on public availability of data sources. Table S1 summarizes these variables and their sources.
A two-step approach was used to assess associations between soil Pb and the potential explanatory variables in Table S1. First, univariate associations between potential explanatory variables and soil Pb were assessed using significance tests of correlation (for continuous variables) or analysis of variance (for categorical variables). All variables significantly associated with soil Pb were considered for inclusion in multivariate regression models. Second, multivariate mixed-effect regression models were fit to the data. Separate models were fitted to measurements of Pb at the household dripline (the location of maximum Pb concentrations, on average) and to measurements from any location (dripline, yard, or street side), controlling for location. In both cases, soil Pb was log-transformed to improve model fit. Mixed-effect models controlled for clustering of samples within residential properties and of residential properties within census blocks by including random effects for each census block and each household within the census block. The model was formed as follows
| (1) |
where Cijk is the Pb concentration for the ith soil sample from the jth residential property in the kth census block; Xijk is a vector of covariates (potential explanatory variables) for that sample; βp is the associated coefficient vector; β0jk is the random intercept for soil Pb on property j within census block k; γ00k represents the random intercept for census block k; δ000 is the overall intercept; and Rijk, U0jk, and V00k are error terms (assumed to be normally distributed with means of zero).
To identify factors associated with the presence of Pb above levels that may be of concern for urban gardening, mixed-effect logistic regression models were fitted. For the latter models, samples were assigned a binary indicator of 1 if the soil Pb exceeded the U.S. EPA 100 ppm guideline for residential gardening and a value of zero otherwise. The model form was similar to that in eq 1, except that a logit function was used on the left side of the equation.
Initially, all variables assumed a priori (on the basis of prior research and/or univariate analyses) to influence soil Pb were entered into the models. Subsequently, variables not significantly associated with soil Pb were dropped in a stepwise fashion. Final models included all variables associated with soil Pb at p < 0.1. Median household income at the census block level was not significantly associated with soil Pb in any of the models (though it was significantly correlated with soil Pb). To control for potential income effects, however, two versions of each final model were created: one with income and one without.
All log-linear models were fitted using the “lmer” function in the lme4 package in R. All logistic models were fitted using the “glmer” function (with the “binomial” family) in the lme4 package in R.
2.3. Objective 3: Train Machine-Learned Models for Predicting Soil Pb Exposure Risks.
Two model types were considered to predict the risk that soil Pb on a residential property not included in this study would exceed the U.S. EPA standard for gardens of 100 ppm: logistic regression and Bayesian networks. The latter were tested due to their capability to overcome the difficulties of representing multicollinearity, complex interactions, and nonlinear relationships in logistic regression models.42 To allow for future prediction of risks in census blocks that were not sampled in this study, census block was not included as a predictor variable.
Logistic regression predictions were based on the modeling approach developed for Objective 2. Among the observations, 20% were randomly assigned to a testing set, and a logistic model was fitted to the remaining 80%. The fixed effect coefficients estimated from this subset of the data were used to predict soil Pb in the remaining 20% of data.
Bayesian network models were developed using algorithms available in BayesiaLab software (Changé, France). Briefly, a Bayesian network consists of two components: (1) a graphical structure representing variables as nodes and connections among them as directed edges and (2) a set of probabilistic relationships among the variables..43,44 The structure and probabilistic relationships were estimated using algorithms available in BayesiaLab. The “Structural Expectation Maximization” algorithm was used to replace missing values. Continuous variables were discretized (required for Bayesian networks except in limited special cases) using the R2-GenOpt* algorithm with three bins. This algorithm uses genetic optimization of the R2 between the continuous node and its discrete clone.45 Then, an augmented naïve Bayes network model was fitted to the data using an automatic variable selection algorithm that searches the space of possible model structures and selects variables for inclusion based on model fit as measured by a scoring criterion that balances model accuracy with model complexity. The initial set of variables selected excluded soil pH and distance to the roadway. Since these were found to be important in regression models (see Section 3), they were added to the final model.
The accuracy of the logistic regression and Bayesian network models was tested using fivefold cross validation. This process involves repeatedly dividing the data set into five random subsets. Four of the subsets are used to estimate model parameters. The model’s accuracy is then estimated using it to predict the observations in the fifth subset and then comparing predicted and observed values.
The area under the receiving operating characteristic curve (AUC) was used to compare the two models. AUC is commonly used to evaluate the performance of “classifiers”—algorithms that sort observations into two separate classes (in this case, above or below the 100 ppm EPA standard for Pb in residential garden areas). It measures the area under a plot of the true positive rate as a function of the false positive rate for different probability thresholds used as a boundary between the two classes. The closer the AUC is to 1, the more accurate the model.
3. RESULTS AND DISCUSSION
3.1. Objective 1: Characterize Soil Pb in Soil in Residential Areas Across Greensboro.
Mean and median soil Pb across all samples were 121 and 79.0 ppm, respectively, with a maximum of 1200 ppm (Table 1). The 25th percentile concentration, 42 ppm, was more than twice as high as the median soil Pb in uncontaminated areas (19 ppm) in recent U.S. Geological Survey studies in NC,27 suggesting that in the large majority of samples, the measured Pb was from anthropogenic sources.
Table 1.
Soil Pb Analysis Results and Characteristics of Participating Households
| 25th percentile | median | mean | 75th percentile | maximum | SD | |
|---|---|---|---|---|---|---|
| soil Pb concentration (ppm) | ||||||
| dripline (n = 462) | 57.3 | 128 | 156 | 219 | 1200 | 131 |
| yard (n = 1386) | 37 | 65 | 105 | 143 | 543 | 96 |
| street side (n = 462) | 48 | 101 | 135 | 179 | 655 | 114 |
| all samples (n = 2310) | 42 | 79.0 | 121 | 168 | 1200 | 110 |
| % Black | 30.0% | 81.8% | 65.1 | 95.1 | 1.00 | 0.349 |
| median household income ($100,000s) | 0.196 | 0.288 | 0.319 | 0.379 | 0.935 | 0.161 |
| distance to major road (km) | 0.500 | 0.500 | 0.754 | 1.00 | 3.00 | 0.603 |
| house age (decades) | 5.60 | 6.70 | 6.68 | 8.20 | 13.3 | 2.36 |
| house value ($100,000s) | 0.530 | 0.792 | 1.01 | 1.16 | 7.57 | 0.754 |
| soil pH | 6.50 | 6.60 | 6.36 | 6.60 | 6.60 | 0.478 |
| % soil clay | 29.4 | 29.4 | 29.6 | 30.4 | 29.3 | 1.88 |
Soil Pb differed significantly depending on the location on the property from which the sample was collected (F(2, 2307) = 45.0, p < 0.0001) (Table 1). The highest concentrations were observed at the dripline (mean = 156 ppm), followed by the street side (mean = 135 ppm). Mean concentrations of samples collected elsewhere on the properties were lower (mean = 105 ppm).
Nearly half of the 2310 samples (49.8%) were above the California EPA 80 ppm standard for residential soil. Among all samples, 43.1% exceeded the U.S. EPA 100 ppm guideline for Pb in soil used for residential gardening, while 3.12 and 0.0433% exceeded the U.S. EPA 400 and 1200 ppm standard for play areas and general residential areas, respectively. The percentages exceeding these reference values were much higher in samples collected at the dripline than at other locations (Figure S1).
The average concentration of Pb in soil in our study was not as high as has been found in larger cities such as Indianapolis and New Orleans, where concentrations at the household scale were 2–4 times higher in the yard, dripline, and street.34 The difference in soil Pb concentrations in Greensboro as compared to larger cities is most likely due to the legacy of industrial Pb sources and higher traffic and population densities in the latter cities, compared to in Greensboro.46–50 As such, the potential Pb exposure risk from the soil is significantly different in Greensboro as compared to more industrialized cities in the northern U.S., Midwestern U.S., and more industrialized southern U.S. cities like New Orleans. Nonetheless, the legacy of gasoline usage, along with the historical use of Pb paint, has left a significant footprint in neighborhood soils, leaving the health of urban Greensboro residents at risk as is the case in other urban locations.33,51,52 Our findings for Greensboro may be relevant to the vast majority of southern U.S. cities, which as a whole did not originate as industrial communities but developed as shipping, railway, and commercial centers or as local trading and marketing towns.48
3.2. Objective 2: Identify Factors Contributing to Variation in Soil Pb.
Mixed-effect regression models indicated that soil Pb at the household dripline differed significantly by the racial composition of the census block, distance to the nearest major road, year of home construction, and soil pH (Table 2).
Table 2.
Influence of Demographic, Geographic, House, and Soil Characteristics on Soil Pb (Natural Log) at the House Dripline in Greensboro, NC
| model 1 |
model 2 |
|||||||
|---|---|---|---|---|---|---|---|---|
| independent variable | exp(β) | lower CI | upper CI | p | exp(β) | lower CI | upper CI | p |
| % Black | 1.79 | 1.19 | 2.70 | <0.01 | 2.03 | 1.46 | 2.82 | <0.001 |
| median household income ($100,000s) | 0.719 | 0.292 | 1.77 | n.s. | ||||
| distance to major road (km) | 0.722 | 0.603 | 0.866 | <0.001 | 0.730 | 0.615 | 0.868 | <0.001 |
| house age (decades) | 1.064 | 1.029 | 1.10 | <0.001 | 1.060 | 1.026 | 1.10 | <0.001 |
| soil pH | 1.34 | 1.08 | 1.65 | <0.01 | 1.34 | 1.09 | 1.64 | <0.01 |
3.2.1. Racial Disparities in Soil Pb Exposure Risk.
Soil Pb at the dripline was 1.79 times higher in 100% Black than in 100% White census blocks (p < 0.01) when adjusting for median household income (which, on its own, was not a significant predictor of soil Pb) (Table 2, model 1). When excluding income, soil Pb at the dripline was 2.03 times higher in 100% Black than in 100% White census blocks (p < 0.001)—equivalent to a 19% increase in soil Pb per 25% increase in Black population proportion (Table 2, model 2).
The racial composition of the neighborhood was also associated with soil Pb when considering all soil samples together (i.e., not just those at the dripline) while controlling for clustering of samples within residential properties and of properties within census blocks (Table 3). Regardless of the location on the property from where it was collected, soil Pb was 1.8 times higher in 100% Black than in 100% White neighborhoods when controlling for income (Table 3, model 1) and was 1.9 times higher if income (which was not a significant predictor of soil Pb) is not considered (Table 3, model 2). The latter is equivalent to a 17% increase per 25% increase in the Black population proportion. Soil Pb also increased significantly with pH. When considering all samples together, house age was no longer significantly associated with the Pb concentration. Soil Pb decreased as the distance to major roadways increased, but this effect (with p < 0.1) did not reach statistical significance at p = 0.05.
Table 3.
Influence of Demographic, Geographic, House, Soil Characteristics, and Location of Sample Collection, and on Soil Pb (Natural Log) in Greensboro, NC
| model 1 |
model 2 |
|||||||
|---|---|---|---|---|---|---|---|---|
| independent variable | exp(β) | lower CI | upper CI | p | exp(β) | lower CI | upper CI | p |
| % Black | 1.80 | 1.28 | 2.54 | <0.001 | 1.90 | 1.44 | 2.49 | <0.001 |
| median household income ($100,000s) | 0.928 | 0.439 | 1.96 | n.s. | ||||
| distance to major road (km) | 0.862 | 0.743 | 1.000 | <0.1 | 0.884 | 0.769 | 1.018 | <0.1 |
| house age (decades) | 1.019 | 0.993 | 1.05 | n.s. | 1.017 | 0.993 | 1.04 | n.s. |
| soil pH | 1.22 | 1.03 | 1.44 | <0.05 | 1.21 | 1.03 | 1.42 | <0.05 |
| yard | 0.67 | 0.62 | 0.72 | <0.001 | 0.67 | 0.63 | 0.72 | <0.001 |
| street side | 0.87 | 0.80 | 0.94 | <0.001 | 0.87 | 0.80 | 0.94 | <0.001 |
| dripline (reference) | 1.0 | NA | NA | NA | 1.00 | NA | NA | NA |
Similar to the log-linear models, the logistic regression model of soil Pb indicated that risks of exceeding 100 ppm of Pb increased as the percentage of the population identifying as Black increased (Table 4). The risk of soil Pb above 100 ppm was 30 times higher in 100% Black than in 100% White census blocks when controlling for income and 39 times higher when income was excluded from the model.
Table 4.
Influence of Demographic, Geographic, House, Soil Characteristics, and Location of Sample Collection, and on Probability of Exceeding 100 ppm of Pb in Soil in Greensboro, NC
| model 1 |
model 2 |
|||||||
|---|---|---|---|---|---|---|---|---|
| independent variable | Odds ratio | lower CI | upper CI | p | Odds ratio | lower CI | upper CI | p |
| % Black | 29.7 | 5.79 | 152 | <0.001 | 38.9 | 9.72 | 156 | <0.001 |
| median household income ($100,000s) | 0.829 | 0.0229 | 30.0 | n.s. | ||||
| distance to major road (km) | 0.430 | 0.204 | 0.909 | <0.05 | 0.522 | 0.254 | 1.07 | <0.1 |
| soil pH | 4.34 | 2.17 | 8.68 | <0.001 | 4.14 | 2.10 | 8.19 | <0.001 |
| yard | 0.102 | 0.0688 | 0.152 | <0.001 | 0.107 | 0.0731 | 0.158 | <0.001 |
| street side | 0.395 | 0.255 | 0.611 | <0.001 | 0.439 | 0.287 | 0.672 | <0.001 |
| dripline (reference) | 1.00 | NA | NA | NA | 1.00 | NA | NA | NA |
Our finding of potential significant racial disparities in soil Pb exposure is consistent with the findings of previous studies. Other studies have documented that Blacks are more exposed to Pb starting in utero53 and persisting throughout the life course, with soil being a significant source of exposure.54 Despite the differences in the Pb exposure profile in Greensboro compared to that in larger, more industrialized cities, it is clear that a legacy of Pb in soil contributes to these persistent racial disparities in potential Pb exposure in Greensboro, as in other areas.
When interpreting these results, it is important to note that soil Pb is rarely 100% bioaccessible and/or bioavailable. In its Integrated Exposure Uptake Biokeintic Model for predicting the effect of soil Pb on blood Pb, the U.S. EPA assumes that 60% of ingested soil Pb is bioavailable—that is, 60% crosses the gastrointestinal epithelium and is available for distribution to tissues and organs.55 Studies in rats have found that soil Pb bioavailability can vary widely, from 15 to 85%.56 Nonetheless, even if less than 100% of the soil Pb is bioavailable, prior studies have found that total and bioavailable Pb are highly correlated.57 Therefore, our finding of significant racial disparities in total soil Pb exposure risk translates to comparable disparities in the risk of exposure to bioavailable Pb.
3.2.2. Other Factors Influencing Soil Pb Exposure.
In the log-linear and logistic models, soil Pb also increased significantly as the distance to the nearest major road decreased (Tables 2–4). For example, soil Pb at the dripline increased by about 28% for every 1 km decrease in distance from a major road. This finding is consistent with a large body of prior work showing that proximity to freeways and major roadways is a major source of soil Pb contamination.58,59
Soil Pb at the dripline (but not in other yard locations or at the street side) was significantly higher (p < 0.001) in older houses, increasing by about 6% for every decade of house age (Tables 2 and 3). This finding is also consistent with prior studies finding higher Pb levels at the dripline compared to other locations.34,60,61 Dripline soil Pb largely reflects Pb concentrations from paint, with older homes having a larger likelihood of having been painted with Pb paint; nearly 90% of homes built before 1940 are likely to have used Pb-based paints.62
Soil Pb also increased significantly with pH in all of the regression models (Tables 2–4). For example, the odds of soil Pb above 100 ppm increased by more than 4 for each unit increase in pH (Table 4). This finding matches the finding of previous studies that Pb retention in soil was dependent upon pH of the soil sample, with retention dramatically increasing above pH 7.0–7.5.63,64 Generally speaking, at acidic soil pH conditions, Pb is bound less tightly and is more soluble. At neutral to basic conditions, soil Pb is held more strongly, and its solubility is very low. This indicates that when assessing exposure risk, it is critical to consider soil pH.
3.3. Objective 3: Assess Accuracy of Machine-Learned Models for Risk Prediction.
The Bayesian network model (Figure 2) was a significantly more accurate classifier for predicting the risk of elevated soil Pb in unsampled census blocks than the logistic regression model. As shown in Figure 3, under cross validation, the mean AUC was 0.83 (95% CI: 0.82–0.83), compared to AUC = 0.74 (95% CI: 0.69–0.77) for the logistic regression model. It is thus more useful than the logistic regression model for targeting areas for future soil testing that are in census blocks not included in this study.
Figure 2.
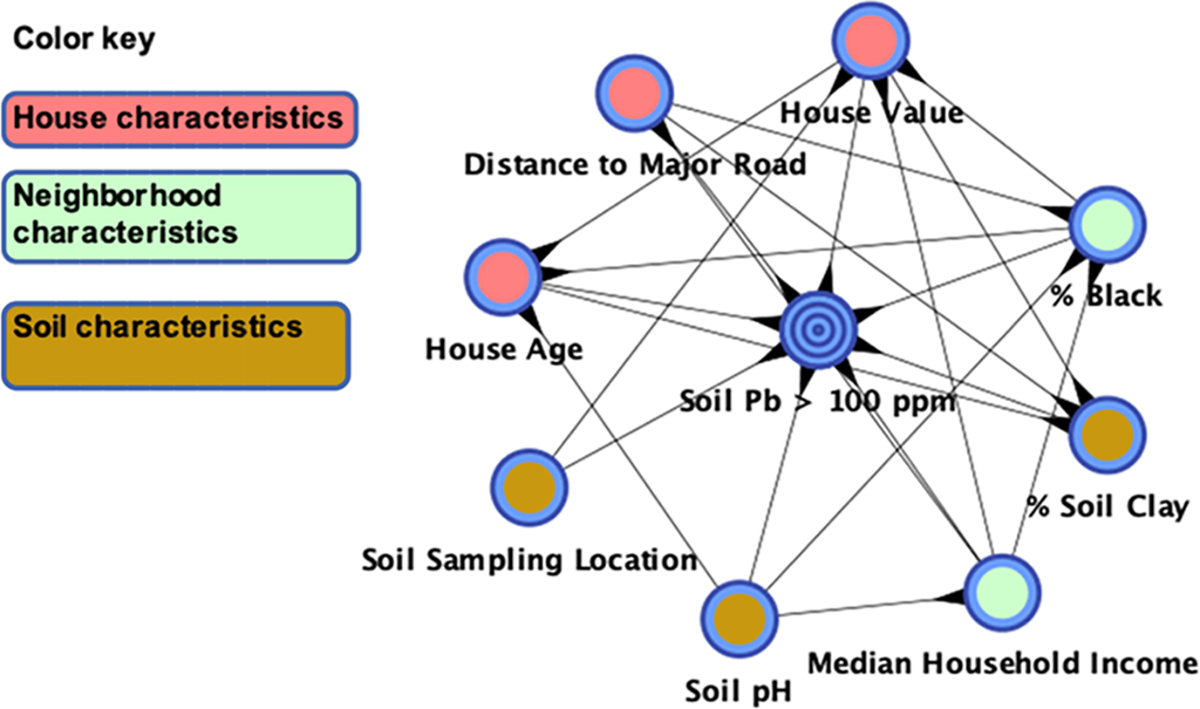
Bayesian network model predicting the probability that a soil sample will contain >100 ppm of lead. Nodes represent variables, and edges represent probabilistic relationships among the variables. All variables included share significant mutual information with the soil lead content.
Figure 3.
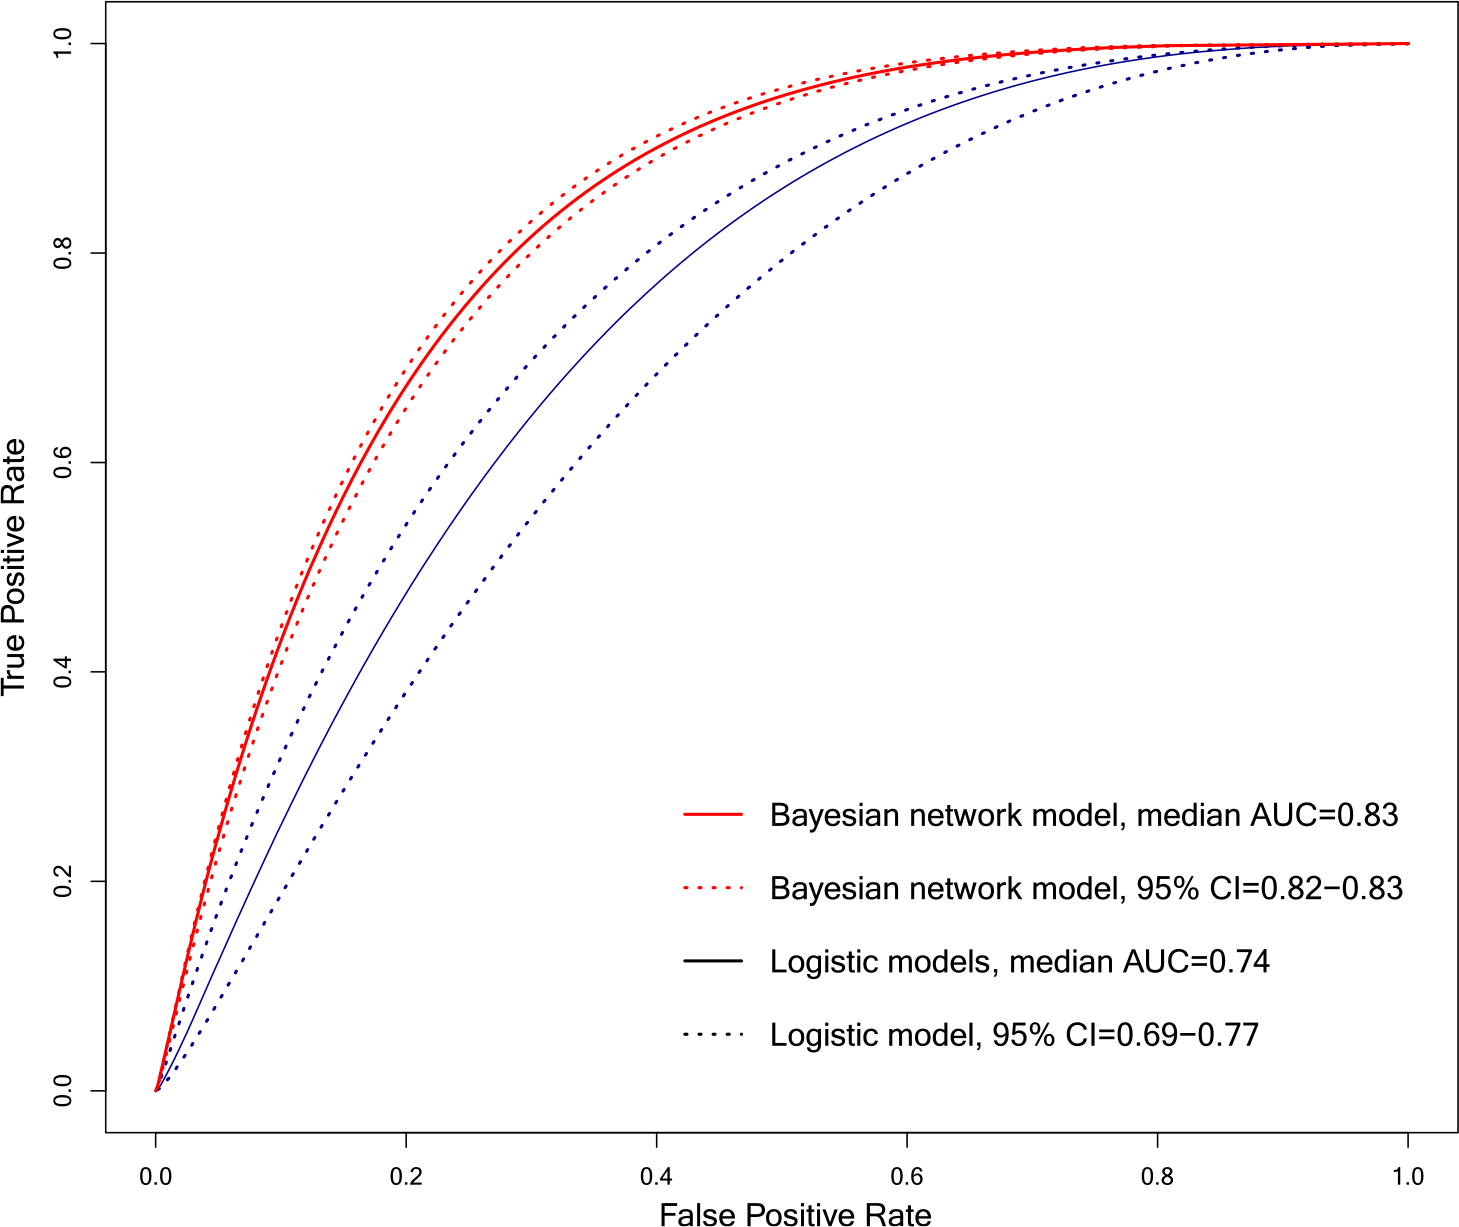
Bayesian network model was significantly more accurate in predicting houses at risk of Pb >100 ppm in soil, compared to the logistic regression model, as indicated by its higher area under the receiver-operating characteristic curve (AUC). AUC measures the probability that the model will rank a randomly chosen house with high soil Pb as having a greater risk than a randomly chosen house with low soil Pb.
Due to the capability to handle collinear variables, the Bayesian network model (Figure 2) was able to include more predictors than the logistic regression. All variables shown in Figure 2 share significant mutual information with the risk of elevated Pb, meaning that knowing the state of any one of these variables significantly decreases uncertainty in whether soil Pb will exceed 100 ppm. Figure S2 illustrates how the risk of elevated soil Pb varies as values of each of these variables change. The variables with the strongest influence on risk were the house value and the percentage Black population in the census block. As in the regression models, risk increases with the percentage Black population and house age. The model is also able to represent dependencies among these predictor variables. This latter feature facilitates prediction when information about a given house is incomplete because changing the state of any one variable in the network updates the probability distributions for the states of all of the other variables.
To our knowledge, no prior studies have compared Bayesian network and logistic regression models for predicting soil Pb exposure risk. However, multiple studies have compared these two modeling approaches for other classification tasks, ranging from predicting the risk of credit defaults65 to the probability of cancer recurrence.66 These studies have found that Bayesian network predictive capability can range from comparable to logistic regression to better than logistic regression.67 The variation in results is likely due to the wide range and insufficient reporting of algorithms used for training network models (including algorithms for discretizing continuous variables and building network structures).67 A study using algorithms similar to the ones in this study to predict credit default risk found that Bayesian networks had the superior predictive capability, compared to logistic regression.65
The Bayesian network model can be used to create risk maps for all census blocks in the City of Greensboro (not just those included in this study). Figure 4 shows such maps for three categories of house ages: those built before June 1978, those built between June 1940 and June 1978, and those built before June 1940. As expected based on the results of this analysis, risks are highest in census blocks abutting major road corridors, likely due to atmospheric deposition of motor vehicle exhaust that occurred before Pb was banned from fuel. Such maps can be useful in identifying parcels at risk of elevated soil Pb, which would assist with programs to decrease childhood Pb exposure.
Figure 4.
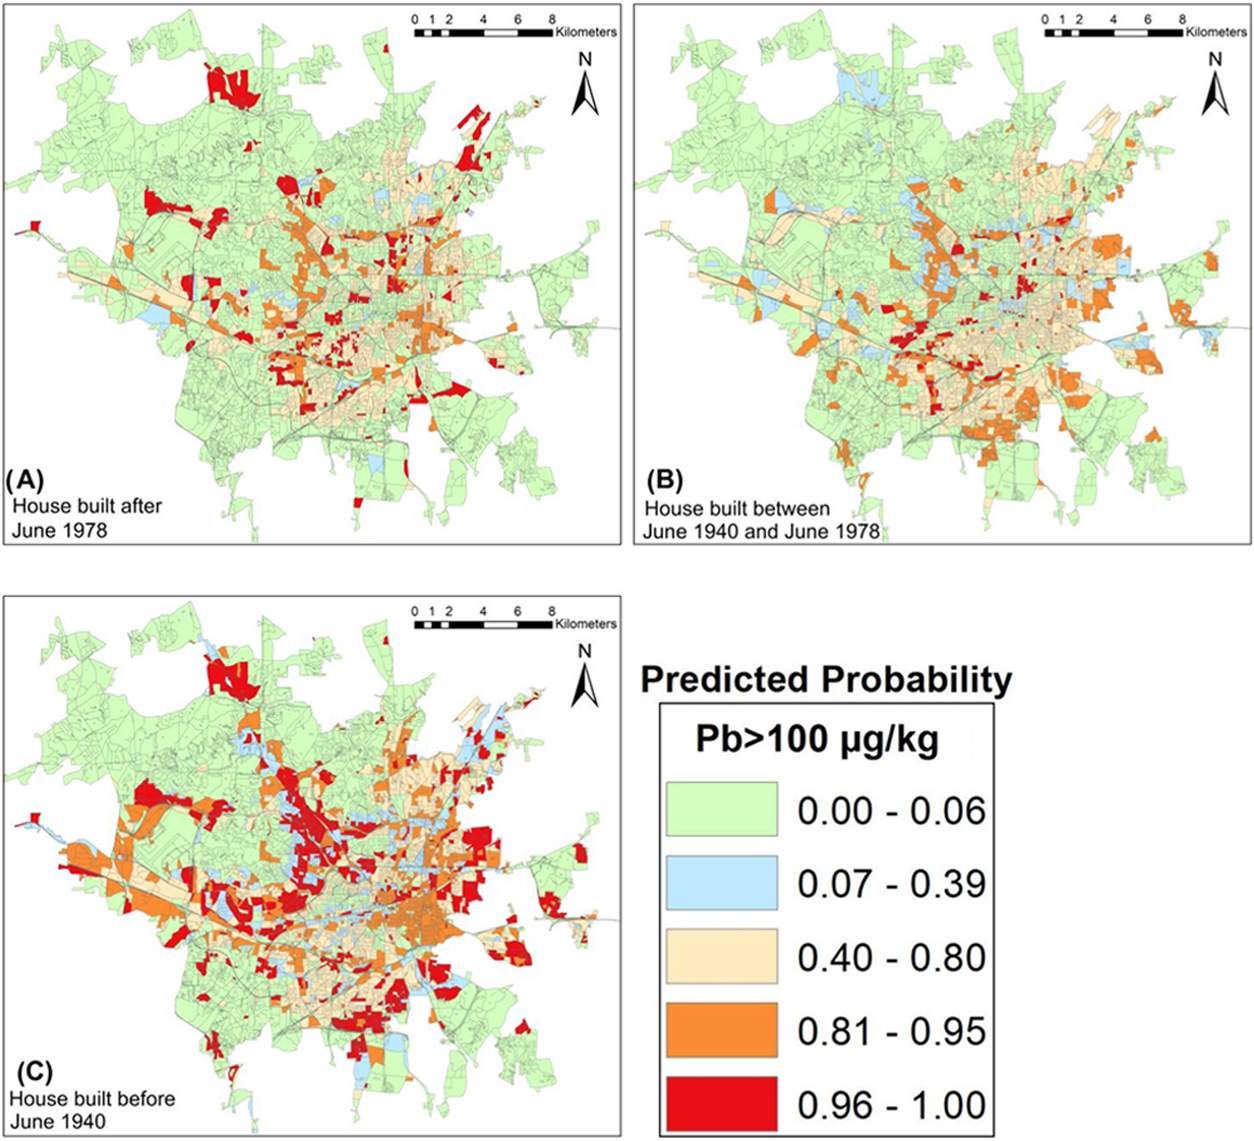
Risk of soil Pb >100 ppm across the City of Greensboro as predicted by the Bayesian network model in Figure 2. Risks are shown for three house ages: (A) built after June 1978; (B) built between June 1940 and June 1978; and (C) built before June 1940.
3.4. Limitations.
An important limitation of this study is its focus on total Pb exposure, without considering what fraction of the Pb is bioavailable. Bioavailability can be influenced by characteristics of the soil, Pb mineralogy, and the diet of exposed humans.68
Health-based soil guidelines, such as the EPA reference levels described in this study, account for the fact that only a fraction of total Pb is bioavailable.69 As a result, the fact that so many of the samples (43.1%) in this study exceeded guideline values for urban gardening and that there were racial disparities in the risk of exceeding this guideline is concerning, despite the lack of information about what fraction of the total Pb is bioavailable. Another study limitation is that composite samples were not collected, leaving the results for any one house potentially vulnerable to outliers. However, the large number of houses included diminishes the potential for an outlier sample at any one household to bias the results. In addition, a sensitivity analysis in which extreme values were removed from the data set did not affect the significance or magnitude of the coefficients in the regression models, suggesting that any outliers had minimal influence on our interpretation of factors influencing the spatial distribution of Pb. Finally, it is important to note that naturally metalliferous areas, regardless of location (urban or rural), will have higher soil Pb concentrations.
3.5. Public Health Implications.
Efforts to remediate soil Pb levels in a city such as Greensboro are complicated. In the United States, soil remediation efforts have primarily focused on mining towns or neighborhoods affected by emissions from Pb smelters.70 This has left towns with a legacy of Pb exposure in soil from paint and legacy gasoline with few mechanisms, short of alerting residents to the potential risks so that they can alter their behavior, to decrease the exposure risk.
The results of this study open the avenue for public health agencies to target their messaging about behavioral interventions—such as handwashing, covering bare soil where children might play, and planting vegetables in raised beds—that can decrease soil Pb exposure risk. Even though the exposure is not directly tied the total concentration of Pb present in the soil as soil mineralogy, metal oxides, and other soil biogeochemical factors greatly impact bioaccessibility and bioavailability of the total Pb present, caution must still be practiced as no level of Pb exposure is safe, according to the Centers for Disease Control and Prevention.71 The study results suggested that Bayesian network models are more useful than logistic regression models for targeting areas for risk messaging and future soil Pb testing. Targeted interventions using methods in our study could save costs by focusing communication and other interventions on areas where risks are highest.
The models created in this study examining risk at unsampled locations open a new avenue into public health risk characterization and management. These methods, when fully established for a city, will significantly alter how public health departments are able to identify risks quickly and efficiently. Notably, assessing lead-contaminated soil risk at the household scale using our methods will provide advanced and low-cost soil Pb exposure risk management for medium-sized cities, which often lack soil Pb data and the economic means to pursue wide-scale soil Pb remediation.
Supplementary Material
ACKNOWLEDGMENTS
This project was funded by the NIH Clinical and Translational Science Award (CTSA) grant (UL1TR002489) and the Department of Housing and Urban Development Cooperative Agreement INLTS0020-20.
Footnotes
The authors declare no competing financial interest.
ASSOCIATED CONTENT
Supporting Information
The Supporting Information is available free of charge at https://pubs.acs.org/doi/10.1021/acs.est.0c07317.
Publically available data used to create curated data set (Table S1); conditional probability distribution for % Black (Table S2); conditional probability distribution for % soil clay (Table S3); conditional probability distribution for distance to major roads (Table S4); conditional probability distribution for house age (Table S5); conditional probability distribution for house value (Table S6); conditional probability distribution for median household income (Table S7); conditional probability distribution for soil PH (Table S8); conditional probability distribution for soil sampling location (Table S9); box plot of the distribution of soil Pb data at three sampled locations (Figure S1); and total influence of each variable in the model in Figure 2 on the probability that soil Pb will exceed 100 ppm (Figure S2) (PDF)
Complete contact information is available at: https://pubs.acs.org/10.1021/acs.est.0c07317
Contributor Information
Emmanuel Obeng-Gyasi, Department of Built Environment and Environmental Health and Disease Laboratory, North Carolina A&T State University, Greensboro, North Carolina 27411, United States.
Javad Roostaei, Department of Environmental and Occupational Health, Indiana University Bloomington, Bloomington, Indiana 47405, United States.
Jacqueline MacDonald Gibson, Department of Environmental and Occupational Health, Indiana University Bloomington, Bloomington, Indiana 47405, United States.
REFERENCES
- (1).Hu H; Téllez-Rojo MM; Bellinger D; Smith D; Ettinger AS; Lamadrid-Figueroa H; Schwartz J; Schnaas L; Mercado-García A; Hernández-Avila M Fetal lead exposure at each stage of pregnancy as a predictor of infant mental development. Environ. Health Perspect. 2006, 114, 1730–1735. [DOI] [PMC free article] [PubMed] [Google Scholar]
- (2).Obeng-Gyasi E Lead Exposure and Cardiovascular Disease among Young and Middle-Aged Adults. Med. Sci. 2019, 7, No. 103. [DOI] [PMC free article] [PubMed] [Google Scholar]
- (3).Loghman-Adham M Renal effects of environmental and occupational lead exposure. Environ. Health Perspect. 1997, 105, 928–939. [DOI] [PMC free article] [PubMed] [Google Scholar]
- (4).Reuben A; Schaefer JD; Moffitt TE; Broadbent J; Harrington H; Houts RM; Ramrakha S; Poulton R; Caspi A Association of childhood lead exposure with adult personality traits and lifelong mental health. JAMA Psychiatry 2019, 76, 418–425. [DOI] [PMC free article] [PubMed] [Google Scholar]
- (5).Telišman S; Čolak B; Pizent A; Jurasović J; Cvitković P Reproductive toxicity of low-level lead exposure in men. Environ. Res. 2007, 105, 256–266. [DOI] [PubMed] [Google Scholar]
- (6).Navas-Acien A; Guallar E; Silbergeld EK; Rothenberg SJ Lead exposure and cardiovascular disease: a systematic review. Environ. Health Perspect. 2007, 115, 472–482. [DOI] [PMC free article] [PubMed] [Google Scholar]
- (7).Patil AJ; Bhagwat VR; Patil JA; Dongre NN; Ambekar JG; Das KK Occupational lead exposure in battery manufacturing workers, silver jewelry workers, and spray painters in western Maharashtra (India): effect on liver and kidney function. J. Basic Clin. Physiol. Pharmacol. 2007, 18, 87–100. [DOI] [PubMed] [Google Scholar]
- (8).Obeng-Gyasi E; Armijos RX; Weigel MM; Filippelli GM; Sayegh MA Cardiovascular-Related Outcomes in US Adults Exposed to Lead. Int. J. Environ. Res. Public Health 2018, 15, No. 759. [DOI] [PMC free article] [PubMed] [Google Scholar]
- (9).Obeng-Gyasi E Lead Exposure and Oxidative Stress-A Life Course Approach in US Adults. Toxics 2018, 6, No. 42. [DOI] [PMC free article] [PubMed] [Google Scholar]
- (10).Reuben A; Caspi A; Belsky DW; Broadbent J; Harrington H; Sugden K; Houts RM; Ramrakha S; Poulton R; Moffitt TE Association of childhood blood lead levels with cognitive function and socioeconomic status at age 38 years and with IQ change and socioeconomic mobility between childhood and adulthood. JAMA 2017, 317, 1244–1251. [DOI] [PMC free article] [PubMed] [Google Scholar]
- (11).McDermott S; Wu J; Cai B; Lawson A; Aelion CM Probability of intellectual disability is associated with soil concentrations of arsenic and lead. Chemosphere 2011, 84, 31–38. [DOI] [PMC free article] [PubMed] [Google Scholar]
- (12).Tulve NS; Suggs JC; McCurdy T; Hubal EAC; Moya J Frequency of mouthing behavior in young children. J. Exposure Sci. Environ. Epidemiol. 2002, 12, 259–264. [DOI] [PubMed] [Google Scholar]
- (13).Needleman HL; Gatsonis CA Low-level lead exposure and the IQ of children: a meta-analysis of modern studies. JAMA 1990, 263, 673–678. [PubMed] [Google Scholar]
- (14).Lanphear BP; Hornung R; Khoury J; Yolton K; Baghurst P; Bellinger DC; Canfield RL; Dietrich KN; Bornschein R; Greene T; Rothenberg SJ; et al. Low-level environmental lead exposure and children’s intellectual function: an international pooled analysis. Environ. Health Perspect. 2005, 113, 894–899. [DOI] [PMC free article] [PubMed] [Google Scholar]
- (15).Jusko T; Henderson C; Lanphear B; Cox C; Cory-Slechta D; Canfield R Blood Lead Concentrations < 10 Micrograms Per Deciliter and Child IQ at Age 6 Years. Epidemiology 2007, 18, S94–S95. [Google Scholar]
- (16).Needleman H Lead poisoning. Annu. Rev. Med. 2004, 55, 209–222. [DOI] [PubMed] [Google Scholar]
- (17).Centers for Disease Control and Prevention. CDC National Childhood Blood Lead Surveillance Data. https://www.cdc.gov/nceh/lead/data/national.htm (accessed October 24, 2020).
- (18).Pohl HR; Ingber SZ; Abadin HG Historical view on lead: guidelines and regulations. Metal Ions Life Sci. 2017, 17, 435–470. [DOI] [PubMed] [Google Scholar]
- (19).Laidlaw MA; Mielke HW; Filippelli GM; Johnson DL; Gonzales CR Seasonality and children’s blood lead levels: developing a predictive model using climatic variables and blood lead data from Indianapolis, Indiana, Syracuse, New York, and New Orleans, Louisiana (USA). Environ. Health Perspect. 2005, 113, 793–800. [DOI] [PMC free article] [PubMed] [Google Scholar]
- (20).Schachter AE; Gailey A; Egendorf SP; Mielke HW Mechanisms of children’s soil exposure. Curr. Probl. Pediatr. Adolesc. Health Care 2020, 50, No. 100742. [DOI] [PubMed] [Google Scholar]
- (21).Hansson SV; Grusson Y; Chimienti M; Claustres A; Jean S; Le Roux G Legacy Pb pollution in the contemporary environment and its potential bioavailability in three mountain catchments. Sci. Total Environ. 2019, 671, 1227–1236. [Google Scholar]
- (22).Mielke HW; Gonzales CR; Powell ET; Laidlaw MA; Berry KJ; Mielke PW; Egendorf SP The concurrent decline of soil lead and children’s blood lead in New Orleans. Proc. Natl. Acad. Sci. U.S.A. 2019, 116, 22058–22064. [DOI] [PMC free article] [PubMed] [Google Scholar]
- (23).Qin F; Shan X; Wei B Effects of low-molecular-weight organic acids and residence time on desorption of Cu, Cd, and Pb from soils. Chemosphere 2004, 57, 253–263. [DOI] [PubMed] [Google Scholar]
- (24).Klaminder J; Bindler R; Emteryd O; Appleby P; Grip H Estimating the mean residence time of lead in the organic horizon of boreal forest soils using 210-lead, stable lead and a soil chronosequence. Biogeochemistry 2006, 78, 31–49. [Google Scholar]
- (25).Brown SL; Chaney RL; Hettiarachchi GM Lead in urban soils: a real or perceived concern for urban agriculture? J. Environ. Qual. 2016, 45, 26–36. [DOI] [PubMed] [Google Scholar]
- (26).Smith D; Cannon W; Woodruff L; Solano F; Ellefsen K Geochemical and Mineralogic Maps of Soils of the Conterminous United States. USGS Open-File Report, 2014; p 1082. [Google Scholar]
- (27).U.S. Environmental Protection Agency. USGS Background Soil-Lead Survey: State Data. https://www.epa.gov/superfund/usgs-background-soil-lead-survey-state-data (accessed January 5, 2021).
- (28).Díez M; Simón M; Martín F; Dorronsoro C; García I; Van Gestel C Ambient trace element background concentrations in soils and their use in risk assessment. Sci. Total Environ. 2009, 407, 4622–4632. [DOI] [PubMed] [Google Scholar]
- (29).Imperato M; Adamo P; Naimo D; Arienzo M; Stanzione D; Violante P Spatial distribution of heavy metals in urban soils of Naples city (Italy). Environ. Pollut. 2003, 124, 247–256. [DOI] [PubMed] [Google Scholar]
- (30).Rodríguez Martín J; De Arana C; Ramos-Miras J; Gil C; Boluda R Impact of 70 years urban growth associated with heavy metal pollution. Environ. Pollut. 2015, 196, 156–163. [DOI] [PubMed] [Google Scholar]
- (31).Frank JJ; Poulakos AG; Tornero-Velez R; Xue J Systematic review and meta-analyses of lead (Pb) concentrations in environmental media (soil, dust, water, food, and air) reported in the United States from 1996 to 2016. Sci. Total Environ. 2019, 694, No. 133489. [DOI] [PMC free article] [PubMed] [Google Scholar]
- (32).de Miguel E; Llamas JF; Chacón E; Berg T; Larssen S; Røyset O; Vadset M Origin and patterns of distribution of trace elements in street dust: unleaded petrol and urban lead. Atmos. Environ. 1997, 31, 2733–2740. [Google Scholar]
- (33).Mielke HW; Dugas D; Mielke PW Jr.; Smith KS; Gonzales C Associations between soil lead and childhood blood lead in urban New Orleans and rural Lafourche Parish of Louisiana. Environ. Health Perspect. 1997, 105, 950–954. [DOI] [PMC free article] [PubMed] [Google Scholar]
- (34).Filippelli G; Adamic J; Nichols D; Shukle J; Frix E Mapping the Urban Lead Exposome: A Detailed Analysis of Soil Metal Concentrations at the Household Scale Using Citizen Science. Int. J. Environ. Res. Public Health 2018, 15, No. 1531. [DOI] [PMC free article] [PubMed] [Google Scholar]
- (35).Whitzling L; Wander M; Phillips E Testing and educating on urban soil lead: A case of Chicago community gardens. J. Agric., Food Syst., Community Dev. 2010, 1, 167–185. [Google Scholar]
- (36).Clark JJ; Knudsen AC Extent, Characterization, and Sources of Soil Lead Contamination in Small-Urban Residential Neighborhoods. J. Environ. Qual. 2013, 42, 1498–1506. [DOI] [PubMed] [Google Scholar]
- (37).North Carolina Department of Health and Human Services. Childhood Lead Poisoning Prevention Program: Data 2014. https://ehs.ncpublichealth.com/hhccehb/cehu/lead/data.htm. 2018.
- (38).U.S. Environmental Protection Agency. SW-846 Test Method 6200: Field Portable X-Ray Fluorescence Spectrometry for the Determination of Elemental Concentrations in Soil and Sediment. https://www.epa.gov/hw-sw846/sw-846-test-method-6200-field-portable-x-ray-fluorescence-spectrometry-determination (accessed September 24, 2020).
- (39).Clark S; Menrath W; Chen M; Roda S; Succop P Use of a field portable X-ray fluorescence analyzer to determine the concentration of lead and other metals in soil samples. Ann. Agric. Environ. Med. 1999, 6, 27–32. [PubMed] [Google Scholar]
- (40).Carr R; Zhang C; Moles N; Harder M Identification and mapping of heavy metal pollution in soils of a sports ground in Galway City, Ireland, using a portable XRF analyser and GIS. Environ. Geochem. Health 2008, 30, 45–52. [DOI] [PubMed] [Google Scholar]
- (41).Schwarz K; Pickett ST; Lathrop RG; Weathers KC; Pouyat RV; Cadenasso ML The effects of the urban built environment on the spatial distribution of lead in residential soils. Environ. Pollut. 2012, 163, 32–39. [DOI] [PubMed] [Google Scholar]
- (42).Arora P; Boyne D; Slater JJ; Gupta A; Brenner DR; Druzdzel MJ Bayesian networks for risk prediction using real-world data: a tool for precision medicine. Value Health 2019, 22, 439–445. [DOI] [PubMed] [Google Scholar]
- (43).Pearl J Probabilistic Reasoning in Intelligent Systems: Networks of Plausible Inference; Morgan Kaufmann: San Mateo, CA, 1988. [Google Scholar]
- (44).Koller D; Friedman N Probabilistic Graphical Models: Principles and Techniques; MIT Press, 2009. [Google Scholar]
- (45).Conrady S; Jouffe L Bayesian Networks and BayesiaLab: A Practical Introduction for Researchers; Bayesia: USA, 2015. [Google Scholar]
- (46).De Villiers S; Thiart C; Basson NC Identification of sources of environmental lead in South Africa from surface soil geochemical maps. Environ. Geochem. Health 2010, 32, 451–459. [DOI] [PubMed] [Google Scholar]
- (47).Meyer DR Midwestern industrialization and the American manufacturing belt in the nineteenth century. J. Econ. Hist. 1989, 49, 921–937. [Google Scholar]
- (48).Heberle R Social consequences of the industrialization of southern cities. Social Forces 1948, 27, 29. [Google Scholar]
- (49).He K; Sun Z; Hu Y; Zeng X; Yu Z; Cheng H Comparison of soil heavy metal pollution caused by e-waste recycling activities and traditional industrial operations. Environ. Sci. Pollut. Res. 2017, 24, 9387–9398. [DOI] [PubMed] [Google Scholar]
- (50).Weissmannová HD; Pavlovský J Indices of soil contamination by heavy metals–methodology of calculation for pollution assessment (minireview). Environ. Monit. Assess. 2017, 189, No. 616. [DOI] [PubMed] [Google Scholar]
- (51).Lanphear BP; Burgoon DA; Rust SW; Eberly S; Galke W Environmental exposures to lead and urban children’s blood lead levels. Environ. Res. 1998, 76, 120–130. [DOI] [PubMed] [Google Scholar]
- (52).Laidlaw MA; Mohmmad SM; Gulson BL; Taylor MP; Kristensen LJ; Birch G Estimates of potential childhood lead exposure from contaminated soil using the US EPA IEUBK Model in Sydney, Australia. Environ. Res. 2017, 156, 781–790. [DOI] [PubMed] [Google Scholar]
- (53).Cassidy-Bushrow AE; Sitarik AR; Havstad S; Park SK; Bielak LF; Austin C; Johnson CC; Arora M Burden of higher lead exposure in African-Americans starts in utero and persists into childhood. Environ. Int. 2017, 108, 221–227. [DOI] [PMC free article] [PubMed] [Google Scholar]
- (54).Aelion CM; Davis HT; Lawson AB; Cai B; McDermott S Associations between soil lead concentrations and populations by race/ethnicity and income-to-poverty ratio in urban and rural areas. Environ. Geochem. Health 2013, 35, 1–12. [DOI] [PMC free article] [PubMed] [Google Scholar]
- (55).Estimation of Relative Bioavailability of Lead in Soil and Soil-Like Materials Using In Vivo and In Vitro Methods; Office of Solid Waste and Emergency Response, US Environmental Protection Agency: Washington, DC, 2007. [Google Scholar]
- (56).Yan K; Dong Z; Wijayawardena MA; Liu Y; Naidu R; Semple K Measurement of soil lead bioavailability and influence of soil types and properties: a review. Chemosphere 2017, 184, 27–42. [DOI] [PubMed] [Google Scholar]
- (57).Wu J; Edwards R; He XE; Liu Z; Kleinman M Spatial analysis of bioavailable soil lead concentrations in Los Angeles, California. Environ. Res. 2010, 110, 309–317. [DOI] [PubMed] [Google Scholar]
- (58).Filippelli GM; Laidlaw MA; Latimer JC; Raftis R Urban lead poisoning and medical geology: an unfinished story. GSA Today 2005, 15, 4–11. [Google Scholar]
- (59).Zupančič N Lead contamination in the roadside soils of Slovenia. Environ. Geochem. Health 1999, 21, 37–50. [Google Scholar]
- (60).Clark JJ; Knudsen AC Extent, characterization, and sources of soil lead contamination in small-urban residential neighborhoods. J. Environ. Qual. 2013, 42, 1498–1506. [DOI] [PubMed] [Google Scholar]
- (61).Mielke HW Lead in New Orleans soils: new images of an urban environment. Environ. Geochem. Health 1994, 16, 123–128. [DOI] [PubMed] [Google Scholar]
- (62).Environmental Protection Agency US. Report on the National Survey of Lead-Based Paint in Housing: Base Report., 1995; Vol. 747, p R95–003. [Google Scholar]
- (63).Harter RD Effect of soil pH on adsorption of lead, copper, zinc, and nickel. Soil Sci. Soc. Am. J. 1983, 47, 47–51. [Google Scholar]
- (64).Bravo S; Amorós JA; Pérez-De-Los-Reyes C; García FJ; Moreno MM; Sánchez-Ormeño M; Higueras P Influence of the soil pH in the uptake and bioaccumulation of heavy metals (Fe, Zn, Cu, Pb and Mn) and other elements (Ca, K, Al, Sr and Ba) in vine leaves, Castilla-La Mancha (Spain). J. Geochem. Explor. 2017, 174, 79–83. [Google Scholar]
- (65).Leong CK Credit risk scoring with bayesian network models. Comput. Econ. 2016, 47, 423–446. [Google Scholar]
- (66).Witteveen A; Nane GF; Vliegen IM; Siesling S; IJzerman MJ Comparison of logistic regression and Bayesian networks for risk prediction of breast cancer recurrence. Med. Decis. Making 2018, 38, 822–833. [DOI] [PubMed] [Google Scholar]
- (67).Christodoulou E; Ma J; Collins GS; Steyerberg EW; Verbakel JY; Van Calster B A systematic review shows no performance benefit of machine learning over logistic regression for clinical prediction models. J. Clin. Epidemiol. 2019, 110, 12–22. [DOI] [PubMed] [Google Scholar]
- (68).Marschner B; Welge P; Hack A; Wittsiepe J; Wilhelm M Comparison of soil Pb in vitro bioaccessibility and in vivo bioavailability with Pb pools from a sequential soil extraction. Environ. Sci. Technol. 2006, 40, 2812–2818. [DOI] [PubMed] [Google Scholar]
- (69).Environmental Protection Agency US. 40 CFR Part 745. Lead: Identification of dangerous levels of lead (final rule) Fed. Regist. 2001, 4, 66, 1206, 1240. [Google Scholar]
- (70).Laidlaw MA; Filippelli GM; Brown S; Paz-Ferreiro J; Reichman SM; Netherway P; Truskewycz A; Ball AS; Mielke HW Case studies and evidence-based approaches to addressing urban soil lead contamination. Appl. Geochem. 2017, 83, 14–30. [Google Scholar]
- (71).Betts KS CDC Updates Guidelines for Children’s Lead Exposure; National Institute of Environmental Health Sciences, 2012. [DOI] [PMC free article] [PubMed] [Google Scholar]
Associated Data
This section collects any data citations, data availability statements, or supplementary materials included in this article.