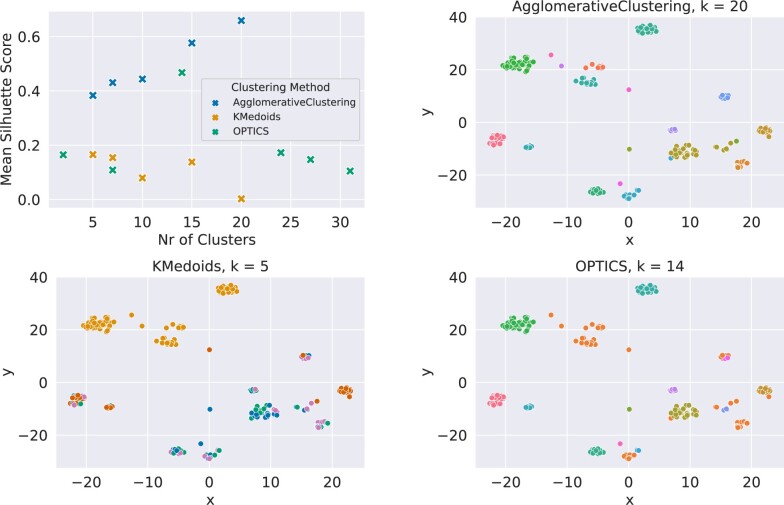
Fig. 3.
Comparison of clustering algorithms. Top-left shows the mean Silhouette score s for all three different clustering methods and a number of different numbers of clusters. AgglomerativeClustering achieves high scores for all numbers of clusters, with higher scores for higher numbers of clusters and a maximum of s = 0.66 for k = 20. OPTICS shows an optimum for k = 14 clusters with a score of s = 0.47, while K-medoids has low scores for any number of clusters. The other plots show t-SNE plots, where samples are color-coded according to their cluster assignment. The plots were generated for the number of clusters resulting in the highest Silhouette score for each clustering method, respectively. All clustering results are shown for the binding class

