

Abstract
The brain areas that mediate the formation of auditory threat memory and perceptual decisions remain uncertain to date. Candidates include the primary (A1) and secondary (A2) auditory cortex, the medial division of the medial geniculate body (MGm), amygdala, and the temporal association cortex. We used chemogenetic and optogenetic manipulations with in vivo and in vitro patch-clamp recordings to assess the roles of these brain regions in threat memory learning in female mice. We found that conditioned sound (CS) frequency-dependent plasticity resulted in the formation of auditory threat memory in the temporal association cortex. This neural correlated auditory threat memory depended on CS frequency information from A1 glutamatergic subthreshold monosynaptic inputs, CS lateral inhibition from A2 glutamatergic disynaptic inputs, and non–frequency-specific facilitation from MGm glutamatergic monosynaptic inputs. These results indicate that the A2 and MGm work together in an inhibitory-facilitative role.
SIGNIFICANCE STATEMENT: The ability to recognize specific sounds to avoid predators or seek prey is a useful survival tool. Improving this ability through experiential learning is an added advantage requiring neural plasticity. As an example, humans must learn to distinguish the sound of a car horn, and thus avoid oncoming traffic. Our research discovered that the temporal association cortex can encode this kind of auditory information through tonal receptive field plasticity. In addition, the results revealed the underlying synaptic mechanisms of this process. These results extended our understanding of how meaningful auditory information is processed in an animal's brain.
Keywords: auditory cortex, auditory fear conditioning, medial geniculate body, plasticity, temporal association cortex
Introduction
Auditory fear conditioning (AFC) is a classical Pavlovian fear conditioning that has been extensively used to study the perceptual decisions associated with auditory threat information. Multiple brain regions have been found to mediate auditory threat memory, including the auditory cortex (AC) (Campeau and Davis, 1995; Yang et al., 2016), medial geniculate body (MG) (Cruikshank et al., 1992; Bordi and LeDoux, 1994), inferior colliculus (Yan and Ehret, 2002; Y. Zhang and Suga, 2005), amygdala (LeDoux, 2003; Phelps and LeDoux, 2005), temporal association cortex (TeA) (Cho et al., 2016; Dalmay et al., 2019), and PFC (Gilmartin et al., 2014). It has long been debated which area, the AC [both primary (A1) and secondary (A2)], the MG [specifically the medial division (MGm)], and/or the amygdala, is critical for the formation of auditory threat memory. The amygdala, where auditory threat memories are acquired and stored, is believed to be the neural basis of AFC (Maren and Quirk, 2004). However, the MGm exhibits the same criteria that are used to support the “amygdala model” (LeDoux, 1992), and is also considered to underlie AFC (Weinberger, 2011). The AC (A1 and A2) has been intensely investigated for its role in threat memory acquisition and expression in lesion (Campeau and Davis, 1995; Sacco and Sacchetti, 2010), pharmacological, and optogenetic inactivation studies (Wigestrand et al., 2017; Dalmay et al., 2019). Nevertheless, the results are variable or contradictory.
Auditory threat memories are considered to be acquired and stored by population plasticity. Acquired population plasticity, a learning-dependent reorganization that is based on functional tuning shifts, is determined by corticocortical and corticofugal modulations (Suga, 2012). Therefore, the AC should be the critical neural basis for auditory threat memory formation. Recently, the TeA has been proposed to play a critical role in cued threat memory (Dalmay et al., 2019). In terms of population plasticity because of tuning shifts, TeA neurons would be expected to acquire some plasticity. The TeA relays the cues of auditory threat memory to the amygdala. However, the MGm and the AC (A1 and A2) cannot be two parallel centers. Understanding the relationship between the TeA and the MGm/AC thus becomes important. This would help to address how TeA neurons undergo the special plasticity underlying auditory threat memory.
The TeA receives inputs from the auditory system (e.g., A1, A2, and MGm) (Romanski and LeDoux, 1993; Shi and Cassell, 1997). It also receives nonauditory inputs from almost all other sensory cortices (Zingg et al., 2014), as well as cognitive-related regions, such as the amygdala, orbitofrontal cortex, and hippocampus (Tasaka et al., 2020). The TeA is adjacent to A1 and A2 and is a high-order AC, or a site that integrates sound with other information. In AFC, an acoustic signal is characterized by its frequency. However, it is unknown whether the neurons in TeA attune to sound frequency. According to Suga's working model of tuning shifts (Suga, 2012, 2020), the tuning of TeA neurons should be shifted by AFC; these sound-specific tuning shifts might result from corticocortical interactions (e.g., A1) and corticofugal feedback (e.g., ventral MG, MGv) through the lemniscal nuclei. The nonlemniscal nuclei (e.g., A2 and the MGm) might play an essential role in the sensitization elicited by pseudo-conditioning (Diamond and Weinberger, 1986; Ma and Suga, 2009).
In this study, we used a combined approach of behavioral training and testing using a classic AFC model, chemogenetic and optogenetic manipulations, and loose-patch and whole-cell recordings. We found that TeA neurons responded to pure tones without any frequency preference in untrained animals but showed a specific preference for the training frequency tones in trained animals. This sound-specific perceptual encoding is derived from the specific subthreshold excitatory input from A1, modified by the inhibitory-facilitative function of the A2 and the MGm.
Materials and Methods
Animal preparation
A total of 126 C57BL/6J female mice (4-8 weeks old, 14-25 g, housed under a 12 h light/dark cycle) were used in the experiment and were provided by the Experimental Animal Center of Southern Medical University, Guangzhou, China. Mice were tested for normal hearing before the experiments. All experiments were conducted under the approval and supervision of the Animal Care and Use Committee of Southern Medical University.
As described in our previous publications (X. R. Xiong et al., 2013; Xiao et al., 2018), anesthesia was induced by intraperitoneal injection of sodium pentobarbital (60-70 mg/kg, Sigma). The animal was mounted on a stereotaxic apparatus and the skull was exposed. A 1.5-cm-long nail was mounted on the top of the skull for the electrophysiological experiments. An optic fiber (200 mm, Newdoon) was embedded in the skull over the TeA (2.9 mm posterior to bregma, 4.7 mm lateral to the midline) for optogenetic manipulation. After surgery, local anesthetic (lidocaine hydrochloride) and antibiotic ointment (erythromycin) were applied to the surgical wound, and each mouse was housed alone for recovery for at least 7 d.
After the recovery period, the animals were placed in an environment similar to that of the electrophysiological recording. The head of the mouse was mounted by connecting the metal head nail glued onto the mouse skull to the fixing rod. The fixing rod was kept at a certain angle, which was the same as that on an anti-vibration table (TMC). A circular plastic disk that rotates freely around its axis was placed under the mice's feet such that they could run freely on the disk. Training was repeated for ∼1-2 h/day for ∼3 d until the mice had gradually adapted to the simulated recording environment, in which they exhibited a comfortable and quiet state (Abe et al., 2014). On the last day of adaptive training, after fixing the mouse on the table, the skull above the target recording brain area was removed under a microscope using a skull drill. The opening was then polished into a 0.5 × 0.5 mm round hole without removing the dura and covered with Vaseline.
In vivo electrophysiological recordings in awake mice
All in vivo electrophysiological recordings were performed in a sound-shielded room at 23°C-26°C. The head of the awake mouse was fixed on the anti-vibration table, the Vaseline and dura were removed, and the pia mater was impaled. Local field potential (LFP) recordings and loose-patch recordings were performed using a MultiClamp 700B amplifier (Molecular Devices/Molecular Devices) in voltage-clamp mode, without holding the voltage, as previously reported (Turner et al., 2005; X. R. Xiong et al., 2013). A glass pipette (tip ∼1 µm in diameter, 5-7 mΩ impedance) filled with ACSF (in mm: 124 NaCl, 2.5 KCl, 1.2 NaH2PO4, 25 NaHCO3, 1 MgCl2, 2 CaCl2, 20 glucose; pH 7.35) was used for signal recordings. In LFP recordings, signals were filtered with a 10-300 Hz bandpass filter. The pipettes, with 5 psi positive pressure, were vertically placed on top of the TeA using a micromanipulator (Siskiyou), and quickly advanced to a depth of 100-900 µm. Subsequently, the positive pressure was then released, and the evoked potentials in response to repeated pure tone stimulation was recorded using BrainWare 32 and Clampex 10.2 software. In loose-patch recordings, the patch pipette with a 0.5-1 psi positive pressure was advanced in 1 µm steps until the impedance changed to ∼10-20 mΩ. The positive pressure was then switched to a negative pressure (∼0.3 psi) until a loose seal (0.1-0.5 GΩ) was formed on the cell body, which allowed signals (spikes) only from the patched neuron to be recorded. Spikes were filtered at 300-3000 Hz and recorded by the same software as LFP recordings.
According to the coordinates of the The Allen Institute (2011), we mapped the recording sites (posterior to bregma, lateral to the midline, and below the brain surface, in mm) of the TeA, A1, A2, and MGm (TeA: −2.3 to −3.6, 4.7-5.0, 0.2-0.8; A1: −2.5 to −3.6, 4.0-4.5, 0.2-0.8; A2: −2.3 to −3.5, 4.5-4.7, 0.2-0.8; MGm: −3.0 to −3.4, 1.6-1.7, 2.7-3.1). During the A2 and TeA recording sessions, the animal's head was laterally rotated 80° to make the recording sites more easily accessible, and fixed as shown in the atlas when recording in A1 and the MGm.
Sound stimulation
As described in our previous experiments (X. R. Xiong et al., 2013; Xiao et al., 2018), acoustic stimuli (0.94-30 and 2-64 kHz tone bursts) were generated using a Tucker-Davis Technologies System 3 (TDT 3, Tucker-Davis Technologies). All the sound programs were compiled using RPvdsEx software and were then loaded into the Multifunction Processor (RX6) to generate sound waveforms (the sine curve started at zero phase, was 50 ms in duration, and had a 5 ms rise/fall time). The intensities of the sound were controlled by a programmable attenuator (PA5). The synthesized signals from RX6 were amplified using an electrostatic speaker driver (ED1) and delivered through a loudspeaker (ES1, frequency range 2-110 kHz) placed 15 cm in front of the animal. Before the experiments, the loudspeaker was calibrated by an amplifier (Bruker and Kjaer 2610) connected to 1/4- and 1/8-inch microphones (Bruker and Kjaer 4135). The tone amplitudes were expressed as sound pressure levels (SPL, 0 dB = 20 µPa). In LFP recordings, the tone bursts varied in frequency (2-64 kHz, at 0.5 octave steps) and amplitude (40-80 dB SPL, 10 dB steps). In loose-patch recordings, the tone bursts varied in frequency (2-64 or 0.94-30 kHz, at 0.5 octave steps, in untrained and trained animals, respectively) and amplitude (10-80 dB SPL, 10 dB steps) for the frequency-amplitude scans. The sound parameters were controlled by BrainWare software through a computer, and stimuli were presented pseudo-randomly at a rate of 1/s. The frequency-amplitude scans were repeated 5-10 times to map a complete tonal receptive field (TRF) and obtain an array of peri-stimulus time histograms.
Viral injection
For virus injection, mice were anesthetized with sodium pentobarbital (60-70 mg/kg) and positioned in a stereotaxic frame (Reward). Body temperature was maintained at 37°C using a heating pad. Viruses were injected through a small skull opening (≤0.5 mm2) using a glass micropipette (Drummond Scientific) with a tip diameter of 20-30 µm, driven by a microinjector (KD Scientific). Stereotaxic coordinates (posterior to bregma, lateral to the midline, and below the brain surface, in mm) were as follows: TeA: −2.9, 4.8, 0.3, and 0.6; A1: −3.0, 4.2, 0.3, and 0.6; A2: −2.9, 4.6, 0.3, and 0.6; MGm: −3.0, 1.7, and 2.9. For precise injection, the animal's head was laterally rotated at 80° for TeA and A2 injection and rotated at 70° for A1 injection. During MGm injection, the animal's head was fixed as shown in the The Allen Institute (2011).
For rAAV-hSyn-hM4D(Gi)-EGFP (PT-0153, Brain VTA), we separately injected 100 nl (∼2.8 × e12 virus particles per ml) into the bilateral TeA and waited 3-4 weeks for maximal expression before AFC. For rAAVretro-CAG-EGFP (PT-0305, Brain VTA), we injected 80-100 nl (∼e13 virus particles per ml) into the TeA in one side of the brain, and waited 3-4 weeks for maximal expression before killing the mice. For rAAV-CaMKIIa-hChR2 (H134R)-mCherry and rAAV-CaMKIIa-eNpHR3.0-EYFP (PT-0297 and PT-0008, Brain VTA), we injected 100 nl (∼5 × e12 virus particles per ml) into A1 and A2, respectively, and 30 nl into the MGm, in one hemisphere.
Optogenetic activation
To separately activate A1, A2, and MGm glutamatergic axon terminals in the TeA, an optic fiber was connected to a blue LED source (472 nm, Thorlabs). To separately inhibit A1, A2, and MGm glutamatergic axon terminals in the TeA, the optic fiber was connected to a yellow LED source (591 nm, Thorlabs). The tip of the optic fiber was fixed with black tape to prevent light leakage. To ensure specificity of the optogenetic stimulation, no hChR2- or eNpHR3.0-expressing fibers and structures other than the targeted structure were present in the light pathway within 800 mm from the end of the optic fiber. The axis of the light pathway was the same as the central axis of the optic fiber, and the illumination angle was determined by the fiber's NA value (G. W. Zhang et al., 2018). After each experiment, the brain was sectioned and imaged under a confocal microscope to confirm the expression of hChR2-mCherry or eNpHR3.0-EYFP. Animals with hChR2- or eNpHR3.0-expressing cells in >30% of the MGm area were excluded since MGm is small and slender.
C-FOS fluorescent immunohistochemistry
C-FOS protein expression has been shown to peak at 60-180 min after stimulus onset (Ramírez-Amaya et al., 2005). Therefore, we chose a 90 min timeframe. Mice were randomly divided into four groups (3 mice per group): control awake, control anesthetized, tone stimulation awake, and tone stimulation anesthetized. Tone stimulation is a 15 kHz pure tone, 80 dB SPL with a 50 ms duration and 5 ms rise/fall time, delivery rate 1 Hz, and anesthesia is induced by urethane (20%, 1 g/kg). All groups were adaptively trained for 1 week after the operation and were then individually placed in the sound-shielded room (mice in the anesthesia group were anesthetized at the same time) to receive 90 min of tone stimulation. Urethane was then intraperitoneally injected into the awake mice. Once anesthetized, mice were transcardially perfused via the ascending aorta with 50 ml ice-cold saline, followed by 50 ml 4% PFA/0.1 m PB, pH 7.4. Brains were subsequently removed and stored in PFA fixative for 24 h (4°C). After fixation, the samples were washed under running water, 20% and 30% sucrose solutions were used for gradient dehydration. Free-floating sequential coronal brain sections containing the TeA from both the right and left hemispheres were sliced using a vibratome (Leica) at 40 µm per section (with a total of 15 sections [1 of every 5 sections]/mouse). Sections were treated with an anti-C-FOS polyclonal rabbit antibody (Ab190289, Abcam) and then with goat anti-rabbit IgG AlexaFluor-488 (A-11070, Invitrogen). Brain sections were scanned using a laser scanning confocal microscope (A1R, Nikon), and the number of cells immunoreactive for C-FOS in the stained sections was quantified using NIS elements software.
Brain slice electrophysiology
As in our previous experiment (Ji et al., 2016), mice were anesthetized using urethane. After rapidly dissecting the mouse brain, coronal 300 µm slices containing the TeA from the virus-infected brain hemisphere were prepared in ice-cold cutting solution (60 mm NaCl, 3 mm KCl, 1.25 mm NaH2PO4, 25 mm NaHCO3, 115 mm sucrose, 10 mm glucose, 7 mm MgCl2, 0.5 mm CaCl2; 300-305 mOsm/L; pH 7.4) using a vibratome (Leica, VT1200S). Slices were transferred to the holding chamber and incubated in fresh ACSF at 34°C to recover for 30 min. The slices were kept at room temperature before recordings. Both the cutting solution and ACSF were continuously bubbled with 95% O2 and 5% CO2. Slices were submerged in a recording chamber and perfused with ACSF at 3-4 ml/min using a pump (Longer Pump). Whole-cell patch-clamp recordings were made under an upright microscope (Eclipse FN1, Nikon). Patch pipettes were filled with a K+-based internal solution containing 140 mm K+-gluconate, 9 mm HEPES, 5 mm EGTA, 4 mm Mg-ATP, 0.3 mm GTP, 4.5 mm MgCl2, and 4.4 mm phosphocreatine sodium (pH 7.3, 295 mOsm). EPSCs and IPSCs were recorded by clamping the cell's membrane potential at −70 and 0 mV, respectively. To record light-evoked EPSCs and IPSCs, 5 ms, 5 mW blue LED light (472 nm, Thorlabs) was delivered through the objective to the TeA. Light-evoked PSCs were recorded before and after perfusion with TTX (a sodium channel blocker, 1 µm) and 4-AP; a potassium channel blocker, 1 mm) so that different synaptic responses could be measured.
Fear conditioning and chemogenetics
In line with previous studies (Boatman and Kim, 2006; Curzon et al., 2009; X. Zhang et al., 2019; Xie et al., 2020), mice underwent AFC in custom-made behavioral boxes in a sound-attenuation booth (Xinruan Technologies). The training box was an opaque plastic box with black and white stripes on two opposite walls, and was equipped with parallel metal wires that delivered a scrambled electric foot shock on the bottom. The loudspeaker in the training box was replaced with another loudspeaker (ES1, 2-110 kHz connected to a TDT 3 with an RX6, a PA5, and an ED1), which was located 20 cm above the floor. The testing box was an acrylic box with a removable plank, which was cleaned with 70% ethanol before and after each session. On the first day, each mouse was brought into the training box for 20 min of habituation, and was then returned to its home cage. On the second day, conditioning in the training box was administered; after 2 min of habituation, animals in the training group were exposed to 30 s of conditioned sound (CS; 15 kHz or 7.5 kHz tone) coterminated with a 2 s, 0.5 mA electric foot shock (unconditioned stimulus [US]) 6 times. The control group received the same treatment as the training group, but without a US. On the third day, for each test, mice from both groups were put into the testing box for 3 min of habituation, and the CS was delivered as in the conditioning session for 3 min without the US. We conducted the procedure in the dark, the movements of animals were video-recorded using an infrared camera, and a blind procedure was implemented for the behavioral analysis. The fear response was scored as the percentage of freezing time (no movement detected for at least 1 s, except for heartbeat and respiratory movements) during the presentation of the CS alone. The total freezing time during CS presentation was measured using video analysis.
In experiments with chemogenetic inhibition during conditioning, clozapine-N-oxide (CNO; 0.3 mg/kg) or normal saline was intraperitoneally injected 1 h before conditioning. Conditioned mice were submitted to retrieval of threat memory ∼24 h later in the testing box, during which they received 3 min of CS. In experiments with chemogenetic inhibition during testing, 23 h after 15 CS/foot-shock pairings conditioning, CNO (0.3 mg/kg) or normal saline was intraperitoneally injected before testing, and mice received 3 min of CS 1 h later.
Data processing and statistics
The boundaries of synaptic responses of TRFs were defined using custom-developed software (MATLAB2012b, The MathWorks), with which the spike shapes were also extracted. Response onset latency was calculated from peristimulus time histograms (PSTHs) by the time point at which spiking activity exceeded the average baseline firing rate (FR; measured during the 100 ms time window before the stimulus onset, unless otherwise specified) by 2 SDs of baseline fluctuations. The response threshold was defined as the minimum stimulus intensity that induced a tone-evoked spike response in a cell. Latency and bandwidth values were calculated using Excel 2016 (Microsoft). Data plotting was conducted using OriginPro8 (OriginLab) and Prism 8 (GraphPad). The FR was calculated as the evoked FR (calculated within the 50 ms window after stimulus onset) minus the baseline FR.
We used SPSS 20.0 (IBM) for statistical analyses. t tests were used to make two-group comparisons. Comparisons between more than two groups were performed using one- or two-way ANOVAs. Post hoc multiple comparisons tests were performed using Dunnett's test (for comparisons of two or more conditions) or the Least Significant Difference test (LSD; for comparisons of three or more conditions). The F test was used to evaluate the equality of variances. Since threshold and bandwidth are categorical data (not continuous), the Wilcoxon rank sum test was used to make two-pair-group comparisons; comparisons between more than two groups were performed using the Kruskal−Wallis test; post hoc multiple comparisons tests were performed using the Conover–Iman all pairs comparison test. Statistical significance was defined as a p value <0.05. The results are presented as the mean ± SD, unless otherwise specified.
Results
The TeA is required for threat memory acquisition and expression
The neocortex, especially the TeA, has been suggested to be critical for threat memory, as shown by optogenetic inactivation of A1, A1-A2, or A2-TeA (Dalmay et al., 2019). Designer receptors exclusively activated by designer drugs-based chemogenetic tools are now commonly used by neuroscientists to identify the circuitry and cellular signals that underlie behavior (Roth, 2016). Gi-coupled hM4D (hM4D(Gi)), which can be activated by CNO, is the most commonly used inhibitory designer receptors exclusively activated by designer drugs (Armbruster et al., 2007; Urban and Roth, 2015). Previous studies have reported successful neuronal silencing using hM4D(Gi) (Armbruster et al., 2007). To validate that the TeA is critical for classical AFC, we silenced TeA neurons by locally injecting recombinant adeno-associated virus (AAV) encoding hM4D(Gi) fused with EGFP under the control of the human synapsin (hSyn) promoter (AAV-hSyn-hM4D(Gi)-EGFP) (Fig. 1A). Four weeks later, retrieval testing was performed with intraperitoneal CNO injection preconditioning (Fig. 1A) and postconditioning (Fig. 1B). The AAV-hM4D(Gi) was well expressed (Fig. 1C). Impairment of threat memory acquisition (Baseline CNO group: 1.79 ± 4.25%; Baseline saline group: 12.49 ± 4.25%; CS CNO group: 12.04 ± 5.05%; CS saline group: 81.51 ± 16.69%; Baseline CNO group vs Baseline saline group, p = 0.007; CS CNO group vs CS saline group, p < 0.001, unpaired t test; Baseline CNO group vs CS CNO group, p = 0.002; Baseline saline group vs CS saline group, p < 0.001, paired t test; Fig. 1D, left) and expression (Baseline CNO group: 4.61 ± 2.66%; Baseline saline group: 6.33 ± 5.45%; CS CNO group: 17.73 ± 10.53%; CS saline group: 55.75 ± 6.71%; Baseline CNO group vs Baseline saline group, p = 0.141; CS CNO group vs CS saline group, p < 0.001, unpaired t test; Baseline CNO group vs CS CNO group, p = 0.023; Baseline saline group vs CS saline group, p < 0.001, paired t test; Fig. 1D, right) to pure tone CS (15 kHz) were observed by the significant reduction of the freezing index (Fig. 1D).
Figure 1.
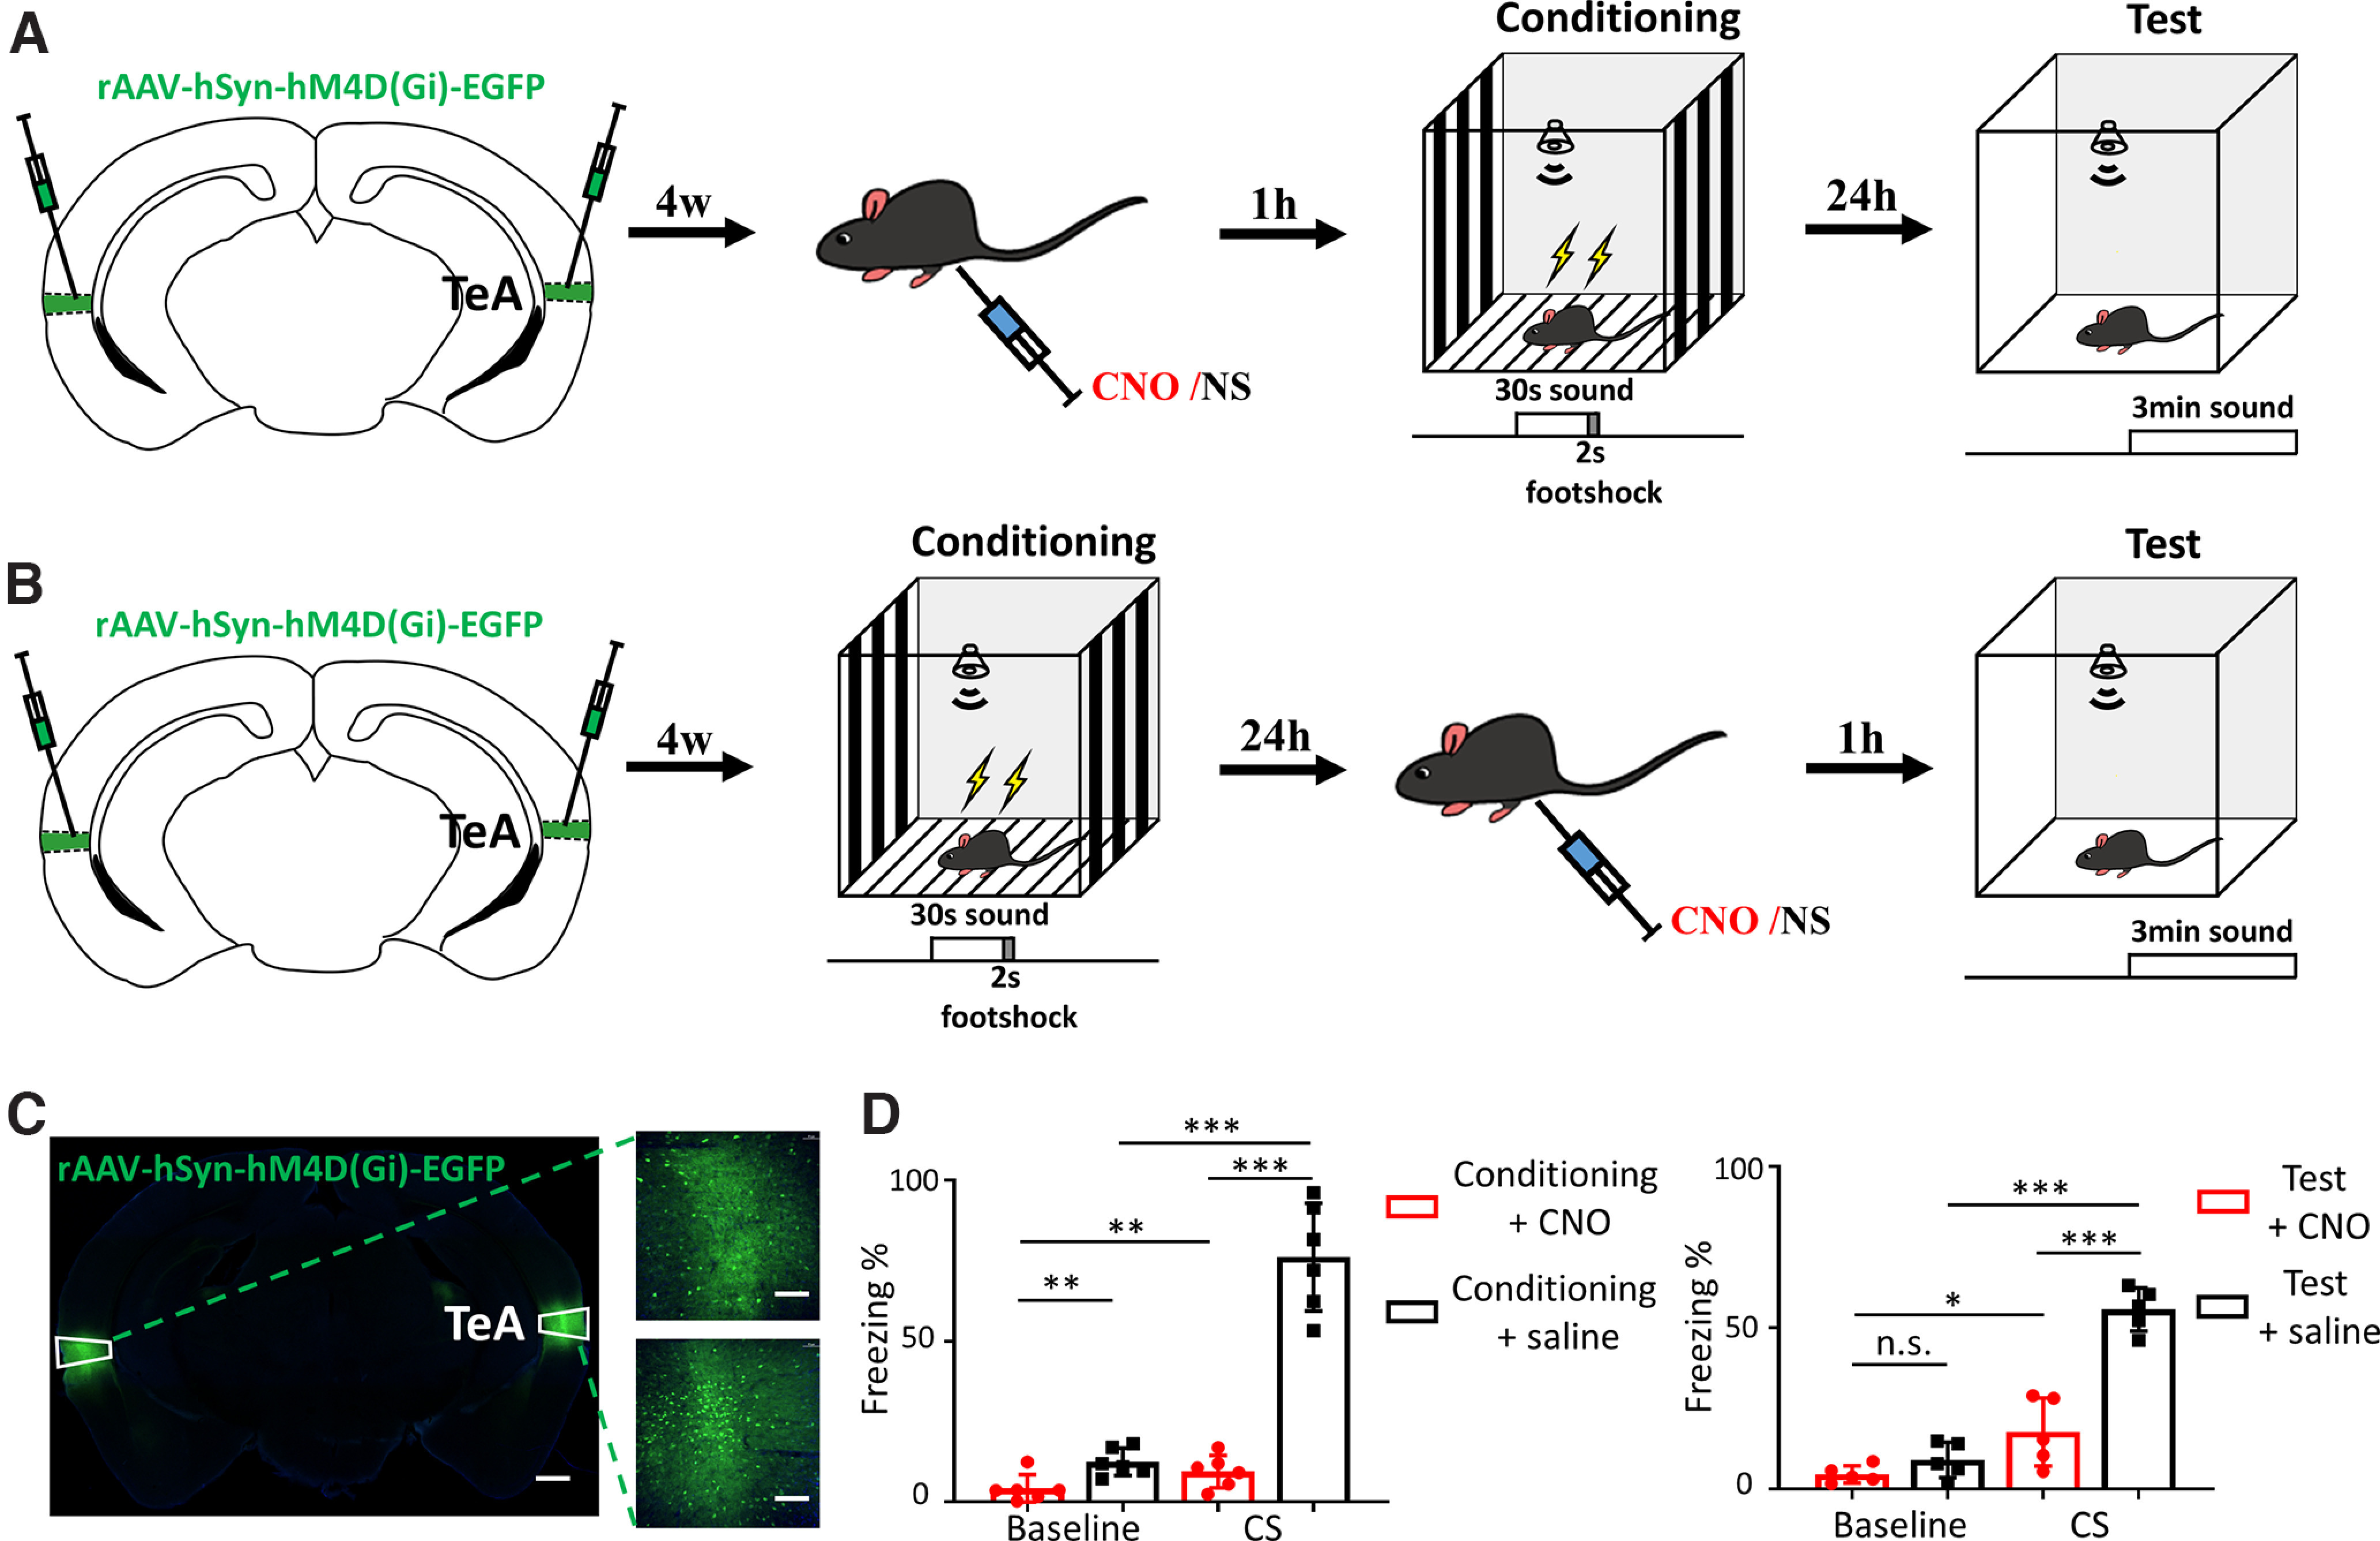
Impairment of threat memory acquisition and expression by TeA inhibition. A, TeA inhibition during conditioning. B, TeA inhibition during testing. NS, normal saline. C, Injection of AAV-hM4D (Gi) in the bilateral TeA (left). Scale bar, 500 μm. Right, Enlarged figures of the boxed areas. Scale bar, 100 μm. D, Freezing during testing. Left, CNO injection before conditioning induced hM4D-mediated inhibition of the TeA, which led to strongly reduced freezing in response to 15 kHz CS (n = 6, red) compared with saline injection controls (n = 6, black). Right, CNO injection to inhibit the TeA before testing also induced reduced freezing to 15 kHz CS (n = 5, red) compared with saline injection controls (n = 5, black red). *p < 0.05. **p < 0.01. ***p < 0.001.
TeA neurons respond to pure tones without frequency preference in awake animals only
To date, it is not known whether neurons in the TeA tune to sound frequency. Using C-FOS immunofluorescence staining, we found that TeA neurons responded to 15 kHz pure tones, far more in awake mice than in anesthetized mice (Fig. 2A; in cell counts: Control anesthetized group: 33.67 ± 6.03; Control awake group: 65.00 ± 15.13; Tone stimulation anesthetized group: 81.00 ± 5.29; Tone stimulation awake group: 237.33 ± 46.74; Control anesthetized group vs Control awake group: p = 0.029; Tone stimulation anesthetized group vs Tone stimulation awake group: p = 0.005; Control anesthetized group vs Tone stimulation anesthetized group: p < 0.001; Control awake group vs Tone stimulation awake group: p = 0.004, unpaired t test; Fig. 2B). However, C-FOS expression did not reveal frequency tuning. The easiest way to determine this is by recording LFPs. In anesthetized mice, no response to any frequency sound was recorded (data not shown). Only in awake animals (Fig. 2C) did recording sites (Fig. 2D) show responses to 2-64 kHz pure tones at high intensities (>40 dB) (Fig. 2E,F). The normalized data revealed that the response amplitude increased as the sound intensity increased (p < 0.001, one-way ANOVA; Fig. 2G) but without frequency preference (p = 0.543, one-way ANOVA; Fig. 2H).
Figure 2.

C-FOS immunofluorescence and LFP revealed that the TeA responds to tones in awake mice. A, Example images of C-FOS immunofluorescence, the area between two white dashed lines indicates the TeA. Scale bar, 200 μm. Enlarged figure of C-FOS protein in the upper left picture. Scale bar, 10 μm. B, The C-FOS immunofluorescence cell counts of the TeA under control and pure tone stimulation in anesthetized and awake mice; n = 3 mice for each group. Error bar indicates SD. *p < 0.05. **p < 0.01. ***p < 0.001. C, Recording setup. P, Post for head fixation; S, speaker; R, recording pipette. D, Distribution of the electrode tip when recording in the TeA. Arrow indicates the recorded site shown in E, F. E, An example recording of tone-evoked LFP waveforms in the TeA. F, LFP amplitude in response to tones of different frequencies and intensities for the same site. G, Normalized amplitude evoked by tones at different intensity levels (i.e., amplitude-intensity function) averaged for all recording sites (n = 15 from 3 mice). Error bar indicates SD. ***p < 0.001. H, Normalized amplitude evoked by tones at different frequencies together (i.e., amplitude-frequency function) averaged for all recording sites; n = 15.
CS frequency-dependent plasticity for the formation of auditory threat memory in the TeA
The TeA plays an indispensable role in AFC (Trumpp et al., 2013; Dalmay et al., 2019). Auditory information should be linked to learning-induced plasticity in the TeA. Therefore, AFC might induce some special plasticity in the TeA that allows for the identification of the conditioning tones (sound frequency).
We used a classic AFC procedure (Boatman and Kim, 2006). Mice in the training group were fear-conditioned with six pairings of 30 s tone bursts (CS, 15 kHz tone, 75 dB SPL), followed by a foot shock as the US to measure the percentage of freezing time and neuronal responses during the presentation of the CS or different frequency tones (Fig. 3A). All trained animals exhibited robust freezing during training (Fig. 3B) and 24 h later (Baseline training group: 18.77 ± 11.80%; Baseline control group: 12.15 ± 5.38%; CS training group: 57.99 ± 15.94%; CS control group: 14.88 ± 8.05%; Baseline training group vs Baseline control group, p = 0.169; CS training group vs CS control group, p < 0.001, unpaired t test; Baseline training group vs CS training group, p < 0.001; Baseline control group vs CS control group, p = 0.721, paired t test; Fig. 3C). These results suggest that trained animals learned the CS (15 kHz tone) and these threat memories were stored in the TeA.
Figure 3.

Frequency-dependent plasticity in TeA acoustic response neurons after auditory fear conditioning. A, Schematic diagram of the process of auditory fear conditioning and in vivo recordings. B, C, Freezing during fear conditioning (B) and testing (C). Training group, n = 20; control group, n = 12. ***p < 0.001. D, E, One example of a single-recorded TeA neuron of the training group. D, PSTH of the FRs during tone presentation (gray shaded area) and frequency response area (E) of the same neuron to pure tones. Inset in D, spike waveforms. Calibration: 50 mV, 0.5 ms. F, G, One example of a recorded TeA neuron of the control group. F, PSTH of the FRs during tone presentation (gray shaded area) and frequency response area (G) of the same neuron to pure tones. Inset in F, spike waveforms. Calibration: 50 mV, 0.5 ms. H, Comparison of normalized spikes to different frequencies of tone between the control (n = 18) group and the training group (n = 20). Data were collected from both the right and left hemispheres. *p < 0.05. **p < 0.01. I, Normalized spikes evoked by tones at different intensity levels averaged for all responsive cells of the training group and control group. J, Comparison of the average threshold to pure tones between the control and training groups. ***p < 0.001. K, Comparison of response latency to pure tones between the control and training groups. ***p < 0.001.
After testing, we recorded the tuning from 0.94 to 30 kHz (at 0.5 octave steps, including the 15 kHz CS) of a single neuron with loose-patch recordings in awake mice. The TeA cells in trained mice exhibited stronger spike responses (Fig. 3D) and tuning to 15 kHz tone bursts with a lower threshold (50 dB SPL) (Fig. 3E), in contrast to the response (Fig. 3F) and broad range tuning with a 60 dB SPL threshold of TeA cells in untrained mice (Fig. 3G). For population cells, the responses of the TeA cells from trained mice tuned to the 15 kHz tone (F(1,17) = 2.125, p = 0.163; p0.94 kHz = 0.108, p1.33 kHz = 0.263, p1.88 kHz = 0.683, p2.65 kHz = 0.011, p3.75 kHz = 0.231, p5.30 kHz = 0.026, p7.50 kHz = 0.532, p10.60 kHz = 0.016, p15.00 kHz = 0.003, p21.21 kHz = 0.096, p30.00 kHz = 0.936, repeated-measures two-way ANOVA with the LSD multiple comparisons test; Fig. 3H) with stronger discharges (Fig. 3I), lower thresholds (Control group: 55.56 ± 5.11 dB, Training groups: 41.00 ± 3.08 dB; p<0.001, Wilcoxon rank sum test; Fig. 3J), and longer latencies (Control group: 21.72 ± 10.80 ms, Training group; 39.90 ± 12.68 ms; p<0.001, unpaired t test; Fig. 3K) than those of untrained mice. These results indicate that the auditory cues were linked to learning-induced CS frequency-dependent plasticity of TeA neurons and stored as an auditory threat memory.
The TeA mainly receives anatomic projections from A1, A2, and the MGm in the auditory pathway
We then examined how the cues of CS frequency-dependent plasticity were linked to learning. We injected retro AAV encoding EGFP into the TeA (Fig. 4A1). Dense retrogradely labeled cells were primarily observed locally in A1, A2 (Fig. 4A2) and the MGm (Fig. 4A3), but not in the MGv in the lemniscal pathway. These results show that the TeA receives inputs from A1, A2, and the MGm, as previously reported (Vaudano et al., 1991; Romanski and LeDoux, 1993; Shi and Cassell, 1997).
Figure 4.

Response characteristics of the MGm, A1, and A2 neurons compared with the TeA response to pure tones. A1, Injection of AAVretro encoding GFP in the TeA. Scale bar, 200 μm. A2, A3, Image represents labeled cells in A1 and A2 (A2) and the MGm (A3). Scale bar, 100 μm. B1-E1, PSTH for responses of an example TeA neuron (B1), A1 neuron (C1), A2 neuron (D1), and MGm neuron from the left hemisphere (E1) to pure tones. Inset, spike waveforms. Calibration: 50 μV, 0.5 ms. B2-E2, Frequency response area for responses of the same example TeA neuron (B2), A1 neuron (C2), A2 neuron (D2), and MGm neuron (E2) to pure tones. E3, Normalized FRs evoked by tones at different frequencies for all MGm-responsive cells (n = 17 from 8 animals). F1-F3, Comparison of the tone response latency (F1), threshold (F2), and bandwidth (F3) between A1 (n = 12 from 3 animals), A2 (n = 19 from 7 animals), the MGm (n = 17 from 8 animals), and the TeA (n = 31 from 20 animals). Data were collected from both the right and left hemispheres. *p < 0.05. ***p < 0.001.
We performed single-cell loose-patch recordings in awake naive mice to measure the tone response properties of the TeA, A1, A2, and MGm. The neural response properties of naive mice (Fig. 4B1,B2) were similar to those of the TeA cells in trained mice (Fig. 3D,F). A1 neurons exhibited a short onset response (Fig. 4C1) and a typical V-shaped TRF (Fig. 4C2), while A2 neurons exhibited a short onset response but a broader TRF (i.e., Fig. 4D1,D2). These results are consistent with previous studies (Hackett et al., 2011; Manca et al., 2019). However, sustained responses (Fig. 4E1) and no clear tuning were observed in MGm neurons (Fig. 4E2,E3), which were similar to TeA neurons (Fig. 4B1,B2). The MGm lacks tonotopic organization, and its neuronal responses to tones are quite heterogeneous; some MGm cells have exceptionally broad, sometimes multipeaked frequency tuning, while others exhibit narrow tuning (Aitkin, 1973; Weinberger, 2011).
We compared the latency (A1: 14.750 ± 5.723 ms, A2: 19.421 ± 5.881 ms, MGm: 16.706 ± 8.802 ms, TeA: 23.581 ± 11.564 ms; F(3,75) = 3.667, p = 0.016, one-way ANOVA; A1 vs TeA: p = 0.016, A2 vs TeA: p = 0.301, MGm vs TeA: p = 0.041, Dunnett's multiple comparisons test; Fig. 4F1), threshold (A1: 18.333 ± 13.371 dB, A2: 23.158 ± 13.765 dB, MGm: 41.765 ± 13.31 dB, and the TeA: 50.000 ± 11.832 dB; p < 0.001, Kruskal−Wallis test; A1 vs TeA: p<0.001, A2 vs TeA: p<0.001, MGm vs TeA: p = 0.077, Conover–Iman all pairs comparison test; Fig. 4F2), and bandwidths (A1: 2.042 ± 1.233 oct, A2: 2.395 ± 1.350 oct, MGm: 4.059 ± 0.864 oct, TeA: 4.548 ± 0.961 oct, respectively; p < 0.001, Kruskal−Wallis test; A1 vs TeA: p<0.001, A2 vs TeA: p < 0.001, MGm vs TeA: p = 0.579, Conover–Iman all pairs comparison test; Fig. 4F3) (the TRF width, 20 dB SPL above threshold, BW20) (Williamson and Polley, 2019) of TeA neurons (data from the untrained animals) to those of A1, A2, and MGm neurons. TeA neurons had a significantly longer latency than those of the A1 and MGm neurons, but not longer than that of A2, and had a higher threshold and wider BW20 than those of A1 and A2, but not higher or wider than that of MGm neurons. These results raise the possibility that A1, A2, and the MGm could all be auditory inputs to the TeA.
Glutamatergic projections from the MGm, but not from A1, excite TeA cells, while A2 projections evoke inhibition
To further test the function of the inputs from A1, A2, or the MGm to the TeA, we examined the axonal projections of glutamatergic neurons (Egashira et al., 2018) by injecting AAV encoding humanized channelrhodopsin2 (hChR2) under control of the CaMKIIα promoter fused with mCherry (AAV-CaMKIIα-hChR2-mCherry) in A1 (Fig. 5A1), A2 (Fig. 5B1), and the MGm (Fig. 5C1).
Figure 5.

A1, A2, and the MGm provide different functions of input to TeA neurons in untrained animals. A1-C1, A2-C2, Image represents the AAV-hChR2 injection site in left A1 (A1). Scale bar, 200 μm. Right A2 (B1). Scale bar, 100 μm. Right MGm from mouse 1 (C1). Scale bar, 100 μm. Fluorescence-labeled axons (top) and fluorescence intensity analysis (bottom) in the TeA project from A1 (A2), A2 (B2), and MGm (C2), respectively. Scale bar, 100 μm. A3-C3, One example of a recording of a single TeA neuron with A1 projection (A3), A2 projection (B3), and MGm projection (C3). Raster plots of the firing of a TeA neuron during tone presentation (gray shaded area) and tone + light presentation (blue shaded area). Tone: 0-50 ms time window; Light: 400-500 ms time window. A4-C4, Comparison of FR between LED on and off responses in TeA neurons with A1 (A4), A2 (B4), and MGm projection (C4), respectively. Data from both the right and left hemispheres. D1, D2, Light-evoked IPSC and EPSC of a TeA neuron with A1 projection (D1). Calibration: 50 pA, 20 ms. IPSCs before (red) and after (light red), EPSCs before (blue) and after (light blue) (D2). Data from both right and left hemispheres. *p < 0.05. E, Image represents a recorded neuron in L5 of a slice containing the right TeA. Blue circle represents the light illumination area. Scale bar, 100 μm. F1, F2, Light-evoked IPSC and EPSC of a TeA neuron with an A2 projection (F1). Calibration: 50 pA, 20 ms. IPSCs before (red) and after (light red) TTX and 4AP perfusion, EPSCs before (blue) and after (light blue) (F2). Data from both the right and left hemispheres. **p < 0.01. G, Proposed connections of A1, A2, and the MGm projecting to the TeA. A1, Primary AC; A2, secondary AC; MGm, medial divisions of the medial geniculate nucleus.
Tracing of fluorescence-labeled axons revealed that glutamatergic A1 and A2 neurons projected symmetrically to TeA layers 2/3, 5, and 6 (Fig. 5A2,B2). Activating the ChR2-expressing axons by delivering 100 ms of blue LED light (472 nm) onto the surface of the TeA did not induce changes in spike rates for A1 inputs (Fig. 5A3; p = 0.970, paired t test, n = 19 from 8 animals, Fig. 5A4) but completely inhibited the spontaneous and sound-evoked discharges for A2 inputs (Fig. 5B3; p = 0.004, paired t test, n = 12 from 5 animals, Fig. 5B4). These neurons fired in response to acoustic stimulation. This indicated that glutamatergic projections from A1 do not excite TeA cells and that those from A2 induce inhibition.
Tracing of fluorescence-labeled axons from the MGm revealed dense axons in the TeA, especially in layers 1, 4, and 5A, but sparse axons in layers 2/3 and 6 (Figs. 5C2, 6) (Caviness, 1975), which were different from the A1 and A2 neuron projections. The 100 ms LED blue light stimulation evoked stronger spikes than 600-700 ms from baseline (Fig. 5C3; p = 0.004, paired t test, n = 13 from 5 animals, Fig. 5C4), which indicates that glutamatergic projections from the MGm can efficiently drive TeA cells.
Figure 6.

AAV-hChR2-infected neurons from the MGm mainly project fibers to layers 1, 4, and 5A and rarely to layers 2/3 and 6 of the TeA. A1-D1, Image represents the AAV- hChR2 injection site in the left MGm from Mouse 2 (A1), right MGm from Mouse 3 (B1), right MGm from Mouse 4 (C1), and right MGm from Mouse 5 (D1). A2-D2, Corresponding fluorescence-labeled axons (top) and fluorescence intensity analysis (bottom) reveal uneven fiber projection in different layers of the TeA. Scale bar, 100 μm. MGd, MGv, MGm, Dorsal, ventral, and medial divisions of the medial geniculate nucleus; SG, suprageniculate nucleus.
To answer the questions as to why the terminals from A1 and A2 function differently, we performed whole-cell recordings of TeA neurons in coronal brain slices containing axons from A1 and A2 with AAV-hChR2. The IPSCs and EPSCs in response to blue LED light stimulation of A1 or A2 axons were recorded (Fig. 5E) by clamping the cell's membrane potential at 0 and −70 mV, respectively. For both A1 (Fig. 5D1) and A2 (Fig. 5F1) axons, a 5 ms pulse of blue light elicited IPSCs and EPSCs in the recorded neuron when the slice was bathed in normal external solution. However, the EPSCs of A1 axons were much larger than those of A2 axons. When TTX (1 µm) and 4-AP (1 mm) were perfused, the IPSC disappeared, and the EPSC was weakly reduced in amplitude. The amplitude of IPSCs was similar to those of EPSCs in A1 axons (Control IPSC: 174.33 ± 115.16 pA, TTX and 4-AP perfusion IPSC: 0 pA, Control EPSC: −173.63 ± 134.07 pA, TTX and 4-AP perfusion EPSC: −125.10 ± 91.58 pA; Control EPSC vs TTX and 4-AP perfusion EPSC: p = 0.979, Control IPSC vs TTX and 4-AP perfusion IPSC: p = 0.027, paired t test; Control EPSC vs Control IPSC: p = 0.993, TTX and 4-AP perfusion EPSC vs TTX and 4-AP perfusion IPSC: p = 0.015, t test; 5 cells from 3 animals; Fig. 5D2), whereas the amplitude of IPSCs was obviously larger than those of EPSCs in A2 axons (Control IPSC: 157.34 ± 55.41 pA, TTX and 4-AP perfusion IPSC: 0 pA, Control EPSC: −54.94 ± 20.26 pA, TTX and 4-AP perfusion EPSC: −40.05 ± 23.76 pA; Control EPSC vs TTX and 4-AP perfusion EPSC: p = 0.004, Control IPSC vs TTX and 4-AP perfusion IPSC: p = 0.031, paired t test; Control EPSC vs Control IPSC: p = 0.005, TTX and 4-AP perfusion EPSC vs TTX and 4-AP perfusion IPSC: p = 0.005, t test; 5 cells from 3 animals; Fig. 5F2). TTX plus 4-AP was effective in blocking disynaptic and polysynaptic responses, leaving only monosynaptic responses (Petreanu et al., 2009). Together, the data demonstrated that glutamatergic A1 and A2 projections could evoke monosynaptic EPSCs of TeA neurons and disynaptic IPSCs through TeA inhibitory interneurons.
In summary, glutamatergic projections from the MGm drive TeA cells. Glutamatergic monosynaptic inputs from A1 and A2 could not drive pyramidal neurons, but interneurons contributed to the EPSC. However, A2 glutamatergic projections evoked very small EPSCs, and stronger IPSCs through disynaptic inputs of interneurons, suggesting an inhibitory effect (Fig. 5G).
Inputs from A1, A2, and the MGm to the TeA play roles in inducing the CS according to auditory information, CS lateral inhibition, and non–frequency-specific sensitization
A1 belongs to the lemniscal nuclei, while A2 and the MGm belong to the nonlemniscal nuclei (Hu, 2003; Ohga et al., 2021). Following Suga's working model of tuning shifts (Suga, 2012, 2020), the CS-dependent tuning of TeA neurons might be induced by auditory information from the lemniscal nuclei (e.g., A1 and the MGv) sensitized by the nonlemniscal nuclei (e.g., A2 and the MGm). We thus reasoned that the input from A1 contributes special frequency information that is sensitized by A2 and the MGm.
CS frequency-dependent plasticity has also been evoked in MGm neurons (Weinberger, 2011). MGm neurons had a similar BW20 and lower threshold than TeA neurons (Fig. 4F2,F3) but a shorter latency (Fig. 4F1). Inputs to the TeA from the MGm could drive TeA cells (Fig. 5C3,C4). We believe that CS frequency-dependent plasticity of TeA neurons might be controlled by MGm neurons.
We injected the AAV construct encoding the neural silencer third-generation halorhodopsin (eNpHR3.0) fused with EYFP driven by the CaMKIIa promoter (AAV-CaMKIIα-eNpHR3.0-EYFP) into the MGm (Fig. 7A1). Three weeks later, animals were trained and tested with AFC to a 7.5 kHz tone as the CS. When the spike responses (Fig. 7A2) and the CS frequency-dependent tuning to the training 7.5 kHz tone (Fig. 7A3) of a neuron were recorded in a trained animal, 150 ms yellow LED light (591 nm) pulses were delivered onto the surface of the TeA through an optic fiber to activate the eNpHR3.0-expressing axons (Fig. 7A1). Fifty milliseconds after the beginning of light pulses, 50 ms tone bursts were presented to the animals (Fig. 7A2). Pure tone-evoked responses substantially decreased (Fig. 7A2,A3; F(1,6) = 12.291, p = 0.013; p0.94 kHz = 0.911, p1.33 kHz = 0.298, p1.88 kHz = 0.042, p2.65 kHz = 0.044, p3.75 kHz = 0.965, p5.30 kHz = 0.649, p7.50 kHz < 0.001, p10.61 kHz = 0.431, p15.00 kHz = 0.098, p21.21 kHz = 0.434, p30.00 kHz = 0.582, repeated-measures two-way ANOVA with the LSD multiple comparisons test; n = 7 TeA neurons from 5 animals; Fig. 7A4), especially at the CS frequency, and the tuning also disappeared (Fig. 7A3,A4). Inactivation of the MGm evoked a longer latency (Control: 31.29 ± 14.02 ms, Light: 51.43 ± 29.52 ms, p = 0.046, paired t test; Fig. 7A5), whereas it did not change the threshold (Control: 41.43 ± 3.78 dB, Light: 40.00 ± 0.00 dB, p = 0.317, Wilcoxon rank sum test; Fig. 7A6) or BW20 of TeA neurons (Control: 3.86 ± 0.85 oct, Light: 4.07 ± 1.40 oct, p = 0.686, Wilcoxon rank sum test; Fig. 7A7). This finding indicates that MGm inputs not only facilitate all frequency responses but also relay the CS frequency-dependent tuning to TeA neurons.
Figure 7.

Silencing A1 and MGm projections decreases spike rates in TeA neurons, whereas silencing the A2 projection decreases FR in TeA neurons. A1-C1, Illustration of the recording setup for silencing A1 (A1), A2 (B1), and MGm (C1) projections. L, LED; R, recording pipettes. A2-C2, Example of recorded single TeA unit while separately silencing A1 (A2), A2 (B2), and MGm (C2) projections. Data from the right hemisphere. Top panels, Raster plots of a TeA neuron firing during tone presentation (gray shaded area) and tone + light presentation (yellow shaded area). Tone: 50-100 ms time window; Light: 0-150 ms time window. Bottom panel, PSTH of the FR in response to the tone alone (black) and tone + light (red). A3-C3, FR between the control group and light group responses of the example shown in A1 (A3), A2 (B3), and MGm (C3) projections. A4-C4, Comparison of normalized FR between the control group and light group responses to different tone frequencies in the MGm (A4), A1 (B4), and A2 (C4), respectively. Data from both the right and left hemispheres. *p < 0.05. ***p < 0.001. A5-C5, Response latency in the tone alone (black) and tone + light (red) conditions for MGm (A5), A1 (B5), and A2 (C5) projections, respectively. *p < 0.05. A6-C6, Response threshold in the tone alone (black) and tone + light (red) conditions for MGm (A6), A1 (B6), and A2 (C6) projections, respectively. A7-C7, Response BW20 in the tone alone (black) and tone + light (red) conditions for MGm (A7), A1 (B7), and A2 (C7) projections, respectively. D, Proposed model of the MGm, A1, and A2 contributions to TeA tonal responses after auditory fear conditioning.
Although inputs from A1 could not drive TeA neurons (Fig. 5A3,A4), they contributed to the EPSCs of the TeA (Fig. 5D1,D2). The above experiment did not exclude the role of inputs from A1 to the TeA. If inactivating the inputs from A1 to the TeA results in a disappearance of the CS frequency-dependent tuning of TeA neurons, this indicates that MGm inputs only sensitize TeA neurons' responses, without frequency specificity.
We injected AAV-eNpHR3.0 into A1 (Fig. 7B1) and checked the role of the inputs from A1 to the TeA, as with the procedure for the MGm (Fig. 7B2). Tone-evoked responses did not significantly decrease after inactivating the inputs from A1 to the TeA using yellow light to activate eNpHR3.0-expressing axons (Fig. 7B2,B3; F(1,7) = 0.043, p = 0.841; p0.94 kHz = 0.727, p1.33 kHz = 0.270, p1.88 kHz = 0.173, p2.65 kHz = 0.978, p3.75 kHz = 0.189, p5.30 kHz = 0.464, p7.50 kHz = 0.036, p10.61 kHz = 0.758, p15.00 kHz = 0.775, p21.21 kHz = 0.990, p30.00 kHz = 0.453, repeated-measures two-way ANOVA with the LSD multiple comparisons test; n = 8 TeA neurons from 6 animals; Fig. 7B4), but the tuning disappeared (Fig. 7B4). The inactivation of A1 evoked a longer latency (Control: 62.13 ± 52.77 ms, Light: 87.38 ± 72.46 ms, p = 0.039, paired t test; Fig. 7B5), whereas it did not change the threshold (Control: 43.75 ± 7.44 dB, Light: 43.75 ± 7.44 dB, p = 1.000, Wilcoxon rank sum test; Fig. 7B6) or BW20 of TeA neurons (Control: 4.00 ± 1.16 oct, Light: 3.69 ± 1.03 oct, p = 0.340, Wilcoxon rank sum test; Fig. 7B7). That is, the inputs from A1 to the TeA induced the CS frequency-dependent tuning to the TeA, but not to the MGm.
As shown in Figure 7A3, A4, we not only observed the erasure of CS frequency-dependent tuning of TeA cells in trained mice, but also the suppression of responses to acoustic frequencies beyond the CS frequency. This suppression could result from the inhibition of A2 inputs. We injected AAV-eNpHR3.0 into A2 (Fig. 7C1), and inactivation of the inputs from A2 to the TeA increased the tone-evoked responses to all acoustic frequencies, except for frequencies close to that of the CS (Fig. 7C2,C3; F(1,4) = 28.066, p = 0.006; p0.94 kHz = 0.332, p1.33 kHz = 0.018, p1.88 kHz = 0.047, p2.65 kHz = 0.083, p3.75 kHz = 0.336, p5.30 kHz = 0.082, p7.50 kHz = 0.575, p10.61 kHz = 0.682, p15.00 kHz = 0.054, p21.21 kHz = 0.041, p30.00 kHz = 0.019, repeated-measures two-way ANOVA with the LSD multiple comparisons test; n = 5 TeA neurons from 4 animals; Fig. 7C4). The inactivation of A2 did not change the latency (Control: 46.60 ± 21.34 ms, Light: 36.20 ± 18.55 ms, p = 0.336, paired t test; Fig. 7C5), threshold (Control: 40.00 ± 0.00 dB, Light: 40.00 ± 7.07 dB, p = 1.000, Wilcoxon rank sum test; Fig. 7C6), or BW20 of TeA neurons (Control: 4.50 ± 0.50 oct, Light: 4.60 ± 0.42 oct, p = 0.655, Wilcoxon rank sum test; Fig. 7C7). These results demonstrated that inputs from A2 to the TeA play a role in lateral inhibition of the CS frequency.
In summary, these results suggest that all auditory information to the TeA without frequency specificity are amplified by sensitization of the MGm during AFC learning. The CS frequency information is selected and sent to the TeA from A1, and is reinforced by CS frequency-specific plasticity via non-CS frequency suppression of A2 (Fig. 7D).
Discussion
A CS-US association has been proposed to occur in the association cortex (Suga, 2008, 2020). Therefore, we investigated the mouse TeA to further address the issue by trying to answer the following questions: whether the TeA is special or critical for classical AFC, whether special sound responses are elicited by TeA neurons, what kind of plasticity is evoked in the TeA as a result of AFC training, and how TeA neurons undergo the special plasticity.
First, using chemogenetic manipulations, we found that the TeA is a critical area for classical AFC. This confirms a recent finding from a study using optogenetic manipulations, in which the TeA controls all forms of auditory threat memory (Dalmay et al., 2019). We then found that TeA neurons respond to pure tones without any frequency preference in awake animals only, but CS frequency-dependent plasticity resulted in the formation of an auditory threat memory in the TeA. This is different from nuclei in the lemniscal pathway. Most auditory neurons are characterized by best frequency (BF) or characteristic frequency (Imaizumi and Lee, 2014), and BF or characteristic frequency shifts as a result of plasticity (Weinberger and Bakin, 1998). Considering that TeA neurons mainly receive anatomic projections from A1, A2, and the MGm but not the MGv in the lemniscal pathway and that the projecting fibers are mainly glutamatergic, we used AAV-CaMKIIα-hChR2(H134R) to examine the functions of glutamatergic projections. Interestingly, we found that glutamatergic projections from the MGm could excite TeA cells, but those from A1 could not; A1 provided subthreshold inputs, while A2 disynaptic projections evoked inhibition. This suggests that A1 inputs do not affect spontaneous or sound-evoked firing. We found a similar density of fluorescence-labeled A2 axons and axons adjacent to A1; however, A2 inputs exhibited strong inhibition of the spontaneous discharging of TeA neurons. It has been proposed that the nonlemniscal nuclei (e.g., A2 and the MGm) may play an essential role in the sensitization elicited by pseudo-conditioning (Suga, 2012). If a neuron can be excited by several inputs, it is difficult to verify which inputs function as a signal information producer or sensitizer. In this study, we used AAV-CaMKIIa-eNpHR3.0 to block glutamatergic projections from A1, A2, and the MGm to the TeA and subsequently compared the frequency response of each, especially the CS frequency-dependent responses. We found that inputs from A1 to the TeA play roles in producing CS frequency-dependent auditory information, while A2 evokes CS lateral inhibition and the MGm underlies non–frequency-specific sensitization. Both A2 and the MGm work together in an inhibitory-facilitative role. That is, during AFC learning, all auditory information to the TeA without frequency specificity is amplified by MGm-induced sensitization. Subsequently, CS frequency information is selected (Suga, 2012) and sent to the TeA as a subthreshold signal from A1 glutamatergic inputs. These inputs are reinforced via CS frequency-specific plasticity by non-CS frequency suppression of A2 glutamatergic inputs. Finally, the CS frequency-dependent plasticity created in the TeA as an auditory threat memory is critically linked to behavior.
The long-term plasticity observed is likely specific to AFC. We recorded TeA neurons after 24 h of retrieval testing. Thus, the CS-dependent plasticity in the TeA had a long-lasting response. CS frequency-dependent plasticity is proposed to be produced by corticocortical interactions and corticofugal feedback through the lemniscal nuclei (e.g., A1 and the MGv). This plasticity is then facilitated by the sensitization of nonlemniscal nuclei (e.g., A2 and the MGm) (Suga, 2012, 2020). The present findings reveal that the CS frequency information of CS-dependent plasticity in the TeA is relayed from A1. A1 provides subthreshold inputs to the TeA, which do not affect the responses of TeA neurons in untrained animals (Fig. 5D1). However, after conditioning, the BF of A1 neurons shifts to the frequency of the training tone and apparently influences the responses of TeA neurons (Fig. 7B1). This confirms that corticocortical (A1-TeA) modulations through the lemniscal nuclei play an essential role in evoking CS-dependent plasticity (Suga et al., 2000; Suga, 2012). With the help of cholinergic activation, the induction of plasticity in A1 may contribute to changing the response of TeA neurons (Butt et al., 2009).
The MGm is a typical nonlemniscal nucleus with broad frequency-tuning (Calford and Webster, 1981; Hu, 2003; Ma and Suga, 2009), which is similar to TeA neurons. We expressed ChR2 in the MGm and found that it projects axons mainly in layers 1 and 5A for nonlemniscal thalamic innervation of TeA in addition to layer 4 for lemniscal-thalamic innervation (Fig. 6). These results are consistent with previous studies showing that MGm projects broadly across many lemniscal, nonlemniscal, multimodal, and limbic cortical areas (Lee and Winer, 2008). However, the TeA receives projections mainly from medial and dorsal divisions of the medial geniculate nucleus, suprageniculate nucleus, and the caudal part of the posterior nucleus of the thalamus (Fig. 4A3) (Vaudano et al., 1991; Tasaka et al., 2020). Although we have excluded animals with viral expressing cells in >30% of the MGm area, the viral projection and optogenetic stimulation results may be influenced as it is difficult to cover the entire MGm subregion while leaving adjacent areas uninfected by the viral injection (Figs. 4A3, 6). Our results reveal the sensitization role of the MGm. A2 is also thought to be a nonlemniscal nucleus (Manca et al., 2019) with broad frequency tuning, and is proposed to play a sensitization role, much like the MGm, that is elicited by pseudo-conditioning (Suga, 2020). However, A2 induces CS lateral inhibition to suppress the response of non-CS frequencies in TeA neurons, which strengthens the responses to CS frequency and helps to induce CS frequency-dependent plasticity.
Animals use auditory information to guide their behavior in AFC. Projections from the AC to the TeA carry sensory information that drives decisions in AFC (Cho et al., 2016; Dalmay et al., 2019). Interestingly, the CS frequency-dependent plasticity in TeA neurons is evoked by AFC, which is much like the selective corticostriatal plasticity observed during acquisition in an auditory discrimination task (Q. Xiong et al., 2015). It does not exhibit the BF-shift style but establishes BF relative to the CS through nonfrequency preference tuning. These neurons store auditory threat memories and control behavior after learning.
Together, our data suggest that the neuronal mechanism underlying the CS frequency-dependent plasticity in the TeA is as follows: three parts in the auditory system are obligatory; A1 glutamatergic subthreshold monosynaptic inputs transfer CS frequency information, A2 glutamatergic disynaptic inputs serve as CS lateral inhibition, and MGm glutamatergic monosynaptic inputs work as non–frequency-specific facilitation. Therefore, auditory threat memory acquisition and expression are a result of the combined actions of these three elements.
This mechanism may explain the diverse and mutually contradictory results observed in the AC (A1 and A2) (Campeau and Davis, 1995; Boatman and Kim, 2006; Sacco and Sacchetti, 2010; Yang et al., 2016; Wigestrand et al., 2017; G. W. Zhang et al., 2018; Dalmay et al., 2019). Anatomically, A1 goes to A2 and then to the TeA, and it is difficult to separate A1 from A2, and A2 from the TeA. They can only be distinguished by their different functions as shown in our current study. As an example, Dalmay et al. (2019) used optogenetic inactivation of AC (both A1 and A2) and found that pure-tone (12 kHz) learning and memory are unaffected by AC inhibition. However, AC inhibition selectively impaired memory acquisition and retrieval to FM sweep CSs (between 5 and 20 kHz). FM sweeps activate a mass of auditory neurons tuned to largely different frequencies, with a wider frequency range and a greater number of neurons activated than pure tones. These activated neurons cannot evoke lateral inhibition of TeA neurons through A2. When both A1 and A2 are optogenetically inactivated, the FM sweep signal is not amplified by A2, although it is augmented in the TeA by MGm sensitization. Therefore, AC inactivation is selective for the impairment of FM sweeps. However, the pure tone CS evokes the strongest lateral inhibition by A2. When both A1 and A2 are optogenetically inactivated, the pure-tone signal is augmented in the TeA by MGm sensitization and also amplified by disinhibition of A2. This is why inactivation of both A1 and A2 selectively impaired FM sweep learning and memory but not pure tone. This is also why pure tone memory is independent of A1 but requires the A2-TeA connections. This can also explain the finding that the AC is selectively required for discrimination between FM sweeps and pure tones in an appetitive go/no-go task (Ceballo et al., 2019).
The MGm has been suggested to be the core region underlying AFC (Weinberger, 2011). CS-specific tuning plasticity develops in MGm neurons and is maintained for at least an hour (the longest period tested) (Bakin and Weinberger, 1990; Edeline and Weinberger, 1992). When we recorded TeA neuronal responses after retrieval testing (24 h after training) with inactivation of A1, CS-specific tuning plasticity was no longer observed (Fig. 7B4). That is, transfer to the TeA of CS- specific tuning developed in the MGm was not evident 24 h after training. Lesions of the MGm impair freezing behavior to pure tones (LeDoux et al., 1986; Campeau and Davis, 1995). Therefore, the MGm is considered to be the basic circuit for pure tones (Romanski and LeDoux, 1992; Weinberger, 2011; Dalmay et al., 2019). Our results support this interpretation. Although the CS-dependent plasticity information could not be derived from the MGm but rather from A1, inactivation of the MGm to the TeA inhibits the specific plasticity and reduces the responses to all frequencies. This is possibly because the MGm only plays a role as an amplifier; therefore, its sensitization function has no frequency specificity.
Our results lead to the conclusion that CS frequency-dependent plasticity results in auditory threat memory formation in the TeA. The CS frequency-dependent plasticity in the TeA is formed by CS frequency information from A1 glutamatergic subthreshold monosynaptic inputs, CS lateral inhibition from A2 glutamatergic disynaptic inputs, and non–frequency-specific facilitation from MGm glutamatergic monosynaptic inputs. Together, the A2 and MGm perform an inhibitory-facilitative function (Fig. 7D). Nevertheless, a relatively small sample size was used in some of our experiments because of their level of difficulty (∼3 mice). In addition, despite being useful tools, chemogenetic approaches and viral manipulations are not without “noise,” such as inadequately restrictive viral expression or light leakage in optogenetic manipulations, which may affect the experimental results to a certain extent. Further nuanced studies will be conducted to consolidate this working model.
Footnotes
This work was supported by National Natural Science Foundation of China Grants 32070994 and 31872769 to Z.X.; Key-Area Research and Development Program of Guangdong Province 2018B030340001; and Science and Technology Program of Guangzhou 202007030013. We thank Dr. Ningqian Wang, Dr. Yun Liu, and Jieyi Guan for assistance.
The authors declare no competing financial interests.
References
- The Allen Institute (2011) Allen mouse brain atlas. http://mouse.brain-map.org/.
- Abe R, Sakaguchi T, Matsumoto N, Matsuki N, Ikegaya Y (2014) Sound-induced hyperpolarization of hippocampal neurons. Neuroreport 25:1013–1017. 10.1097/WNR.0000000000000206 [DOI] [PubMed] [Google Scholar]
- Aitkin LM (1973) Medial geniculate body of the cat: responses to tonal stimuli of neurons in medial division. J Neurophysiol 36:275–283. 10.1152/jn.1973.36.2.275 [DOI] [PubMed] [Google Scholar]
- Armbruster BN, Li X, Pausch MH, Herlitze S, Roth BL (2007) Evolving the lock to fit the key to create a family of G protein-coupled receptors potently activated by an inert ligand. Proc Natl Acad Sci USA 104:5163–5168. 10.1073/pnas.0700293104 [DOI] [PMC free article] [PubMed] [Google Scholar]
- Bakin JS, Weinberger NM (1990) Classical conditioning induces CS-specific receptive field plasticity in the auditory cortex of the guinea pig. Brain Res 536:271–286. 10.1016/0006-8993(90)90035-a [DOI] [PubMed] [Google Scholar]
- Boatman JA, Kim JJ (2006) A thalamo-cortico-amygdala pathway mediates auditory fear conditioning in the intact brain. Eur J Neurosci 24:894–900. 10.1111/j.1460-9568.2006.04965.x [DOI] [PubMed] [Google Scholar]
- Bordi F, LeDoux JE (1994) Response properties of single units in areas of rat auditory thalamus that project to the amygdala: I. Acoustic discharge patterns and frequency receptive fields. Exp Brain Res 98:261–274. 10.1007/BF00228414 [DOI] [PubMed] [Google Scholar]
- Butt AE, Chavez CM, Flesher MM, Kinney-Hurd BL, Araujo GC, Miasnikov AA, Weinberger NM (2009) Association learning-dependent increases in acetylcholine release in the rat auditory cortex during auditory classical conditioning. Neurobiol Learn Mem 92:400–409. 10.1016/j.nlm.2009.05.006 [DOI] [PubMed] [Google Scholar]
- Calford MB, Webster WR (1981) Auditory representation within principal division of cat medial geniculate body: an electrophysiology study. J Neurophysiol 45:1013–1028. 10.1152/jn.1981.45.6.1013 [DOI] [PubMed] [Google Scholar]
- Campeau S, Davis M (1995) Involvement of subcortical and cortical afferents to the lateral nucleus of the amygdala in fear conditioning measured with fear-potentiated startle in rats trained concurrently with auditory and visual conditioned stimuli. J Neurosci 15:2312–2327. 10.1523/JNEUROSCI.15-03-02312.1995 [DOI] [PMC free article] [PubMed] [Google Scholar]
- Caviness SV (1975) Architectonic map of neocortex of the normal mouse. J Comp Neurol 164:247–263. 10.1002/cne.901640207 [DOI] [PubMed] [Google Scholar]
- Ceballo S, Piwkowska Z, Bourg J, Daret A, Bathellier B (2019) Targeted cortical manipulation of auditory perception. Neuron 104:1168–1179.e1165. 10.1016/j.neuron.2019.09.043 [DOI] [PMC free article] [PubMed] [Google Scholar]
- Cho JH, Huang BS, Gray JM (2016) RNA sequencing from neural ensembles activated during fear conditioning in the mouse temporal association cortex. Sci Rep 6:31753. 10.1038/srep31753 [DOI] [PMC free article] [PubMed] [Google Scholar]
- Cruikshank SJ, Edeline JM, Weinberger NM (1992) Stimulation at a site of auditory-somatosensory convergence in the medial geniculate nucleus is an effective unconditioned stimulus for fear conditioning. Behav Neurosci 106:471–483. 10.1037/0735-7044.106.3.471 [DOI] [PubMed] [Google Scholar]
- Curzon P, Rustay NR, Browman KE (2009) Cued and contextual fear conditioning for rodents. In: Methods of behavior analysis in neuroscience, Ed. 2 (Buccafusco JJ, ed). Chapter 2. Boca Raton, FL: CRC Press. [PubMed] [Google Scholar]
- Dalmay T, Abs E, Poorthuis RB, Hartung J, Pu DL, Onasch S, Lozano YR, Signoret-Genest J, Tovote P, Gjorgjieva J, Letzkus JJ (2019) A critical role for neocortical processing of threat memory. Neuron 104:1180–1194.e1187. 10.1016/j.neuron.2019.09.025 [DOI] [PubMed] [Google Scholar]
- Diamond DM, Weinberger NM (1986) Classical conditioning rapidly induces specific changes in frequency receptive fields of single neurons in secondary and ventral ectosylvian auditory cortical fields. Brain Res 372:357–360. 10.1016/0006-8993(86)91144-3 [DOI] [PubMed] [Google Scholar]
- Edeline JM, Weinberger NM (1992) Associative retuning in the thalamic source of input to the amygdala and auditory cortex: receptive field plasticity in the medial division of the medial geniculate body. Behav Neurosci 106:81–105. 10.1037/0735-7044.106.1.81 [DOI] [PubMed] [Google Scholar]
- Egashira Y, Mori Y, Yanagawa Y, Takamori S (2018) Development of lentiviral vectors for efficient glutamatergic-selective gene expression in cultured hippocampal neurons. Sci Rep 8:15156. 10.1038/s41598-018-33509-5 [DOI] [PMC free article] [PubMed] [Google Scholar]
- Gilmartin MR, Balderston NL, Helmstetter FJ (2014) Prefrontal cortical regulation of fear learning. Trends Neurosci 37:455–464. 10.1016/j.tins.2014.05.004 [DOI] [PMC free article] [PubMed] [Google Scholar]
- Hackett TA, Barkat TR, O'Brien BM, Hensch TK, Polley DB (2011) Linking topography to tonotopy in the mouse auditory thalamocortical circuit. J Neurosci 31:2983–2995. 10.1523/JNEUROSCI.5333-10.2011 [DOI] [PMC free article] [PubMed] [Google Scholar]
- Hu B (2003) Functional organization of lemniscal and nonlemniscal auditory thalamus. Exp Brain Res 153:543–549. 10.1007/s00221-003-1611-5 [DOI] [PubMed] [Google Scholar]
- Imaizumi K, Lee CC (2014) Frequency transformation in the auditory lemniscal thalamocortical system. Front Neural Circuits 8:75. 10.3389/fncir.2014.00075 [DOI] [PMC free article] [PubMed] [Google Scholar]
- Ji XY, Zingg B, Mesik L, Xiao Z, Zhang LI, Tao HW (2016) Thalamocortical innervation pattern in mouse auditory and visual cortex: laminar and cell-type specificity. Cereb Cortex 26:2612–2625. 10.1093/cercor/bhv099 [DOI] [PMC free article] [PubMed] [Google Scholar]
- LeDoux JE (1992) Brain mechanisms of emotion and emotional learning. Curr Opin Neurobiol 2:191–197. 10.1016/0959-4388(92)90011-9 [DOI] [PubMed] [Google Scholar]
- LeDoux J (2003) The emotional brain, fear, and the amygdala. Cell Mol Neurobiol 23:727–738. 10.1023/a:1025048802629 [DOI] [PMC free article] [PubMed] [Google Scholar]
- LeDoux JE, Sakaguchi A, Iwata J, Reis DJ (1986) Interruption of projections from the medial geniculate body to an archi-neostriatal field disrupts the classical conditioning of emotional responses to acoustic stimuli. Neuroscience 17:615–627. 10.1016/0306-4522(86)90034-5 [DOI] [PubMed] [Google Scholar]
- Lee CC, Winer JA (2008) Connections of cat auditory cortex: I. Thalamocortical system. J Comp Neurol 507:1879–1900. 10.1002/cne.21611 [DOI] [PMC free article] [PubMed] [Google Scholar]
- Ma X, Suga N (2009) Specific and nonspecific plasticity of the primary auditory cortex elicited by thalamic auditory neurons. J Neurosci 29:4888–4896. 10.1523/JNEUROSCI.0167-09.2009 [DOI] [PMC free article] [PubMed] [Google Scholar]
- Manca AD, Di Russo F, Sigona F, Grimaldi M (2019) Electrophysiological evidence of phonemotopic representations of vowels in the primary and secondary auditory cortex. Cortex 121:385–398. 10.1016/j.cortex.2019.09.016 [DOI] [PubMed] [Google Scholar]
- Maren S, Quirk GJ (2004) Neuronal signalling of fear memory. Nat Rev Neurosci 5:844–852. 10.1038/nrn1535 [DOI] [PubMed] [Google Scholar]
- Ohga S, Tsukano H, Horie M, Terashima H, Nishio N, Kubota Y, Takahashi K, Hishida R, Takebayashi H, Shibuki K (2021) Corrigendum: direct relay pathways from lemniscal auditory thalamus to secondary auditory field in mice. Cereb Cortex 31:2305. 10.1093/cercor/bhz097 [DOI] [PMC free article] [PubMed] [Google Scholar]
- Petreanu L, Mao T, Sternson SM, Svoboda K (2009) The subcellular organization of neocortical excitatory connections. Nature 457:1142–1145. 10.1038/nature07709 [DOI] [PMC free article] [PubMed] [Google Scholar]
- Phelps EA, LeDoux JE (2005) Contributions of the amygdala to emotion processing: from animal models to human behavior. Neuron 48:175–187. 10.1016/j.neuron.2005.09.025 [DOI] [PubMed] [Google Scholar]
- Ramírez-Amaya V, Vazdarjanova A, Mikhael D, Rosi S, Worley PF, Barnes CA (2005) Spatial exploration-induced Arc mRNA and protein expression: evidence for selective, network-specific reactivation. J Neurosci 25:1761–1768. 10.1523/JNEUROSCI.4342-04.2005 [DOI] [PMC free article] [PubMed] [Google Scholar]
- Romanski LM, LeDoux JE (1992) Equipotentiality of thalamo-amygdala and thalamo-cortico-amygdala circuits in auditory fear conditioning. J Neurosci 12:4501–4509. [DOI] [PMC free article] [PubMed] [Google Scholar]
- Romanski LM, LeDoux JE (1993) Organization of rodent auditory cortex: anterograde transport of PHA-L from MGv to temporal neocortex. Cereb Cortex 3:499–514. 10.1093/cercor/3.6.499 [DOI] [PubMed] [Google Scholar]
- Roth BL (2016) DREADDs for neuroscientists. Neuron 89:683–694. 10.1016/j.neuron.2016.01.040 [DOI] [PMC free article] [PubMed] [Google Scholar]
- Sacco T, Sacchetti B (2010) Role of secondary sensory cortices in emotional memory storage and retrieval in rats. Science 329:649–656. 10.1126/science.1183165 [DOI] [PubMed] [Google Scholar]
- Shi CJ, Cassell MD (1997) Cortical, thalamic, and amygdaloid projections of rat temporal cortex. J Comp Neurol 382:153–175. [DOI] [PubMed] [Google Scholar]
- Suga N (2008) The neural circuit for tone-specific plasticity in the auditory system elicited by conditioning. Learn Mem 15:198–201; author reply 202. 10.1101/lm.791408 [DOI] [PubMed] [Google Scholar]
- Suga N (2012) Tuning shifts of the auditory system by corticocortical and corticofugal projections and conditioning. Neurosci Biobehav Rev 36:969–988. 10.1016/j.neubiorev.2011.11.006 [DOI] [PMC free article] [PubMed] [Google Scholar]
- Suga N (2020) Plasticity of the adult auditory system based on corticocortical and corticofugal modulations. Neurosci Biobehav Rev 113:461–478. 10.1016/j.neubiorev.2020.03.021 [DOI] [PubMed] [Google Scholar]
- Suga N, Gao E, Zhang Y, Ma X, Olsen JF (2000) The corticofugal system for hearing: recent progress. Proc Natl Acad Sci USA 97:11807–11814. 10.1073/pnas.97.22.11807 [DOI] [PMC free article] [PubMed] [Google Scholar]
- Tasaka GI, Feigin L, Maor I, Groysman M, DeNardo LA, Schiavo JK, Froemke RC, Luo L, Mizrahi A (2020) The temporal association cortex plays a key role in auditory-driven maternal plasticity. Neuron 107:566–579.e567. 10.1016/j.neuron.2020.05.004 [DOI] [PMC free article] [PubMed] [Google Scholar]
- Trumpp NM, Kliese D, Hoenig K, Haarmeier T, Kiefer M (2013) Losing the sound of concepts: damage to auditory association cortex impairs the processing of sound-related concepts. Cortex 49:474–486. 10.1016/j.cortex.2012.02.002 [DOI] [PubMed] [Google Scholar]
- Turner JG, Hughes LF, Caspary DM (2005) Divergent response properties of layer-V neurons in rat primary auditory cortex. Hear Res 202:129–140. 10.1016/j.heares.2004.09.011 [DOI] [PubMed] [Google Scholar]
- Urban DJ, Roth BL (2015) DREADDs (designer receptors exclusively activated by designer drugs): chemogenetic tools with therapeutic utility. Annu Rev Pharmacol Toxicol 55:399–417. 10.1146/annurev-pharmtox-010814-124803 [DOI] [PubMed] [Google Scholar]
- Vaudano E, Legg CR, Glickstein M (1991) Afferent and efferent connections of temporal association cortex in the rat: a horseradish peroxidase study. Eur J Neurosci 3:317–330. 10.1111/j.1460-9568.1991.tb00818.x [DOI] [PubMed] [Google Scholar]
- Weinberger NM (2011) The medial geniculate, not the amygdala, as the root of auditory fear conditioning. Hear Res 274:61–74. 10.1016/j.heares.2010.03.093 [DOI] [PMC free article] [PubMed] [Google Scholar]
- Weinberger NM, Bakin JS (1998) Learning-induced physiological memory in adult primary auditory cortex: receptive fields plasticity, model, and mechanisms. Audiol Neurootol 3:145–167. 10.1159/000013787 [DOI] [PubMed] [Google Scholar]
- Wigestrand MB, Schiff HC, Fyhn M, LeDoux JE, Sears RM (2017) Primary auditory cortex regulates threat memory specificity. Learn Mem 24:55–58. 10.1101/lm.044362.116 [DOI] [PMC free article] [PubMed] [Google Scholar]
- Williamson RS, Polley DB (2019) Parallel pathways for sound processing and functional connectivity among layer 5 and 6 auditory corticofugal neurons. Elife 8:e42974. 10.7554/eLife.42974 [DOI] [PMC free article] [PubMed] [Google Scholar]
- Xiao C, Liu Y, Xu J, Gan X, Xiao Z (2018) Septal and hippocampal neurons contribute to auditory relay and fear conditioning. Front Cell Neurosci 12:102. 10.3389/fncel.2018.00102 [DOI] [PMC free article] [PubMed] [Google Scholar]
- Xie H, Wu D, Gao X, Wang N, Xiao Z (2020) Auditory fear conditioning alters sensitivity of the medial prefrontal cortex but this is not based on frequency-dependent integration. Neuroscience 442:237–252. 10.1016/j.neuroscience.2020.05.038 [DOI] [PubMed] [Google Scholar]
- Xiong Q, Znamenskiy P, Zador AM (2015) Selective corticostriatal plasticity during acquisition of an auditory discrimination task. Nature 521:348–351. 10.1038/nature14225 [DOI] [PMC free article] [PubMed] [Google Scholar]
- Xiong XR, Liang F, Li H, Mesik L, Zhang KK, Polley DB, Tao HW, Xiao Z, Zhang LI (2013) Interaural level difference-dependent gain control and synaptic scaling underlying binaural computation. Neuron 79:738–753. 10.1016/j.neuron.2013.06.012 [DOI] [PMC free article] [PubMed] [Google Scholar]
- Yan J, Ehret G (2002) Corticofugal modulation of midbrain sound processing in the house mouse. Eur J Neurosci 16:119–128. 10.1046/j.1460-9568.2002.02046.x [DOI] [PubMed] [Google Scholar]
- Yang Y, Liu DQ, Huang W, Deng J, Sun Y, Zuo Y, Poo MM (2016) Selective synaptic remodeling of amygdalocortical connections associated with fear memory. Nat Neurosci 19:1348–1355. 10.1038/nn.4370 [DOI] [PubMed] [Google Scholar]
- Zhang GW, Sun WJ, Zingg B, Shen L, He J, Xiong Y, Tao HW, Zhang LI (2018) A non-canonical reticular-limbic central auditory pathway via medial septum contributes to fear conditioning. Neuron 97:406–417.e404. 10.1016/j.neuron.2017.12.010 [DOI] [PMC free article] [PubMed] [Google Scholar]
- Zhang X, Ye X, Cheng R, Li Q, Xiao Z (2019) An emergent discriminative learning is elicited during multifrequency testing. Front Neurosci 13:1244. 10.3389/fnins.2019.01244 [DOI] [PMC free article] [PubMed] [Google Scholar]
- Zhang Y, Suga N (2005) Corticofugal feedback for collicular plasticity evoked by electric stimulation of the inferior colliculus. J Neurophysiol 94:2676–2682. 10.1152/jn.00549.2005 [DOI] [PubMed] [Google Scholar]
- Zingg B, Hintiryan H, Gou L, Song MY, Bay M, Bienkowski MS, Foster NN, Yamashita S, Bowman I, Toga AW, Dong HW (2014) Neural networks of the mouse neocortex. Cell 156:1096–1111. 10.1016/j.cell.2014.02.023 [DOI] [PMC free article] [PubMed] [Google Scholar]