

Abstract
This study examined autonomic profiles in preschoolers (N = 278, age = 4.7 years) and their relations to self-regulation outcomes concurrently and one year later, in kindergarten. Children’s sympathetic (preejection period [PEP]) and parasympathetic activity (respiratory sinus arrythmia [RSA]) were measured at rest and during cognitive and emotional tasks. Three self-regulatory competencies were assessed: executive functions, emotion regulation and behavioral regulation. Executive functioning was measured at ages 4 and 5 using laboratory tasks designed to assess updating/working memory, inhibitory control, and cognitive flexibility. Emotion regulation was observed during emotionally distressing tasks in the laboratory, both at ages 4 and 5. Behavioral regulation and emotional reactivity were assessed via teacher ratings in kindergarten, at age 5. Latent profile analysis yielded four autonomic profiles: moderate parasympathetic inhibition (45%), reciprocal sympathetic activation (26%), coinhibition (25%), and high sympathetic activation (7%). The reciprocal sympathetic activation group showed better executive functioning in preschool and kindergarten, particularly compared to the high sympathetic activation group. The moderate parasympathetic inhibition group showed lower emotional reactivity and better behavioral regulation in kindergarten, compared to the other three groups. Findings suggest that autonomic profiles meaningfully associate with self-regulation outcomes in early childhood, such that certain profiles relate to better self-regulation than others.
Keywords: autonomic nervous system, self-regulation, executive functions, emotion regulation, early childhood
Self-regulation is a multifaceted construct that includes a range of processes that allow individuals to regulate their emotion, cognition and behaviors (Nigg, 2017). An overwhelming body of evidence has linked individual differences in children’s self-regulation with a range of positive outcomes including academic achievement (Graziano et al., 2007; Monette et al., 2011), social-emotional competence (Masten et al., 2012; Portilla et al., 2014) and behavioral adjustment (Perry et al., 2018; Sulik et al., 2015). These findings underscore the importance of understanding the biological processes that are associated with children’s ability to regulate themselves.
One biological system that has been the focus of considerable work on self-regulation is the autonomic nervous system (Beauchiane, 2015; Porges, 2011; Thayer et al., 2009). As one of the fastest responding biological systems, the autonomic nervous system coordinates the rapid communication between the central nervous system, most notably the brain, and the internal organs and muscle tissues, to serve the needs of the internal organs as well as to effectively produce self-regulatory responses (Berntson et al., 2007; Porges, 2011). The autonomic nervous system oversees these functions via its two branches, the sympathetic and parasympathetic systems. The sympathetic nervous system mobilizes the individual to produce defense responses (“fight-or-flight”), whereas the parasympathetic nervous system down-regulates the body’s energy resources to restore homeostasis and promote the body’s growth and restoration (“rest and digest”). Given that the two autonomic branches work together in preparing and mobilizing individuals to regulate their behavioral responses (Berntson et al., 1991), it is critical to understand how the functioning of the two systems together promotes or hinders self-regulation.
Early development is considered a critical time for the development of children’s physiological response patterns likely due to both genetic and environmental influences (Boyce & Ellis, 2005). Although there is plasticity in autonomic functioning during early childhood, there is also developmental continuity and stability of individual differences in autonomic responses over time (Alkon et al., 2011; Gatzke-Kopp & Ram, 2018; 2020; Zeytinoglu et al., 2020), suggesting that children’s autonomic functioning can be considered a trait-like characteristic that may be related to both concurrent and subsequent developmental outcomes such as self-regulation.
The role of autonomic functioning in children’s self-regulation has been investigated extensively (Holzman & Bridgett, 2017); however, the majority of this work has focused on children’s parasympathetic functioning only, with less emphasis on how the sympathetic and parasympathetic branches may together support or undermine self-regulation. Most of these studies have examined linear relations between specific indices of autonomic functioning and self-regulation, yielding very small effect sizes that disappear after adjusting for publication bias (Zahn et al., 2016), and fewer studies utilized designs that allow for examining the relations between moderate levels of autonomic activity and self-regulation (e.g., Marcovitch et al., 2010). Only a handful of studies examined the relations between children’s autonomic functioning and multiple self-regulation outcomes within the same sample (see Holzman & Bridgett, 2017). Yet, the limited work that examined physiological profiles either did not examine their relations to self-regulation outcomes (e.g., Quas et al., 2014; Roubinov et al., 2021) and/or utilized statistical interaction models that rely on assumptions of linear relations which are not equipped for identifying certain multi-system profiles (e.g., El-Sheikh et al., 2009; Philbrook et al., 2018). To address these gaps, we adopted a person-centered approach to examine whether there are profiles of children with distinct patterns of sympathetic and parasympathetic functioning in preschool and whether these profiles differ with respect to self-regulation outcomes, concurrently and one year later.
We focused on three broad self-regulation outcomes: executive functioning, emotion regulation, and behavioral regulation. Executive functions are volitional cognitive processes that support the regulation of thoughts, emotions, and behaviors (Best & Miller, 2010; Diamond, 2013; Zelazo & Cunningham, 2007). We operationalized executive functioning as children’s overall ability to succeed in challenges that require them to remember and update information in working memory; inhibit dominant and automatic responses in favor of subdominant responses; and shift flexibly across different rules or operations (Diamond, 2013). Emotion regulation involves both a reactivity and a regulatory component (Carthy et al., 2010). Emotional reactivity includes the threshold of stimuli needed for the generation of emotion as well as the intensity and duration of affective responding, whereas emotion regulation involves the inhibition, modulation, or enhancement emotional experiences (Calkins & Hill, 2007). Finally, behavioral regulation refers to the ability to direct, coordinate, and plan one’s own behaviors. Its indicators in a classroom context include the ability to follow instructions, maintain attentional focus, show good work habits and discipline/persistence (Morrison et al., 2010; Zeytinoglu et al., 2017).
Sympathetic and Parasympathetic Autonomic Functioning
Because the sympathetic and parasympathetic systems are supported largely by distinct neural processes and have distinct response rates to stressors one cannot infer about the functioning of one system based on the functioning of the other system (Berntson et al., 1991; Gatzke-Kopp & Ram, 2018). Thus, examining how these two systems may together support or undermine self-regulation requires measuring the functioning of both.
Sympathetic functioning can be estimated by pre-ejection period (PEP), which indexes the overall sympathetic influence on the heart. PEP shortening (i.e., decreases in PEP from baseline to task) reflects sympathetic activation which leads to increases in heart rate and supports mobilization responses, whereas PEP lengthening (i.e., increases in PEP from baseline to task) reflects sympathetic inhibition which slows the heart rate. Parasympathetic functioning can be estimated via respiratory sinus arrhythmia (RSA), which is thought to reflect the influences of the vagus nerve on the heart (Porges 2011). The withdrawal of the tonic vagal influence on the heart leads to increases in heart rate and supports regulatory responses. RSA withdrawal (i.e., decreases in RSA from baseline to task) reflects parasympathetic inhibition or the withdrawal of vagal influence; whereas RSA augmentation (i.e., increases in RSA from baseline to task) reflects parasympathetic augmentation, which slows the heart rate.
Multi-system Autonomic Functioning: Theoretical Perspectives
Guiding much empirical work on the concurrent functioning of the autonomic branches is the Autonomic Space Model, which is a quantitative, theoretical model that suggests that autonomic functions should be represented via at least a two-dimensional autonomic space to reflect the sympathetic and parasympathetic influence on the dually innervated organs (Berntson et al., 1991). This model suggests that the two autonomic branches can together function along dimensions of reciprocity (reciprocal to non-reciprocal) and coactivity (coupled to non-coupled), yielding distinct autonomic profiles including coupled reciprocal modes (i.e., reciprocal sympathetic activation, reciprocal parasympathetic activation), coupled nonreciprocal models (i.e., coinhibition and coactivation), and uncoupled, non-reciprocal profiles (i.e., increase or decrease in one system without a change in the other system). Reciprocal sympathetic activation, characterized by sympathetic activation and parasympathetic inhibition, is considered a common autonomic response pattern supporting active coping behaviors accompanied with increases in heart rate and mobilization (Berntson et al., 1991; Alkon et al., 2011). In terms of the coupled, non-reciprocal profiles, El-Sheikh and Erath (2011) proposed that coactivation may reflect an insufficient coping response given that the absence of vagal withdrawal may hinder effective coping, whereas the coinhibition pattern reflects an ambivalent coping response given that sympathetic withdrawal may reflect failure to mobilize sufficient energy to deal with challenges. In terms of the uncoupled, non-reciprocal profiles, Polyvagal Theory asserts that a normative response pattern to everyday challenges is to experience parasympathetic inhibition without recruiting the sympathetic system, while recruiting the sympathetic system if the parasympathetic response has not been sufficient to respond effectively (Porges, 2011).
Another important theoretical perspective for understanding the simultaneous functioning of the autonomic branches is The Adaptive Calibration Model (ACM), which offers testable propositions regarding how distinct patterns of autonomic and hypothalamic-pituitary-adrenal axis (HPAA) functioning may be related to behavioral outcomes (Del Giudice et al., 2011). This model proposes that there is not one “best” stress response pattern, but rather distinct stress response configurations better equip the person to deal effectively with certain types of environmental conditions (Del Giudice et al., 2011). This model proposes 4 common physiological patterns: sensitive (i.e., sympathetic: moderate baseline and responsivity; parasympathetic: high baseline and responsivity), buffered (i.e., sympathetic: low-to-moderate baseline and responsivity; parasympathetic: moderate baseline and responsivity), vigilant (i.e., sympathetic: high baseline and responsivity; parasympathetic: low-to-moderate baseline and responsivity), and unemotional (i.e., low baseline and responsivity in both autonomic systems). Based on this model, the sensitive pattern supports cognitive competencies such as executive functioning. The buffered pattern allows individuals to be less prone to aggression, anxiety, and risk-taking behaviors. The vigilant pattern supports heightened attentional responses to threat and emotional reactivity. Finally, the unemotional profile is likely associated with callous-unemotional traits and antisocial behaviors (Del Giudice et al., 2011).
Multi-system Autonomic Functioning: Empirical Findings
The empirical work examining the simultaneous effects of sympathetic and parasympathetic functioning relied on both variable-centered and person-centered approaches. The strengths and limitations of these different approaches have been reviewed in Rash et al. (2016) and Roubinov et al. (2020). Among the variable-centered approaches, one approach has been using ratio scores of sympathetic and parasympathetic measures (low frequency/high frequency ratio) to determine the extent to which one branch dominates cardiac function over the other branch based on the assumption that the sympathetic and parasympathetic systems function mainly reciprocally (Billman, 2013). Because these systems can function non-reciprocally, this approach has been largely criticized (see Billman, 2013).
A second commonly used variable-based approach has been examining the influence of sympathetic and parasympathetic functioning on developmental outcomes using the interaction terms of sympathetic and parasympathetic activity in linear regression analysis (e.g., El-Sheikh et al., 2009; Philbrook et al., 2018). However, autonomic indices may have non-linear relations with behavioral outcomes (e.g., Kogan et al., 2013, 2014; Marcovitch et al., 2010; Miller et al., 2017).
Finally, a third approach is categorizing individuals into autonomic profiles by dichotomizing RSA and PEP scores based on cut-off scores. Using this approach, Alkon and her colleagues (2011) classified children into distinct profiles based on their PEP and RSA responsivity scores and found that sympathetic activation profile was the most common profile (37–40%), followed by the coinhibition (29–30%), coactivation (13–19%) and reciprocal parasympathetic activation profiles (16–17%) at the 42- and 60-month assessments. The limitation of this approach is that the cut-off points are artificially selected and children may be misclassified in certain profiles.
Person-centered approaches such as LPA address many of the statistical limitations of these previous approaches. LPA is a type of finite mixture modeling that is used to test whether there are hidden subgroups (“profiles”) of individuals based on a set of continuous indicators. It determines whether there are profiles of children based on the functioning of different systems (i.e., sympathetic, parasympathetic), and different indices (i.e., baseline, responsivity). Few studies examined multi-system profiles using this approach. Across four samples of children ranging from 4- to 14-years of age, Quas et al., (2014) used sympathetic (PEP), parasympathetic (RSA), cardiac activity (heart rate), and HPAA activity (cortisol) during baseline and task assessments, and found a moderate reactivity group (52–80%) characterized by low to moderate responsivity across all systems and a parasympathetic specific reactivity profile (2–36%), characterized by parasympathetic responsivity but no change in sympathetic and cortisol responses as the largest profiles. Roubinov et al. (2021) examined profiles using the same indices in the Fall and Spring of the kindergarten assessments and found three profiles that remained largely stable from Fall to Spring semesters. One group showed heightened HPAA functioning (“HPA axis responders”), the second group showed high resting RSA and moderate PEP responsivity to stress (“active mobilizers”); and the third group showed low baseline PEP and high parasympathetic inhibition (“anticipatory arousal”). The HPA axis responders had higher levels of externalizing symptoms and lower school engagement than the other two groups.
Del Giudice and his colleagues (2012) examined autonomic profiles using measures of RSA and skin conductance during baseline and a star-tracing challenge in 8- to 10-year-olds and found four profiles consistent with ACM. These profiles were: buffered (45%), sensitive (27%), unemotional (18%), and vigilant (10%). In 351 male adolescents, Ellis et al. (2017) conducted LPA using measures of PEP, RSA, and cortisol during reactivity to and recovery from social evaluative stress, and found four profiles: sensitive (10%), buffered (74%), vigilant (6%) and unemotional (10%). Although these studies are among the first to examine individual differences in the functioning of multiple biological systems; to our knowledge, multi-system biological profiles have not been systematically examined in relation to multiple self-regulation outcomes in early childhood.
The Current Study
This study examined preschoolers’ autonomic profiles and their relations to self-regulation outcomes concurrently and one year later. As reported in Zeytinoglu et al. (2020), we measured children’s sympathetic and parasympathetic autonomic functioning at baseline and during four challenges (i.e., two cognitive & two negatively-valenced emotional challenges). Next, we used LPA to test whether there are distinct autonomic profiles and compared these profiles in relation to executive functions in preschool and in kindergarten, observed emotion regulation in preschool and kindergarten, and teacher-report of emotional reactivity and behavioral regulation in kindergarten.
Based on theoretical and previous empirical work (Del Giudice et al. 2011; Alkon et al., 2011), we expected to find distinct autonomic profiles in preschoolers. We expected to find a reciprocal sympathetic activation profile, characterized by moderate-to-high sympathetic activation and high parasympathetic inhibition (Alkon et al., 2011; Del Giudice et al. 2011; Quas et al., 2014). We also expected a moderate parasympathetic inhibition profile marked by low sympathetic activation and moderate parasympathetic inhibition, with moderate baseline activity in both systems (Del Giudice et al. 2011; Quas et al., 2014). We also expected a coinhibition profile characterized by sympathetic and parasympathetic inhibition, based on previous evidence (Alkon et al., 2011). Given that ACM’s vigilant and unemotional profiles have been proposed to emerge in populations exposed to high levels of stress, we explored the existence of a high sympathetic activation profile (“vigilant”) marked by high sympathetic activation and low parasympathetic withdrawal and a low autonomic responsivity profile (“unemotional”) marked by low activity in both systems. Given that our focus was on autonomic profiles and that we did not measure HPAA functioning, we did not examine multi-system profiles including HPAA responses.
Based on the proposition that reciprocal sympathetic activation would facilitate better executive functioning (Del Giudice et al. 2011), we expected the reciprocal sympathetic activation profile to demonstrate better executive functioning than the other profiles. Given that moderate parasympathetic inhibition without the activation of the sympathetic system may be a sufficient response to deal with everyday challenges (Porges, 2011), we expected the moderate parasympathetic inhibition profile to display better emotion regulation and behavioral regulation than the other profiles. Finally, heightened sympathetic activation without parasympathetic withdrawal may reflect proneness to engage in non-volitional defense responses and absence of more effortful forms of regulation. Thus, we expected a high sympathetic activation profile to demonstrate lower self-regulation outcomes.
Method
Participants
Participants were 278 children (55% girls) from a longitudinal study examining predictors of early academic readiness. Children’s mean age at the preschool and kindergarten assessments was 56.37 (SD = 4.68) and 70.80 (SD = 3.86) months, respectively. At the preschool assessment, approximately 61% of mothers had a 4-year college degree or higher, and the average income-to-needs ratio (i.e., total family income divided by the poverty threshold for that family size) was 2.11 (SD=1.41), with lower scores indicating greater economic hardship. Children were 59% European American, 30% African American, and 11% other races; and 6.5% of the sample was Hispanic. Of the original 278 participants, 249 returned for the kindergarten laboratory assessment. Chi-square tests indicated that participants who did not return for the kindergarten assessment did not differ from the remaining participants with respect to gender, minority status, and maternal education (p > .05). In kindergarten, 220 participants’ teachers completed questionnaires regarding their behaviors in the classroom setting. In the preschool assessment, 260 participants had physiological data and therefore the final analyses were conducted with these participants. The participants who had physiological data did not differ from those who did not in relation to gender, minority status, or maternal education (p >.05).
Procedure
Participants were recruited from child care centers, local establishments (e.g., museums) or via participant referral in a midsized Southeastern city in the United States. Children participated in 2-hour-long laboratory assessments when they were in preschool and kindergarten. Before each visit, mothers provided written consent and then left the room to complete questionnaires while children participated in emotional and cognitive tasks. Children selected a small toy and mothers received monetary compensation for participation. Teachers completed questionnaires when children were in kindergarten. All procedures were approved by the university institutional review board.
Procedure for physiological assessment.
In the preschool assessment, physiological equipment was placed on children approximately 20–25 minutes into the session. Cardiac data were collected during two baseline tasks and four stress responsivity challenges (i.e., two cognitive and two negatively-valenced emotional challenges). The two cognitively challenging tasks were a problem-solving task (Tangrams; 10 minutes) and a Go/No-Go task (8 minutes). The emotional tasks were an emotionally frustrating blocked goal challenge (Transparent Locked Box, 4 minutes; Gagne et al., 2011) and emotionally upsetting challenge (Toy Removal, 2 minutes). Between each task, children were given a break lasting about 30-seconds while they picked stickers to put on their chart. For a thorough description of our physiological protocol in preschool, we refer the reader to Zeytinoglu et al., (2020).
Measures
Cardiac Measures
The cardiovascular data was collected using Mindware BioNex 8SLT Chassis (Gahanna, OH) and seven spot electrodes, which recorded electrocardiogram (ECG) and impedance cardiogram (ICG) signals simultaneously. ECG signals were obtained using the modified Lead II configuration with two ECG electrodes placed on the distal end of the right clavicle and lower left rib, with a ground electrode placed on the lower right rib. To quantify the HR data, the ECG signal was passed through an A/D converter with ECG sampled at 1,000 Hz. ICG signals were recorded using four electrodes. Two impedance electrodes were placed on the front and two current electrodes were placed on the back (for details see Zeytinoglu et al., 2020)
Respiratory sinus arrhythmia (RSA).
RSA is heart rate variability measured in the interbeat interval (IBI) series associated with the phases of breathing. RSA was derived using Mindware Technologies HRV 3.0 analysis software. This program calculates RSA by subjecting the IBI series for each epoch to Fast Fourier Transform (FFT) and applying a Hamming window for the .24–1.04 Hz frequency range used in children this age (e.g., Miller et al., 2017). Impedance waveform (Z0) was used as the respiration signal to validate the RSA frequency band. Epoch durations were 30 seconds. Trained researchers visually inspected each epoch to correct misidentified beats and check for data quality. Epoch scores were averaged to create mean task RSA scores. RSA scores from the baseline tasks were strongly correlated (r = .87, p < .001) and were averaged to create an overall baseline RSA score. Task specific RSA responsivity was calculated by subtracting baseline RSA from task RSA. Positive scores indicated RSA augmentation (parasympathetic activation) and negative scores indicated RSA withdrawal (parasympathetic inhibition; see Zeytinoglu et al., 2020, for further details).
Preejection period (PEP).
PEP, derived from the ICG signals, refers to the time interval in milliseconds between the onset of ventricular depolarization (Q wave of the ECG) and onset of left ventricular ejection (B point of the dz/dt wave). The Q and B points were identified automatically using algorithms provided by the MindWare IMP 3.1 analysis software. The Q point was identified at the lowest point of the signal appearing within 25 milliseconds prior to the R-point (Bush et al., 2016). The B point was estimated using Lozano’s method, which approximates the B-point based on the dz/dt peak (percent dz/dt was identified as 55%, plus 4; Lozano et al., 2007). The PEP data files were cleaned and edited using the IMP 3.1 to derive mean PEP for each epoch. Trained researchers visually inspected each epoch to identify and exclude spurious data. Epoch scores were averaged to create task PEP scores. PEP scores from the baseline tasks were strongly correlated (r = .92, p < .001) and were averaged to create an overall baseline PEP score. Task specific PEP responsivity was calculated by subtracting baseline PEP from task PEP. Positive scores indicated PEP lengthening (sympathetic inhibition) and negative scores indicated PEP shortening (sympathetic activation; see Zeytinoglu et al., 2020, for further details).
Demographics
Parents completed a demographic questionnaire and reported on their child’s sex, race and ethnicity, and their own education, and household income and composition.
Self-Regulation Measures
Executive functioning in preschool and kindergarten.
Executive functioning was assessed via tasks designed to capture updating/working memory, inhibitory control, and cognitive flexibility. Scores from the three tasks correlated positively at the preschool (r = .25–.33, p < .001) and kindergarten assessments (r = .18–.42, p < .005). Scores from these three tasks were standardized and then averaged to create an overall executive functions score. Additional details are reported in our previous papers (Ellis et al., in press; Zeytinoglu et al. 2017, 2019).
Working memory.
Working memory was assessed via a backward digit span task, Numbers Reversed of The Woodcock Johnson III (Woodcock, McGrew, & Mather, 2001). Participants were asked to listen to the experimenter recite a string of numbers (beginning with two numbers and progressively increasing) and repeat the numbers backward. The task was terminated if participants missed all five trials in a block. Correct responses were summed. Higher scores reflected better updating/working memory.
Inhibitory control.
Inhibitory control was assessed via a computerized animal go/no-go task (Lahat et al., 2009). Children were instructed to press the button as soon as they saw an animal (go stimulus) except for the dog (no-go stimulus). Following a brief demonstration and 10 practice trials, children completed 144 trials (75% Go, 25% No-Go). A discriminability index (d′) was calculated as a measure of task performance such that d′ = Z(Correct/Hit) – Z (Incorrect/False Alarm; see Swingler et al., 2018). Higher scores indicated better performance.
Cognitive flexibility.
Cognitive flexibility was assessed via a computerized version of The Dimensional Change Card Sort task (Espinet et al., 2012). During the preswitch block (15 trials), children were asked to sort stimuli according to their shape (boat vs. rabbit) by pressing the corresponding button. During the post-switch block (30 trials), children were asked to respond to stimuli according to their color (red vs. blue). In kindergarten, the post-switch was followed by a “borders” block (12 trials) in which children were instructed to sort stimuli based on one dimension (color) if the picture had a border around it but the other dimension (shape) if the picture did not have a border. At the preschool visit, the post-switch block was used, and at the kindergarten assessment, both post-switch and borders blocks were used to calculate cognitive flexibility scores (for more details see Zeytinoglu et al., 2019). Higher scores indicated greater cognitive flexibility. This task has demonstrated good concurrent (Caughy et al., 2013) and predictive validity across different racial and socioeconomic groups (Obradović, 2010).
Emotion regulation in preschool and kindergarten.
Emotion regulation was observed during negatively-valenced emotional challenges in preschool and kindergarten, and teachers reported on children’s emotional reactivity in kindergarten.
Observed emotion regulation in preschool and kindergarten.
Children’s emotion regulation was assessed based on three indicators: global regulation, latency to distress, and verbal negativity; adapted from the work of Calkins, Leerkes and their colleagues (Blankson et al., 2013; Perry et al., 2020). Global regulation reflects the ability to maintain or regain neutral or positive affect and was rated on a scale from 1 (unregulated) to 5 (well-regulated; Blankson et al., 2013). Latency to distress refers to the number of elapsed seconds between the start of the task and children’s first sign of distress (Gagne et al., 2011; Qu et al., 2021). Verbal negativity refers to the frequency of children’s negative verbal expressions of frustration and was rated on a scale from 0 (no negative vocalizations) to 3 (6 or more instances of negative vocalizations; Blankson et al., 2013; Perry et al., 2020). Two trained coders rated children’s emotion regulation behaviors from prerecorded videos based on a coding manual created by the third author (EL). The manual included the definition of each behavior with multiple examples of these behaviors. Training involved watching training videos that had brief examples of each type of behavior and exemplars of children who warranted specific ratings based on their behaviors across the task. Coders received the manual in advance, met with EL in person and watched training videos, as EL answered any clarifying questions. The initial reliability of the coders was established on 10 cases, after which they were allowed to proceed coding independently. Random reliability cases were drawn throughout the coding period. Disagreements were resolved via consensus and the coders consulted with EL if they had difficulty coming to consensus. Final reliability was calculated from 53 double-rated cases in preschool and 40 double-rated cases in kindergarten (~20% of the total number of videos). These ratings showed good reliability in preschool (ICC = 70–.91) and kindergarten (ICC = 80–.95). Given the moderate within-indicator correlations across two tasks (r = .39–.60), composite scores were created for each indicator. The indicators were strongly correlated both in preschool (r = .71–.81) and in kindergarten (r = .61–.73). A global emotion regulation composite was created by averaging the standardized scores of these indicators at each assessment.
Emotional reactivity in kindergarten.
Emotional reactivity in kindergarten was assessed via teachers’ report on the emotional reactivity scale (15 items) of The Emotion Regulation Checklist (Shields & Cicchetti, 1997). Items ranging from 1 (Never) to 4 (Always) were averaged. Higher scores indicated greater reactivity. Internal consistency was high (α = .91).
Behavioral Regulation in Kindergarten.
Behavioral regulation was assessed via teachers’ report on children’s attention control, work habits, and discipline/persistence. As these three indicators were highly correlated (r = .74–.76), ratings on these scales were standardized and averaged to create an overall behavioral regulation score (also see Zeytinoglu et al., 2017).
Attention control.
Attention control was assessed via the attention problems subscale (10 items) of The Child Behavior Checklist Teacher Report Form (Achenbach & Rescorla, 2001). Example items included “inattentive or easily distracted” and “can’t concentrate, can’t pay attention for long.” Ratings were summed and reverse-scored such that higher scores indicated better attention control. This scale showed good internal reliability (α = .95).
Work habits.
Work habits was assessed via the work habits scale (6 items) of The Mock Report Card. Example items included “works well independently” and “uses time wisely.” Ratings were averaged. Higher scores indicated better work habits. The work habits scale demonstrated good internal reliability (α = .95).
Discipline/persistence.
Discipline and persistence was assessed using the Discipline/Persistence subscale (8 items) of the Learning Behaviors Scale ranging from 0 (does not apply) to 2 (most often applies; Rikoon et al., 2012). An example item was “sticks to a task with no more than minor distractions.” Ratings were summed and reverse scored. Higher scores indicated greater discipline/persistence. This scale had good internal reliability (α = .82), and demonstrated good convergent, divergent and predictive validity (McDermott et al., 2016).
Analytic Strategy
Descriptive statistics for study variables are presented in Table S1. In order to determine whether there are distinct autonomic profiles in preschool, LPA was conducted in Mplus Version 8 (Muthén & Muthén, 2012). Model fit was evaluated using Akaike Information Criterion (AIC), Bayesian Information Criterion (BIC), Adjusted Bayesian Information Criterion (ABIC) and the adjusted Lo-Mendell-Rubin likelihood ratio test (LMR-LRT; Lo et al., 2001). Smaller AIC, BIC, and ABIC values indicate better model fit, whereas a significant LMR test indicates that adding one more profile improves model fit (Kline, 2005). As these fit indices may not converge on a best fitting model, decisions regarding the best fit should also be guided by the interpretability of the results (Collins & Lanza, 2010). Missing data were estimated using full information maximum likelihood to reduce potential bias in the parameter estimates.
Ten variables from the preschool assessment were submitted to LPA: baseline PEP and PEP responsivity scores to 4 challenges, and baseline RSA and RSA responsivity toward the same 4 challenges. Given the context-dependent nature of physiological responses, this strategy allowed us to capture individual differences in responsivity toward multiple challenges (Zeytinoglu et al., 2020). Another rationale for including autonomic responsivity scores toward multiple challenges in the analyses was to prevent loss of information due to aggregation.
After choosing the best fitting model, groups were compared in relation to demographic variables and self-regulation outcomes. For each continuous demographic variable (i.e., income-to-needs) and self-regulation outcome, the Wald equality test of means was used to determine whether profiles differed with respect to that variable. This procedure provides an overall chi-square significance test that help determine whether groups differ from one another and pairwise comparisons that allow to test which groups’ mean scores differed from one another. In these models, the three-step method was used to adjust for measurement error (Asparouhov and Muthén 2014). For two categorical demographic variables (sex and ethnicity/race), profile memberships were exported to SPSS and chi-square tests were conducted.
Results
Selection of Number of Profiles and their Characterization
An evaluation of the fit indices suggested that a four-profile solution fit the data well and was interpretable. The fit statistics can be found in Supplemental Table S2. As the number of profiles increased, AIC, BIC, and Adjusted BIC values decreased. These fit statistics suggested that the four- and five-profiles solutions provided better fit to the data than the models with fewer profiles. Moreover, the LMR test comparing the three-profile solution to the four-profile solution was marginally significant (p = .06), suggesting that the four-profile solution likely provided better fit to the data. The LMR test comparing the four-profile solution to the five-solution was not significant (p = .49), a result also favoring the four-profile solution.
Model estimates from the four-profile LPA are presented in Table 1 and displayed graphically in Figure 1. Two strategies were utilized to characterize the profiles. The first strategy was evaluating the profiles’ mean estimates for each indicator (e.g., baseline RSA) and checking whether the p-values associated with these estimates were significantly different from zero (p < .05). Using this strategy, profiles were characterized based on whether children experienced activation, inhibition, or no change in their autonomic activity. The second strategy was comparing the profiles’ mean estimates for each indicator (e.g., baseline RSA) by conducting analyses of variance analyses (ANOVAs). If the overall ANOVA was significant for a given indicator, Tukey’s post-hoc tests were conducted to identify which profiles differed from the others. Results from ANOVA are reported in Supplemental Table S3 and Tukey analyses are reported in Supplemental Table S4. Differences across autonomic profiles based on Tukey results are also indicated via small-case letters in Table 1. These results are used in the characterization of the autonomic profiles below.
Table 1.
Model Estimates from the Latent Profile Analyses
| Reciprocal Sympathetic Activation | Moderate Parasympathetic Inhibition | Coinhibition | High Sympathetic Activation | ||||||||||||
|---|---|---|---|---|---|---|---|---|---|---|---|---|---|---|---|
| (n = 68; 26%) | (n = 108, 42%) | (n=65; 25%) | (n = 19, 7%) | ||||||||||||
| Estimate | SE | p | Estimate | SE | p | Estimate | SE | p | Estimate | SE | p | ||||
| Sympathetic | |||||||||||||||
| Baseline PEP | 90.51 a | 0.87 | 0.00 | 91.66 a | 0.66 | 0.00 | 89.33 a | 1.08 | 0.00 | 97.58 b | 1.56 | 0.00 | |||
| PEP responsivity during Problem-Solving | −1.54 a | 0.28 | 0.00 | −0.56 a | 0.22 | 0.01 | 1.32 b | 0.42 | 0.00 | −5.12 c | 0.78 | 0.00 | |||
| PEP responsivity during Cognitive Control | −1.17 a | 0.32 | 0.00 | −0.37 a | 0.22 | 0.09 | 2.77 b | 0.32 | 0.00 | −4.66 c | 0.66 | 0.00 | |||
| PEP responsivity during Blocked Goal Frustration | −2.03 a | 0.39 | 0.00 | −0.31 b | 0.37 | 0.40 | 3.20 c | 0.33 | 0.00 | −5.85 d | 0.77 | 0.00 | |||
| PEP responsivity during Unfair Frustration | −1.24 a | 0.29 | 0.00 | 0.25 b | 0.40 | 0.53 | 3.83 c | 0.42 | 0.00 | −4.76 d | 0.90 | 0.00 | |||
| Parasympathetic | |||||||||||||||
| Baseline RSA | 7.54 a | 0.15 | 0.00 | 7.18 a | 0.13 | 0.00 | 7.28 a | 0.14 | 0.00 | 5.98 b | 0.30 | 0.00 | |||
| RSA responsivity during Problem-Solving | −1.41 a | 0.12 | 0.00 | −0.68 b | 0.10 | 0.00 | −0.96 b | 0.08 | 0.00 | −0.50 b | 0.21 | 0.02 | |||
| RSA responsivity during Cognitive Control | −0.71 a | 0.12 | 0.00 | −0.19 b | 0.06 | 0.00 | −0.37 b | 0.06 | 0.00 | 0.05 b | 0.12 | 0.76 | |||
| RSA responsivity during Blocked Goal Frustration | −1.74 a | 0.14 | 0.00 | −0.74 b | 0.15 | 0.00 | −0.97 b | 0.08 | 0.00 | −0.45 b | 0.22 | 0.07 | |||
| RSA responsivity during Unfair Frustration | −0.78 a | 0.12 | 0.00 | −0.17 b | 0.09 | 0.04 | −0.44 a | 0.09 | 0.00 | 0.09 b | 0.24 | 0.64 | |||
Note. Negative PEP responsivity scores indicate PEP shortening (i.e., sympathetic activation), whereas positive PEP responsivity scores indicate PEP lengthening (i.e., sympathetic inhibition). Negative RSA responsivity scores indicate RSA withdrawal (i.e., parasympathetic inhibition), whereas positive RSA responsivity scores indicate RSA augmentation (i.e., parasympathetic activation). For each indicator, analyses of variance analyses followed by Tukey comparisons were conducted to compare group differences in means. Different subscript letters correspond to groups that differed significantly based on post hoc comparisons reported in Table S4 (p <.05). For example, for each indicator (e.g., Baseline PEP), values with subscript “a” are not significantly different from one another, but they are statistically different than values with “b” or “c”.
Figure 1.

Graphical representation of the autonomic profiles using standardized scores corresponding to the group estimates reported in Table 1. Cog = Cognitive. Emo = emotional task. PS = problem-solving (Tangrams) task. Cog Control=Cognitive Control (Go/No-Go) task. Blocked Goal refers to a frustrating Locked Box task. Unfair refers to the unfair, frustrating Toy Removal task.
Moderate parasympathetic inhibition profile.
The moderate parasympathetic inhibition profile was the most prevalent profile, constituting 42% of the sample. This profile showed moderate RSA withdrawal (parasympathetic inhibition) across all tasks and PEP shortening (sympathetic activation) only in the problem-solving task. This profile showed lower RSA withdrawal than the reciprocal sympathetic activation profile across all tasks (p < .001), and similar levels of RSA withdrawal compared to the other groups (p = .23–.87). This profile also showed lower PEP shortening than the reciprocal sympathetic activation group during the emotional challenges (p = .036–.006) and that of the high sympathetic activation group across all tasks, and greater PEP shortening than the coinhibition group (p < .05).
Reciprocal sympathetic activation profile.
The reciprocal sympathetic activation profile constituted 26% of the sample and was the 2nd most prevalent profile. This profile showed moderate to high levels of PEP shortening (sympathetic activation) and high levels of RSA withdrawal (parasympathetic inhibition) across all tasks. As shown in Tables 1 and S4, compared to the other profiles, this group had significantly greater RSA withdrawal across all tasks (p <.05) except for Toy Removal and showed greater sympathetic activation than the coinhibition and moderate parasympathetic inhibition groups across most challenges.
Coinhibition profile.
The coinhibition profile was the 3rd most common profile constituting 25% of the sample. This group experienced RSA withdrawal (parasympathetic inhibition) and PEP lengthening (sympathetic inhibition) across all tasks. As shown in Tables 1 and S4, this profile showed lower RSA withdrawal than the reciprocal sympathetic activation profile, comparable RSA withdrawal to coinhibition profile, and greater RSA withdrawal than the high sympathetic activation group.
High sympathetic activation profile.
This profile was the smallest group at 7% of the sample, and showed greater baseline PEP and lower baseline RSA compared to the other three groups. As shown in Tables 1 and S4, compared to the other groups, this group showed greater PEP shortening (sympathetic activation) during all tasks. Although RSA withdrawal scores of this group was comparable to the other groups (p >.05; see Table S4), this group displayed the lowest levels of RSA withdrawal across the four tasks.
ANS Profiles in Relation to Demographics and Self-Regulation Outcomes
Demographics.
The omnibus test comparing autonomic profiles in relation to maternal education and income-to-needs were not significant; F(3, 260) = 4.82, p = .19, and F(3, 260) = 1.99, p = .57, respectively. Profile membership did not differ across race/ethnicity (i.e., non-Hispanic White vs. other; χ2 = 3.98, p = .68). Profiles differed with respect to child sex (χ2 = 8.25, p = .04). The reciprocal sympathetic activation group had 42 girls and 26 boys, the moderate parasympathetic group had 63 girls and 45 boys, the coinhibition group had 34 girls and 31 boys, and the high sympathetic activation group had 14 boys and 5 girls.
Executive functioning.
The omnibus test comparing autonomic profiles in relation to executive functioning in preschool was significant F(3, 260) = 9.79, p = .02. As presented in Figure 2a, the executive functioning score of the reciprocal sympathetic activation group (M = .25, SE = .10) was significantly higher than that of the moderate parasympathetic inhibition group (M = −.06, SE = .08), χ2 = 4.65, p = .031, that of the high sympathetic activation group (M = −.33, SE = .16), χ2 = 8.50, p = .004, and marginally greater than that of the coinhibition group (M = −.03, SE = .11), χ2 = 3.17, p = .075. The omnibus test comparing autonomic profiles for executive functioning in kindergarten was also significant F(3, 260) = 10.07, p = .018. As shown in Figure 2b, the reciprocal sympathetic activation profile (M = .17, SE = .12) showed better executive functioning than the sympathetic domination profile (M = −.34, SE = .13).
Figure 2.

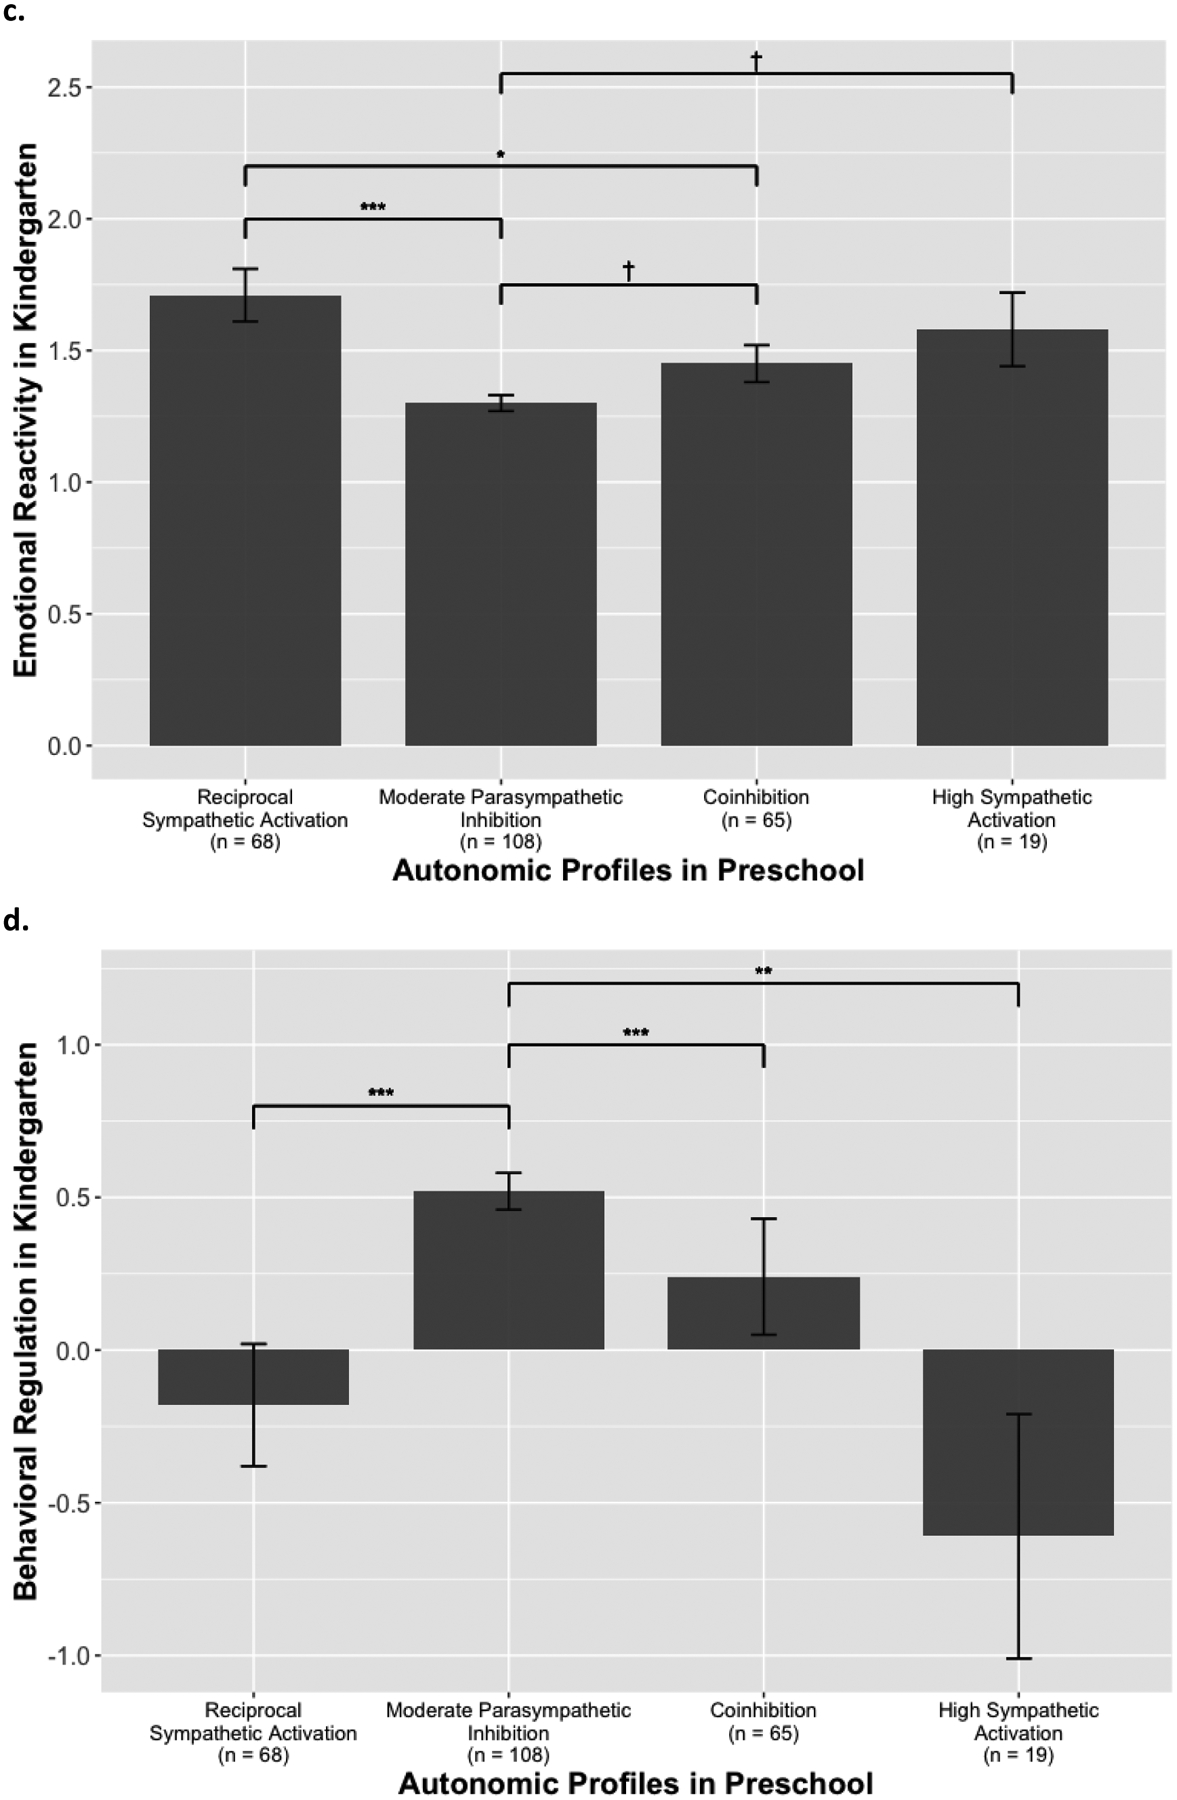
Children’s self-regulation outcomes across autonomic profiles in preschool. Error bars represent standard error of the mean. Asterisks (*) indicate the significance level of the pair-wise chi-square difference tests comparing profiles. †p <.10, *p < .05, **p <.01, ***p < .005.
Emotion regulation.
The omnibus test comparing profiles in relation to observed emotion regulation in preschool was not significant, p = .16. The omnibus test for observed emotion regulation in kindergarten was marginally significant, F(3, 260) = 7.46, p = .06. The reciprocal sympathetic activation (M = .12, SE = .14) and coinhibition (M = .19, SE = .10) profiles showed better emotion regulation than the sympathetic domination profile (M = −.39, SE=.20), χ2 = 3.92, p = .048 and χ2 = 6.12, p = .013, respectively.
The omnibus test for teacher-report of emotional reactivity in kindergarten was significant F(3, 260) = 21.34, p < .001. As presented in Figure 2c, the emotional reactivity score of the reciprocal sympathetic activation profile (M = 1.71, SE = .10) was higher than that of the moderate parasympathetic inhibition profile (M = 1.30, SE = .03), χ2 = 15.81, p < .001 and that of the coinhibition profile (M = 1.45, SE = .07), χ2 = 3.88, p = .049. The emotional reactivity of the moderate parasympathetic inhibition profile was marginally lower than that of the high sympathetic activation, χ2 = 3.82, p = .051 and the coinhibition profiles, χ2 = 3.19, p = .07.
Behavioral regulation.
The omnibus test comparing the profiles’ behavioral regulation in kindergarten was significant F(3, 260) = 45.62, p < .001. As presented in Figure 2d, the behavioral regulation score of the moderate parasympathetic inhibition group (M = .52, SE = .06) was significantly higher than that of the reciprocal sympathetic activation group (M = −.18, SE = .20), χ2 = 11.66, p = .001, the coinhibition group (M = −.27, SE = .19), χ2 = 14.08, p < .001, and the high sympathetic activation group (M = −.61, SE = .40), χ2 = 7.92, p = .005.
Discussion
The goal of this study was to address a critical gap in existing knowledge, which is whether individual differences in children’s multi-system autonomic functioning during everyday emotional and cognitive challenges are associated with broad-level self-regulation outcomes. To address this goal, we examined whether there are distinct autonomic profiles in preschoolers and if so, whether these profiles differ with respect to child self-regulation outcomes (executive functioning, emotion regulation, and behavioral regulation) both concurrently in preschool and one year later. Using LPA, we identified four autonomic profiles: reciprocal sympathetic activation, moderate parasympathetic inhibition, coinhibition, and high sympathetic activation profiles. These autonomic profiles were meaningfully associated with self-regulation outcomes concurrently and one year later.
As hypothesized, the reciprocal sympathetic activation profile was a common autonomic profile, including about one fourth of the sample. This group demonstrated relatively higher levels of parasympathetic inhibition (RSA withdrawal) and moderate-to-high levels of sympathetic activation (PEP shortening) across all challenges. This group showed greater sympathetic activation than the moderate parasympathetic inhibition and the coinhibition groups across most challenges and greater parasympathetic inhibition than all other profiles. This profile is consistent with ACM’s “sensitive profile” and adds to previous findings showing that about one fourth of school-aged children respond to challenges with this autonomic profile (Del Giudice et al., 2012).
As expected, a moderate parasympathetic inhibition profile emerged as the most common profile, consistent with previous work (Del Giudice et al., 2012; Ellis et al., 2017; Quas et al.; 2014). This group showed moderate parasympathetic inhibition (RSA withdrawal) across all tasks and sympathetic activation (PEP shortening) only in the problem-solving challenge. This finding is consistent with Polyvagal Theory’s proposition that parasympathetic inhibition without the recruitment of the sympathetic system is a normative autonomic response pattern to everyday challenges (Porges, 2011).
The third most prevalent profile, the coinhibition group, constituted of one fourth of the sample. This group showed moderate parasympathetic inhibition (RSA withdrawal) and low-to-moderate sympathetic inhibition (PEP lengthening) across all tasks. This finding extends previous work showing coinhibition as a common autonomic profile in children (Alkon et al., 2003, Salomon et al., 2000).
The smallest profile that emerged was the high sympathetic activation profile. This group showed sympathetic activation across all challenges and parasympathetic inhibition only during the problem-solving challenge. This group displayed lower baseline RSA, higher baseline PEP and greater PEP shortening compared to other groups. This autonomic pattern is similar to ACM’s “vigilant profile”. Our findings are aligned with the findings of Del Giudice et al. (2012) showing 10% of their sample belonged to a vigilant group and those of Ellis et al. (2017) indicating that 6% of their sample belonged to this profile.
Importantly, we found that autonomic profiles differed in relation to self-regulation outcomes. The reciprocal sympathetic activation group showed better executive functioning than the other three profiles in preschool and continued to show better executive functioning compared to the high sympathetic activation profile one year later. One explanation for this finding is that children with this autonomic pattern may be more open to the stimuli in their environments and show greater engagement (or are more “sensitive”), which may allow them to develop better executive functioning, particularly in safe environments (Del Giudice et al. 2012). In contrast, the high sympathetic activation profile showed worse executive functioning at both time points. One explanation is that children who respond to challenges via high levels of sympathetic activation without showing sufficient levels of parasympathetic withdrawal may be over-aroused and this may prevent them from exerting control during situations that call for cognitive effort. Notably, previous research has linked higher sympathetic activity with better cognitive outcomes in young children (e.g., Giuliano et al., 2018). Our findings emphasize the importance of multi-system investigations, given that two similar sympathetic responses (i.e., sympathetic activation across multiple tasks) were associated with better or worse executive functioning based on, not only the magnitude of sympathetic activity, but also the accompanying parasympathetic response.
Preschoolers’ autonomic profiles also differed with respect to teachers’ report on children’s emotional reactivity and behavioral regulation in kindergarten. The moderate parasympathetic inhibition group showed lower emotional reactivity and better behavioral regulation compared to the other three groups in kindergarten. These findings suggest that children in this group may not be “over-” or “under-” aroused but show sufficient levels of autonomic responsivity that allow them to competently regulate their emotions and behaviors. Although the autonomic profiles in preschool did not differ in relation to observed emotion regulation in preschool, there was a marginal difference across profiles in observed emotion regulation in kindergarten. The reciprocal sympathetic activation and coinhibition profiles showed better emotion regulation than the high sympathetic activation profile.
Notably, we did not find ACM’s unemotional pattern of stress responsivity characterized by “low autonomic responsivity” in this sample. Del Giudice et al. (2012) found 18% of their sample and Ellis et al. (2017) found 10% of their sample to belong to this profile, whereas Quas et al. (2014) identified this profile in only two out of four of their samples and Kolacz et al. (2016) did not identify this profile in their sample. One explanation for this discrepancy is that this profile may not emerge in early childhood but begin to emerge later in middle childhood or adolescence. Another explanation may be that if this response style develops as a result of exposure to chronic stress, it may emerge in samples that include a higher proportion of participants exposed to such stress.
Notably, in addition to explaining the differential links between children’s autonomic profiles and self-regulation outcomes from an ACM perspective, another explanation may be related to the differences in children’s neurocognitive functioning. A metaanalysis has shown that sympathetic activity is associated with involvement of the prefrontal, anterior and midcingulate regions (regions associated with executive functioning); whereas parasympathetic activity is accompanied with involvement of posterior regions (Beissner et al., 2013). Thus, children’s autonomic profiles may be differentially associated with self-regulation outcomes as a function of differential patterns of neural-cognitive functioning.
Consistent with theoretical models such as ACM and evidence showing moderate levels of stability in children’s autonomic profiles and functioning across early childhood years (e.g., Gatzke-Kopp & Ram, 2018; Roubinov et al., 2021; Zeytinoglu et al., 2020), autonomic profiles can be interpreted as trait-based child characteristics that support or undermine children’s self-regulation outcomes concurrently and one year later. Our novel findings stress the importance of understanding how broad typologies of children’s autonomic functioning may have implications for children’s self-regulation concurrently and subsequently. Future work should extend this work and examine the stability of autonomic profiles across childhood years and their relations with multiple self-regulation outcomes, as well as the neural involvement associated with sympathetic and parasympathetic responses in early childhood.
The current study had several noteworthy strengths. First, this study is one of the first to examine how the functioning of both autonomic branches together related to children’s self-regulation outcomes. This is important because because the state or activity in one system cannot be inferred based on the state or activity in the other system (Berntson et al. 1991). A second strength is that multiple self-regulatory outcomes were assessed, which allowed us to compare autonomic profiles in relation to different self-regulatory outcomes. These assessments were completed using well-established laboratory measures as well as teachers’ report on children’s behaviors in real-life contexts. Third, autonomic functioning was assessed across multiple emotional and cognitive challenges that allowed us to capture broad-level autonomic profiles.
One limitation of the study was that the high sympathetic activation profile consisted of only 19 individuals and therefore comparison of this profile to others should be interpreted with caution. The LMR test comparing the three-profile solution and four-profile solution was marginally significant, suggesting that a three-profile solution is also viable. However, we decided to include the sympathetic activation group because profile solution decisions should be driven by both theory and statistical solutions (Collins & Lanza, 2009), and given previous evidence supporting the existence of a heightened sympathetic activity group (e.g., Del Giudice et al., 2012). Another limitation was that the design of this study did not allow us to decipher whether there was a causal relation between autonomic stress physiology and self-regulation. Given that the autonomic profiles differed with respect to self-regulation outcomes in kindergarten, it is likely that autonomic profiles reflect trait-like characteristics that predict or contribute to future self-regulatory outcomes. However, it is also possible that how individuals regulate their emotions, thoughts, and behaviors may play a role in how the autonomic nervous system responds to challenges. As such, it is important to utilize both experimental and longitudinal designs to better understand the directionality of this relation. Finally, we did not measure HPAA functioning and therefore our profile analyses did not include HPAA responses, which prevented us from directly testing the existence of the profiles proposed in ACM.
Our multi-system and multi-context assessment of children’s autonomic profiles is an innovative and comprehensive approach to capturing individual differences in child autonomic functioning; however, it is not the only viable approach to examining autonomic functioning and self-regulation relations. There are other distinct but complementary approaches to understanding these relations, such as dynamic systems approaches to examine the moment-to-moment relations between autonomic functioning and children’s self-regulation behaviors (for a review see Davis, Brooker, & Kahle, 2020), and/or how children’s autonomic responsivity to and recovery from perturbations may be related to their self-regulatory competencies (e.g., Obradović & Finch, 2017; Armstrong-Carter et al., 2021).
We used a novel and methodologically rigorous approach to examine how preschoolers’ multi-system autonomic functioning across common emotional and cognitive challenges are associated with multiple self-regulation outcomes in early childhood. Our findings have important implications for future research and intervention work. First, it would be important to examine whether and how certain early temperamental (e.g., fearfulness, positive affect) and contextual factors (e.g., neighborhood safety) may influence long-term self-regulation outcomes by contributing to the development of such autonomic profiles. For example, using large-scale samples, it would be critical to examine whether high sympathetic activation pattern emerges as a result of exposure to chronic stress. If so, measuring children’s autonomic functioning may become a clinical method for identifying children who may experience such stress levels. Second, although certain patterns of ANS functioning may be associated with self-regulation difficulties, they may still serve adaptive purposes. For example, children with a high sympathetic activation profile may be able to detect and escape from threatening circumstances. In future work, it would be important to examine the adaptive purposes of distinct autonomic profiles. Overall, this study shows that autonomic profiles are meaningfully related to distinct self-regulatory outcomes in early childhood.
Supplementary Material
Research Highlights.
Latent profile analysis yielded four autonomic profiles in preschoolers: reciprocal sympathetic activation, moderate parasympathetic inhibition, coinhibition, and high sympathetic activation.
Preschoolers’ autonomic profiles were meaningfully associated with self-regulatory competencies assessed concurrently, in preschool, and one year later.
The reciprocal sympathetic activation group showed better executive functions in preschool and kindergarten, particularly compared to the high sympathetic activation group.
The moderate parasympathetic inhibition group showed lower emotional reactivity and better behavioral regulation in kindergarten, compared to the other three groups.
Acknowledgements:
This research was supported by Grant 5R01HD071957 from the Eunice Kennedy Shriver National Institute of Child Health and Human Development and Award F32MH127869 granted to Dr. Zeytinoglu by the National Institute of Mental Health. The content is solely the responsibility of the authors and does not necessarily represent the official views of the National Institutes of Health. The authors wish to express their thanks to the students and staff who assisted with data collection, the families who participated in the study, and Dr. Marion O’Brien who was instrumental in the planning of this project.
Footnotes
Conflict of Interest: The authors have no conflicts of interest to report.
Ethics approval: All study procedures have been approved by the university’s institutional review board, protocol #12-0144.
Data availability:
The data that support the findings are available from Dr. Zeytinoglu upon reasonable request.
References
- Achenbach TM, & Rescorla LA (2001). Manual for ASEBA school-age forms and profiles. Burlington: University of Vermont, Research Center for Children, Youth, & Families. [Google Scholar]
- Alkon A, Boyce WT, Davis NV, & Eskenazi B (2011). Developmental changes in autonomic nervous system resting and reactivity measures in Latino children from 6 to 60 months of age. Journal of Developmental & Behavioral Pediatrics, 32, 668–677. 10.1097/DBP.0b013e3182331fa6 [DOI] [PubMed] [Google Scholar]
- Armstrong-Carter E, Sulik MJ, & Obradović J (2021). Self-regulated behavior and parent-child co-regulation are associated with young children’s physiological response to receiving critical adult feedback. Social Development, 30(3), 730–747. [Google Scholar]
- Beissner F, Meissner K, Bär KJ, & Napadow V (2013). The autonomic brain: an activation likelihood estimation meta-analysis for central processing of autonomic function. Journal of neuroscience, 33(25), 10503–10511. [DOI] [PMC free article] [PubMed] [Google Scholar]
- Berntson GG, Cacioppo JT, & Quigley KS (1991). Autonomic determinism: the modes of autonomic control, the doctrine of autonomic space, and the laws of autonomic constraint. Psychological Review, 98(4), 459–487. 10.1037/0033-295X.98.4.459 [DOI] [PubMed] [Google Scholar]
- Billman GE (2013). The LF/HF ratio does not accurately measure cardiac sympatho-vagal balance. Frontiers in Physiology, 4, 26. [DOI] [PMC free article] [PubMed] [Google Scholar]
- Beauchaine TP (2015). Respiratory sinus arrhythmia: A transdiagnostic biomarker of emotion dysregulation and psychopathology. Current opinion in psychology, 3, 43–47. [DOI] [PMC free article] [PubMed] [Google Scholar]
- Best J, & Miller P (2010). A developmental perspective on executive function. Child Development, 81(6), 1641–1660. 10.1111/j.1467-8624.2010.01499.x.A [DOI] [PMC free article] [PubMed] [Google Scholar]
- Blankson AN, O’Brien M, Leerkes EM, Marcovitch S, Calkins SD, & Weaver JM (2013). Developmental dynamics of emotion and cognition processes in preschoolers. Child development, 84(1), 346–360. [DOI] [PMC free article] [PubMed] [Google Scholar]
- Boyce WT, & Ellis BJ (2005). Biological sensitivity to context: I. An evolutionary–developmental theory of the origins and functions of stress reactivity. Development and psychopathology, 17(2), 271–301. [DOI] [PubMed] [Google Scholar]
- Bush NR, Caron ZK, Blackburn KS, & Alkon A (2016). Measuring cardiac autonomic nervous system (ANS) activity in toddlers - resting and developmental challenges. Journal of Visualized Experiments. 10.3791/53652 [DOI] [PMC free article] [PubMed] [Google Scholar]
- Calkins SD, & Hill A (2007). Caregiver influences on emerging emotion regulation: biological and environmental transactions in early development. In Gross J & Thompson R (Eds.), The handbook of emotion regulation (pp. 229–248). New York: Guilford Press. [Google Scholar]
- Carthy T, Horesh N, Apter A, & Gross JJ (2010). Patterns of emotional reactivity and regulation in children with anxiety disorders. Journal of Psychopathology and Behavioral Assessment, 32(1), 23–36. 10.1007/s10862-009-9167-8 [DOI] [Google Scholar]
- Caughy MOB, Mills B, Owen MT, & Hurst JR (2013). Emergent self-regulation skills among very young ethnic minority children: A confirmatory factor model. Journal of Experimental Child Psychology. 10.1016/j.jecp.2013.07.017 [DOI] [PMC free article] [PubMed] [Google Scholar]
- Collins LM, & Lanza ST (2009). Latent class and latent transition analysis: With applications in the social, behavioral, and health sciences (Vol. 718). John Wiley & Sons. [Google Scholar]
- Davis EL, Brooker RJ, & Kahle S (2020). Considering context in the developmental psychobiology of self-regulation. Developmental psychobiology, 62(4), 423–435. [DOI] [PubMed] [Google Scholar]
- Del Giudice M, Ellis BJ, & Shirtcliff EA (2011). The Adaptive Calibration Model of stress responsivity. Neuroscience and Biobehavioral Reviews, 35(7), 1562–1592. 10.1016/j.neubiorev.2010.11.007 [DOI] [PMC free article] [PubMed] [Google Scholar]
- Del Giudice M, Hinnant JB, Ellis BJ, & El-Sheikh M (2012). Adaptive patterns of stress responsivity: a preliminary investigation. Developmental Psychology, 48(3), 775–790. 10.1037/a0026519 [DOI] [PMC free article] [PubMed] [Google Scholar]
- Diamond A (2013). Executive functions. Annual Review of Psychology, 64, 135–168. 10.1146/annurev-psych-113011-143750 [DOI] [PMC free article] [PubMed] [Google Scholar]
- El-Sheikh M, & Erath SA (2011). Family conflict, autonomic nervous system functioning, and child adaptation: State of the science and future directions. Development and Psychopathology, 23(02), 703–721. 10.1017/S0954579411000034 [DOI] [PMC free article] [PubMed] [Google Scholar]
- El-Sheikh M, Kouros CD, Erath S, Cummings EM, Keller P, & Staton L (2009). Marital conflict and children’s externalizing behavior: interactions between parasympathetic and sympathetic nervous system activity. Monographs of the Society for Research in Child Development, 74(1), vii, 1–79. 10.1111/j.1540-5834.2009.00501.x [DOI] [PMC free article] [PubMed] [Google Scholar]
- Ellis A, Ahmed S, Zeytinoglu S, Isbell E, Calkins SD, Leerkes EM, Morris F & Davis-Keane P (in press) Longitudinal associations between executive function latent constructs and academic achievement: A conceptual replication of Schmitt et al. (2017). Journal of Numerical Cognition. [Google Scholar]
- Ellis BJ, Oldehinkel AJ, & Nederhof E (2017). The adaptive calibration model of stress responsivity: An empirical test in the Tracking Adolescents’ Individual Lives Survey study. Development and Psychopathology, 29(3), 1001–1021. 10.1017/S0954579416000985 [DOI] [PubMed] [Google Scholar]
- Espinet SD, Anderson JE, & Zelazo PD (2012). N2 amplitude as a neural marker of executive function in young children: An ERP study of children who switch versus perseverate on the Dimensional Change Card Sort. Developmental Cognitive Neuroscience, 2(SUPPL. 1). 10.1016/j.dcn.2011.12.002 [DOI] [PMC free article] [PubMed] [Google Scholar]
- Gagne JR, Van Hulle CA, Aksan N, Essex MJ, & Goldsmith HH (2011). Deriving Childhood temperament measures from emotion-eliciting behavioral episodes: Scale construction and initial validation. Psychological Assessment, 23(2), 337–353. 10.1037/a0021746 [DOI] [PMC free article] [PubMed] [Google Scholar]
- Gatzke-Kopp L, & Ram N (2018). Developmental dynamics of autonomic function in childhood. Psychophysiology, 55(11), e13218. [DOI] [PubMed] [Google Scholar]
- Gatzke-Kopp LM, Benson L, Ryan PJ, & Ram N (2020). Cortical and affective regulation of autonomic coordination. Psychophysiology, 57(5), e13544. [DOI] [PMC free article] [PubMed] [Google Scholar]
- Giuliano RJ, Karns CM, Roos LE, Bell TA, Petersen S, Skowron EA, … & Pakulak E (2018). Effects of early adversity on neural mechanisms of distractor suppression are mediated by sympathetic nervous system activity in preschool-aged children. Developmental Psychology, 54(9), 1674. [DOI] [PMC free article] [PubMed] [Google Scholar]
- Graziano PA, Reavis RD, Keane SP, & Calkins SD (2007). The role of emotion regulation in children’s early academic success. Journal of School Psychology, 45(1), 3–19. [DOI] [PMC free article] [PubMed] [Google Scholar]
- Holzman JB, & Bridgett DJ (2017). Heart rate variability indices as bio-markers of top-down self-regulatory mechanisms: A meta-analytic review. Neuroscience and Biobehavioral Reviews, Vol. 74, pp. 233–255). 10.1016/j.neubiorev.2016.12.032 [DOI] [PubMed] [Google Scholar]
- Kogan A, Gruber J, Shallcross AJ, Ford BQ, & Mauss IB (2013). Too much of a good thing? Cardiac vagal tone’s nonlinear relationship with well-being. Emotion, 13(4), 599–604. 10.1037/a0032725 [DOI] [PubMed] [Google Scholar]
- Kogan A, Oveis C, Carr EW, Gruber J, Mauss IB, Shallcross A, Impett EA, van der Lowe I, Hui B, Cheng C, & Keltner D (2014). Vagal activity is quadratically related to prosocial traits, prosocial emotions, and observer perceptions of prosociality. Journal of Personality and Social Psychology, 107(6), 1051–1063. 10.1037/a0037509 [DOI] [PubMed] [Google Scholar]
- Lahat A, Todd RM, Mahy CEV, Lau K, & Zelazo PD (2009). Neurophysiological correlates of executive function: a comparison of European-canadian and chinese-canadian 5-year-old children. Frontiers in Human Neuroscience, 3, 72. 10.3389/neuro.09.072.2009 [DOI] [PMC free article] [PubMed] [Google Scholar]
- Lo Yungtai, Mendell Nancy, Rubin D (2001). Testing the number of components in a normal mixture. Biometrika, 88(3), 767–778. [Google Scholar]
- Lozano DL, Norman G, Knox D, Wood BL, Miller BD, Emery CF, & Berntson GG (2007). Where to B in dZ/dt. Psychophysiology, 44, 113–119. 10.1111/j.1469-8986.2006.00468.x [DOI] [PubMed] [Google Scholar]
- Marcovitch S, Leigh J, Calkins SD, Leerks EM, O’Brien M, & Blankson AN (2010). Moderate vagal withdrawal in 3.5-year-old children is associated with optimal performance on executive function tasks. Developmental Psychobiology, 52(6), 603–608. 10.1002/dev.20462 [DOI] [PMC free article] [PubMed] [Google Scholar]
- Masten AS, Herbers JE, Desjardins CD, Cutuli JJ, McCormick CM, Sapienza JK, Long JD, & Zelazo PD (2012). Executive function skills and school success in young children experiencing homelessness. Educational Researcher, 41, 375–384. 10.3102/0013189X12459883 [DOI] [Google Scholar]
- McDermott PA, Rikoon SH, & Fantuzzo JW (2016). Transition and protective agency of early childhood learning behaviors as portents of later school attendance and adjustment. Journal of School Psychology, 54, 59–75. 10.1016/j.jsp.2015.10.003 [DOI] [PubMed] [Google Scholar]
- Miller JG, Kahle S, & Hastings PD (2017). Moderate baseline vagal tone predicts greater prosociality in children. Developmental Psychology, 53(2), 274–289. 10.1037/dev0000238 [DOI] [PMC free article] [PubMed] [Google Scholar]
- Monette S, Bigras M, & Guay MC (2011). The role of the executive functions in school achievement at the end of Grade 1. Journal of Experimental Child Psychology, 109(2), 158–173. 10.1016/j.jecp.2011.01.008 [DOI] [PubMed] [Google Scholar]
- Morrison FJ, Ponitz CC, & McClelland M (2010). Self-Regulation and academic achievement in the transition to school. In The Developing human brain: Development at the intersection of emotion and cognition (pp. 203–224). 10.1037/12059-011 [DOI] [Google Scholar]
- Muthén LK, & Muthén BO (2012). Statistical analysis with latent variables using Mplus. Los Angeles: Muthén & Muthén. [Google Scholar]
- Nigg JT, Quamma JP, Greenberg MT, & Kusche CA (1999). A two-year longitudinal study of neuropsychological and cognitive performance in relation to behavioral problems and competencies in elementary school children. Journal of Abnormal Child Psychology, 27(1), 51–63. 10.1023/A:1022614407893 [DOI] [PubMed] [Google Scholar]
- Nigg JT (2017). Annual Research Review: On the relations among self-regulation, self-control, executive functioning, effortful control, cognitive control, impulsivity, risk-taking, and inhibition for developmental psychopathology. In Journal of Child Psychology and Psychiatry and Allied Disciplines. 10.1111/jcpp.12675 [DOI] [PMC free article] [PubMed] [Google Scholar]
- Obradović J (2010). Effortful control and adaptive functioning of homeless children: Variable-focused and person-focused analyses. Journal of Applied Developmental Psychology, 31, 109–117. 10.1016/j.appdev.2009.09.004 [DOI] [PMC free article] [PubMed] [Google Scholar]
- Obradović J, & Finch JE (2017). Linking executive function skills and physiological challenge response: Piecewise growth curve modeling. Developmental Science, 20(6), e12476. [DOI] [PubMed] [Google Scholar]
- Perry NB, Dollar JM, Calkins SD, Keane SP, & Shanahan L (2018). Childhood self-regulation as a mechanism through which early overcontrolling parenting is associated with adjustment in preadolescence. Developmental Psychology, 54(8), 1542=1554. 10.1037/dev0000536 [DOI] [PMC free article] [PubMed] [Google Scholar]
- Perry NB, Dollar JM, Calkins SD, Keane SP, & Shanahan L (2020). Maternal socialization of child emotion and adolescent adjustment: Indirect effects through emotion regulation. Developmental psychology, 56(3), 541–552. [DOI] [PMC free article] [PubMed] [Google Scholar]
- Philbrook LE, Erath SA, Hinnant JB, & El-Sheikh M (2018). Marital conflict and trajectories of adolescent adjustment: The role of autonomic nervous system coordination. Developmental Psychology, 54(9), 1687–1696. 10.1037/dev0000501 [DOI] [PMC free article] [PubMed] [Google Scholar]
- Porges SW (2011). The Polyvagal Theory: Neurophysiological foundations of emotions, attachment, communication, and self-regulation (Norton Series on Interpersonal Neurobiology). New York, NY: W. W. Norton & Company. [Google Scholar]
- Portilla XA, Ballard PJ, Adler NE, Boyce WT, & Obradović J (2014). An Integrative View of School Functioning: Transactions Between Self-Regulation, School Engagement, and Teacher-Child Relationship Quality. Child Development, 85(5), 1915–1931. 10.1111/cdev.12259 [DOI] [PMC free article] [PubMed] [Google Scholar]
- Qu J, Leerkes EM, & King EK (2016). Preschoolers’ distress and regulatory behaviors vary as a function of infant–mother attachment security. Infant Behavior and Development, 44, 144–147. [DOI] [PMC free article] [PubMed] [Google Scholar]
- Quas JA, Yim IS, Oberlander TF, Nordstokke D, Essex MJ, Armstrong JM, Bush N, Obradović J, & Boyce WT (2014). The symphonic structure of childhood stress reactivity: Patterns of sympathetic, parasympathetic, and adrenocortical responses to psychological challenge. Development and Psychopathology, 1–20. 10.1017/S0954579414000480 [DOI] [PMC free article] [PubMed] [Google Scholar]
- Rash JA, Thomas JC, Campbell TS, Letourneau N, Granger DA, Giesbrecht GF, & APrON Study Team. (2016). Developmental origins of infant stress reactivity profiles: A multi-system approach. Developmental psychobiology, 58(5), 578–599. [DOI] [PubMed] [Google Scholar]
- Rikoon S, McDermott P, & Fantuzzo J (2012). Approaches to learning among head start alumni: Structure and validity of the Learning Behaviors Scale. School Psychology Review, 41(3), 272–294. [Google Scholar]
- Roubinov DS, Boyce WT, Lee MR, & Bush NR (2021). Evidence for discrete profiles of children’s physiological activity across three neurobiological system and their transitions over time. Developmental Science, 24(1), e12989. 10.1111/desc.12989 [DOI] [PMC free article] [PubMed] [Google Scholar]
- Salomon K, Matthews KA, & Allen MT (2000). Patterns of sympathetic and parasympathetic reactivity in a sample of children and adolescents. Psychophysiology, 37(6), 842–849. [PubMed] [Google Scholar]
- Shields A, & Cicchetti D (1997). Emotion regulation among school-age children: the development and validation of a new criterion Q-sort scale, Developmental Psychology, 33, 906–916. 10.1037/0012-1649.33.6.906 [DOI] [PubMed] [Google Scholar]
- Sulik MJ, Blair C, Mills-Koonce R, Berry D, & Greenberg M (2015). Early Parenting and the Development of Externalizing Behavior Problems: Longitudinal Mediation Through Children’s Executive Function. Child Development, 86(5), 1588–1603. 10.1111/cdev.12386 [DOI] [PMC free article] [PubMed] [Google Scholar]
- Swingler MM, Isbell E, Zeytinoglu S, Calkins SD, & Leerkes EM (2018). Maternal behavior predicts neural underpinnings of inhibitory control in preschoolers. Developmental Psychobiology, 60(6), 692–706. [DOI] [PMC free article] [PubMed] [Google Scholar]
- Thayer JF, Hansen AL, Saus-Rose E, & Johnsen BH (2009). Heart rate variability, prefrontal neural function, and cognitive performance: The neurovisceral integration perspective on self-regulation, adaptation, and health. Annals of Behavioral Medicine, 37(2), 141–153. 10.1007/s12160-009-9101-z [DOI] [PubMed] [Google Scholar]
- Thompson RA, Lewis MD, & Calkins SD (2008). Reassessing emotion regulation. Child Development Perspectives, 2(3), 124–131. 10.1111/j.1750-8606.2008.00054.x [DOI] [Google Scholar]
- Zelazo PD, & Cunningham W. a. (2007). Executive Function: Mechanisms Underlying Emotion Regulation. Handbook of Emotion Regulation, 135–158. [Google Scholar]
- Zahn D, Adams J, Krohn J, Wenzel M, Mann CG, Gomille LK, … & Kubiak T (2016). Heart rate variability and self-control—A meta-analysis. Biological psychology, 115, 9–26. [DOI] [PubMed] [Google Scholar]
- Zeytinoglu S, Calkins SD, & Leerkes EM (2019). Maternal emotional support but not cognitive support during problem-solving predicts increases in cognitive flexibility in early childhood. International journal of behavioral development, 43(1), 12–23. [DOI] [PMC free article] [PubMed] [Google Scholar]
- Zeytinoglu S, Calkins SD, & Leerkes EM (2020). Autonomic nervous system functioning in early childhood: Responses to cognitive and negatively-valenced emotional challenges. Developmental Psychobiology, 4), 1–17. 10.1002/dev.21926 [DOI] [PMC free article] [PubMed] [Google Scholar]
- Zeytinoglu S, Calkins SD, Swingler MM, & Leerkes EM (2017). Pathways from maternal effortful control to child self-regulation: The role of maternal emotional support. Journal of Family Psychology, 31(2), 170–180. 10.1037/fam0000271 [DOI] [PMC free article] [PubMed] [Google Scholar]
Associated Data
This section collects any data citations, data availability statements, or supplementary materials included in this article.
Supplementary Materials
Data Availability Statement
The data that support the findings are available from Dr. Zeytinoglu upon reasonable request.