

Abstract
Background:
Midlife peri-menopausal and post-menopausal women with metabolic syndrome experience multiple symptoms concurrently.
Objective:
The study objectives were to examine the relationship among symptoms through network visualization and identify and compare symptom clusters and key symptoms across symptom occurrence and symptom severity dimensions in midlife peri-menopausal and post-menopausal women with and without metabolic syndrome.
Methods:
Cross-sectional data from the Study of Women’s Health Across the Nation (SWAN, Visit 5) were used for analysis. A machine-learning-based network analysis and the Walktrap algorithm were used to fulfill the study objectives.
Results:
The number and types of symptom clusters differed between the groups. Midlife peri-menopausal and post-menopausal women with metabolic syndrome experienced the psychological/somatic/genital cluster (key symptom: frequent mood change), the sleep/urinary cluster (sleep disturbance), and the vasomotor cluster (cold sweat) in the symptom occurrence dimension and the psychological/somatic/sexual cluster (anxiety), the sleep/urinary cluster (sleep disturbance), and the vasomotor/genital cluster (night sweat) in the symptom severity dimension. In contrast, midlife peri-menopausal and post-menopausal women without metabolic syndrome experienced the psychological cluster (anxiety), the sleep/somatic/genitourinary cluster (sleep disturbance), and the vasomotor cluster (night sweat) in the symptom occurrence dimension and the psychological/somatic cluster (anxiety), the sleep/urinary cluster (sleep disturbance), and the vasomotor cluster (night sweat), and the sexual/genital cluster (vaginal dryness) in the symptom severity dimension.
Discussion:
The study findings may serve as a knowledge basis for effective assessment and management of symptom clusters and key symptoms in clinical settings and provide directions for future development of targeted symptom management interventions.
Keywords: menopause, obesity, quality of life, symptom management, women’s health
Metabolic syndrome is a constellation of metabolic abnormalities that occur together, which are characterized by abdominal obesity, high blood pressure, high blood sugar level, and atherogenic dyslipidemia (Rochlani et al., 2017). With the rapid spread of Western lifestyles worldwide, the prevalence of metabolic syndrome has continued to increase in the past few decades (Saklayen, 2018). The increasing prevalence of metabolic syndrome has critical health implications due to its association with development of diabetes, cardiovascular disease, and cancer (Rochlani et al., 2017; Saklayen, 2018). Unique factors place women at higher risk for metabolic syndrome than men, such as pregnancy-related weight gain, gestational diabetes, and menopause (Bentley-Lewis et al., 2007).
Midlife is the most vulnerable life stage for women to develop metabolic syndrome. This is a period when they experience changes in their body fat distribution and fluctuating hormonal level, such as elevated follicle-stimulating hormone (FSH), which is an endocrinological hallmark of peri-menopause and decrease in estrogen and progesterone—all of which are associated with aging and menopause (Harlow & Derby, 2015; Santoro & Randolph, 2011). As a result, midlife women develop metabolic abnormalities that characterize metabolic syndrome. Midlife women with metabolic syndrome are more likely to experience a complex array of symptoms than those without metabolic syndrome. For example, a cross-sectional study found that midlife women with metabolic syndrome had significantly higher depression and anxiety than those without nonmetabolic syndrome (Roohafza et al., 2012). Other studies reported that midlife women with metabolic syndrome experience sleep disturbance and an accelerated decline in perceptual speed (Hall et al., 2012; Kazlauskaite et al., 2020). Clinical characteristics of metabolic syndrome such as abdominal obesity, high blood pressure, and atherogenic dyslipidemia facilitate aging in midlife women and result in a unique set of symptoms (Shoelson et al., 2007). As such, midlife women with metabolic syndrome experience an involved range of symptoms that often results in significant symptom burden and impaired health-related quality of life
Midlife women experience symptoms regardless of their menopausal stage. Yet, previous research has shown that midlife women in peri-menopause and post-menopause experience more severe symptoms than those in pre-menopause. There was a significant positive linear trend in the mean scores for vasomotor, psychosocial, physical, and sexual symptoms from pre-menopause to post-menopause (Yim et al., 2015). In addition, peri-menopause was associated with a higher risk of depression and post-menopause with a higher risk of anxiety than pre-menopause (Mulhall et al., 2018). Therefore, midlife women in peri-menopause and post-menopause experience more prevalent and severe symptoms than those in pre-menopause, and their symptom experience warrants further investigation (Mulhall et al., 2018; Yim et al., 2015). When midlife women experience menopause and metabolic syndrome concurrently, they are likely to experience co-occurrence of multiple symptoms or symptom clusters that often result in significant symptom burden (Bruce & Rymer, 2009). Symptom clusters have been identified and evaluated using advanced statistical methods such as factor analysis, cluster analysis, latent class/profile analysis, and latent transition analysis (Miaskowski, 2016). One study used exploratory and confirmatory factor analysis to examine and compare the types of symptom clusters between midlife peri-menopausal and post-menopausal women with and without metabolic syndrome (Min et al., 2021). Another study used latent transition analysis to examine symptom clustering and model symptomatology across women in pre-menopause, peri-menopause, and post-menopause (Harlow et al., 2017). However, these statistical methods do not evaluate the relationship between symptoms and symptom clusters which hinders us from identifying key symptoms that may derive the overall symptom experience (Papachristou et al., 2019).
Recent use of machine-learning-based network analysis has filled in such a gap by better understanding symptom clusters in oncology patients (Papachristou et al., 2019). Network analysis provides a graph visualization of the complex network structure among various symptoms and symptom clusters and identifies key symptoms through providing centrality measures (Papachristou et al., 2019). The Walktrap algorithm, a type of data-driven clustering algorithm, uses a series of random walk-on-graph trends to find symptom clusters in the network (Papachristou et al., 2019). Through network analysis and the Walktrap algorithm, it is important to understand the relationship among symptoms and identify symptom clusters and key symptoms that may serve as a potential target for future symptom management interventions in midlife peri-menopausal and post-menopausal women with metabolic syndrome. Such understanding will assist in reducing their overall symptom burden and improving health-related quality of life.
The purpose of this current study is to (a) examine the relationship among symptoms through visualization of the network structure, and (b) identify and compare symptom clusters and key symptoms across symptom occurrence and symptom severity dimensions in midlife peri-menopausal and post-menopausal women with and without metabolic syndrome.
Methods
Design and Data Collection
The current study used cross-sectional Visit 5 data from the Study of Women’s Health Across the Nation (SWAN). SWAN participants were assessed at baseline and followed up annually (1996–2016). Visit 5 was selected to capture a greater number of midlife women in peri-menopause and post-menopause with metabolic syndrome because previous visits had more midlife women in pre-menopause and less midlife women in peri-menopause and post-menopause.
Description of the Data Set
SWAN is a multisite and multi-ethnic, community-based study that examines midlife women’s health. A total of 3,302 participants from five ethnic groups were enrolled at baseline. More details can be found elsewhere (Torréns et al., 2009).
Participants
A total of 519 participants met the inclusion criteria for midlife peri-menopausal and post-menopausal women with metabolic syndrome, and 1,584 participants met the inclusion criteria for midlife peri-menopausal and post-menopausal women without metabolic syndrome. The inclusion criteria for midlife menopausal with metabolic syndrome were: (a) midlife women aged 40–65 years, (b) in peri-menopause or post-menopause, and (c) meeting diagnostic criteria for metabolic syndrome based on the National Cholesterol Education Program Adult Treatment Panel III guidelines. At least three of the following conditions is required to be clinically diagnosed with metabolic syndrome: (a) waist circumference ≥ 88 cm for Caucasian, African American, and Hispanic participants and ≥ 80 cm for Chinese and Japanese participants, (b) blood pressure ≥ 130 mm Hg systolic, ≥ 85 mm Hg diastolic, or use of antihypertensive medication, (c) fasting serum glucose ≥ 100 mg/dL or use of insulin, (d) serum triglycerides ≥ 150 mg/dL or medication for hypertriglyceridemia, and (e) High-density lipoprotein (HDL) cholesterol ≤ 50 mg/dL or use of medication for low HDL cholesterol (Marchi et al., 2017). The inclusion criteria for midlife peri-menopausal and post-menopausal women without metabolic syndrome remained the same except that it excluded the diagnostic criteria for metabolic syndrome.
Measures
Demographic and Clinical Characteristics
Demographic and clinical characteristics were obtained from self-report using a SWAN-designed questionnaire. These demographic and clinical characteristics included age, race/ethnicity, level of education, marital status, annual household income, health perception, menopausal stage, and body mass index (BMI).
Menopausal Stage
Menopausal stage was based on self-reported menstrual bleeding patterns in the past 12 months. Peri-menopause refers to having a menstrual period in the past 3 months, which changes in cycle regularity in the past 12 months or no menstrual period in the past 3 months with intermittent menstrual bleeding within the past 12 months. Post-menopause refers to having no menstrual period in the past 12 months (Bromberger et al., 2011).
Metabolic Syndrome Characteristics
Height, weight, waist circumference, blood pressure, fasting blood works needed for clinical diagnosis of metabolic syndrome were collected using standardized study protocols (Hall et al., 2012).
Symptoms
Twelve symptoms were selected based on a broad selection of symptoms studied in the SWAN study as well as symptoms commonly reported in the current literature and Menopausal Rating Scale (MRS; Hall et al., 2012; Lee et al., 2012; Martelli et al., 2012). MRS is one of the most commonly used symptom rating tools in midlife peri-menopausal and post-menopausal women; it has shown good internal consistency with Cronbach’s alpha between .60 and .90 (Heinemann et al., 2004). The symptoms included depression, anxiety, frequent mood change, sexual disturbance, stiffness or soreness in joints, neck, or shoulder, sleep disturbance, night sweat, cold sweat, hot flashes, getting up to urinate, vaginal dryness, and forgetfulness. Among these symptoms, sexual disturbance is a constellation of sexual symptoms that include decreased sexual desire, satisfaction, and arousal, and sleep disturbance is a constellation of sleep-related symptoms that include early morning awakenings, difficulty falling asleep, and difficulty staying asleep.
Depression was measured with the Center for Epidemiological Studies of Depression (CES-D) scale. CES-D scale has shown to be a reliable and valid measure of depressive symptoms in midlife U.S. adults with Cronbach’s alpha of .90 (Cosco et al., 2017). Anxiety was measured using a composite score of four anxiety symptoms: irritability, nervousness, feeling fearful, and heart pounding. This approach has been used in previous literature; the composite score has shown a good convergent validity with the Generalized Anxiety Disorder (GAD-7) scale with Spearman’s rho of .71 (Bromberger et al., 2013). Other symptoms were measured based on a self-report from a SWAN-designed questionnaire asking about the frequency of each symptom in the past 2 weeks. A symptom composite score was derived for each symptom dimension. For the symptom occurrence dimension, each symptom variable was dichotomized based on the presence and absence of symptoms (0 = absent, 1 = present). For the symptom severity dimension, the symptom composite score ranged from 0 to 3 (0 = none, 1 = mild, 2 = moderate, 3 = severe).
Network Analysis
Symptoms are referred to as nodes, and relationships between the symptoms are referred to as edges in the constructed networks (Papachristou et al., 2019). A Pairwise Markov Random Field (PMRF)—an undirected graphical model—was used to formulate network structure to examine the relationship between nodes and subsequent network analysis (Dalege et al., 2017; Papachristou et al., 2019). When a relationship exists between two nodes independent of other nodes, these two nodes are connected by an edge (Papachristou et al., 2019). The R package IsingFit (http://cran.r-project.org/web/packages/IsingFit/IsingFit.pdf) was used to estimate edges in the symptom occurrence network with a gamma value of 0. A parameter in the objective function used to fit the model, called gamma, controls the trade-off between the fitness of the model and the sparsity of the model (number of connected nodes), and this parameter is determined by the researcher (Hevey, 2018). Its value ranges between 0 and 1, with higher gamma value representing a more simple and sparse model (Hevey, 2018). In exploratory research, gamma value is usually set as 0 to estimate more edges (Hevey, 2018). The Ising model is computationally efficient in estimating connections in networks with binary data (Dalege et al., 2017; van Borkulo et al., 2015). To estimate edges in the symptom severity network, we used the R-package q-graph (https://CRAN.R-project.org/package=qgraph) and conducted the polychoric correlation method with the graphical “least absolute shrinkage and selection operator” (glasso) algorithm with a gamma value of .25. This method minimized the number of spurious edges without incurring false results from multiple testing significance of individual pairwise conditional dependency between two nodes (Epskamp et al., 2018). R statistical software 3.6.3 was used to conduct network analysis.
Network Assessment
In the network, circles represent nodes (symptoms), and lines represent edges (the relationship between symptoms; Christian et al., 2020; Papachristou et al., 2019). An edge represents a full conditional relationship between the two nodes in the network (Christian et al., 2020; Papachristou et al., 2019). A green/blue edge indicates a positive relationship between the two nodes, and a red edge suggests a negative relationship (Christian et al., 2020; Papachristou et al., 2019). A thick line indicates a strong relationship between the two nodes, and a thin line indicates a weak relationship (Christian et al., 2020; Papachristou et al., 2019). The layout of a network was based on the Fruchterman-Reingold algorithm, which provides optimal configuration and places nodes with stronger connections close to each other (Papachristou et al., 2019).
Three centrality indices (i.e., betweenness, closeness, and strength) were estimated to understand the importance of each node within the network. Betweenness measures the frequency of a node that lies on the shortest path between two other nodes (Papachristou et al., 2019; Watts & Strogatz, 1998). This index indicates which nodes play a vital role as a bridge between other nodes in the network (Papachristou et al., 2019; Watts & Strogatz, 1998). Closeness measures the average distance of a node to all other nodes in the network (Papachristou et al., 2019). A node with high closeness indicates it may significantly influence all other nodes and affect the overall network (Papachristou et al., 2019). Strength indicates a node that is strongly connected to other nodes. It identifies which node is the most connected within a network (Papachristou et al., 2019). Nodes with high centrality indices are considered key nodes (symptoms) in the network (Papachristou et al., 2019).
Network Accuracy and Stability
After the network was identified, we used a bootstrapping method to test for statistical significance between edge weights with α = .05 based on 1,000 bootstrap iterations. We dropped cases from the data set, estimated correlations between parameters using the bootstrap method, and measured the correlation stability coefficient (Cs-coefficient), an index of stability of each centrality index. There is no cut-off value for Cs-coefficient, but a minimum value of .25 is recommended (Epskamp et al., 2018).
The Walktrap Algorithm
The Walktrap algorithm was used to understand what nodes were highly correlated and grouped the highly correlated nodes into a cluster. Walktrap algorithm is a data-driven clustering algorithm that uses a series of random walks on a graph trend to find clusters in the network (Papachristou et al., 2019). It is assumed that random walk occurs mainly within the same community where the edges are strong (Papachristou et al., 2019). Each symptom cluster was assigned a clinically meaningful name based on the characteristics of included symptoms.
Ethical Considerations
The de-identified data sets, codebooks, and survey questionnaires from the SWAN study were downloaded and stored in an encrypted server at Duke University. This study was approved by the Duke University Human Subjects Ethical Review Board [Pro00106232].
Results
Sample Characteristics
Midlife Peri-Menopausal and Post-Menopausal Women With Metabolic Syndrome
The mean age of participants was 51.50 years (2.74). Most participants were White (48.69%) and African American (30.30%), followed by Hispanic (10.91%), Japanese (5.86%), and Chinese (5.86%). Half of the participants were in peri-menopause (51.84%), and the other half (48.16%) were in post-menopause. The mean BMI was 34.76 kg/m2 (7.01). See Table 1.
Table 1.
Demographic Characteristics
| Metabolic syndrome group, n = 519 |
Without metabolic syndrome group, n = 1584 |
p-value | |
|---|---|---|---|
| Age, mean (SD) | 51.50 (2.74) | 50.98 (2.68) | .0001 |
| Race/ethnicity, n (%) | .9959 | ||
| White | 241 (48.69) | 729 (47.96) | |
| African American | 150 (30.30) | 458 (30.13) | |
| Chinese | 29 (5.86) | 68 (4.47) | |
| Japanese | 29 (5.86) | 92 (6.05) | |
| Hispanic | 54 (10.91) | 173 (11.38) | |
| Education, n (%) | .9651 | ||
| Less than high school | 46 (8.91) | 147 (9.31) | |
| High school graduate | 142 (27.52) | 440 (27.87) | |
| Some college | 158 (30.62) | 499 (31.60) | |
| College graduate | 84 (16.28) | 241 (15.26) | |
| Postgraduate | 86 (16.67) | 252 (15.96) | |
| Marital status, n (%) | .9604 | ||
| Single, never married | 60 (11.63) | 190 (12.07) | |
| Married | 333 (64.53) | 1024 (65.06) | |
| Separated | 106 (20.54) | 307 (19.50) | |
| Widowed | 17 (3.29) | 53 (3.37) | |
| Annual household income, n (%) | < .0001 | ||
| Less than $19,999 | 104 (21.01) | 112 (7.45) | |
| $20,000 to $49,999 | 131 (26.46) | 379 (25.22) | |
| $50,000 to $99,999 | 155 (31.31) | 556 (36.99) | |
| $100,000 or more | 81 (16.36) | 376 (25.02) | |
| Health perception, n (%) | .6553 | ||
| Poor | 17 (3.29) | 276 (17.51) | |
| Fair | 83 (16.05) | 523 (33.19) | |
| Good | 174 (33.66) | 481 (30.52) | |
| Very good | 161 (31.14) | 523 (33.19) | |
| Excellent | 82 (15.86) | 276 (17.51) | |
| Menopausal stage, n (%) | .0022 | ||
| Early perimenopause | 203 (39.12) | 759 (47.92) | |
| Late perimenopause | 66 (12.72) | 202 (12.75) | |
| Post-menopause | 250 (48.16) | 623 (39.33) | |
| BMI in kg/m2, mean (SD) | 34.76 (7.01) | 26.88 (6.33) | < .0001 |
Midlife Peri-Menopausal and Post-Menopausal Women Without Metabolic Syndrome
The mean age of participants was 50.98 years (2.68). The highest proportion was White (47.96%), followed by African American (30.13%), Hispanic (11.38%), Japanese (6.05%), and Chinese (4.47%). More than half (60.67%) were in peri-menopause, and the remaining were post-menopause (39.33%). The mean BMI was 26.88 kg/m2 (6.33). See Table 1.
Network Accuracy and Stability
Strength was the most reliable centrality index with Cs-coefficient higher than .50 across both symptom dimensions for midlife peri-menopausal and post-menopausal women with metabolic syndrome (symptom occurrence = strength .516, betweenness .127, closeness 0; symptom severity = strength .672, betweenness 0, closeness 0) and without metabolic syndrome (symptom occurrence = strength .672, betweenness .128, closeness 0; symptom severity = strength .750, betweenness .205, closeness .283).
Symptom Clusters and Key Symptoms (Symptom Occurrence)
A total of three symptom clusters with a single isolated symptom were identified for midlife peri-menopausal and post-menopausal women with and without metabolic syndrome (Figure 1).
Figure 1.
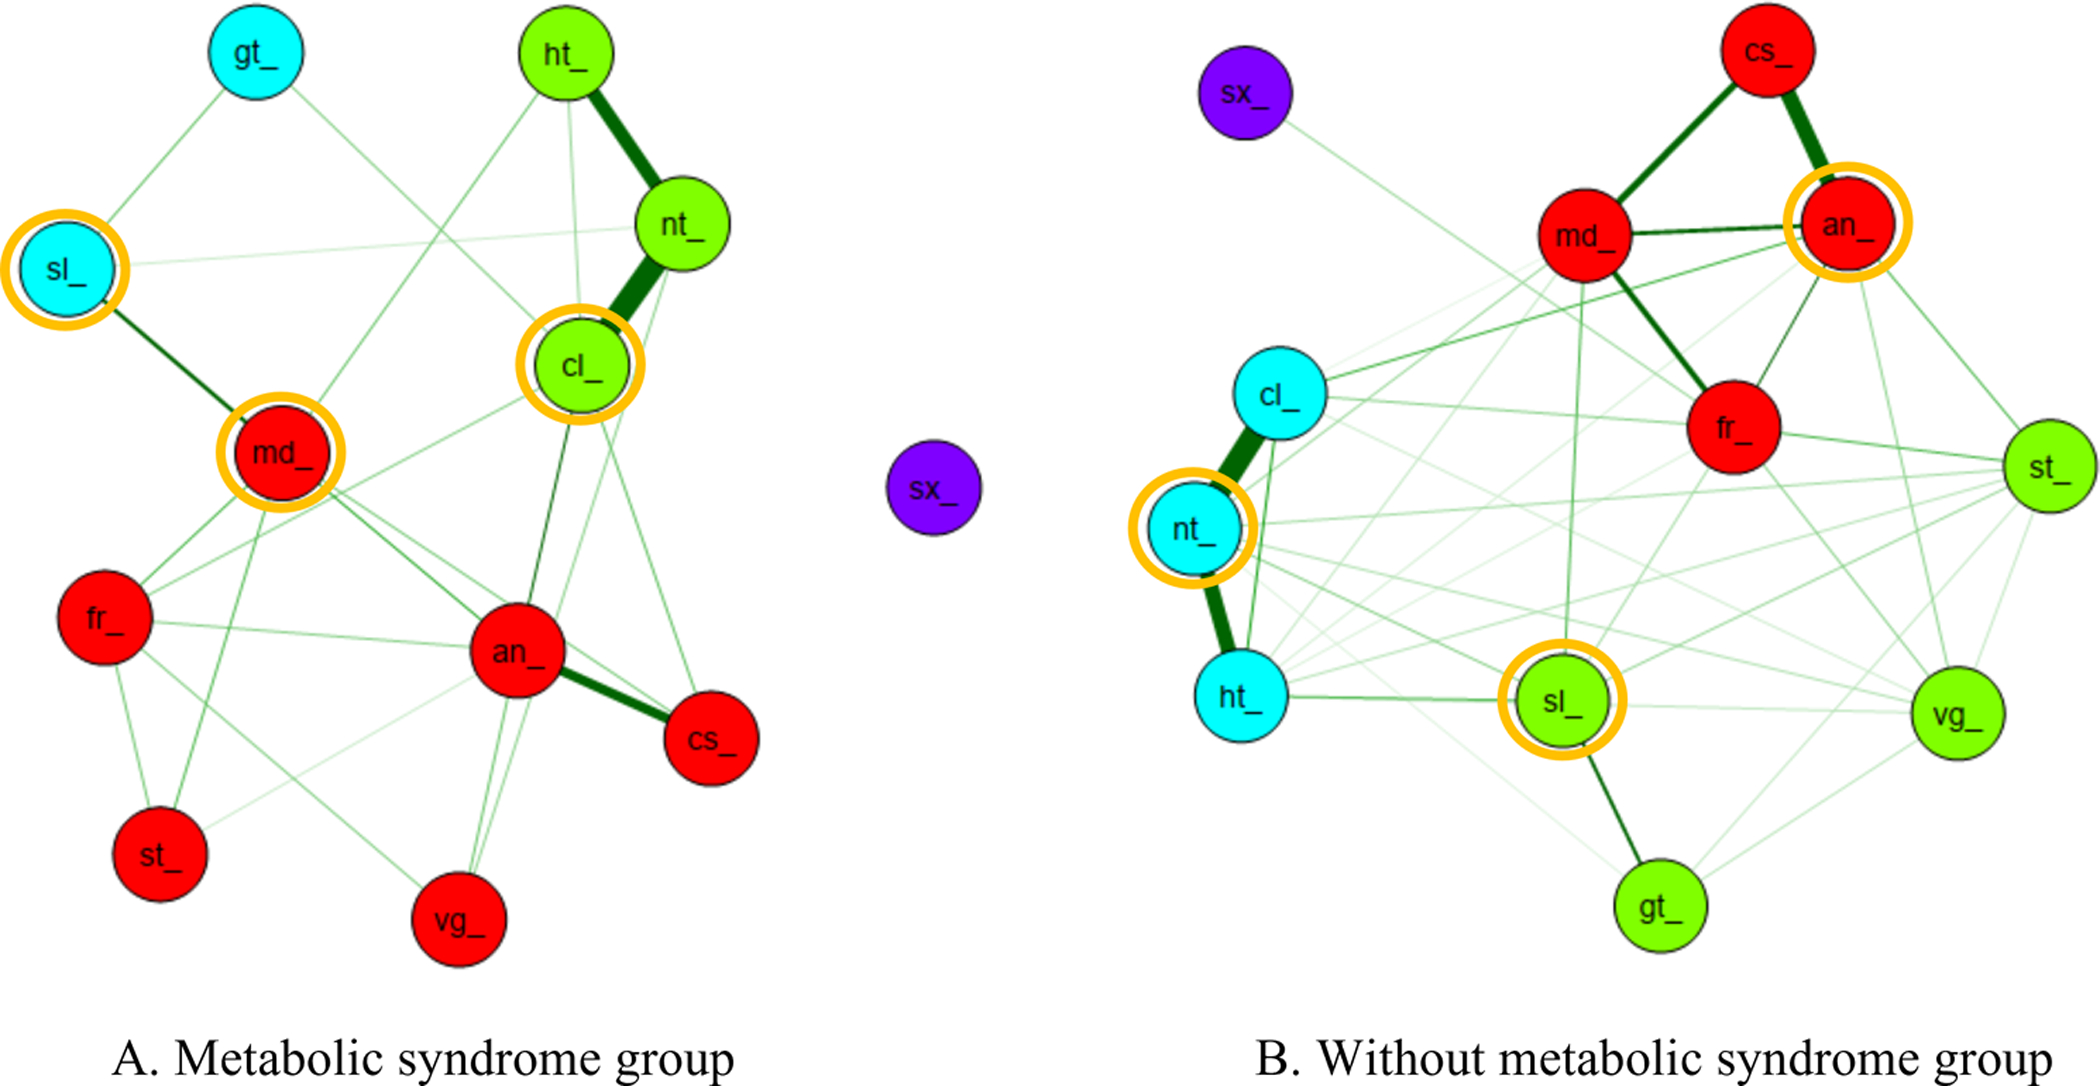
Symptom cluster and key symptom for symptom occurrence dimension
(A) Metabolic syndrome group. Red indicates psychological/somatic/genital cluster which includes anxiety (an_), depression (cs_), frequent mood change (md_), forgetfulness (fr_), stiffness or soreness in joint, neck, or shoulder (st_), and vaginal dryness (vg_). Blue indicates sleep/urinary cluster which includes sleep disturbance (sl_) and getting up to urinate (gt_). Green indicates vasomotor cluster which includes hot flash (ht_), night sweat (nt_), and cold sweat (cl_).
(B) Without metabolic syndrome group. Red indicates psychological cluster which includes anxiety (an_), depression (cs_), frequent mood change (md_), and forgetfulness (fr_). Blue indicates vasomotor cluster which includes hot flash (ht_), night sweat (nt_), and cold sweat (cl_). Green indicates sleep/somatic/genitourinary cluster which includes sleep disturbance (sl_), stiffness or soreness in joint, neck, or shoulder (st_), vaginal dryness (vg_), and getting up to urinate (gt_).
*Yellow circle indicates key symptom in each symptom cluster
Midlife Peri-Menopausal and Post-Menopausal Women with Metabolic Syndrome
Three symptom clusters were identified: psychological/somatic/genital, sleep/urinary, and vasomotor. Psychological/somatic/genital cluster (red) included anxiety, depression, frequent mood change, forgetfulness, stiffness or soreness in joints, neck, shoulder, and vaginal dryness. Sleep/urinary cluster (blue) had sleep disturbance and getting up from sleep to urinate. Vasomotor clusters (green) included hot flashes, night sweat, and cold sweat. In addition, there was a single isolated symptom of sexual disturbance that did not belong to any cluster. When examining the central indices, frequent mood change had the overall highest centrality values with betweenness (18), closeness (.048), and strength value (3.975) in the psychological/somatic/genital cluster, sleep disturbance with betweenness (5), closeness (.035), and strength value (1.671) in the sleep/urinary cluster, and cold sweat with betweenness (10), closeness (.041), and strength value (4.681) in the vasomotor cluster (Table 2). Therefore, the key symptom was frequent mood change for the psychological/somatic/genital cluster, sleep disturbance for the sleep/urinary cluster, and cold sweat for the vasomotor cluster in midlife peri-menopausal and post-menopausal women with metabolic syndrome.
Table 2.
Summary of Centrality Measures for Symptom Clusters (Midlife Menopausal Women with Metabolic Syndrome)
| Symptom | Betweenness | Rank | Closeness | Rank | Strength | Rank |
|---|---|---|---|---|---|---|
| Symptom Occurrence | ||||||
| Psychological/somatic/genital cluster | ||||||
| Mood change | 18 | 1 | .048 | 1 | 3.975 | 3 |
| Anxiety | 14 | 2 | .046 | 2 | 3.937 | 4 |
| Forgetfulness | 1 | 7 | .036 | 6 | 2.359 | 6 |
| Depression | 0 | 8 | .034 | 8 | 2.256 | 7 |
| Vaginal dryness | 0 | 8 | .028 | 10 | 1.283 | 9 |
| Stiffness | 0 | 8 | .027 | 11 | 1.154 | 10 |
| Sleep/urinary cluster | ||||||
| Sleep disturbance | 5 | 5 | .035 | 7 | 1.671 | 8 |
| Getting up from sleep to urinate | 0 | 8 | .029 | 9 | 1.054 | 11 |
| Vasomotor cluster | ||||||
| Cold sweat | 10 | 3 | .041 | 3 | 4.681 | 1 |
| Night sweat | 7 | 4 | .040 | 4 | 4.211 | 2 |
| Hot flash | 3 | 5 | .038 | 5 | 2.387 | 5 |
| Symptom Severity | ||||||
| Psychological/somatic/sexual cluster | ||||||
| Anxiety | 2.164 | 1 | .835 | 1 | 1.129 | 2 |
| Mood change | 1.089 | 2 | .735 | 2 | .796 | 3 |
| Forgetfulness | .194 | 5 | .405 | 5 | .309 | 6 |
| Depression | −.343 | 8 | .441 | 3 | .056 | 7 |
| Stiffness | −1.059 | 9 | .249 | 8 | −.454 | 10 |
| Sexual disturbance | −1.059 | 9 | −2.93 | 12 | −2.216 | 12 |
| Sleep/urinary cluster | ||||||
| Sleep disturbance | .194 | 5 | −.054 | 9 | −.113 | 8 |
| Getting up from sleep to urinate | −1.059 | 9 | −.351 | 10 | −.760 | 10 |
| Vasomotor/genital cluster | ||||||
| Night sweat | .552 | 3 | .354 | 7 | .542 | 1 |
| Hot flash | .373 | 4 | .421 | 4 | .497 | 5 |
| Cold sweat | .015 | 7 | .348 | 6 | .542 | 4 |
| Vaginal dryness | −1.059 | 9 | −.455 | 11 | −1.189 | 11 |
Midlife Peri-Menopausal and Post-Menopausal Women Without Metabolic Syndrome
There were three symptom clusters: psychological cluster, sleep/somatic/genitourinary cluster, and vasomotor with an isolated symptom of sexual disturbance. The psychological cluster (red) had mood-related and cognitive symptoms such as anxiety, depression, frequent mood changes, and forgetfulness. The sleep/somatic/genitourinary cluster (green) consisted of sleep disturbance, stiffness, or soreness, in joints, neck, shoulder, vaginal dryness, and getting up from sleep to urinate. The vasomotor cluster (blue) included night sweat, hot flashes, and cold sweat. However, sexual disturbance was a single isolated symptom that did not belong to any cluster. Several key symptoms were identified after examining three centrality indices. In the psychological cluster, anxiety had the highest betweenness (19), closeness (.040), and strength (5.225). In the sleep/somatic/genitourinary cluster, sleep disturbance had the highest betweenness (9), closeness (.029), and strength (2.991). In the vasomotor cluster, night sweat had the highest betweenness (10), closeness (.030), and strength (5.143; Table 3). As a result, anxiety was the key symptom in the psychological cluster, sleep disturbance in the sleep/somatic/genitourinary cluster, and night sweat in the vasomotor cluster for midlife peri-menopausal and post-menopausal women without metabolic syndrome.
Table 3.
Summary of Centrality Measures for Symptom Clusters (Midlife Menopausal Women without Metabolic Syndrome)
| Symptom | Betweenness | Rank | Closeness | Rank | Strength | Rank |
|---|---|---|---|---|---|---|
| Symptom Occurrence | ||||||
| Psychological cluster | ||||||
| Anxiety | 19 | 1 | .040 | 1 | 5.225 | 1 |
| Forgetfulness | 13 | 2 | .033 | 4 | 3.940 | 5 |
| Frequent mood change | 9 | 4 | .037 | 2 | 4.326 | 3 |
| Depression | 0 | 6 | .035 | 3 | 2.817 | 8 |
| Sleep/somatic/genitourinary cluster | ||||||
| Sleep disturbance | 9 | 4 | .029 | 7 | 2.991 | 7 |
| Stiffness | 0 | 6 | .027 | 8 | 2.402 | 9 |
| Getting up from sleep to urinate | 0 | 6 | .023 | 10 | 1.486 | 11 |
| Vaginal dryness | 0 | 6 | .021 | 11 | 1.732 | 10 |
| Vasomotor cluster | ||||||
| Night sweat | 10 | 3 | .030 | 5 | 5.143 | 2 |
| Cold sweat | 10 | 3 | .029 | 6 | 4.059 | 4 |
| Hot flash | 4 | 5 | .026 | 9 | 3.788 | 6 |
| Symptom Severity | ||||||
| Psychological/somatic cluster | ||||||
| Anxiety | −.156 | 6 | .750 | 1 | 1.270 | 1 |
| Forgetfulness | .468 | 4 | .284 | 6 | .175 | 6 |
| Depression | .052 | 5 | .670 | 4 | .149 | 7 |
| Stiffness | −.572 | 7 | .720 | 2 | −.389 | 9 |
| Frequent mood change | −.780 | 8 | .574 | 5 | .912 | 3 |
| Sleep/urinary cluster | ||||||
| Sleep disturbance | 1.508 | 1 | .715 | 3 | .496 | 5 |
| Getting up from sleep to urinate | −1.196 | 9 | −.259 | 9 | −1.133 | 11 |
| Vasomotor cluster | ||||||
| Night sweat | 1.300 | 2 | .139 | 8 | 1.169 | 2 |
| Hot flash | .884 | 3 | .280 | 7 | .560 | 4 |
| Cold sweat | −1.196 | 9 | −.445 | 10 | −.137 | 8 |
| Sexual/genital cluster | ||||||
| Vaginal dryness | .884 | 3 | −.641 | 11 | −1.086 | 10 |
| Sexual disturbance | −1.196 | 9 | −2.788 | 12 | −1.986 | 12 |
Symptom Clusters and Key Symptoms (Symptom Severity)
Three symptom clusters were identified for midlife peri-menopausal and post-menopausal women with metabolic syndrome; four symptom clusters were identified for midlife menopausal, peri-menopausal, and post-menopausal without metabolic syndrome (Figure 2).
Figure 2.

Symptom cluster and key symptom for symptom severity dimension
(A) Metabolic syndrome group. Green indicates psychological/somatic/sexual cluster which includes anxiety (an_), depression (cs_), frequent mood change (md_), forgetfulness (fr_), stiffness or soreness in joint, neck, or shoulder (st_), and sexual disturbance (sx_). Yellow indicates vasomotor/genital cluster that includes hot flash (ht_), night sweat (nt_), cold sweat (cl_), and vaginal dryness (vg_). Orange indicates sleep/urinary cluster which includes sleep disturbance (sl_) and getting up to urinate (gt_).
(B) Without metabolic syndrome group. Green indicates psychological/somatic cluster which includes anxiety (an_), depression (cs_), frequent mood change (md_), forgetfulness (fr_), and stiffness or soreness in joint, neck, or shoulder (st_). Yellow indicates vasomotor cluster that includes hot flash (ht_), night sweat (nt_), and cold sweat (cl_). Orange indicates sleep/urinary cluster which includes sleep disturbance (sl_) and getting up to urinate (gt_). Blue indicates sexual/genital cluster that includes sexual disturbance (sx_) and vaginal dryness (vg_).
*Yellow circle indicates key symptom in each symptom cluster
Midlife Peri-Menopausal and Post-Menopausal Women with Metabolic Syndrome
The three symptom clusters were psychological/somatic/sexual, sleep/urinary, and vasomotor/genital. The psychological/somatic/sexual cluster (green) included anxiety, depression, frequent mood change, forgetfulness, stiffness or soreness in joints, neck, or shoulder, and sexual disturbance. The sleep/urinary cluster (orange) had sleep disturbance and getting up from sleep to urinate. The vasomotor/genital cluster (yellow) consisted of cold sweat, night sweat, hot flashes, and vaginal dryness. Anxiety had the highest betweenness (2.164), closeness (.835), and strength value (1.129) in the psychological/somatic/sexual cluster. Sleep disturbance had the highest betweenness (.194), closeness (−.054), and strength value (−.113) in the sleep/urinary cluster. Night sweat had the highest betweenness (.552), closeness (.354), and strength value (.542) in the vasomotor/genital cluster. Therefore, the key psychological/somatic/sexual cluster symptoms were anxiety, sleep disturbance for the sleep/urinary cluster, and night sweat for the vasomotor/genital cluster (Table 2).
Midlife Peri-Menopausal and Post-Menopausal Women Without Metabolic Syndrome
Midlife peri-menopausal and post-menopausal women without metabolic syndrome experienced an additional symptom cluster, resulting in four symptom clusters: psychological/somatic, sleep/urinary, vasomotor, and sexual/genital. The psychological/somatic cluster (green) consisted of primarily psychological symptoms such as anxiety, depression, frequent mood change, forgetfulness with one somatic symptom of stiffness or soreness in joints, neck, or shoulder. The sleep/urinary cluster (orange) consisted of sleep disturbance and getting up to urinate. The vasomotor cluster (yellow) included hot flashes, night sweat, and cold sweat. The last symptom cluster was the sexual/genital cluster (blue) which had sexual disturbance and vaginal dryness. Anxiety was the key symptom for the psychological/somatic cluster with the third-highest betweenness (−.156) and highest closeness (.750) and strength value (1.270), sleep disturbance for sleep/urinary cluster with highest betweenness (1.508), closeness (.715), and strength value (.496), night sweat for the vasomotor cluster with highest betweenness (1.300) and strength (1.169) and second-highest closeness value (.139), and vaginal dryness for the sexual/genital cluster with the highest betweenness (.884), closeness (−.641), and strength value (−1.086; Table 3).
Discussion
We found that the relationship among symptoms is different for midlife peri-menopausal and post-menopausal women with and without metabolic syndrome through the visualization of network structure. In addition, the number and type of symptom clusters were different for the two groups, which is consistent with previous research (Min et al., 2021). For both groups, sexual disturbance was an isolated symptom that did not belong to any symptom cluster in the symptom occurrence dimension. Sexual disturbance is one of the most commonly reported symptoms in midlife peri-menopausal and post-menopausal women with and without metabolic syndrome (Martelli et al., 2012). Previous research has reported that psychological symptoms such as depression and anxiety can decrease sexual desire (Althof & Needle, 2013). Another study of post-menopausal women has found that sleep disturbance is associated with decreased sexual function (Kling et al., 2017). As a result, our study findings contradict current evidence as sexual disturbance did not belong to any symptom cluster in the symptom occurrence dimension for both groups. To date, limited research focuses on exploring symptoms in midlife menopausal women with metabolic syndrome and assumes that their symptom experience is similar to midlife menopausal women without metabolic syndrome. However, our study found that these two groups have different symptom cluster experiences, which may be due to different demographic and clinical characteristics or the presence of metabolic syndrome, which may generate or worsen symptoms. For example, differences in age and stages of reproductive aging have led to differences in symptom clusters among midlife women (Harlow et al., 2017). In addition, metabolic syndrome has been associated with abnormal brain lipid metabolism, oxidative stress, and neuroinflammation, all of which may exacerbate an individual’s cognitive function in multiple domains such as memory and executive functioning (Guicciardi et al., 2019). As a result, clinicians should first understand the different symptom cluster experience between midlife peri-menopausal and post-menopausal women with and without metabolic syndrome and the additional influence of metabolic syndrome on their symptom cluster experience. With this new knowledge, clinicians need to take a more targeted approach in symptom assessment and management for midlife peri-menopausal and post-menopausal women with metabolic syndrome because they are more likely to experience significant burden.
With and without metabolic syndrome, midlife peri-menopausal and post-menopausal women with and without metabolic syndrome experienced different numbers and types of symptom clusters. Three symptom clusters were identified for midlife peri-menopausal and post-menopausal women with metabolic syndrome and four symptom clusters for midlife peri-menopausal and post-menopausal women without metabolic syndrome in the symptom severity dimension. In contrast, previous studies have found six different latent classes ranging from highly symptomatic to relatively asymptomatic (Harlow et al., 2017). Such additional findings may be due to different inclusion criteria of the participants as well as the type of analytic method used. For example, Harlow et al. (2017) included pre-, peri-, and post-menopausal women and did not consider the clinical diagnosis of metabolic syndrome. In addition, latent transition analysis was conducted, which is a person-centered approach using longitudinal data that identify latent classes of people with similar profiles of symptoms and examines changes in class membership over time (Harlow et al., 2017). In contrast, network analysis is a variable-centered approach using cross-sectional data that provides a graphic visualization of the complex network structure among symptoms and uses a random walk to find clusters in a network (Papachristou et al., 2019). As such, a different analytic method may lead to other symptom clustering findings.
To date, symptom cluster research has identified distinct symptom clusters such as psychological symptom and somatic symptom (Almutary et al., 2016). However, our study has identified mixed symptom clusters such as the psychological/somatic/sexual and sleep/urinary. This supports the high correlation and complex relationship among the symptoms in midlife peri-menopausal and post-menopausal women with and without metabolic syndrome (Miaskowski et al., 2004; Min et al., 2021). When comparing two groups, midlife peri-menopausal and post-menopausal women with metabolic syndrome are more likely to suffer from a more complex array of symptom clusters because they experience symptoms associated with menopause and metabolic syndrome concurrently. Therefore, it is important to identify the subgroup of midlife peri-menopausal and post-menopausal women with metabolic syndrome who are at high risk for greater symptom burden using the identified symptom clusters and their associated characteristics. Such understanding will allow clinicians to take a timely and personalized symptom management approach.
By ranking centrality indices, key symptoms were identified for each symptom cluster. The key symptoms for midlife peri-menopausal and post-menopausal women without metabolic syndrome were similar across both symptom dimensions. However, only one common key symptom was the sleep disturbance across both symptom dimensions for midlife peri-menopausal and post-menopausal women with metabolic syndrome. Previous research has focused on the prevalence and severity of individual symptoms experienced by midlife peri-menopausal and post-menopausal women with metabolic syndrome (Lee et al., 2012). As a result, there have been significant challenges in managing these individual symptoms simultaneously. It is imperative to understand different key symptoms that derive the overall symptom experience. These key symptoms may serve as potential targets for future targeted symptom management interventions that better reduce their symptom burden and enhance health-related quality of life (Miaskowski, 2016; Papachristou et al., 2019).
Limitations
Our study has several limitations to consider. First, this is an exploratory study using network analysis and the Walktrap algorithm to understand the relationship among symptoms and identify symptom clusters and key symptoms in midlife peri-menopausal and post-menopausal women with and without metabolic syndrome. Future studies should replicate network analysis and the Walktrap algorithm in a different sample and compare the study findings. Second, the number and types of symptom clusters may vary according to age and stages of reproductive aging in midlife women with and without metabolic syndrome. Future work needs to address the differences in age and reproductive aging stages and examine how the symptom cluster experience may vary based on each stage. Third, only two symptom dimensions were used for the current study, and thus other symptom dimensions (i.e., frequency) should be considered. Fourth, we used cross-sectional data to conduct the data analysis. The relationship among symptoms, clusters, and key symptoms is likely to change over time as midlife women age or transition into another reproductive staging. Future studies should be conducted using longitudinal data to study symptom clusters and understand their temporal patterns over time.
Conclusion
Midlife peri-menopausal and post-menopausal women with and without metabolic syndrome experienced different numbers and types of symptom clusters across symptom occurrence and symptom severity dimensions. Future studies should identify the high-risk subgroup at greater symptom burden or impaired health-related quality of life using the identified symptom clusters.
Acknowledgement:
Research reported in this publication was supported by the National Institute of Nursing Research of the National Institutes of Health under Award Number 1F31NR019921-01. The content is solely the responsibility of the authors and does not necessarily represent the official views of the National Institutes of Health.
Footnotes
The authors have no conflicts of interest to report.
Ethical Conduct of Research: This study was approved by Duke university human subjects ethical review board [Pro00106232].
Contributor Information
Se Hee Min, Duke University, School of Nursing, Durham, NC, USA.
Qing Yang, Duke University, School of Nursing, Durham, NC, USA.
Sharron L. Docherty, Duke University, School of Nursing, Durham, NC, USA.
Eun-Ok Im, Emory University, School of Nursing, Atlanta, GA, USA.
Xiao Hu, Duke University, School of Nursing, Durham, NC, USA.
References
- Albusoul RM, Berger AM, Gay CL, Janson SL, & Lee KA (2017). Symptom clusters change over time in women receiving adjuvant chemotherapy for breast cancer. Journal of Pain and Symptom Management, 53(5), 880–886. 10.1016/j.jpainsymman.2016.12.332 [DOI] [PMC free article] [PubMed] [Google Scholar]
- Almutary H, Douglas C, & Bonner A (2016). Multidimensional symptom clusters: An exploratory factor analysis in advanced chronic kidney disease. Journal of Advanced Nursing, 72(10), 2389–2400. 10.1111/jan.12997 [DOI] [PubMed] [Google Scholar]
- Althof SE, & Needle RB (2013). Psychological and interpersonal dimensions of sexual function and dysfunction in women: An update. Arab Journal of Urology, 11(3), 299–304. 10.1016/j.aju.2013.04.010 [DOI] [PMC free article] [PubMed] [Google Scholar]
- Bentley-Lewis R, Koruda K, & Seely EW (2007). The metabolic syndrome in women. Nature Clinical Practice. Endocrinology & Metabolism, 3(10), 696–704. 10.1038/ncpendmet0616 [DOI] [PMC free article] [PubMed] [Google Scholar]
- Borgatti SP (2005). Centrality and network flow. Social Networks, 27(1), 55–71. 10.1016/j.socnet.2004.11.008 [DOI] [Google Scholar]
- Bromberger JT, Kravitz HM, Chang Y, Randolph JF, Avis NE, Gold EB, & Matthews KA (2013). Does risk for anxiety increase during the menopausal transition? Study of Women’s Health Across the Nation (SWAN). Menopause (New York, N.Y.), 20(5), 488–495. 10.1097/GME.0b013e3182730599 [DOI] [PMC free article] [PubMed] [Google Scholar]
- Bromberger JT, Kravitz HM, Chang Y-F, Cyranowski JM, Brown C, & Matthews KA (2011). Major depression during and after the menopausal transition: Study of Women’s Health Across the Nation (SWAN). Psychological Medicine, 41(9), 1879–1888. 10.1017/S003329171100016X [DOI] [PMC free article] [PubMed] [Google Scholar]
- Bruce D, & Rymer J (2009). Symptoms of the menopause. Best Practice & Research. Clinical Obstetrics & Gynaecology, 23(1), 25–32. 10.1016/j.bpobgyn.2008.10.002 [DOI] [PubMed] [Google Scholar]
- Christian C, Perko VL, Vanzhula IA, Tregarthen JP, Forbush KT, & Levinson CA (2020). Eating disorder core symptoms and symptom pathways across developmental stages: A network analysis. Journal of Abnormal Psychology, 129(2), 177–190. 10.1037/abn0000477 [DOI] [PubMed] [Google Scholar]
- Cosco TD, Prina M, Stubbs B, & Wu Y-T (2017). Reliability and validity of the Center for Epidemiologic Studies Depression Scale in a population-based cohort of middle-aged U.S. adults. Journal of Nursing Measurement, 25(3), 476–485. 10.1891/1061-3749.25.3.476 [DOI] [PubMed] [Google Scholar]
- Dalege J, Borsboom D, van Harreveld F, & van der Maas HLJ (2017). Network analysis on attitudes: A brief tutorial. Social Psychological and Personality Science, 8(5), 528–537. 10.1177/1948550617709827 [DOI] [PMC free article] [PubMed] [Google Scholar]
- Dutra da Silva GM, Rolim Rosa Lima SM, Reis BF, Macruz CF, & Postigo S (2020). Prevalence of hypoactive sexual desire disorder among sexually active postmenopausal women with metabolic syndrome at a public hospital clinic in Brazil: A Cross-sectional study. Sexual Medicine, 8(3), 545–553. 10.1016/j.esxm.2020.05.008 [DOI] [PMC free article] [PubMed] [Google Scholar]
- Epskamp S, Borsboom D, & Fried EI (2018). Estimating psychological networks and their accuracy: A tutorial paper. Behavior Research Methods, 50(1), 195–212. 10.3758/s13428-017-0862-1 [DOI] [PMC free article] [PubMed] [Google Scholar]
- Guicciardi M, Crisafulli A, Doneddu A, Fadda D, & Lecis R (2019). Effects of metabolic syndrome on cognitive performance of adults during exercise. Frontiers in Psychology, 10. 10.3389/fpsyg.2019.01845 [DOI] [PMC free article] [PubMed] [Google Scholar]
- Hall MH, Okun ML, Sowers M, Matthews KA, Kravitz HM, Hardin K, Buysse DJ, Bromberger JT, Owens JF, Karpov I, & Sanders MH (2012a). Sleep is associated with the metabolic syndrome in a multi-ethnic cohort of midlife women: The SWAN Sleep Study. Sleep, 35(6), 783–790. 10.5665/sleep.1874 [DOI] [PMC free article] [PubMed] [Google Scholar]
- Hall MH, Okun ML, Sowers M, Matthews KA, Kravitz HM, Hardin K, Buysse DJ, Bromberger JT, Owens JF, Karpov I, & Sanders MH (2012b). Sleep is associated with the metabolic syndrome in a multi-ethnic cohort of midlife women: The SWAN Sleep Study. Sleep, 35(6), 783–790. 10.5665/sleep.1874 [DOI] [PMC free article] [PubMed] [Google Scholar]
- Harlow SD, & Derby CA (2015). Women’s Midlife Health: Why the Midlife Matters. Women’s Midlife Health, 1. 10.1186/s40695-015-0006-7 [DOI] [PMC free article] [PubMed] [Google Scholar]
- Harlow SD, Karvonen-Gutierrez C, Elliott MR, Bondarenko I, Avis NE, Bromberger JT, Brooks MM, Miller JM, & Reed BD (2017). It is not just menopause: Symptom clustering in the Study of Women’s Health Across the Nation. Women’s Midlife Health, 3(1), 2. 10.1186/s40695-017-0021-y [DOI] [PMC free article] [PubMed] [Google Scholar]
- Heinemann K, Ruebig A, Potthoff P, Schneider HP, Strelow F, Heinemann LA, & Thai DM (2004). The Menopause Rating Scale (MRS) scale: A methodological review. Health and Quality of Life Outcomes, 2(1), 45. 10.1186/1477-7525-2-45 [DOI] [PMC free article] [PubMed] [Google Scholar]
- Hevey D (2018). Network analysis: A brief overview and tutorial. Health Psychology and Behavioral Medicine, 6(1), 301–328. 10.1080/21642850.2018.1521283 [DOI] [PMC free article] [PubMed] [Google Scholar]
- Huang PL (2009). A comprehensive definition for metabolic syndrome. Disease Models & Mechanisms, 2(5–6), 231–237. 10.1242/dmm.001180 [DOI] [PMC free article] [PubMed] [Google Scholar]
- Jones HJ, Minarik PA, Gilliss CL, & Lee KA (2020). Depressive symptoms associated with physical health problems in midlife women: A longitudinal study. Journal of Affective Disorders, 263, 301–309. 10.1016/j.jad.2019.11.166 [DOI] [PMC free article] [PubMed] [Google Scholar]
- Kazlauskaite R, Janssen I, Wilson RS, Appelhans BM, Evans DA, Arvanitakis Z, El Khoudary SR, & Kravitz HM (2020). Is midlife metabolic syndrome associated with cognitive function change? The Study of Women’s Health Across the Nation. The Journal of Clinical Endocrinology and Metabolism, 105(4). 10.1210/clinem/dgaa067 [DOI] [PMC free article] [PubMed] [Google Scholar]
- Kling JM, Manson JE, Naughton MJ, Temkit M, Sullivan SD, Gower EW, Hale L, Weitlauf JC, Nowakowski S, & Crandall CJ (2017). Association of sleep disturbance and sexual function in postmenopausal women. Menopause (New York, N.Y.), 24(6), 604–612. 10.1097/GME.0000000000000824 [DOI] [PMC free article] [PubMed] [Google Scholar]
- Kravitz HM, Schott LL, Joffe H, Cyranowski JM, & Bromberger JT (2014). Do anxiety symptoms predict major depressive disorder in midlife women? The Study of Women’s Health Across the Nation (SWAN) Mental Health Study (MHS). Psychological Medicine, 44(12), 2593–2602. 10.1017/S0033291714000075 [DOI] [PMC free article] [PubMed] [Google Scholar]
- Lee SW, Jo HH, Kim MR, Kwon DJ, You YO, & Kim JH (2012). Association between menopausal symptoms and metabolic syndrome in postmenopausal women. Archives of Gynecology and Obstetrics, 285(2), 541–548. 10.1007/s00404-011-2016-5 [DOI] [PubMed] [Google Scholar]
- Llaneza P, González C, Fernandez-Iñarrea J, Alonso A, Arnott I, & Ferrer-Barriendos J (2009). Insulin resistence and health-related quality of life in postmenopausal women. Fertility and Sterility, 91(4), 1370–1373. 10.1016/j.fertnstert.2008.04.031 [DOI] [PubMed] [Google Scholar]
- de Marchi R, Dell’Agnolo CM, Lopes TCR, Gravena AAF, de O. Demitto M, Brischiliari SCR, Borghesan DHP, de B. Carvalho MD, Pelloso SM, de Marchi R, Dell’Agnolo CM, Lopes TCR, Gravena AAF, de O. Demitto M, Brischiliari SCR, Borghesan DHP, de B. Carvalho MD, & Pelloso SM (2017). Prevalence of metabolic syndrome in pre- and postmenopausal women. Archives of Endocrinology and Metabolism, 61(2), 160–166. 10.1590/2359-3997000000253 [DOI] [PMC free article] [PubMed] [Google Scholar]
- Martelli V, Valisella S, Moscatiello S, Matteucci C, Lantadilla C, Costantino A, Pelusi G, Marchesini G, & Meriggiola MC (2012). Prevalence of sexual dysfunction among postmenopausal women with and without metabolic syndrome. The Journal of Sexual Medicine, 9(2), 434–441. 10.1111/j.1743-6109.2011.02517.x [DOI] [PubMed] [Google Scholar]
- Miaskowski C (2016). Future directions in symptom cluster research. Seminars in Oncology Nursing, 32(4), 405–415. 10.1016/j.soncn.2016.08.006 [DOI] [PubMed] [Google Scholar]
- Miaskowski C, Barsevick A, Berger A, Casagrande R, Grady PA, Jacobsen P, Kutner J, Patrick D, Zimmerman L, Xiao C, Matocha M, & Marden S (2017). Advancing symptom science through symptom cluster research: Expert panel proceedings and recommendations. Journal of the National Cancer Institute, 109(4). 10.1093/jnci/djw253 [DOI] [PMC free article] [PubMed] [Google Scholar]
- Miaskowski C, Dodd M, & Lee K (2004). Symptom clusters: The new frontier in symptom management research. Journal of the National Cancer Institute. Monographs, 32, 17–21. 10.1093/jncimonographs/lgh023 [DOI] [PubMed] [Google Scholar]
- Min SH, Docherty SL, Im E-O, & Yang Q (2021). Identification of symptom clusters among midlife menopausal women with metabolic syndrome. Western Journal of Nursing Research, 01939459211018824. 10.1177/01939459211018824 [DOI] [PubMed] [Google Scholar]
- Mulhall S, Andel R, & Anstey KJ (2018). Variation in symptoms of depression and anxiety in midlife women by menopausal status. Maturitas, 108, 7–12. 10.1016/j.maturitas.2017.11.005 [DOI] [PubMed] [Google Scholar]
- Nelson HD, Haney E, Humphrey L, Miller J, Nedrow A, Nicolaidis C, Vesco K, Walker M, Bougatsos C, & Nygren P (2005). Management of menopause‐related symptoms: Summary. In AHRQ Evidence Report Summaries. Agency for Healthcare Research and Quality; (US: ). https://www.ncbi.nlm.nih.gov/books/NBK11956/ [PMC free article] [PubMed] [Google Scholar]
- Papachristou N, Barnaghi P, Cooper B, Kober KM, Maguire R, Paul SM, Hammer M, Wright F, Armes J, Furlong EP, McCann L, Conley YP, Patiraki E, Katsaragakis S, Levine JD, & Miaskowski C (2019). Network analysis of the Multidimensional Symptom Experience of Oncology. Scientific Reports, 9(1), 2258. 10.1038/s41598-018-36973-1 [DOI] [PMC free article] [PubMed] [Google Scholar]
- Rochlani Y, Pothineni NV, Kovelamudi S, & Mehta JL (2017). Metabolic syndrome: Pathophysiology, management, and modulation by natural compounds. Therapeutic Advances in Cardiovascular Disease, 11(8), 215–225. 10.1177/1753944717711379 [DOI] [PMC free article] [PubMed] [Google Scholar]
- Roohafza H, Sadeghi M, Talaei M, Pourmoghaddas Z, & Sarrafzadegan N (2012). Psychological status and quality of life in relation to the metabolic syndrome: Isfahan Cohort Study. International Journal of Endocrinology, 2012, 1–5. 10.1155/2012/380902 [DOI] [PMC free article] [PubMed] [Google Scholar]
- Saklayen MG (2018). The global epidemic of the metabolic syndrome. Current Hypertension Reports, 20(2). 10.1007/s11906-018-0812-z [DOI] [PMC free article] [PubMed] [Google Scholar]
- Santoro N, & Randolph JF (2011). Reproductive hormones and the menopause transition. Obstetrics and Gynecology Clinics of North America, 38(3), 455–466. 10.1016/j.ogc.2011.05.004 [DOI] [PMC free article] [PubMed] [Google Scholar]
- Saramaki J, Kivela M, Onnela J-P, Kaski K, & Kertesz J (2007). Generalizations of the clustering coefficient to weighted complex networks. Physical Review E, 75(2), 027105. 10.1103/PhysRevE.75.027105 [DOI] [PubMed] [Google Scholar]
- Shoelson SE, Herrero L, & Naaz A (2007). Obesity, inflammation, and insulin resistance. Gastroenterology, 132(6), 2169–2180. 10.1053/j.gastro.2007.03.059 [DOI] [PubMed] [Google Scholar]
- Torréns JI, Sutton-Tyrrell K, Zhao X, Matthews K, Brockwell S, Sowers M, & Santoro N (2009). Relative androgen excess during the menopausal transition predicts incident metabolic syndrome in mid-life women: SWAN. Menopause (New York, N.Y.), 16(2), 257–264. 10.1097/gme.0b013e318185e249 [DOI] [PMC free article] [PubMed] [Google Scholar]
- Trompeter SE, Bettencourt R, & Barrett-Connor E (2016). Metabolic syndrome and sexual function in postmenopausal women. The American Journal of Medicine, 129(12), 1270–1277.e1. 10.1016/j.amjmed.2016.03.039 [DOI] [PMC free article] [PubMed] [Google Scholar]
- van Borkulo CD, Borsboom D, Epskamp S, Blanken TF, Boschloo L, Schoevers RA, & Waldorp LJ (2015). A new method for constructing networks from binary data. Scientific Reports, 4(1), 5918. 10.1038/srep05918 [DOI] [PMC free article] [PubMed] [Google Scholar]
- Watts DJ, & Strogatz SH (1998). Collective dynamics of ‘small-world’ networks. Nature, 393(6684), 440–442. 10.1038/30918 [DOI] [PubMed] [Google Scholar]
- Yim G, Ahn Y, Chang Y, Ryu S, Lim J-Y, Kang D, Choi E-K, Ahn J, Choi Y, Cho J, & Park H-Y (2015). Prevalence and severity of menopause symptoms and associated factors across menopause status in Korean women. Menopause, 22(10), 1108–1116. 10.1097/GME.0000000000000438 [DOI] [PubMed] [Google Scholar]
- Zimmet P, Magliano D, Matsuzawa Y, Alberti G, & Shaw J (2005). The metabolic syndrome: A global public health problem and a new definition. Journal of Atherosclerosis and Thrombosis, 12(6), 295–300. 10.5551/jat.12.295 [DOI] [PubMed] [Google Scholar]