Loganathan et al. report a role for the transcriptional regulation of embryonic cell growth during Drosophila tubulogenesis. Ribbon, a BTB/POZ nuclear protein, mediates salivary gland cell growth by boosting transcription of the entire ribosomal protein gene repertoire and mediates tracheal cell growth through other targets.
Abstract
Cell growth is well defined for late (postembryonic) stages of development, but evidence for early (embryonic) cell growth during postmitotic morphogenesis is limited. Here, we report early cell growth as a key characteristic of tubulogenesis in the Drosophila embryonic salivary gland (SG) and trachea. A BTB/POZ domain nuclear factor, Ribbon (Rib), mediates this early cell growth. Rib binds the transcription start site of nearly every SG-expressed ribosomal protein gene (RPG) and is required for full expression of all RPGs tested. Rib binding to RPG promoters in vitro is weak and not sequence specific, suggesting that specificity is achieved through cofactor interactions. Accordingly, we demonstrate Rib’s ability to physically interact with each of the three known regulators of RPG transcription. Surprisingly, Rib-dependent early cell growth in another tubular organ, the embryonic trachea, is not mediated by direct RPG transcription. These findings support a model of early cell growth customized by transcriptional regulatory networks to coordinate organ form and function.
Introduction
Epithelial tubes are vital to metazoan physiological processes, e.g., fluid secretion, storage, absorption, exchange, and transport. They originate from all three germ layers and have both branched and unbranched architectures. Molecular and cellular mechanisms of tubulogenesis are conserved but are also adapted to organ-specific functional requirements (Chen et al., 2018). Thus morphogenetic programs may use both shared and tissue-specific mechanisms in making and shaping tubes.
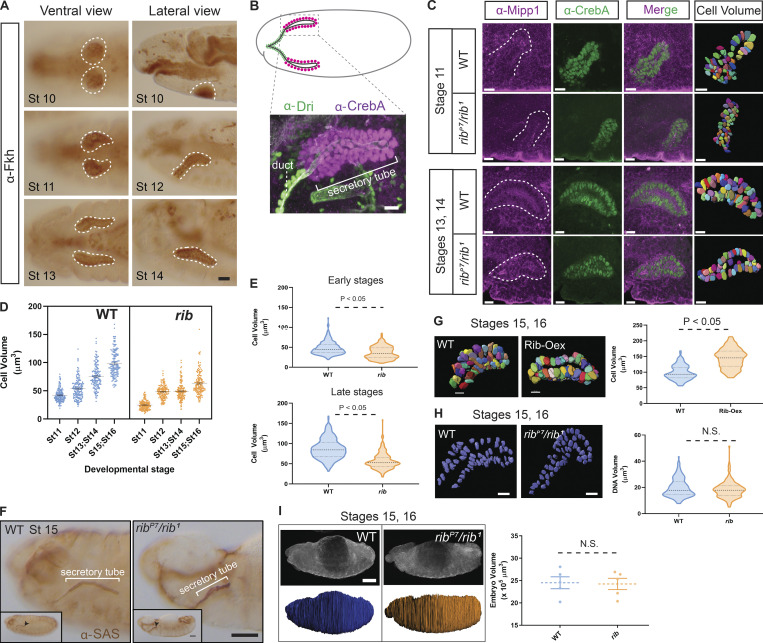
The Drosophila embryonic salivary gland (SG) offers unique advantages in both genetic manipulability and relative simplicity of access for morphological and molecular-level characterizations of epithelial tubulogenesis (Chung et al., 2014; Sidor and Röper, 2016). SG morphogenesis is postmitotic and nonapoptotic (Campos-Ortega and Hartenstein, 1997; Poulson, 1937; Poulson, 1950), serving as an ideal system to investigate tubulogenesis by changes in cell position, shape, or size. SGs are first visible during embryonic stage 10 as two epithelial placodes on either side of the midline on the ventral surface of parasegment 2 (Fig. 1 A). Assembly begins with the sequential invagination of cells to form a nascent tube at stage 11 (Booth et al., 2014; Chung et al., 2017; Myat and Andrew, 2000b). Tube maturation is marked by elongation via oriented apical membrane expansion and cell rearrangement (Sanchez-Corrales et al., 2018; Xu et al., 2011), with concomitant organ positioning by integrin-dependent collective cell migration beginning at stage 12 and continuing through stage 16 (Bradley et al., 2003). The mature SG contains a pair of unbranched secretory tubes (Fig. 1 B).
Figure 1.
Rib is required for cell growth in the embryonic SG. (A) SG tube morphology at distinct embryonic stages. Placode cells (stage 10) internalize to form an incipient tube (stage 11). Elongation and posterior turning (stage 12) positions the tube along the anteroposterior axis as the cells collectively migrate during tube maturation (stages 13 and 14). Scale bar: 10 µm. (B) The bilateral secretory tubes (magenta nuclei) of the late embryonic SG connect with each other and to the digestive tract via the ducts (green nuclei). Scale bar: 5 µm. (C) SG cell volumetry of embryos stained with α-Mipp1 (magenta, cell boundaries) and α-CrebA (green, nuclei) in WT and rib mutants. Scale bars: 10 µm. (D) rib SG cells are smaller than WT at all embryonic stages. Quantitative analysis of stage-wise cell volumetric data (mean with SEM) from a total of 1,200 3D-rendered cells. n = 150 cells from three embryos of each genotype at each stage. WT: stage 11, 42.13 ± 0.93 µm3 (mean ± SEM); stage 12, 53.81 ± 1.46 µm3; stage 13/14, 75.39 ± 1.73 µm3; and stage 15/16, 98.44 ± 1.86 µm3. rib null: stage 11, 24.73 ± 0.65 µm3; stage 12, 48.43 ± 0.95 µm3; stage 13/14, 49.33 ± 1.29 µm3; and stage 15/16, 63.05 ± 1.63 µm3. P < 0.05; two-tailed unpaired t test for each stage-wise comparison. (E) WT and rib mutant SG cell volumes differ during early stages of tubulogenesis (top: stage 11–12), when glands are internalizing (P < 0.05; two-tailed unpaired t test; median and quartiles) and during late stages of tubulogenesis (bottom: stages 13–16), after internalization (P < 0.05; two-tailed unpaired t test; median and quartiles). (F) rib mutant SGs fail to fully elongate. α-SAS staining of the luminal membrane (arrowhead) reveals that rib mutant SGs are shorter than WT. >50 WT and rib null embryos were examined and images were captured for ∼10 samples of each. Scale bars: 50 µm. (G) Rib-overexpressing (Oex) SG cells (fkh-GAL4 > UAS-rib) are larger than WT. Left: 3D rendering of SG cells showed ∼46% volume increase in Rib-Oex. A total of 300 cells were 3D rendered, n = 150 from three late-stage (15–16) embryos of each genotype. Scale bars: 10 µm. Right: Quantitative analysis of cell volume in WT and Rib-Oex glands (two-tailed, unpaired t test; median and quartiles). (H) SG nuclear DNA volume is unaffected by rib loss. Left: 3D rendering of DAPI staining showed no difference in nuclear DNA volume between WT and rib mutant SGs. A total of 300 nuclei were 3D rendered, n = 150 from three late-stage (15–16) embryos of each genotype. Scale bars: 10 µm. Right: Quantitative analysis of DNA volume in WT and rib mutants (two-tailed, unpaired t test; median and quartiles). (I) Whole embryo volume is unchanged in rib mutants. Left: 3D rendering of whole embryos. Scale bar: 50 µm. Right: Quantitative analysis of embryonic volume showed no difference in mean volume of rib mutants versus WT (n = 5 embryos/group; two-tailed, unpaired t test; mean with SEM).
SGs are specified by the Hox protein Sex combs reduced (Scr; Andrew et al., 1994; Panzer et al., 1992), working with Extradenticle (Exd) and Homothorax (Hth; Henderson and Andrew, 2000). Scr, Exd, and Hth activate a core set of transcription factors—Fork head (Fkh), Salivary gland-expressed bHLH (Sage), cAMP response element binding protein A (CrebA), Senseless (Sens), and Huckebein (Hkb)—the actions of which regulate diverse cell physiological processes during SG tubulogenesis, while maintaining cell fate and priming secretory function (Abrams and Andrew, 2005; Abrams et al., 2006; Fox et al., 2010; Fox et al., 2013; Johnson et al., 2020; Maruyama et al., 2011; Myat and Andrew, 2000a; Myat and Andrew, 2002). A subset of these factors also controls the morphogenetic attributes of the SG tubulogenic program, e.g., cell invagination (Fkh and Hkb) and tube elongation (Hkb; Chung et al., 2017; Myat and Andrew, 2000a; Myat and Andrew, 2000b; Myat and Andrew, 2002).
The role of yet another nuclear factor—Ribbon (Rib)—in the SG morphogenetic program is less well understood (Bradley and Andrew, 2001; Xu et al., 2011). rib encodes a nuclear protein implicated in epithelial cell shape change in several tubular organs, including the embryonic SG, trachea, hindgut, and Malpighian tubules (Bradley and Andrew, 2001; Jack and Myette, 1997; Shim et al., 2001). The most striking loss-of-function rib phenotype in epithelial tissues is incomplete/failed tube elongation. Also, cells lacking Rib function assume a more rounded or cuboidal shape instead of wedge and columnar shapes (Jack and Myette, 1997; Loganathan et al., 2016). In several of these tissues, including the SG, Rib functions tissue autonomously (Bradley and Andrew, 2001; Silva et al., 2016).
Candidate gene–based approaches have identified both cytoskeletal and membrane-localized proteins, including Crumbs (Crb), Rab11, and Moesin (Moe), as mediators of Rib function, suggesting that Rib directs tube elongation by facilitating apical membrane expansion/growth (Kerman et al., 2008). Computational modeling of SG tube elongation confirmed membrane expansion/growth as a critical feature compromised in rib mutants (Cheshire et al., 2008). The tube elongation defect in rib mutant SGs occurs without affecting specification, apicobasal polarity determination, junctional integrity, or cell number. Cell volume at early stages in the rib mutant SG, however, was significantly decreased compared with WT controls (Loganathan et al., 2016). Overall, these prior findings suggest that cell growth may be a fundamental characteristic of Rib-mediated tube elongation.
Importantly, to our knowledge, cell growth as an integral component of embryonic organogenesis has not explicitly been considered. How does Rib affect embryonic SG cell growth? Is there a growth component interwoven into other morphogenetic processes, e.g., cell invagination, apical membrane expansion, and collective cell migration, to facilitate SG tube elongation? To address these questions, we focused on SG-specific transcriptional targets of Rib. We report that Rib binds to and upregulates ribosomal protein genes (RPGs) to drive cell growth (volume gain) as an integral component of embryonic SG morphogenesis. In addition to RPGs, Rib binds chaperones and translation factors required for protein synthesis, suggesting augmented translation capacity as the basis for SG tubulogenic growth—an adaptation that likely facilitates the SG’s function as a dedicated secretory organ. We find that Rib physically interacts with known regulators of RPG transcription to gain context specificity for RPG promoter binding. Finally, we provide evidence that Rib binding to RPGs is specific for tube elongation in the SG but not the trachea (Tr). Collectively, these results identify early cell growth as a potential contributor to tube elongation and suggest its customization by tissue-specific Rib targets.
Results
SG secretory cell growth is through Rib-dependent cytoplasmic volume gain
Loss of rib function results in a significant decrease in embryonic SG tube elongation without affecting secretory cell number, suggesting that Rib is relevant to cell growth in tube elongation independently of cell division or death (Loganathan et al., 2016). Cell volumetric analyses of SGs from early and late stages of tubulogenesis (Fig. 1 C; and Video 1, Video 2, Video 3, and Video 4) revealed that WT SGs undergo a gradual stage-wise increase in mean cell volume, more than doubling over a period of ∼6 h (Fig. 1 D). In contrast, developmental growth of rib mutant SG cells was significantly impaired, with both lower starting cell volumes (when SG cell markers are first discernable) and lower volume gains (Fig. 1 D). By late embryogenesis, rib mutant SG cells show a 36% volume reduction (Fig. 1 E) and a shortened lumen, as the tube fails to fully elongate (Fig. 1 F). SG-specific Rib overexpression, moreover, promoted cell growth by a nearly 46% increase in mean cell volume compared with WT (Fig. 1 G; Video 5 and Video 6).
Video 1.
(Related to Fig. 1.) WT stage 11 volumetric analysis. The 3D geometry of cell shapes from the embryonic SG of WT stage 11.
Video 2.
(Related to Fig. 1.) rib mutant stage 11 volumetric analysis. The 3D geometry of cell shapes from the embryonic SG of ribP7/rib1, stage 11.
Video 3.
(Related to Fig. 1.) WT stage 13/14 volumetric analysis. The 3D geometry of cell shapes from the embryonic SG of WT, stage 13/14.
Video 4.
(Related to Fig. 1.) rib mutant stage 13/14 volumetric analysis. The 3D geometry of cell shapes from the embryonic SG of ribP7/rib1, stage 13/14.
Video 5.
(Related to Fig. 1.) WT stage 15/16 volumetric analysis. The 3D geometry of cell shapes from the embryonic SG of WT, stage 15/16.
Video 6.
(Related to Fig. 1.) Rib overexpression stage 15/16 volumetric analysis. The 3D geometry of cell shapes from the embryonic SG of fkh-GAL4::UAS-rib, stage 15/16.
The cell growth defect observed in rib mutant SGs is not due to impaired DNA amplification, i.e., polytenization, because the mean DNA volume of rib mutant SG cells from stages 15/16—well beyond their first and only embryonic-stage endocycle at stage 12 (Smith and Orr-Weaver, 1991)—was not different from WT (Fig. 1 H). To test if the growth loss in rib mutant SG cells is a co-occurrence or consequence of systemic growth deficiency, we performed volumetric analysis of whole embryos at terminal stages of embryogenesis and found it was no different between WT and rib mutants (Fig. 1 I).
Rib binds ribosomal genes as well as morphogenetic effectors
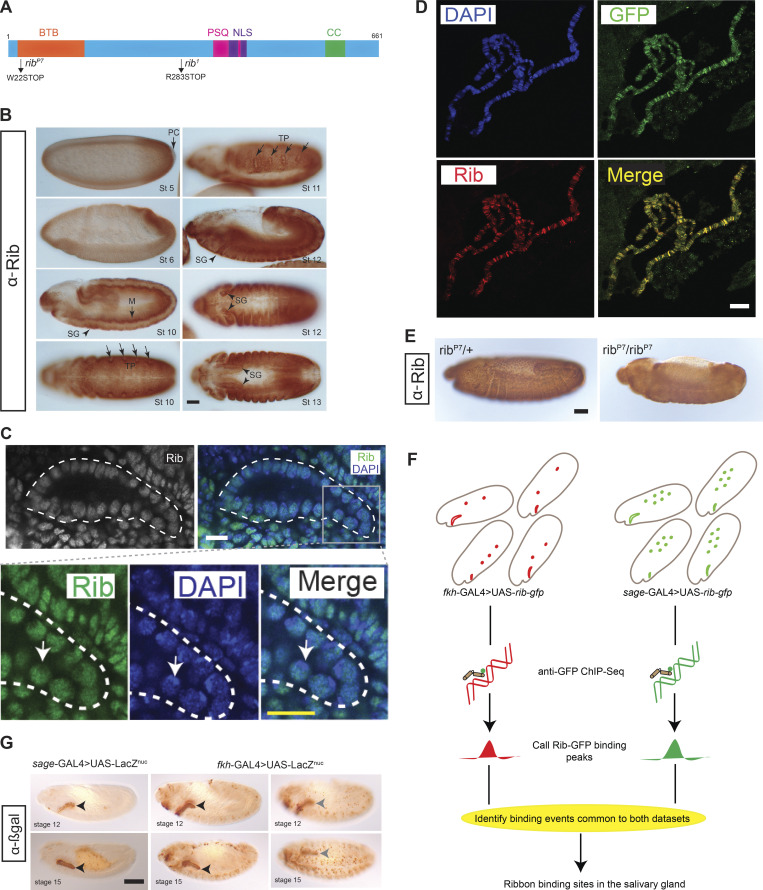
rib encodes a 661-residue protein with two protein–protein interaction domains—an N-terminal BTB domain and a C-terminal coiled-coil domain—and a bipartite nuclear localization sequence partly embedded in a DNA binding domain homologous to the Pipsqueak (PSQ) transcription factor (Fig. 2 A). Rib is dynamically expressed in all three germ layers, with slightly higher levels observed in several epithelial tubular organs, e.g., the SG and trachea, and in the mesoderm (Fig. 2 B). Rib is nuclear but is absent from the DAPI-concentrated regions of the nucleus that correspond to the nucleolus (Fig. 2 C).
Figure 2.
Strategy for identifying transcriptional targets of Rib in the SG. (A) Rib protein diagram with the N-terminal Bric à Brac, Tramtrack, Broad (BTB) domain, the pipsqueak (PSQ) DNA-binding domain, the bipartite nuclear localization sequence (NLS), and a predicted coiled coil (CC) domain. Compound heterozygotes from the null alleles of rib—ribP7 and rib1—were used throughout this study. (B) Rib is broadly expressed during embryogenesis. M, mesoderm; PC, pole cells; TP, tracheal primordia. Scale bar: 50 µm. (C) Rib is nuclear. Top: White outline marks the SG. Bottom: Rib staining is reduced in the DAPI-intense areas (nucleoli; arrow). Scale bar: 10 µm. (D) Rib-GFP, used for tissue-specific ChIP-seq analysis, localizes to SG polytene chromosomes of L3 larvae; note the one-to-one correspondence of bands detected with αGFP and αRib antisera. (Images from sage-GAL4 > UAS-rib-GFP.) Scale bar: 10 µm. (E) Validation of the αRib guinea pig antiserum used for the experiments in Figs. 2 D and 7 B. ribP7 sibling heterozygotes and homozygotes were stained in the same tube to confirm the nuclear localization of Rib antigen in heterozygotes and its loss in homozygotes. Nonspecific background (diffuse, nonnuclear staining) from the HRP reaction with the secondary antibody was observed in all embryos. Scale bar: 50 µm. (F) Strategy for ChIP-seq using fkh-GAL4 or sage-GAL4 to drive UAS-Rib-GFP. Tissue expression patterns of Rib-GFP in fkh-GAL4 > UAS-rib-GFP embryos and sage-GAL4 > UAS-rib-GFP embryos are illustrated in red (SG, hemocytes, and mesoderm) and green (SG and midgut), respectively. The SG is the only tissue with Rib-GFP expression from both the drivers; thus, the intersection of binding peaks from both driver datasets represent high-confidence SG-specific binding. (G) Expression of SG drivers used in the Rib-GFP ChIP-seq are indicated with nuclear βgal during early (stage 12) and late (stage 15) tubulogenesis. For the fkh-GAL4 driver, a different focal plane (right images) captures expression in mesodermally derived cells. Arrowheads mark the SG. Scale bar: 50 µm.
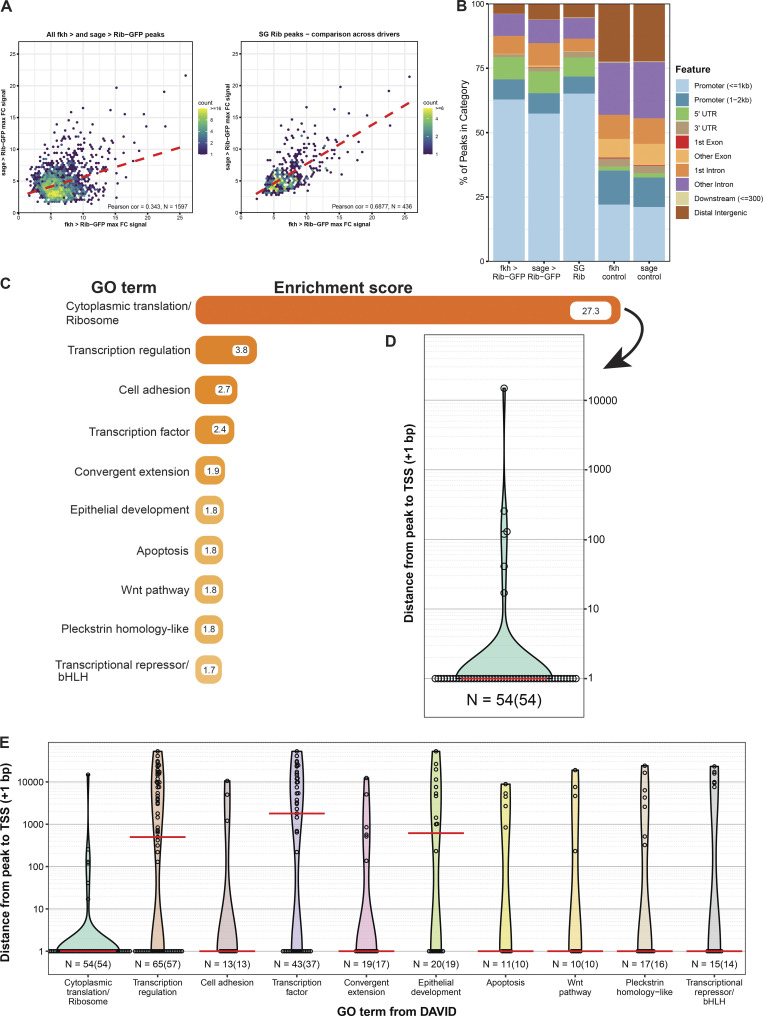
To determine how Rib mediates SG cell growth, we reexamined previously generated SG-specific chromatin immunoprecipitation and deep sequencing (ChIP-seq) data obtained using a functional Rib-GFP that both rescued the tube elongation defect of rib mutants (Loganathan et al., 2016) and localized to distinct SG chromosomal loci recognized by both αGFP and αRib antisera (Fig. 2, D and E). To enrich for SG-specific Rib targets, we used binding data from experiments carried out with two different SG drivers, sage-GAL4 and fkh-GAL4, whose expression domains overlap in only the SG (Fig. 2, F and G). A high-confidence, highly correlated set of 436 SG-specific Rib binding peaks was obtained (Fig. 3 A). Assessment of the global features of Rib binding in the SG showed a high propensity (>60%) for promoter-proximal regions (Fig. 3 B). Application of the Database for Annotation, Visualization and Integrated Discovery (DAVID) gene ontology (GO) program for the 413 genes that correspond to the 436 overlapping SG binding peaks revealed the ribosome as the primary Rib target (Fig. 3, C and D and Table S1), with a nearly sevenfold higher enrichment score compared with the second-ranked target gene cluster (indeed, 12.8% of Rib-bound genes were RPGs). Other top clusters include transcription, cell adhesion, and convergent extension. Taken together, these results are consistent with the purported function of Rib as a mediator of tissue morphogenesis (Bradley and Andrew, 2001; Jack and Myette, 1997; Loganathan et al., 2016). They also suggest a plausible mechanism for Rib’s role as a regulator of SG cell growth: targeting the ribosome and, consequently, cellular translational efficacy, as suggested by similar findings of a causal link between ribosomal transcriptional regulation and cell size in a relatively simple system, Saccharomyces cerevisiae (Jorgensen et al., 2004). Interestingly, most of the top 10 SG target clusters (7/10) featured promoter-proximal binding, with Rib binding at the transcription start site (TSS) for the majority of genes within each of seven clusters (Fig. 3 E).
Figure 3.
Analysis of SG Rib-binding data implicates ribosome/translation. (A) Rib-binding signal enrichment between the GAL4 drivers comparing all overlapping peaks (n = 1,597) from fkh-GAL4 > UAS-rib-GFP and sage-GAL4 > UAS-rib-GFP yields a Pearson correlation coefficient of 0.343 (left). A comparison of peaks after implementation of the IDR pipeline on biological replicas yields high positive correlation (Pearson correlation coefficient = 0.6877): high-confidence Rib-binding to SG targets (n = 436; right). (B) Binding signal feature analysis of individual and combined driver experiments reveals that ∼75% of Rib binding peaks localize within the promoters or 5′ UTRs. Controls indicate expected distribution of binding events if peaks were random with respect to gene elements. (C) Functional clustering of Rib-bound SG genes by GO term from the DAVID analysis. The top 10 GO terms with their associated enrichment scores are shown. The top category represents binding of Rib to RPGs with a nearly sevenfold greater enrichment than the next-ranked category. See Table S1 for metadata. (D) Rib binds to the TSS of RPGs. Open circles indicate the distance between the Rib binding peak and the TSS (+1 bp) for individual genes. Red line indicates the median distance from the peak to TSS. (E) Enrichment of TSS-proximal Rib binding across the top 10 functional classes. Including the ribosome, 7 of the top 10 enriched GO classes primarily show Rib binding to the TSS. Open circles indicate the distance between the Rib binding peak and the TSS for individual genes. Red lines indicate the median distance from the peak to TSS. n = number of peaks versus (number of genes).
Rib binds the TSS of RPGs for their regulation
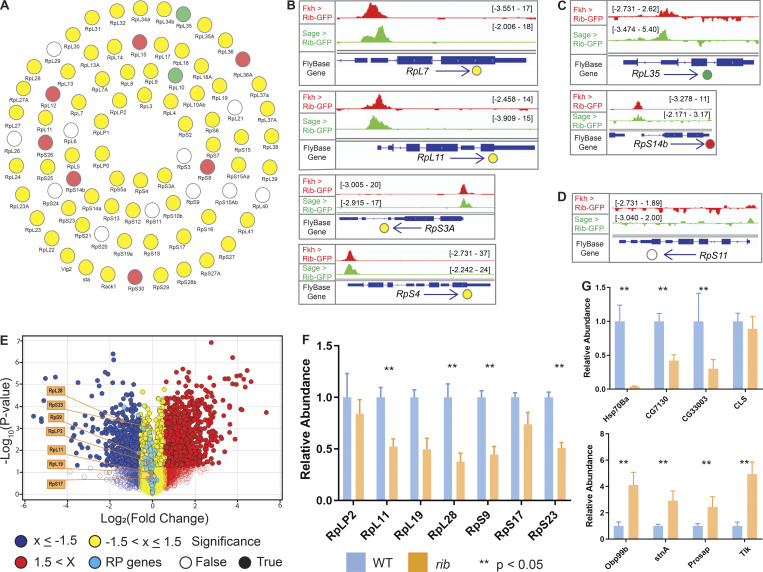
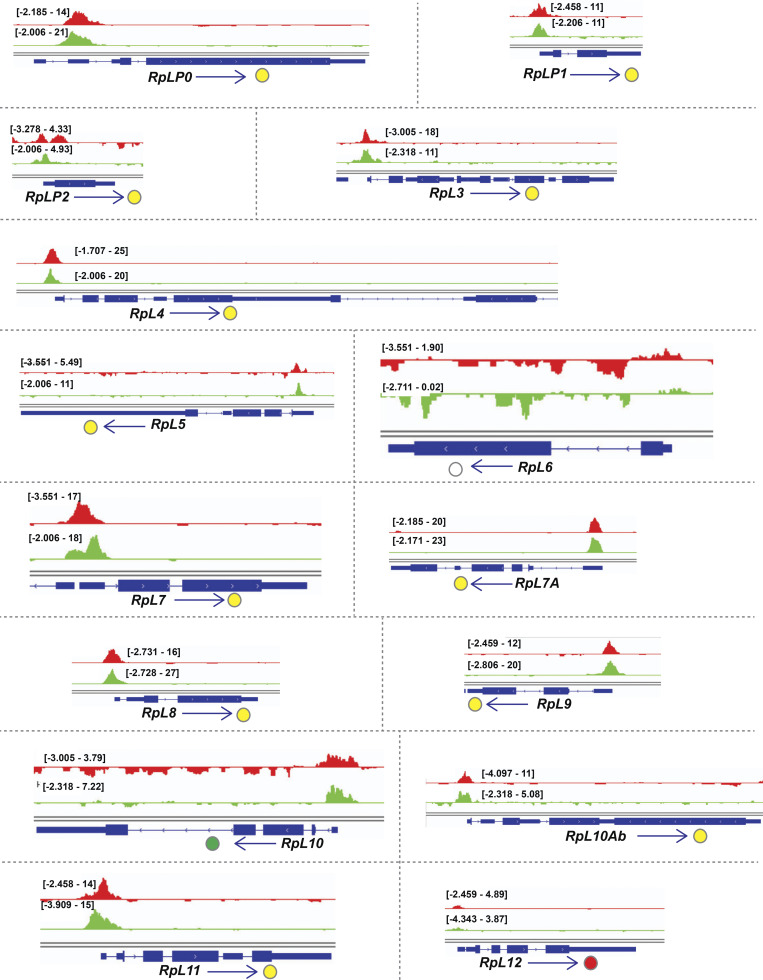
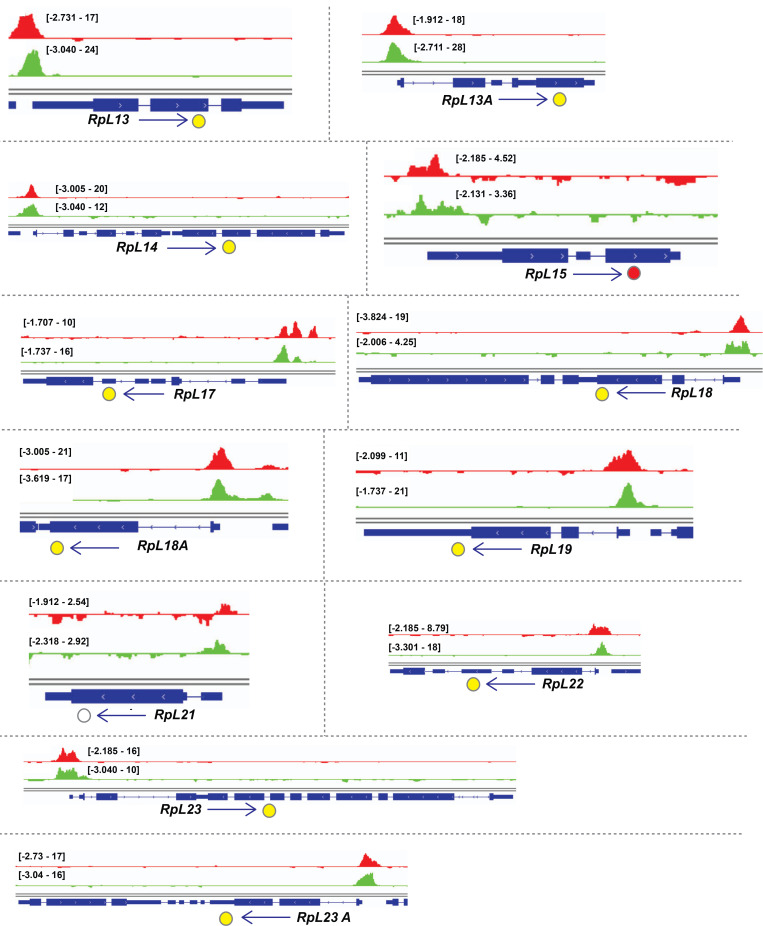
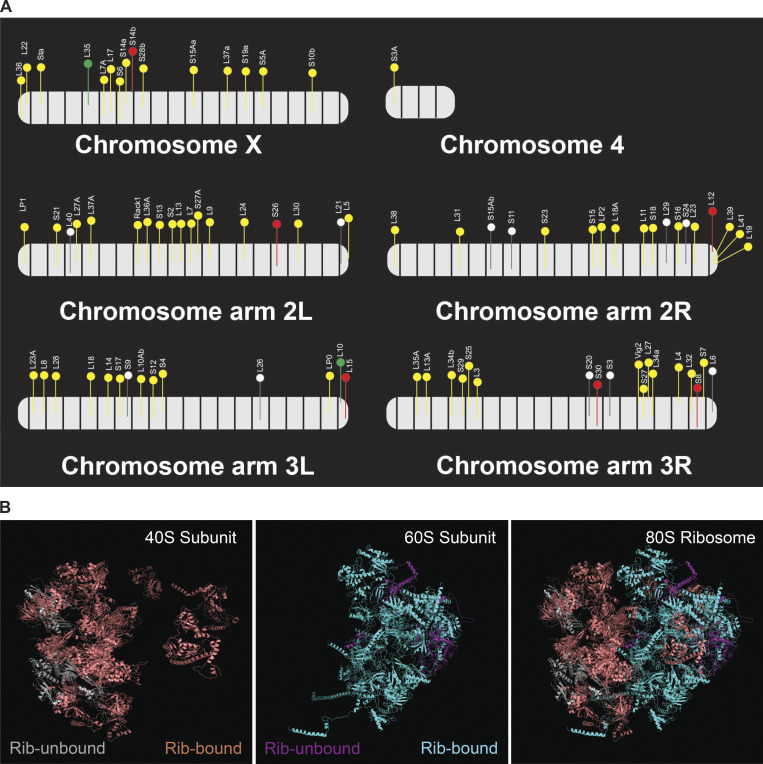
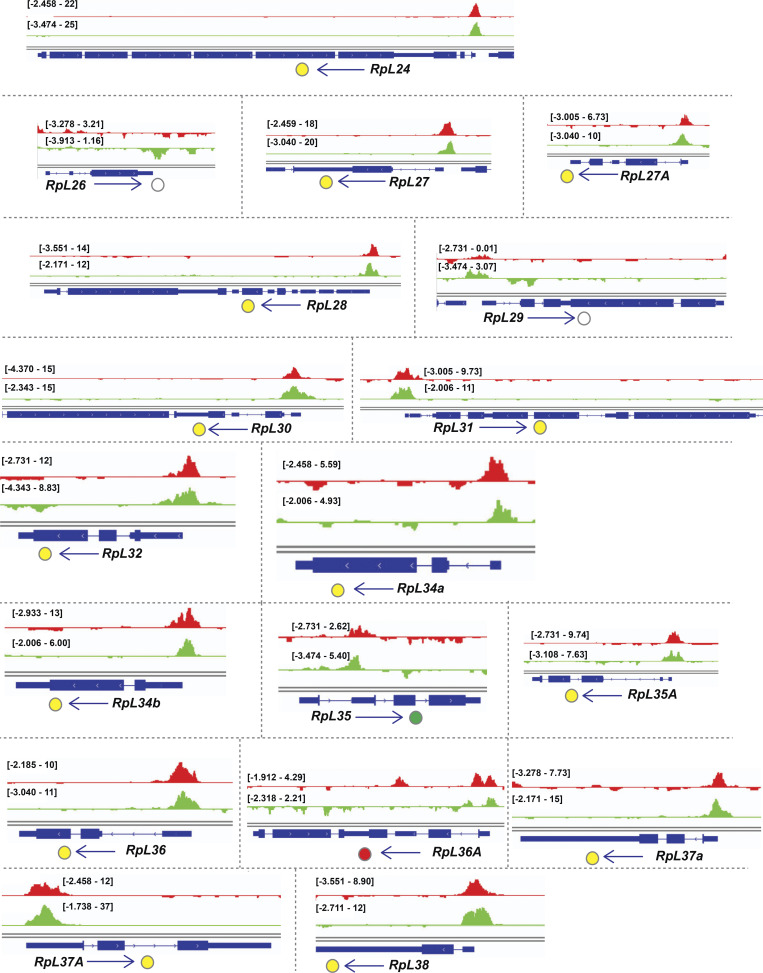
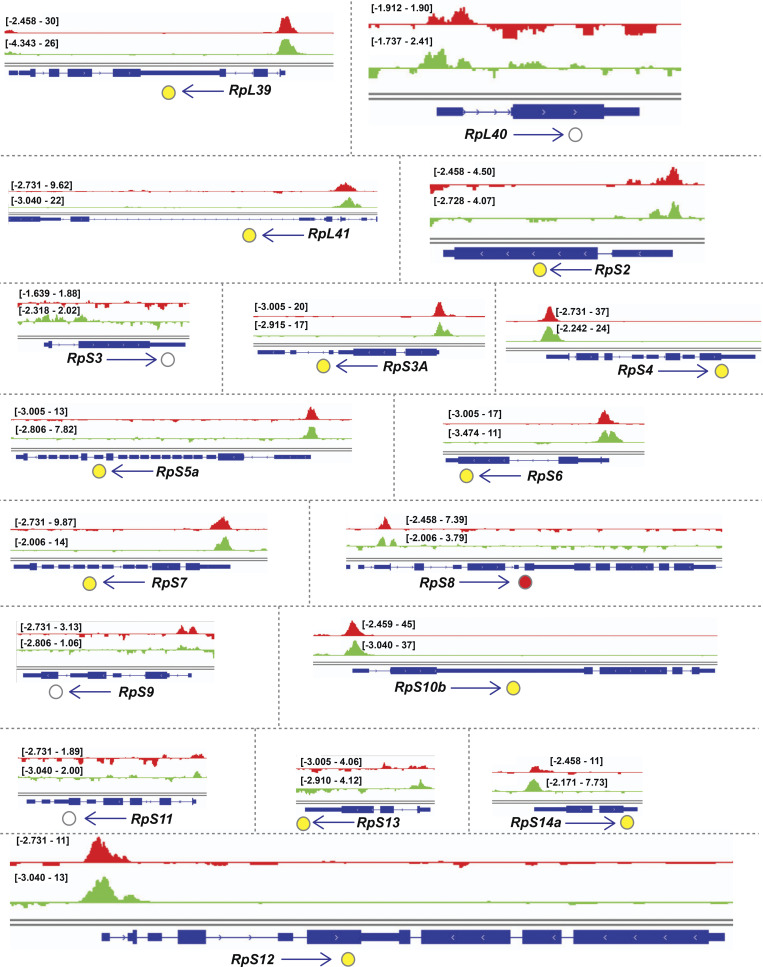
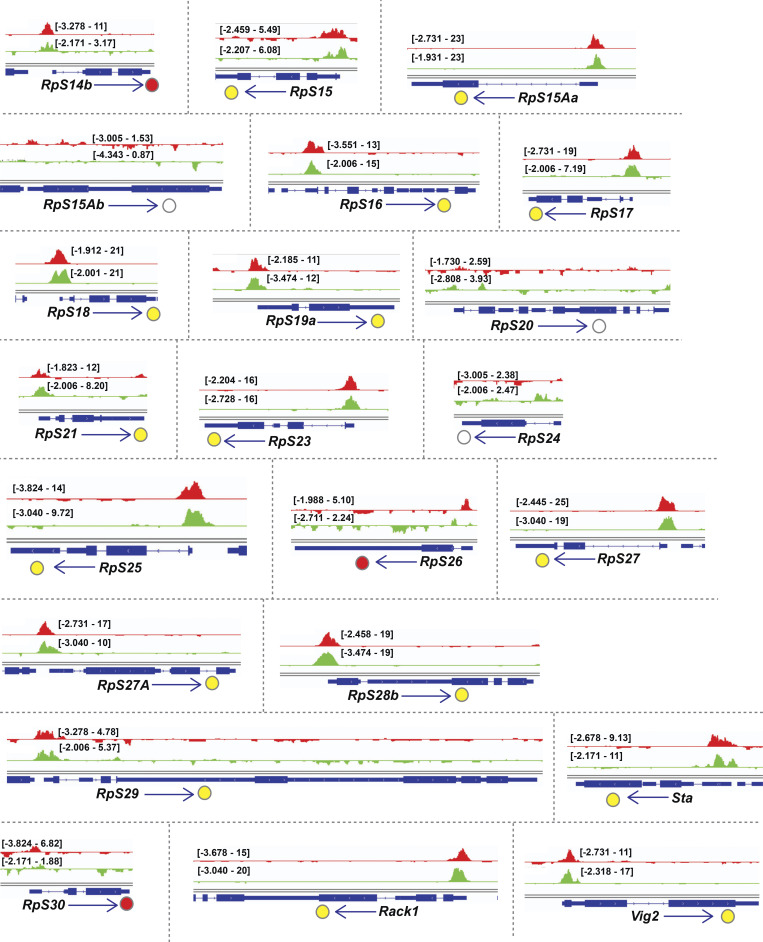
Examination of the gene cluster encapsulated by the GO term ribosome/cytoplasmic translation revealed that Rib binds RPGs, and not the genes encoding rRNAs. Visualization of Rib binding at SG-expressed RPGs (Table S2) using the Integrative Genomics Viewer revealed that 73 of the 84 SG-expressed RPGs are bound by Rib (87% coverage), with peaks exceeding a log10 binding likelihood threshold ≥4. Among the 73 Rib-bound RPGs, 64 show Rib-bound peaks at or above this threshold from both driver datasets, seven have such peaks in the “fkh-GAL4 ChIP-seq only” dataset and two in the “sage-GAL4 ChIP-seq only” dataset (Fig. 4 A). In every case, the Rib-bound region spans the RPG TSS (Fig. 4, B and C; and Figs. S1, S2, S3, S4, and S5). Even in the RPGs classified as “Rib-not bound,” the strongest relative Rib-binding signal typically spans the TSS of the corresponding RPG (Fig. 4 D; and Figs. S1, S2, S3, S4, and S5). Rib-bound RPG loci are not confined to a specific chromosome (Fig. S2 A); neither do the Rib-bound RPGs show a preferential bias for a particular ribosomal subunit (large or small) or any specific domain within a subunit (Fig. S6). Thus, we surmise that Rib likely binds all SG-expressed RPGs, but that the technical limitations of the ChIP-seq approach prevented recovery of all RPG binding events.
Figure 4.
Rib immunoprecipitates RPGs and is required for their full levels of expression. (A) Schematic summary of Rib binding to SG-expressed RPG promoters. Filled circles represent genes bound by Rib (log10 binding likelihood threshold ≥4). Unfilled circles represent genes not bound by Rib (log10 binding likelihood threshold <4). Yellow, set of genes bound by Rib and above threshold in both fkh-GAL4 and sage-GAL4 experiments; red, set of genes bound by Rib and above threshold in the fkh-GAL4 experiment only; green, set of genes bound by Rib and above threshold in the sage-GAL4 experiment only. (B) Representative binding profiles of Rib-GFP for genes with peaks from both datasets (fkh-GAL4 > UAS-rib-GFP and sage-GAL4 > UAS-rib-GFP): RpL7, RpL11, RpS3A, and RpS4. Binding profiles from the fkh-GAL4 and the sage-GAL4 datasets are shown by red and green tracks, respectively. Signal intensity range for the regions shown are in brackets. See Figs. S1, S2, S3, S4, and S5 for all RpG binding profiles. (C) Representative binding profiles of Rib-GFP for genes with peaks (log10 binding likelihood threshold ≥4) in only one of the datasets: RpL35 (sage-GAL4 > UAS-rib-GFP) and RpS14b (fkh-GAL4 > UAS-rib-GFP). Note that although the alternate track did not meet the binding threshold (≥4), its signal peak overlaps the signal peak that did. (D) Representative signal profile of Rib-GFP on an RPG from Rib-not-bound category (log10 binding likelihood <4 in both datasets): RpS11. Note that although neither track meets the binding threshold (≥4), the highest signal, nonetheless, spans the TSS. (E) Volcano plot of whole-embryo microarray gene expression analysis shows genes downregulated (blue) or upregulated (red) ≥1.5-fold in rib-null embryos compared with WT. Transcripts with fold-change values between −1.5 and 1.5 are shown in yellow. Unfilled circles represent transcripts with fold-change values that were not statistically significant between the groups, i.e., P > 0.05. RPGs are highlighted by cyan circles. A majority of RPG transcripts were downregulated in the rib mutants compared with WT. Named RPGs (orange) belong to the subset whose levels were also examined by RT-qPCR analysis. See Table S2 for metadata. (F) RT-qPCR results from whole embryo transcripts for several RPGs show reduced expression levels in rib mutants compared with WT, with most showing a significant decrease. **, P < 0.05; Mann–Whitney U test. (G) Nonribosomal Rib targets show both decreased (top) and increased (bottom) expression in rib mutants compared with WT. **, P < 0.05; Mann–Whitney U test. Data from Loganathan et al., 2016.
Figure S1.
Binding tracks from Rib-GFP ChIP-seq for all SG-expressed RPGs. (Related to Fig. 4.) fkh-GAL4 > UAS-rib-GFP tracks are in red; sage-GAL4 > UAS-rib-GFP tracks are in green. The colored circles correspond to the individual track colors when either of the binding peaks reaches the enrichment threshold of log10 binding likelihood ≥4. In cases where both the binding peaks meet the enrichment threshold, the circles are yellow. In cases where both peak thresholds are <4, the circles are unfilled. Note that even when the enrichment threshold was <4, binding signals for the region shown are often highest at the RPG TSS.
Figure 5.
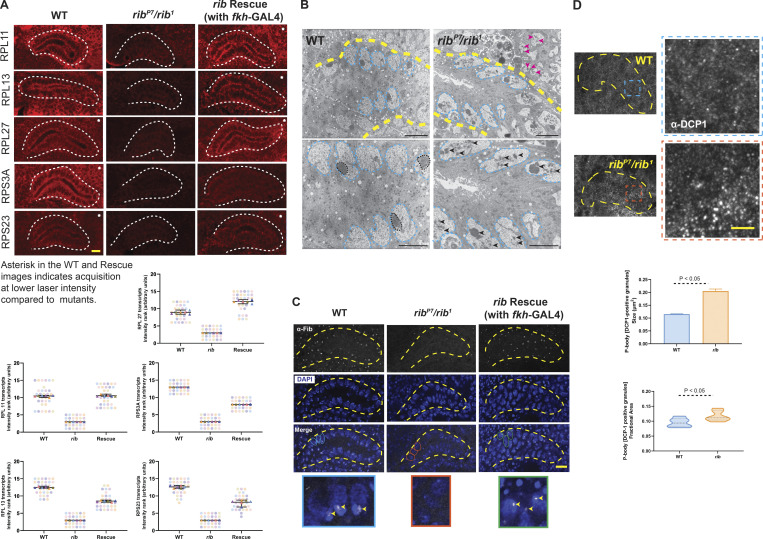
rib is required for full levels of RPG expression, and rib mutants show defects consistent with ribosome deficiency. (A) Images from FISH of RPGs reveal high-level expression in the WT SG (white outline) and a significant reduction in rib mutants, which is rescued by fkh-GAL4 driven expression of rib (top). SuperPlots showing the scores assigned by six observers ranking RPG transcript signal intensities in 15 blinded samples in the FISH experiments (bottom). Note that the observers consistently ranked what turned out to be the rib-null samples as having the lowest SG signal intensity. Scale bar: 10 µm. See Fig. S7 for DAPI channel. (B) Transmission electron micrographs from sections of embryonic SGs (yellow outline) reveal aberrant nucleolar morphologies in rib mutants (bottom row: slightly higher magnifications). Whereas the nuclear morphologies (cyan outline) are comparable between groups, the electron-dense compaction of nucleolar condensates in WT (black outline) is rarely observed in rib mutants; most rib mutant cells show fragmented or dispersed morphologies characteristic of nucleolar decondensation (black arrowheads). Adjoining mesodermal cell nucleoli also have a fragmented or dispersed morphology (magenta arrowheads) in the rib mutant. SGs from three WT and three rib1/ribP7 embryos were analyzed. Scale bar: 2 µm. (C) Fibrillarin-positive nucleolar punctae observed in WT are lost in rib mutants (yellow outline, SG); fkh-GAL4–driven expression of UAS-rib was sufficient to rescue its localization in SGs and in a subset of surrounding mesoderm-derived cells that express fkh-GAL4. A subset of outlined nuclei (WT, cyan; rib mutant, orange; and rescue, green) in the Merge row is enlarged in the bottom row to highlight the nucleolar Fibrillarin (arrowheads). SGs from four WT, four rib1/ribP7, and four rescue embryos were analyzed. Scale bar: 10 µm. (D) P-body granules (α-DCP1 staining), indicators of untranslated mRNA accumulation, are larger and relatively more abundant in rib mutants than in WT. Top: SG (yellow outline) and the enlarged region of interest (blue/orange boxes) are shown. Scale bar: 2 µm. Bottom: Quantitative analysis showed a significant increase in the P-body granule size in rib SG cells (0.205 ± 0.008 µm2) compared with WT (0.115 ± 0.001 µm2; unpaired t test with two-tailed P value <0.001; mean ± SEM; n = 6 SGs/group). Quantitative analysis of P-body granule fractional area also showed a significant increase in their relative abundance in rib SG cells (0.117 ± 0.007) compared with WT (0.0951 ± 0.006; unpaired t test with two-tailed P value 0.05; median and quartiles; n = 6 SGs/group).
Figure S2.
Binding tracks from Rib-GFP ChIP-seq for all SG-expressed RPGs. (Related to Fig. 4.) fkh-GAL4 > UAS-rib-GFP tracks are in red; sage-GAL4 > UAS-rib-GFP tracks are in green. The colored circles correspond to the individual track colors when either of the binding peaks reaches the enrichment threshold of log10 binding likelihood ≥4. In cases where both the binding peaks meet the enrichment threshold, the circles are yellow. In cases where both peak thresholds are <4, the circles are unfilled. Note that even when the enrichment threshold was <4, binding signals for the region shown are often highest at the RPG TSS.
Figure S6.
Rib binding of RPGs across the Drosophila genome and the position of the corresponding proteins on the ribosomal subunit structures. (Related to Fig. 4.) (A) Drosophila RPG loci are dispersed across all chromosomes. Colored flags represent RPGs bound by Rib (log10 binding likelihood threshold ≥4). Unfilled flags represent genes not bound by Rib (log10 binding likelihood threshold <4). Relative gene positions are approximate representations based on the standard cytogenetic map (FlyBase, FB2017_04). Yellow, genes bound by Rib in both fkh-GAL4 and sage-GAL4 driver tracks; red, genes bound by Rib in the fkh-GAL4 track only; green, genes bound by Rib in the sage-GAL4 track only. (B) Rib binds to genes encoding for proteins of both the 40S and the 60S ribosomal subunits. The proteins for which the corresponding genes lack Rib binding in the ChIP-seq are shown in gray for the 40S subunit and in purple for the 60S subunit.
Rib transcriptionally upregulates SG RPGs, and rib loss adversely impacts markers of ribosome biogenesis and cell translation
To determine if RPGs are transcriptionally regulated by Rib, we reexamined the whole-embryo microarray analysis comparing gene expression levels in WT to rib mutants in mid- to late-stage embryogenesis (Loganathan et al., 2016). A majority of RPGs (67/84) are downregulated in rib mutants (Fig. 4 E and Table S2). Although only 4/67 RPGs (two Rib-bound and two Rib-not-bound) show a >1.5-fold (log2) downregulation in rib mutants, the overall trend suggests a dependence of RPGs on Rib for their full transcriptional activation. Indeed, both Rib-bound and Rib-not-bound RPGs depend on Rib for transcriptional upregulation, with 59/67 RPGs whose expression went down in rib mutants belonging to the Rib-bound category and eight belonging to the Rib-not-bound category (Table S2).
We next tested a subset of RPGs (six Rib-bound genes, RpLP2, RpL11, RpL19, RpL28, RpS17, and RpS23; one Rib-not-bound gene, RpS9) for Rib-dependent transcriptional regulation using quantitative RT-PCR (RT-qPCR) analysis of whole embryos. The levels of all seven transcripts were lower in rib mutants, with four showing significantly reduced levels of expression (Fig. 4 F and Table S3). In contrast, RT-qPCR analysis of nonribosomal genes bound by Rib (using the same RNA samples) revealed both increased and decreased levels of expression in rib mutants (Fig. 4 G). The RT-qPCR results, hence, support a requirement for Rib to boost RPG transcription to WT levels in the embryo because, although transcript levels are decreased in rib mutants compared with WT, RPG expression is, nonetheless, still observed.
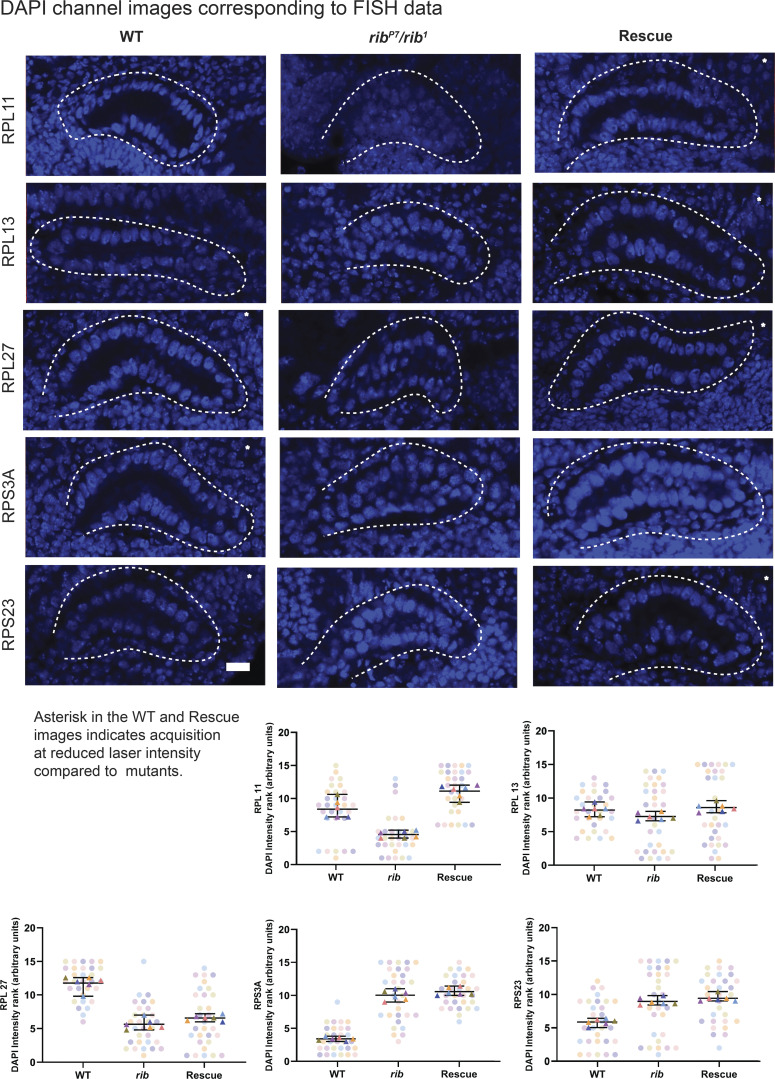
The abundance of RPG transcripts in the SG relative to other tissues during embryogenesis (http://fly-fish.ccbr.utoronto.ca/) prompted us to assay the effects of rib loss on RPG transcript levels using FISH. Transcript levels for all five of the RPGs tested were notably reduced in rib mutant SGs (Fig. 5 A and Fig. S7). The FISH experiments also revealed a decrease in RPG levels in the mesodermally derived cells surrounding the SG, an unexpected finding that is nonetheless consistent with the high levels of Rib also detected in the embryonic mesoderm and its derivatives (Fig. 2, B and C). Restoration of Rib function using fkh-GAL4, which drives upstream activating sequence (UAS)-transgene expression in the SG and in a subset of mesodermally derived cells (Fig. 2 G), was sufficient to rescue RPG transcript levels in rib mutants. It is possible that the residual level of RPG transcripts in rib mutant SGs may suffice to meet the basal translation requirements, as rib mutant SG cells do not die (Loganathan et al., 2016); such levels, however, likely fail to sufficiently fulfill the increased translational capacity demanded by morphogenetic growth and/or the increased secretory output of this organ.
Figure S7.
DAPI channel images from the FISH experiment. (Related to Fig. 5.) Top: DAPI channel images for the corresponding representative images from RPG FISH experiments shown in Fig. 5. Bottom: SuperPlots for DAPI intensity showed that the ranking of blind samples does not follow an order consistent with the ordering of RPG probe intensity, i.e., WT or rib SG rescue followed by the rib mutant for RPG probe rankings (Fig. 5) versus no concordant group order for DAPI rankings. Scale bar: 10 µm.
Rib loss affects nucleolar structure and markers of translation
To learn if the decrease in RPG transcript levels in rib mutant cells is associated with changes in markers of ribosome biogenesis and translation, we examined SG nucleoli and RNA processing bodies (P-bodies). Nucleoli are the sites of rRNA processing and ribosome subunit assembly, for which stoichiometric levels of RPs are critical (Pederson, 2011). Decreased availability of RPs may perturb nucleolar homeostasis and impact its morphology. Accordingly, transmission EM analysis showed the WT SG nucleolus as a single, compact, electron-dense condensate within each nucleus. In the majority of rib mutant cells, however, the nucleolus was both highly fragmented and widely dispersed (Fig. 5 B). This aberrant morphology is reminiscent of the nucleolar stress/decondensation phenotypes associated with abnormal ribosome biogenesis and decreased cell growth (Marinho et al., 2011). We also observed loss of Fibrillarin, a rRNA 2′-O-methyltransferase required for pre-rRNA processing, in rib mutant SG nucleoli (Fig. 5 C). Fibrillarin localization within nucleoli is indicative of ribosome biogenesis and growth (Baker, 2013; Sriskanthadevan-Pirahas et al., 2018a; Sriskanthadevan-Pirahas et al., 2018b). Expression of UAS-rib using the fkh-GAL4 driver was sufficient to rescue the Fibrillarin nucleolar staining, further supporting a role for Rib in ribosome biogenesis. We also observed changes in the nucleolar morphology and Fibrillarin staining of some mesodermally derived cells (Fig. 5, B and C), concordant with the decrease in their RPG transcript levels. The effects of Rib on nucleolar morphology are likely an indirect consequence of reduced RP levels, since Rib does not localize to nucleoli (Fig. 2 C) or bind to the Fibrillarin gene (SG ChIP-seq). We cannot exclude the possibility, however, that Rib binds and regulates some other critical but unknown nucleolar component.
We investigated the impact of rib loss on translation by comparing P-body size in rib mutant and WT SG cells. P-bodies are aggregates of untranslated mRNPs associated with translational repression, and their size is proportional to the amount of untranslated mRNA (Parker and Sheth, 2007; Teixeira et al., 2005). Staining for decapping protein 1 (DCP1), a core component of the P-body–associated machinery (Ingelfinger et al., 2002), revealed a significant, nearly twofold increase in the aggregate size of P-bodies in rib mutants (Fig. 5 D). The fractional area of SG P-body granules (total aggregate area/gland area) was also significantly increased in rib mutants (Fig. 5 D), suggesting a larger pool of untranslated mRNAs associated with rib loss. These results confirm Rib’s proposed role in augmenting SG cell translational capacity and indicate that the RPG transcript level decrease in rib mutants is not due to a general decrease in levels of nuclear transcription. These results support a role for Rib in boosting SG RPG transcription, a prerequisite for increased ribosome biogenesis and efficient translation of mRNAs, to prime the organ for secretory function.
Rib binding to DNA in vitro is direct, weak, and not sequence specific
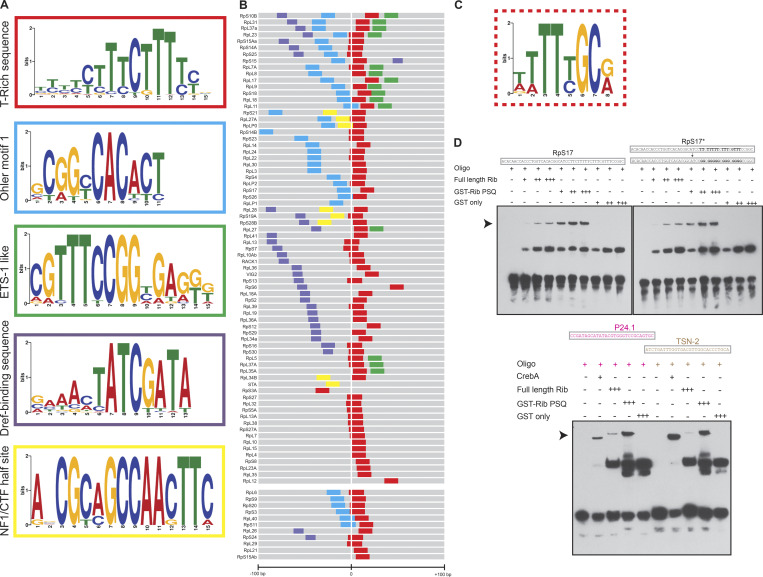
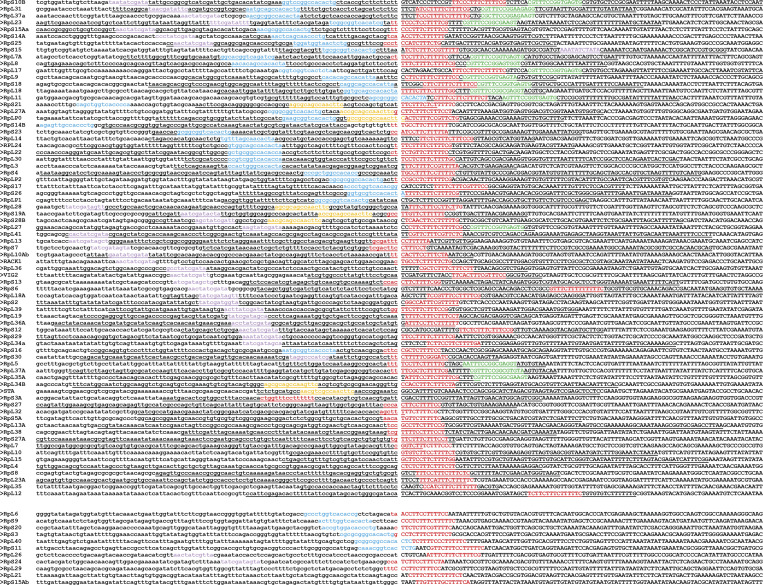
To explore the basis of Rib binding to RPG DNA, we used Multiple Em for Motif Elicitation (MEME) analysis (Bailey and Elkan, 1994) to identify potentially conserved sequence motifs. From the RPG sequences immunoprecipitated by Rib, we identified several motifs, the top five of which are shown (Fig. 6 A). Mapping the sequence motifs in the 200-bp region centered around the TSS (+1) for the 73 Rib-bound and 11 Rib-not-bound RPGs revealed a striking pattern in their organization (Fig. 6 B and Fig. S8). The top-ranked TC-rich sequence (Fig. 6, A and B; red motif) spans the TSS in almost all of the RPGs, both Rib-bound and Rib-not-bound. The other motifs are present in only a subset of RPGs: the Dref binding motif (purple) in 32/84 enhancers (Hirose et al., 1993; Hirose et al., 1996); Ohler Motif-1 (cyan) in 36/84 enhancers (Ohler et al., 2002); the motif resembling a nuclear factor I (NFI)/CAAT box transcription factor (CTF)-halfsite (yellow) in 8/84 enhancers (Elateri et al., 2003; Gronostajski, 2000); and the motif with similarity to the vertebrate ETS-1 binding site (green) in 15/84 enhancers (Sharrocks, 2001; Sharrocks et al., 1997). Moreover, the relative position of the motifs is also conserved across RPG promoters (Fig. 6 B), with the Ohler Motif-1 and NF1/CTF-halfsite being the closest motifs upstream of the TSS/TC-rich motif, and the Dref consensus sites mapping further upstream. The ETS-1 like motif always occurs downstream of the TSS.
Figure 6.
Rib pulls down sequences containing known RPG regulator motifs and binds to RPG enhancer DNA in vitro with low affinity and specificity. (A) Top five motifs identified by MEME-ChIP analysis of RPG sequences pulled down with Rib in the SG ChIP-seq. (B) Representation of enriched motifs from A embedded in the 200 nucleotides flanking the TSS of RPGs. The color code for motifs is according to those used in the outlines of A. TSS (+1) were obtained from FlyBase. The top block of enhancers (RpS10B through RpL12) includes genes bound by Rib, and the bottom block (RpL6 through RpS15Ab) includes RPGs not bound by Rib in the ChIP-seq analysis. See Fig. S8 for sequence lineup. (C) T-rich motif for Rib binding from a bacterial one-hybrid analysis with the Rib PSQ domain (source: FlyFactorSurvey; mccb.umassmed.edu/ffs). (D) EMSAs reveal that full-length Rib and its DNA-binding PSQ domain directly bind the RpS17 promoter in a concentration-dependent manner. Left: Rib-dependent mobility shift is indicated by the arrowhead. Right: EMSAs in which the T’s in the RpS17 promoter were replaced with G’s in the TC-rich motif of the RpS17* enhancer. Bottom: CrebA and Rib bind DNA containing the CrebA consensus sites in P24.1 and TSN-2, two bona fide transcriptional targets of CrebA. See Fig. S9 for EMSAs with several additional RPG TSS sequences. All EMSAs were performed twice with identical results. Source data are available for this figure: SourceData F6.
Figure S8.
Rib-bound RPG enhancer motifs. (Related to Fig. 6.) Ordering of RPG sequences with conserved enhancer motifs from MEME-ChIP to show their positions relative to the TSS (as determined from Flybase data and indicated by a gap in sequences), from −100 bp to +100 bp. Bases in lowercase are upstream of the TSS. Conserved sequence motifs (indicated by colored text and corresponding to Fig. 6, A and B) are observed in genes bound by Rib (upper block) as well as in genes not bound by Rib (lower block). Underlined sequences in the upper block were immunoprecipitated by Rib-GFP in the ChIP-seq experiments.
RPGs, as part of the housekeeping gene repertoire, feature promoter-proximal enhancers in contrast to the distal enhancers often associated with developmental genes (Zabidi et al., 2015). Three of the top five consensus sequence motifs that emerged from the MEME analysis—TC-rich, Ohler Motif-1, and Dref motifs—have been implicated in RPG transcription. The TC-rich sequence, abutting the TSS, harbors the TCT-core promoter region from which TATA box binding protein-related factor 2 (Trf2) initiates RPG transcription (Wang et al., 2014). Trf2, however, lacks sequence-specific DNA-binding activity, and therefore, likely relies on other transcription factors for its recruitment to the core promoter region. Two sequence-specific DNA-binding transcription factors, motif 1 binding protein (M1BP) and DNA replication-related element factor (Dref), bind to a subset of RPGs featuring their respective binding sites and likely recruit Trf2 to the core promoter region for initiating RPG transcription (Baumann and Gilmour, 2017; Hochheimer et al., 2002; Yamashita et al., 2007).
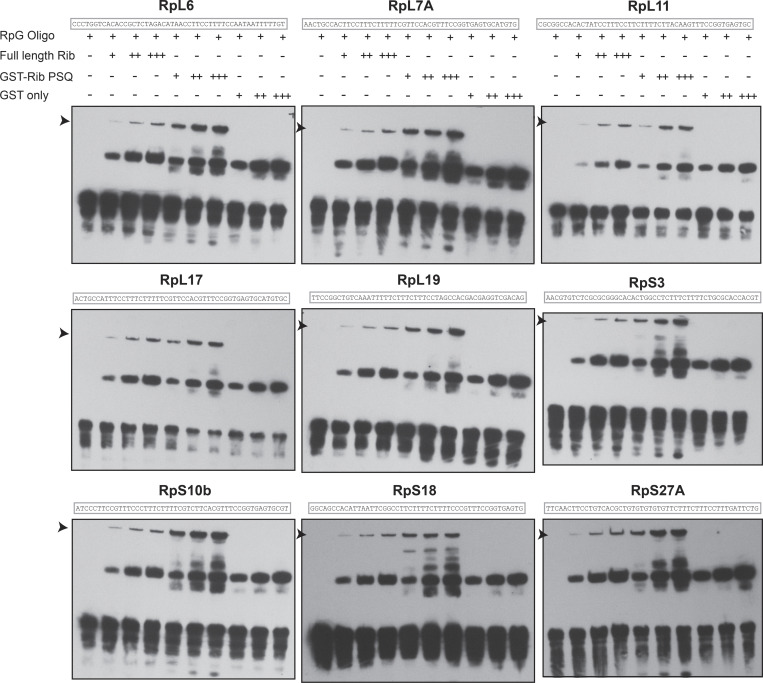
A preferred binding site for the DNA-binding PSQ domain of Rib as a T-rich sequence, not unlike the TC-rich consensus sequence in the RPG core promoter region, was reported earlier (Fig. 6 C; Noyes et al., 2008; Zhu et al., 2011). We, therefore, asked if purified full-length Rib or its PSQ DNA binding domain can directly bind RPG core promoters in vitro. Electrophoretic mobility shift assays (EMSAs) with 10 RPG promoters harboring the TC-rich sequence revealed that both untagged full-length Rib and the GST-tagged DNA binding PSQ domain of Rib bind RPG enhancers in a concentration-dependent manner (Fig. 6 D, Fig. S9, and Table S4). Binding of Rib or its PSQ domain to DNA is not sequence specific, however, as revealed by (a) their ability to bind an altered (T→G) RPG enhancer sequence (Fig. 6 D); and (b) the ability of Rib to shift DNA containing CrebA consensus binding motifs from two genes, P24-1 and Tudor-SN, that are SG targets of CrebA and not Rib (Fox et al., 2010; Johnson et al., 2020). In addition, Rib binds DNA with relatively weak affinity, as its binding to the RPG enhancers required nearly nine times higher Rib protein concentration for EMSAs compared with CrebA-dependent shifts of CrebA target sequences. Also, the Rib PSQ domain bound DNA better than full-length Rib, suggesting autoinhibition within full-length Rib to DNA binding. Together, these results reveal that Rib binds DNA, but with poor affinity and weak sequence specificity. Thus, additional factors may contribute to the strength and specificity of Rib binding in the SG.
Figure S9.
RPG enhancer EMSAs with Rib and Rib DNA-binding domain. (Related to Fig. 6.) RPG enhancer fragments corresponding to the sequences of RpL6, RpL7A, RpL11, RpL17, RpL19, RpS3, RpS10b, RpS18, and RpS27A revealed direct binding by both the full-length Rib protein and the Rib-PSQ DNA binding domain. Arrowheads mark Rib-dependent mobility shifts. All EMSAs were performed twice with identical results.
Rib interacts with known regulators of RPG transcription
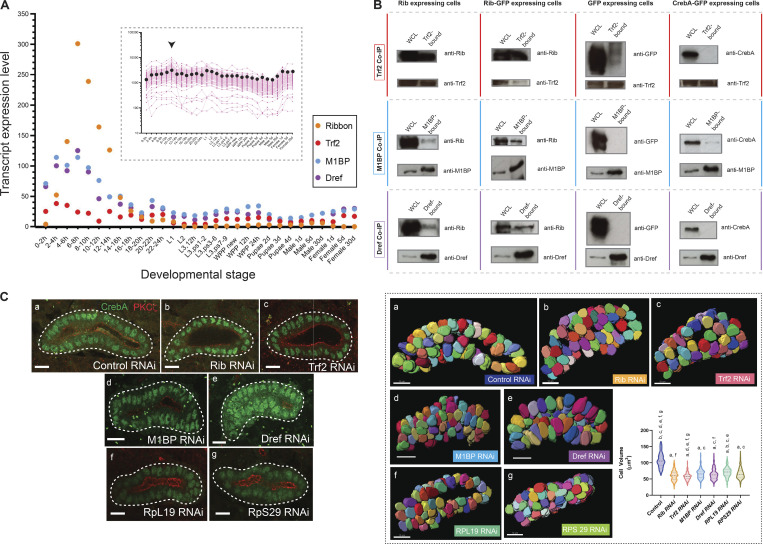
Bolstering the possibility that canonical regulators of RPG transcription could both provide context and facilitate Rib binding to the RPG promoters, the developmental transcript expression profiles of Trf2, M1BP, and Dref trace trajectories closely in tandem with Rib, with all factors reaching their peak expression 4–10 h after fertilization and dropping to near-baseline levels at the end of embryogenesis (Fig. 7 A). The temporal increase of these RPG transcription factors aptly precedes the peak levels of expression of RPG transcripts (Fig. 7 A, inset), i.e., 10–12 h of embryogenesis.
Figure 7.
Rib coimmunoprecipitates with known transcriptional regulators of RPGs, and isolated RNAi knockdown of Rib-interacting RPG regulators or individual RPGs result in embryonic SG cell growth defects. (A) Transcript expression profiles of rib, Trf2, M1BP, and Dref during Drosophila development. The highest-level expression of all four genes occurs during embryonic stages. Inset: Transcript expression profiles for all 84 RPGs across developmental stages reveals the relatively high levels achieved during 10–12 h of embryogenesis (arrowhead). Pink tracks, individual RPGs; black dots, median values. Source data for the plots obtained from FlyBase (modENCODE temporal expression data). (B) Co-IP experiments performed in S2R+ cells transfected with constructs expressing UAS-rib, UAS-rib-GFP, UAS-GFP, and UAS-CrebA-GFP (the latter as negative controls), respectively. All three co-IP fractions—Trf2-bound, M1BP-bound, and DREF-bound—contain both Rib and Rib-GFP. WCL, whole cell lysate. Size (kD): Rib, ≈70; CrebA, ≈57; Trf2 short-form, ≈75; M1BP, ≈55; Dref, ≈86; and GFP, ≈30. Western blots with the Trf2 antibody consistently produced high background signal, and a weak GFP signal was observed in the TRF2-bound fraction of GFP-expressing cells. The weak CrebA signal observed in the M1BP-bound fraction of CrebA-GFP–expressing cells was absent in the biological replicate experiment. Two experiments were performed as complete sets of co-IPs; multiple (more than three) individual co-IPs were performed on select fractions. (C) Left: Cell growth deficit is observed in SG RNAi knockdown of Rib, Trf2, M1BP, Dref, and either of the two representative RPGs, RpL19 and RpS29, in stage 15–16 embryos. Right: Quantitative analysis of cell volumetric data from 3D renderings of manually segmented whole secretory cells. A total of 1,050 cells from 21 SGs were 3D rendered. n = 150 cells/genotype; median and quartiles; Kruskal–Wallis test; significant difference indicators: P < 0.05 from each group mean compared with (a) GFP RNAi control, (b) Rib RNAi, (c) Trf2 RNAi, (d) M1BP RNAi, (e) Dref RNAi, (f) RpL19 RNAi, and (g) RpS29 RNAi. Scale bar: 10 µm. Source data are available for this figure: SourceData F7.
To test the possibility of physical interactions between Rib and the known regulators of RPG transcription in a relatively simplified system, we performed coimmunoprecipitation (co-IP) experiments in S2R+ cells, in which we drove expression of Rib, Rib-GFP, GFP only, or CrebA-GFP, the latter two serving as negative controls. S2R+ cells express endogenous TRF2, M1BP, and Dref (FlyBase). In the co-IP experiments, we found that all three cell lysate fractions—TRF2-bound, M1BP-bound, or Dref-bound—immunoprecipitated Rib as well as Rib-GFP, thus revealing the ability of Rib to physically interact with each of the three known activators of RPG transcription (Fig. 7 B).
We next asked if knockdown of likely Rib cofactors or RPGs could phenocopy the cell growth deficit observed in rib mutant SGs. RNAi knockdowns of each gene—Rib, Trf2, M1BP, Dref, RpL19, or RpS29 under the control of the fkh-GAL4 driver—showed significant cell size deficits, with the knockdown of Rib and Trf2 having the most impact (Fig. 7 C; Video 7, Video 8, and Video 9). The cell growth deficiency observed with RNAi knockdowns further strengthens the link between RPG transcription and embryonic SG cell growth.
Video 7.
(Related to Fig. 7.) Trf2 SG knockdown stage 15/16 volumetric analysis. The 3D geometry of cell shapes from the embryonic SG of fkh-GAL4::UAS-Trf2-RNAi, stage 15/16.
Video 8.
(Related to Fig. 7.) M1BP SG knockdown stage 15/16 volumetric analysis. The 3D geometry of cell shapes from the embryonic SG of fkh-GAL4::UAS-M1BP RNAi.
Video 9.
(Related to Fig. 7.) Dref SG knockdown stage 15/16 volumetric analysis. The 3D geometry of cell shapes from the embryonic SG of fkh-GAL4::UAS-Dref RNAi.
Rib-dependent tracheal cell growth is not linked to RPG binding
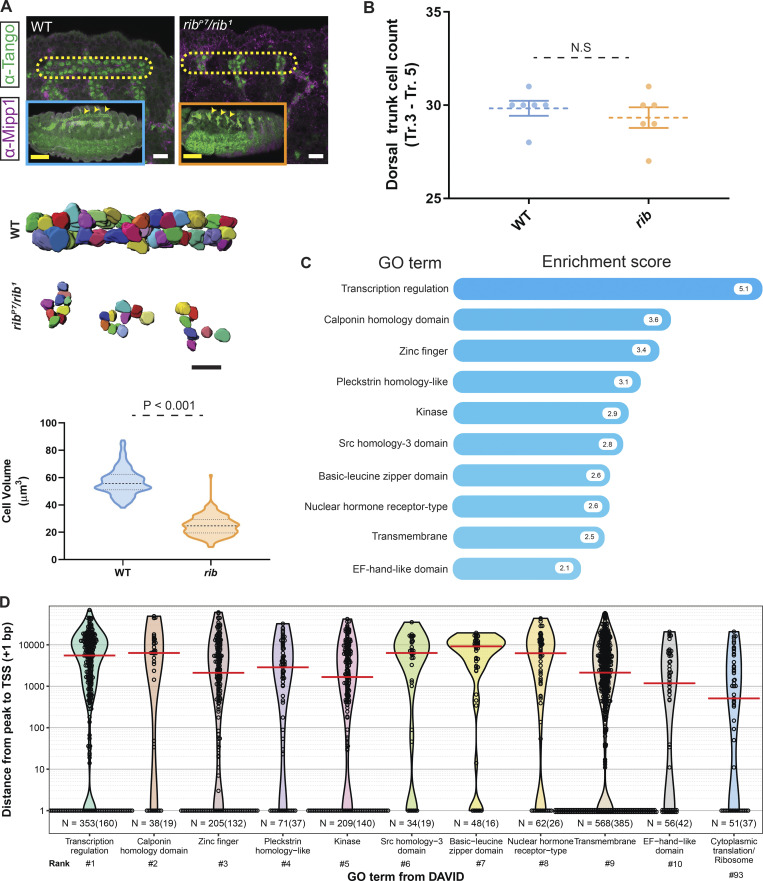
Finally, to examine if loss of Rib affects cell growth in other embryonic tubes, we investigated the embryonic tracheal dorsal trunk (DT), a multicellular tube, which shows enriched Rib expression and exhibits failed tube elongation with rib loss (Bradley and Andrew, 2001; Kerman et al., 2008; Shim et al., 2001). Morphological and volumetric analysis of rib mutant DT cells revealed comparable cell number (≈10 cells per DT segment), but a significant decrease in cell growth, with rib mutant DT cells achieving only ≈46% the size of WT DT cells (Fig. 8, A and B). ChIP-seq experiments using two tracheal drivers, trh-GAL4 and btl-GAL4, to drive expression of rib-GFP revealed a relatively large number (1,433) of Rib-bound tracheal genes that were largely distinct from Rib-bound SG genes (Fig. 8 C and Table S5). Importantly, in contrast to the SG GO clusters, cytoplasmic translation/ribosome did not feature in the top 10 (or even top 92) DAVID GO terms for Rib-bound tracheal genes, with only a small fraction of tracheal RPGs (13/84) bound by Rib (Table S2). Notably, the binding of Rib to the majority of tracheal RPGs was not TSS-proximal (Fig. 8 D). Indeed, Rib binds ≈30 genes with multiple (three or more) GO cluster growth terms, including four genes encoding core components of the Tor signaling pathway (Pdk1, Myc, Thor [Drosophila 4EBP], and Paip2), and at least five additional genes implicated in growth through studies of other tissues (foxO, InR, Mnt, dco, and bun; Table S6).
Figure 8.
Tracheal DT cell growth deficit in rib mutants and Rib-bound tracheal genes. (A) Top: Comparison of WT and rib mutant trachea from stage 16 embryos. Yellow outline encloses DT segments corresponding to Tr.3–Tr.5 and reveals the failure in tube elongation and fusion in rib mutants. Scale bar: 10 µm. Inset: Arrowheads indicate DT segments from Tr.3–Tr.5 in whole embryos. Scale bar: 50 µm. Bottom: Cell volumetry shows decreased size in rib mutant DT cells compared with stage-matched WT embryos. A total of 260 cells (5 embryos/group; stages 15, 16) with clear marker staining, from segments Tr.3–Tr.5, whose entire volume could be unambiguously measured, were volume-rendered (two-tailed, unpaired t test; group median and quartiles labeled). Scale bar: 10 µm. (B) Cell counts of WT and rib mutant tracheal DT (Tr. 3–Tr. 5). n = 6 embryos/group; two-tailed, unpaired t test; mean with SEM. (C) Functional clustering of Rib-bound tracheal genes under GO terms according to DAVID. The top 10 GO terms with their associated enrichment scores are shown. See Table S5 for meta data. (D) Mapping of Rib binding peaks relative to the TSS of the closest gene and sorted by DAVID GO terms in the embryonic trachea shows a preponderance of target binding peaks localizing to regions distant from the TSS compared with the SG (Fig. 3 D). Rib binds only a small fraction of tracheal-expressed RPGs (GO cluster rank 93 covers 13 ribosomal and several nonribosomal genes), and primarily to sequences distal from the TSS-proximal promoter. Red line indicates median distance from the peak to TSS (+1 bp). n = number of peaks versus (number of genes).
Discussion
Our findings reveal that postmitotic growth is a key feature of embryonic epithelial tubulogenesis. SG cells more than double their size as they undergo tube morphogenesis. Rib plays a major role in postmitotic early cell growth in both the SG and trachea. In the SG, Rib appears to mediate growth by boosting translational capacity; Rib binds the TSS of nearly every SG-expressed RPG as well as other key components of the translational machinery (Fig. 9 A). Moreover, Rib is required for full expression of every RPG tested, presumably through its association with both known (Baumann and Gilmour, 2017; Yamashita et al., 2007) and unknown sequence-specific activators of RPG expression, as well as through Trf2, the transcription initiator of RPGs (Wang et al., 2014). Despite rib loss impacting postmitotic growth of the embryonic trachea, Rib does not bind most RPGs in the trachea, suggesting that it regulates growth through other targets in this tissue.
Figure 9.
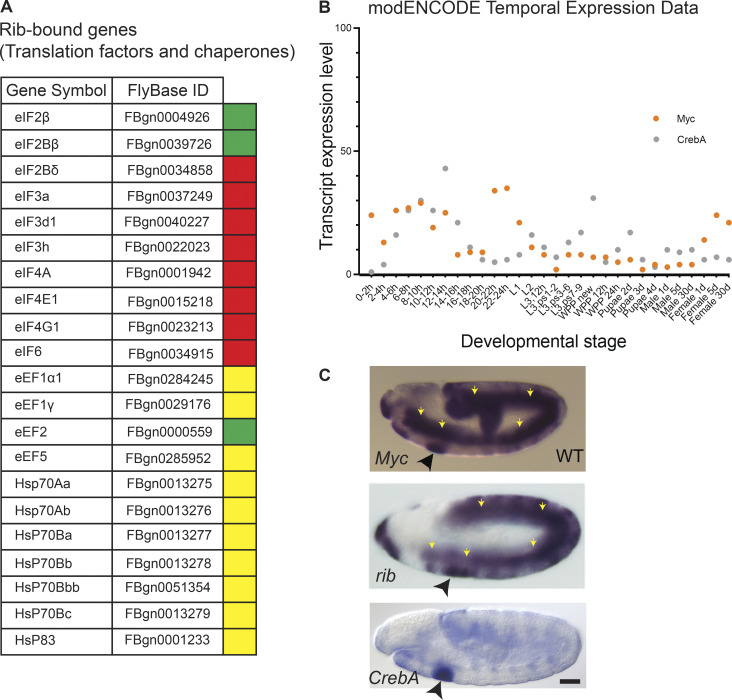
Rib binds translation factors and chaperones for protein synthesis. (Related to Discussion.) (A) List of Rib-bound translation factors and chaperones from the embryonic SG ChIP-seq. Genes are color coded according to whether binding peaks for each experiment was ≥4 in either fkh-GAL4 track only (red), sage-GAL4 track only (green), or both tracks (yellow). (B) Transcript expression profiles of CrebA and Myc during Drosophila development reveal high-level embryonic expression. (C) In situ images from early stage embryos with probes for Myc, rib, and CrebA reveal high-level SG expression (black arrowhead) with all three genes. Note also high-level expression of Myc and rib, but not CrebA, in the mesoderm (yellow arrows). Scale bar: 50 µm.
Postembryonic cell/tissue growth, also referred to as “late growth,” has been recognized as a major developmental strategy in metazoans (O’Farrell, 2004). Late growth in Drosophila is best defined for the larval stage and occurs in two major forms: (a) hypertrophic growth in all differentiated tissues (with the exception of the nervous system) by DNA polyteny (Orr-Weaver, 2015), and (b) proliferative growth in imaginal tissues, the precursors of adult structures (Irvine and Harvey, 2015; Peng et al., 2009). These processes enable the nearly 1,000-fold volume increase that occurs during larval stages and prefigure the larval-to-adult tissue-mass conversion that occurs (within the pupa) by histolysis of larval tissues and concurrent morphogenesis of adult structures from imaginal cells. Early growth (i.e., embryonic cell/tissue growth), however, has been ascribed exclusively to the cell growth–free proliferation resulting from early mitotic cycles (O’Farrell, 2004). Thus, studies on the role of cell growth (size or volume gain), if any, during organogenesis in the embryo are scarce. Analogous to the late (larval) cell growth that prefigures adult organ structure and function, early (embryonic) cell growth that primes larval organs for specialized functions is not implausible. Bolstering this hypothesis is the evidence for early endocycles in several organs—including the single SG endocycle—during their assembly in the embryo (Smith and Orr-Weaver, 1991). Indeed, early growth in the absence of post-blastoderm cell divisions has been noted in the embryonic cells of the nervous system, although the underlying mechanism is unknown (Hartenstein and Posakony, 1990). Thus, early growth of tissues during postmitotic organogenesis may be required to prime organ function immediately after embryogenesis.
Both RPs and rRNAs are associated with cellular late growth in Drosophila via the characteristic Minute mutants, resulting from heterozygous loss of function of a single RPG and the “diminutive (dm)” mutant (loss-of-function of Myc, a key activator of rRNA expression); both Minute and Myc mutants exhibit decreased cell size, decreased body size, decreased ability to compete with neighboring WT cells, and decreased viability (Baker, 2020; Grewal et al., 2005; Johnston et al., 1999; Marygold et al., 2007; Morata and Ripoll, 1975). Our analyses demonstrate that cellular early growth does occur in the embryonic SG, dovetailed with tube morphogenesis. Indeed, both SG and tracheal cell growth are impaired in the absence of Rib. Thus, our previous finding of significant decreases in apical membrane expansion of rib mutant SG and trachea with incomplete tube elongation could be linked either to this cell growth deficiency and/or to the altered expression of Rib-dependent morphogenetic regulators (Kerman et al., 2008). Hence, early cell growth may constitute yet another morphogenetic strategy for epithelial tube elongation in addition to the other known strategies of oriented cell division (Baena-Lopez et al., 2005; Concha and Adams, 1998; Saburi et al., 2008), cell rearrangement/intercalation (Blankenship et al., 2006; Keller, 1980; Saxena et al., 2014), and cell shape changes (Diaz-de-la-Loza et al., 2018; Paluch and Heisenberg, 2009).
The tissue-specific context for RPG regulation by Rib during SG tubulogenesis is likely a manifestation of the gland’s primary function: high-level protein secretion. It is possible, hence, that RPG regulation by Rib accommodates, in addition to the early growth of SG secretory cells, their sustained requirement to boost secretory output. Therefore, the Rib-dependent cell growth program might be intertwined with the CrebA-dependent cell secretion program (Fox et al., 2010) as both require high-fidelity translational machinery. CrebA, a bZIP transcription factor, upregulates the secretory pathway component genes over the time frame that is concordant with Rib-mediated early cell growth (Johnson et al., 2020), and one of the CrebA orthologues has been implicated in also scaling the translational capacity of hormone-secreting mammalian cells (Khetchoumian et al., 2019). The temporal dynamics of transcript expression for all the major factors implicated in this hypothetical gene regulatory network—Rib (RPGs), Trf2 (RPGs), M1BP (RPGs), Dref (RPGs), Dm/Myc (rRNAs), and CrebA (secretome)—are strikingly similar (Figs. 7 A and 9 B). Of note is the very high-level SG expression of Myc, which is known to upregulate rRNAs (Fig. 9 C). Hence, a parsimonious working model in which the RPG regulatory program is bipotent in meeting the translation requirements for both cell growth and secretion could be postulated based on both our present results and other previously published studies. The general applicability/possibility, moreover, of targeted, i.e., tissue-specific, early growth programs as a developmental strategy during embryogenesis for other organs undergoing eutelic (postmitotic) morphogenesis remains to be tested; nonetheless, our tracheal-specific Rib ChIP-seq findings and volumetry certainly lend support to this hypothesis.
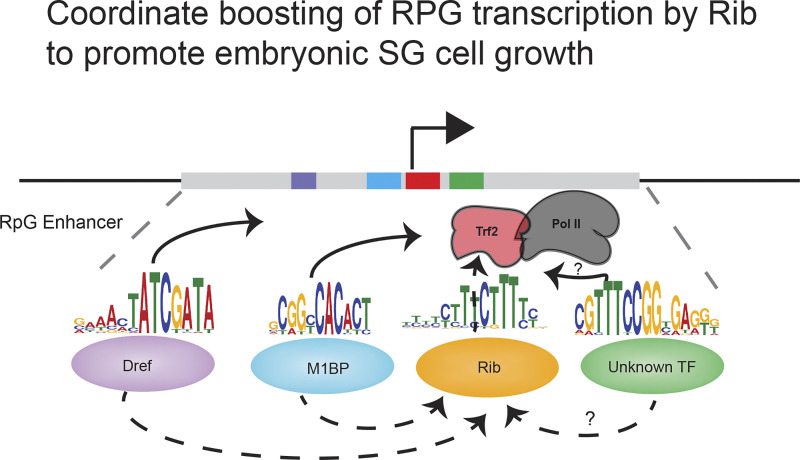
To our knowledge, Rib, a known morphogenetic regulator during embryogenesis (Jack and Myette, 1997; Cheshire et al., 2008; Loganathan et al., 2016), is also the first known factor that interacts with all three of the RPG regulators (M1BP, Dref, and Trf2) and binds all RPGs. That Rib function is critical for full levels of expression of all RPGs and for cell volume gain reveals a SG secretory cell growth program realized by coordinate transcriptional upregulation of RPGs (Fig. 10). In summary, determination of the SG-specific direct transcriptional targets of Rib revealed the ribosome as the primary target, implicating the translational machinery in mediating postmitotic early cell growth that was neither previously defined nor considered relevant for organ formation in Drosophila. Embryonic SG tubulogenesis thus provides a cogent demonstration of early cell growth melded into an organ (tube) morphogenetic program. Because of the principal secretory role of the SG, we postulate that early cell growth is likely an ineluctable accommodation resulting from the augmented translation capacity required for the mobilization of the SG secretome.
Figure 10.
Model proposed for RPG regulation by Rib in the embryonic SG. Includes a generic promoter-proximal RPG enhancer featuring putative binding sites for the multiple sequence-specific transcription factors that bind Rib and Trf2 to boost RPG transcription. Dashed arrows indicate the interaction of Rib (this study) with TRF2, M1BP, and Dref. Solid arrows indicate the interaction of Dref and M1BP with TRF2 (Hochheimer et al., 2002; Wang et al., 2014). ?, unknown or uncharacterized interactions; TF, transcription factor.
Although ribbon (rib) was named for defects in the mutant larval denticle structures (Nusslein-Volhard et al., 1984), the choice for its name—in light of evidence for its role as a customized regulator of the ribosome—is quite prescient.
Materials and methods
Fly strains
Oregon R (2376; BDSC) embryos were the WT control in all experiments. The trans-allelic combination of rib1 (3240; Bradley and Andrew, 2001) and ribP7 (Shim et al., 2001) was used for rib mutant phenotype analysis, cell volumetry, gene expression analysis by microarray, RT-qPCR, and in situ hybridization. These alleles are EMS-induced mutations generated at different times and in different labs; ribP7 has a premature stop codon at residue 22, and rib1 has a premature stop codon at residue 283. UAS-rib-GFP was built by cloning a PCR amplification of the full-length rib ORF into the pENTR-D vector and subsequent gateway cloning into the pTWG vector, placing the entire GFP coding region downstream of and in frame with the rib ORF. The following lines were generated to test for rescue of rib mutant SG phenotype: rib1 fkh-GAL4/CyO, ftz-lacZ and ribP7 UAS-rib-GFP/Cyo, ftz-lacZ. UAS-nuclear-lacZ expression driven by fkh-GAL4, sage-GAL4, and trh-GAL4 was used to determine the full set of cell types where these drivers are active. The RNAi line for rib was procured from VDRC (103977). RNAi lines for Trf2, M1BP, Dref, RpL19, and RpS29 were obtained from BDSC (36835, 32858, 35692, 65117, and 67889, respectively). SG-specific RNAi was driven by fkh-Gal4; UAS-Dicer2. The trh-GAL4 construct was made by PCR amplifying the trh enhancer region using primers (Table S3) for integration into the pChs-Gal4 multiple cloning site by restriction digestion with SacII and BamH1 (Sotillos et al., 2010).
Drosophila husbandry
Flies were raised at 25°C on a standard yeast/molasses medium (1,212.5 ml water, 14.7 ml agar, 20.4 g yeast, 81.8 g cornmeal, 109.1 ml molasses, 10.9 ml Tegosept, 3.4 ml propionic acid, and 0.4 ml phosphoric acid). All experiments were conducted on embryos collected at 25°C except for those used in the RNAi knockdown experiments, which were collected at 28°C.
Antibody production and immunostaining
Antiserum for Rib was generated in guinea pig to the product of the full-length rib ORF subcloned into the BamH I site of pET-15b vector (Novagen). Recombinant full-length Rib was expressed and purified from Escherichia coli as inclusion bodies and injected into the host animal following standard immunization protocols (Covance). This antiserum was validated for specificity in the ribP7 mutants and used for polytene preps and co-IP experiments. For other experiments requiring the Rib antiserum, a previously generated rat αRib antiserum was used (Bradley and Andrew, 2001).
For immunostaining, embryos were fixed in 4% formaldehyde (252549; Sigma-Aldrich) in PBS with an equal volume of heptane (34873; Sigma-Aldrich) for 25 min at room temperature, rinsed in MeOH, washed several times in PBS containing 0.1% Triton-X-100 (PBT), and incubated overnight with primary antibodies at 4°C. The next day, embryos were washed, blocked, and incubated with secondary antibodies at 1/200 dilution for 2 h at room temperature. After washing, embryos were counterstained with DAPI (1:1,000) and mounted in Aqua-Polymount (18606-100; Polysciences). For avidin and biotin-HRP based staining reactions, Vectastain ABC kit (PK-4001; Vectastain Laboratories) was used.
Antisera were used at the following final concentrations: rat αRibbon (1:50); rabbit αSAS (1:1,000); guinea pig αRibbon (1:1,000); guinea pig αMipp1 (1:500); guinea pig αSage (1:100); rabbit αCrebA (1:5,000); rat αCrebA (1:1,000); rat αDead ringer (1:5,000); rabbit αFork head, a gift from S. Beckendorf, University of California, Berkeley, Berkeley, CA (1:500); mouse αDCP1, a gift from M. Siomi, Keio University, Tokyo, Japan (1:1,000); rabbit αPKC ζ (RRID: AB_2300359; 1:500); mouse αFibrillarin (RRID: AB_523649; 38F3; 1:200); rabbit αGFP (RRID: 221569; 1:1,000); mouse αTango (RRID: AB_528486; 1:2); and rabbit αβGalactosidase (RRID: AB_221539; 1:500).
The following secondary antibodies were used for immunostaining of embryos: biotin-conjugated goat αmouse IgG (H + L; RRID: AB_2533969); biotin-conjugated goat αrabbit IgG (H + L; RRID: AB_2533969); biotin-conjugated goat αrat IgG (H + L; RRID: AB_2535646); Alexa Fluor 488–conjugated goat αmouse IgG (RRID: AB_2633275); Alexa Fluor 488–conjugated goat αrabbit IgG (RRID: AB_2633280); Alexa Fluor 488–conjugated goat αrat IgG (RRID: AB_2534074); Alexa Fluor 568–conjugated goat αrabbit IgG (RRID: AB_143157); Alexa Fluor 568–conjugated goat αguinea pig IgG (RRID: AB_141954); Alexa Fluor 647–conjugated goat αrabbit IgG (RRID: AB_2633282); and Alexa Fluor 647–conjugated goat α-guinea pig IgG (RRID: AB_141882).
Transmission EM
Embryos were processed for transmission EM by first dechorionating them in 50% bleach and then fixing them in 5% glutaraldehyde and heptane. After manual devitellinization, embryos were fixed in 4% glutaraldehyde (18428-5; Polysciences) and 2% acrolein (110221; Sigma-Aldrich) in 0.1 M cacodylate buffer (97068; Sigma-Aldrich). Devitellinized embryos were transferred to a chilled mixture of 1% osmium tetroxide (23311-10; Polysciences) and 2% glutaraldehyde in 0.1 M cacodylate buffer, and then postfixed in 1% osmium tetroxide in 0.1 M cacodylate buffer. Fixed embryos were dehydrated and embedded in Epon as previously described (Myat and Andrew, 2000a). Sections, obtained on a Reichart-Jung Ultracut E, were stained with 2% uranyl acetate (6159-44-0; Polysciences) and lead citrate (25350-100; Polysciences) for viewing.
ChIP-seq
ChIP-seq was performed as previously described for fkh-GAL4::UAS-rib-GFP and sage-GAL4::UAS-rib-GFP embryos (Negre et al., 2006). Each experiment was done with two biological samples. Briefly, chromatin from multiple independent collections of stage 11–16 btl-GAL4::UAS-rib-GFP and trh-GAL4::UAS-rib-GFP embryos was cross-linked at room temperature in 1.8% formaldehyde in 2 ml of homogenization buffer (60 mM KCl, 15 mM NaCl, 15 mM Hepes , pH 7.6, 4 mM MgCl2, 0.5 mM DTT, 0.5% Triton X-100, and cOmplete protease inhibitor cocktail [1 tablet per 50 ml buffer]). The cross-linked material was resuspended in 0.1% SDS and 0.5% N-lauroylsarcosine in 0.5 ml lysis buffer (140 mM NaCl, 15 mM Hepes, pH 7.6, 1 mM EDTA, 0.5 mM EGTA, 0.1% sodium deoxycholate, 1% Triton X-100, 0.5 mM DTT, and cOmplete protease inhibitor cocktail [1 tablet per 50 ml buffer]). Chromatin was sonicated three times at 4°C using the Sonic Dismembrator Model 100 (Thermo Fisher Scientific) under the following conditions: power setting 3, 20 s ON, and 20 s OFF. Immediately after sonication, the chromatin extract was stored at −80°C before immunoprecipitation. Immunoprecipitations were performed, as described in (Negre et al., 2006), using a polyclonal goat αGFP antibody, gift from K. White, University of Chicago, Chicago, IL (1:250), that has been robustly tested for ChIP-seq applications (Kudron et al., 2018; Sin et al., 2017). Immunoprecipitated DNA was prepared for Illumina sequencing using the Illumina TruSeq ChIP Sample Prep Kit (fkh-GAL4::UAS-rib-GFP and sage-GAL4::UAS-rib-GFP samples), the NuGen Ovation Ultralow Library System (btl-GAL4::UAS-rib-GFP and trh-GAL4::UAS-rib-GFP), or the KAPA DNA HyperPrep Library Prep Kit (independent replicate of btl-GAL4::UAS-rib-GFP). Illumina sequencing was performed according to the manufacturer’s specifications at the University of Minnesota Genomics Center (SG and Tracheal (Tr) dataset) or at the UCLA Technology Center for Genomics & Bioinformatics (Tr. dataset).
ChIP-seq data processing
Detailed methods for the sage-GAL4; UAS-rib-GFP and fkh-GAL4; UAS-rib-GFP ChIP-seq are available from a previous report (Loganathan et al., 2016). We used a publicly available ChIP-seq pipeline from ENCODE that uses irreproducible discovery rate (IDR) correction on replicates (Li et al., 2011) to identify robust binding peaks from each experiment and is filtered to retain only those peaks found with both SG drivers. Briefly, ChIP-seq peaks (binding sites) were called by comparing biological replicates to an input DNA control (from nonimmunoprecipitated chromatin). Sequenced DNA was processed using FASTQC (RRID: SCR_014583) and FASTQ Groomer (Blankenberg et al., 2010), and then mapped to the Drosophila melanogaster BDGP release 6 (dm6, August 2014) using Burrows-Wheeler Alignment tool with default parameters (dos Santos et al., 2015; Li and Durbin, 2009; St Pierre et al., 2014). Sequencing reads from biological replicates were combined after mapping using Picard (http://broadinstitute.github.io/picard), and the MACS (v2) peak caller was used to identify and score peaks (Zhang et al., 2008). Peak calling was carried out using the following MACS parameters (P value, 10−5; mfold, 10, 32), comparing ChIP DNA to matching input control samples. These previously archived data, including peaks and log10(likelihood ratio) signal files generated from MACS, yielded 494 Rib-bound genes, were used in Fig. 4 and Figs. S1, S2, S3, S4, and S5, and are accessible in GEO (GSE73781). Data were displayed in the Integrated Genomics Viewer (Broad Institute; RRID: SCR_011793). In gene browser tracks, the x axis is genomic position, and the y axis is log10-normalized fragments per kilobase mapped, as in Loganathan et al. (2016).
To obtain a set of more highly reproducible peaks, and thus reduce the noise and/or spurious peak calls from individual ChIP-seq replicates, the original ChIP-seq reads for the UAS-rib-GFP experiments were reprocessed and analyzed using a ChIP-seq pipeline featuring the more stringent IDR correction (Li et al., 2011). This yielded 436 peaks that mapped to 413 genes with RPGs recovered as the most enriched cluster. Briefly, the reads were first trimmed using Trimmomatic (Bolger et al., 2014) to remove sequencing adapters and low-quality reads. Mapping, alignment, peak-calling, and IDR thresholding (at P < 0.1) were then performed using the ENCODE ChIP-seq IDR pipeline (RRID: SCR_017237; https://github.com/ENCODE-DCC/chip-seq-pipeline2) for both Rib ChIP experiments. These sets of IDR ChIP-seq peaks for fkh- and sage-driven Rib::GFP, along with their IDR pipeline-generated pooled replicate fold-enrichment signal from MACS, were used in all other analyses and figures. Overlapping IDR peak regions from the Fkh- and Sage-driven Rib::GFP ChIP experiments were manually inspected against the Drosophila dm6 genome using the Integrative Genomics Viewer browser.
For the comparison of ChIP-seq experiments in Fig. 3 A, the SG Rib peak set was generated using the BEDTools (RRID: SCR_006646) intersect command (Quinlan and Hall, 2010) with the fkh- and sage-driven Rib::GFP ChIP-seq IDR peaks and control regions generated using BEDtools shuffle command with these peaks. All these peak sets and the fold-enrichment signal bigwig files were loaded into R with the rtracklayer package (Lawrence et al., 2009). The plyranges package (Lee et al., 2019) was then used to consolidate and summarize each region by its maximum fold-change signal, all of which were then plotted as hexbins with the ggplot2 package (https://joss.theoj.org/papers/10.21105/joss.01686).
For the tracheal cell–specific ChIP-seq, IDR peaks were generated using the same methodology as above with replicate datasets from trh-GAL4; UAS-rib-GFP and btl-GAL4; UAS-rib-GFP. Regions recovered from both IDR peak sets were then obtained using BEDTools and further refined by filtering for overlap with an independent, single-replicate btl-GAL4; UAS-rib-GFP experiment, to recover high-confidence binding events similar to those mentioned above for the SG dataset.
Peak-to-gene association and genomic feature analysis
The SG and tracheal Rib IDR peaks were associated with genes in R (RRID: SCR_001905) by the following method. First, the Drosophila genome (r6.33) was downloaded from FlyBase (ftp.flybase.net/genomes/Drosophila_melanogaster/dmel_r6.33_FB2020_02), loaded into R using the GenomicRanges and GenomicFeatures packages (Lawrence et al., 2013), and filtered to retain only protein-coding genes and their TSS coordinates. The rtracklayer and plyranges packages were then used to import the various peak files into R and “link” them to the nearest protein-coding gene. Peaks that overlapped the TSS of more than one gene were associated with all such overlapped genes. All such Rib-linked genes were used for the subsequent DAVID analysis. For the genomic feature analysis, the ChIPseeker (Yu et al., 2015) and ggplot2 packages were used to calculate and display overlap of peaks with various genomic features of the r6.33 Drosophila genome.
A list of all protein-coding genes in which the TSS is within 2 kb of an SG Rib peak were recorded, and this set was considered for motif analysis. All genes both significantly altered in rib by microarray and present in and at two statistical cutoffs, not included in the above gene set, were manually inspected for peak-like ChIP signals of log10(likelihood ratio) ≥4. Those genes with such a peak-like signal were added to the Rib targets gene set.
MEME analysis
MEME, a bioinformatics analysis tool available within the MEME Suite (RRID: SCR_001783), was used for RPG enhancer analysis on Rib-bound DNA sequence to identify frequently occurring motifs (Quinlan and Hall, 2010). MEME uses the expectation matrix (Em) algorithm for detection of motifs that have enriched instances in the input sequence sets compared with the genomic background. Among the top five ranking motifs from the Rib-bound sequences for RP genes in MEME, three were known for RP gene regulation and, hence, were investigated further in EMSAs; furthermore, their putative binding factors were tested in Rib co-IPs.
DAVID analysis
Functional clustering of Rib-bound genes from the ChIP-seq data were performed to place them under GO categories (GO terms) according to DAVID v6.8 (RRID: SCR_001881; Huang da et al., 2009a; Huang da et al., 2009b). The results were then imported into R, and the FlyBase gene IDs from each GO cluster were isolated and grouped by GO cluster. The FlyBase gene IDs were cross-referenced with the peak-to-gene association lists, and the distance from gene TSS to peak for all genes in each cluster was extracted. These peak-to-TSS distances (plus 1 bp for proper display on the log10-transformed y axis) were plotted by DAVID cluster as beeswarm and violin plots in Figs. 3 and 8 using ggplot2.
Microarray gene expression analysis
Three independent collections of stage 11–16 rib1/ribP7 embryos and three of WT embryos were isolated using a COPAS Select large particle FACS (Union Biometrica). Total RNA was isolated by Trizol extraction (15596026; Thermo Fisher Scientific) and cleaned up with the Qiagen RNeasy kit (74004). Total RNA (100 ng) was labeled and amplified using standard Affymetrix protocols. Three samples for each genotype were hybridized to Drosophila Genome 2.0 Chips. Scanned intensity values were normalized using RMA Partek software (RRID: SCR_01186; Irizarry et al., 2003a; Irizarry et al., 2003b), and statistical analyses were performed using the Spotfire software package (RRID: SCR_008858; TIBCO). Target genes were identified as those that were upregulated/downregulated (1.5-fold-change cutoff, P < 0.05) in rib1/ribP7 embryos compared with Oregon R controls (Loganathan et al., 2016).
RT-qPCR
RT-qPCR validation experiments to confirm microarray gene expression differences observed in WT versus rib embryos were conducted as in Loganathan et al. (2016). Statistical significance was determined by Mann–Whitney U tests comparing delta Cq values (Cikos et al., 2007). Data represent four technical and three biological replicates for each gene.
FISH
FISH experiments were performed according to Lécuyer et al. (2008). Briefly, digoxigenin (DIG)-labeled antisense probes to RpL11, RpL13, RpL27, RpS3A, and RpS23 were made from the following DGRC clones respectively: LD17235, LD24350, AT27980, LD08549, and GM14585. Embryos were fixed according to the above method for immunostaining. After a 5-min wash in PBT, embryos were treated with proteinase K (3 μg/ml) for 13 min at room temperature followed by 1-h treatment on ice. Proteinase digestion was stopped with glycine wash (2 mg/ml). Embryos were postfixed for 20 min in 4% formaldehyde and hybridized at 56°C overnight. FISH signal was developed with tyramide reaction after overnight incubation of embryos in sheep αDIG antibody (11222089001; Roche; 1:1,000) at 4°C, 1-h treatment at room temperature with αsheep biotin (1:500), and 45-min treatment with Vectastain AB solution (1:100).
S2R+ cell culture
S2R+ cells (RRID: CVCL_Z831; gift from E. Chen, UT Southwestern, Dallas, TX) were cultured in Schneider’s medium (21-720-024; Gibco) supplemented with 10% FBS (Gibco) and penicillin/streptomycin (Sigma-Aldrich). Effectene (301425; Qiagen) was used to transfect cells to express proteins from UAS-rib and UAS-rib-GFP plasmids driven by Ubiquitin-GAL4 according to the manufacturer’s protocol.
Co-IP and Western blot
After harvesting transfected S2R+ cells by centrifugation, they were washed with cold PBS and lysed in Lysis buffer (10 mM Tris, pH 7.4, 150 mM NaCl, 1 mM EDTA, 1% Triton X-100, and 0.5% NP-40) containing a protease/phosphatase inhibitor cocktail. After centrifugation, supernatants were incubated with the appropriate antibodies (1:450)—Trf2, Dref, or M1BP—at 4°C for 2–3 h. Protein A/G agarose resin (20423; Pierce) was used to precipitate the antibodies. Immunoprecipitated proteins were analyzed by SDS-PAGE. Antisera were used for Western blots at the following final concentrations: rabbit αTRF2, gift from J. Kadonaga, University of California, San Diego, San Diego, CA (1:2,000); rabbit αM1BP, gift from D. Gilmour, Penn State University, State College, PA (1:5,000); rabbit αDREF, gift from M. Yamaguchi, Kyoto Institute of Technology, Kyoto, Japan (1:5,000); guinea pig αRib (1:2,000); and rabbit αGFP (1:5,000). HRP-conjugated secondary antibodies were used at the following final concentrations: αGuinea pig (1:5,000) and αrabbit (1:10,000).
EMSA
The sequence for Rib-PSQ DNA binding domain, the same as that used on the previous bacterial one-hybrid experiment (Noyes et al., 2008), was subcloned into BamHI sites of the pGEX-KG vector (ATCC). Recombinant GST-tagged Rib-PSQ and GST alone were expressed in E. coli, and the IPTG-induced (1-mM) soluble fractions of the lysates were used for EMSAs. Recombinant full-length Rib, which was purified for antiserum production as mentioned above, was also used in the EMSAs. Purified recombinant CrebA was produced as previously reported (Fox et al., 2010). For running EMSAs, plus and minus strand oligonucleotides of 50 bases (for RPGs) and ≈30 bases (for P24.1 and TSN-2) were designed and synthesized (Integrated DNA Technologies). Both strands were 3′ end–labeled with Biotin-11-UTP using terminal deoxynucleotidyl transferase according to the manufacturer’s protocol. Labeled strands were annealed by heating to 95°C for 5 min and then cooling to room temperature. Mutant binding site oligonucleotides were annealed under the same conditions. Rib-FL and CrebA proteins were expressed and purified in bacteria and their concentration determined by nanodrop spectrophotometer (Thermo Fisher Scientific). DNA binding reactions were performed according to LightShift EMSA Optimization and Control Kit protocol (Pierce Biotechnology; 20148; Thermo Fisher Scientific). Binding reactions—using 2 μl of GST (4.6 μg/μl), GST-Rib-PSQ (4.6 μg/μl), full-length Rib (4.6 μg/μl), and CrebA (0.5 μg/μl) as starter concentrations (+) with RPG enhancer oligonucleotides (5 nM)—were run on a 6% native polyacrylamide gel at 100 V for ≈1.5 h (4°C), transferred overnight onto Biodyne B nylon membranes (Thermo Fisher Scientific) at 30 V (4°C), and detected using the chemiluminescent nucleic acid detection module (Pierce Biotechnology; Thermo Fisher Scientific).
Imaging
DIC images were obtained on an Axiophot microscope (Zeiss) equipped with ProgRes CapturePro (Jenoptik). Fluorescent images were obtained on an LSM 700 Meta confocal microscope (Zeiss) equipped with Zen software (Zeiss). Confocal micrographs were acquired at 20°C using either 20× or 63× (oil) objectives. Electron micrographs were obtained on a Phillips CM120 transmission electron microscope. All images for the FISH experiments were acquired at ≤6% laser intensity per channel, i.e., the threshold at which the probe signals became detectable in the rib mutant embryos. For a subset of RPG probes, however, the laser intensity was reduced below the 6% threshold for both the WT and rescue embryos because of their excessive signal intensity.
Quantification and statistical analysis
3D rendering of whole SGs, individual SG cells, individual SG nuclei, and whole embryos for volume determination
Confocal image sections of embryonic SG cells were manually segmented and volume-rendered using the Surfaces module of Imaris v7.7.2 (RRID: SCR_007370). No preprocessing was performed on the images, and each was acquired as 0.5-µm-spaced SG Z-stacks. To quantify individual cell volume in both WT and rib mutant SG cells, we segmented images of secretory cells stained with α-MIPP1 (a membrane marker; Cheng and Andrew, 2015) from early and late stages of tubulogenesis. To allow for complete 3D cell surface rendering, only SG cells showing relatively uniform membrane staining were analyzed. Individual cell membrane or nuclear DNA boundaries from Z-stacks were marked for 3D surface creation and volume measurements. The following analysis routine was followed: Surpass > Add surfaces > Skip automatic creation, edit manually > Contour (board, XY; resolution, Auto; visibility, none) > Mode (drawing mode) > Insert vertex after 300 ms > Channel selection (all visible channels). After manual segmentation using the Draw option, surfaces were created using the Create Surface option. Cell volumes were recorded from the Statistics > Selection > Specific values menu. Cells were colored using the Color > Color Type > Base > Diffusion option. The surfaces module of Imaris was also used to 3D render whole embryos manually and record their volumes. The same analysis routine that was used for cell volume was also followed for nuclear volume measurements by using the information from the DAPI channel Z-stacks from stage 15 and 16 embryos. To produce video files of volume-rendered cells, the animation module was used by adding three keyframes to record each animation.
Quantification of P-body size
SG P-body area was measured with the Volocity 3D image analysis software (RRID: SCR_002668). Maximum-intensity projected images were segmented for P-body puncta using the Find Objects option. The ROI was manually demarcated by outlining the SG, based on the location of Sage-positive secretory cells, to exclude measurements outside the gland. Offset thresholding on the histogram was adjusted on a sample-to-sample basis to eliminate background staining from being included in the measurements.
Ranking of FISH images
Randomly shuffled images were ranked according to their FISH probe intensity levels by six members of the Andrew laboratory who were blind to the identity of experimental specimens. Five images per experimental group (WT, rib mutant, and rib rescue) were included in the ranking analysis and were scored on a scale of 1 (low signal) to 15 (high signal) according to the staining intensity. Similar scoring was also done on the DAPI-stained images of corresponding SGs. SuperPlots were used for visualization of scores, with the result from each observer serving as a replicate (Lord et al., 2020) to reveal any orderly or disorderly grouping of ranks between the FISH probe intensity and the corresponding DAPI intensity of specimens in the three experimental groups.
Graphs and statistical analysis
GraphPad Prism software (RRID: SCR_002798) was used to generate graphs, and details of statistical analysis are provided in the figure legends.
Resource availability
Requests for resources and reagents generated in this study should be addressed to Deborah J. Andrew (dandrew@jhmi.edu).
High-throughput datasets generated for this study (GSE72598, GSE73781, and GSE181361) are freely accessible at the Gene Expression Omnibus (https://www.ncbi.nlm.nih.gov/geo/).
Online supplemental material
Fig. S1 (related to Fig. 4) shows Rib-bound RPG tracks from ChIP-seq experiments for RpLPO through RpL12. Fig. S2 (related to Fig. 4) shows Rib-bound RPG tracks from ChIP-seq experiments for RpL13 through RpL23A. Fig. S3 (related to Fig. 4) shows Rib-bound RPG tracks from ChIP-seq experiments for RpL24 through RpL38. Fig. S4 (related to Fig. 4) shows Rib-bound RPG tracks from ChIP-seq experiments for RpL39 through RpS14a. Fig. S5 (related to Fig. 4) shows Rib-bound RPG tracks from ChIP-seq experiments for RpS14b through Vig2. Fig. S6 (related to Fig. 4) shows a schematic of the RPG loci in the Drosophila genome with reference to their Rib-bound or unbound status and the RPs in the context of functional ribosomal subunits with reference to their Rib-bound or unbound status. Fig. S7 (related to Fig. 5) shows the DAPI-channel images corresponding to the RPG SG FISH data. Fig. S8 (related to Fig. 6) provides Rib-bound sequences within RPG enhancers. Fig. S9 (related to Fig. 6) shows EMSAs with additional RPG enhancers. Videos 1, 2, 3, 4, 5, 6, 7, 8, and 9 (related to Figs. 4 and 7) show the 3D geometry of cell shapes from the embryonic SG of the following genotypes: WT, ribP7/rib1, knockdowns of Trf2, M1BP, and Dref RNAi. Table S1 (related to Fig. 3) lists the top 10 annotation clusters with associated enrichment scores and P-values from DAVID analysis of genes bound by Rib in the SG. Table S2 (related to Fig. 4) lists RPGs expressed in third instar larval (L3) and white prepupal (WPP) SGs showing values from Rib-binding data from embryonic tissue-specific ChIP-seq (yes or no, for above or below binding likelihood threshold), their fold changes in rib versus WT whole embryonic RNA microarray analyses, as well as the overall transcript levels in the SG from BDGP-generated RNA-seq data (kindly provided by Sue Celnicker, Lawrence Berkeley National Laboratory, Berkeley, CA). Table S3 (related to Fig. 4) lists primers used for RT-qPCR experiments. Table S4 (related to Fig. 6) lists oligonucleotides used for EMSA experiments. Table S5 (related to Fig. 8) lists the top 10 annotation clusters with associated enrichment scores and P values from DAVID analysis of genes bound by Rib in the trachea. Table S6 (related to Fig. 8) lists Rib-bound tracheal genes annotated by three or more cell growth-related GO terms. Data S1 contains files for EMSAs (related to Figs. 6 and S9), and gel cutouts (related to Fig. 7) are provided. MS Excel spreadsheets with cell volume data (related to Figs. 4 and 7) are also provided.
Figure S3.
Binding tracks from Rib-GFP ChIP-seq for all SG-expressed RPGs. (Related to Fig. 4.) fkh-GAL4 > UAS-rib-GFP tracks are in red; sage-GAL4 > UAS-rib-GFP tracks are in green. The colored circles correspond to the individual track colors when either of the binding peaks reaches the enrichment threshold of log10 binding likelihood ≥4. In cases where both the binding peaks meet the enrichment threshold, the circles are yellow. In cases where both peak thresholds are <4, the circles are unfilled. Note that even when the enrichment threshold was <4, binding signals for the region shown are often highest at the RPG TSS.
Figure S4.
Binding tracks from Rib-GFP ChIP-seq for all SG-expressed RPGs. (Related to Fig. 4.) fkh-GAL4 > UAS-rib-GFP tracks are in red; sage-GAL4 > UAS-rib-GFP tracks are in green. The colored circles correspond to the individual track colors when either of the binding peaks reaches the enrichment threshold of log10 binding likelihood ≥4. In cases where both the binding peaks meet the enrichment threshold, the circles are yellow. In cases where both peak thresholds are <4, the circles are unfilled. Note that even when the enrichment threshold was <4, binding signals for the region shown are often highest at the RPG TSS.
Figure S5.
Binding tracks from Rib-GFP ChIP-seq for all SG-expressed RPGs. (Related to Fig. 4.) fkh-GAL4 > UAS-rib-GFP tracks are in red; sage-GAL4 > UAS-rib-GFP tracks are in green. The colored circles correspond to the individual track colors when either of the binding peaks reaches the enrichment threshold of log10 binding likelihood ≥4. In cases where both the binding peaks meet the enrichment threshold, the circles are yellow. In cases where both peak thresholds are <4, the circles are unfilled. Note that even when the enrichment threshold was <4, binding signals for the region shown are often highest at the RPG TSS. Source data are available for this figure: SourceData F5.
Supplementary Material
(Related to Fig. 3.) List of the top 10 annotation clusters with associated enrichment scores and P values from DAVID analysis of genes bound by Rib in the SG.
(Related to Fig. 4.) List of RPGs expressed in third-instar larval (L3) and white prepupal (WPP) SGs showing values from Rib-binding data from embryonic tissue–specific ChIP-seq (yes or no, for above or below binding likelihood threshold), their fold-changes in rib versus WT whole embryonic RNA microarray analyses, and the overall transcript levels in the SG from BDGP-generated RNA-seq data (kindly provided by Sue Celnicker).
(Related to Fig. 4.) List of primers used for RT-qPCR experiments.
(Related to Fig. 6.) List of oligonucleotides used for EMSA experiments.
(Related to Fig. 8.) List of the top 10 annotation clusters with associated enrichment scores and P values from DAVID analysis of genes bound by Rib in the trachea.
(Related to Fig. 8.) List of Rib-bound tracheal genes annotated by three or more cell growth-related GO terms.
contains files for EMSAs (related to Figs. 6 and S9), and gel cutouts (related to Fig. 7) are provided. MS Excel spreadsheets with cell volume data (related to Figs. 4 and 7) are also provided.
is the source file for Fig. 6.
is the source file for Fig. 7.
is the source file for Fig. S5.
Acknowledgments
The authors thank M. Chiu, K. Kim, S. Lannon, and M. Luchetti for ranking FISH images; C. Talbot for assistance with the volcano plot; S. Celniker for sharing the RNA-seq data of SG-expressed RPGs; S. Beckendorf, J. Kadonaga, D. Gilmour, M. Yamaguchi, M. Siomi, D. Cavener, and K. White for sharing antibodies; C. Nusslein-Volhard (Max Planck Institute of Developmental Biology, Munich, Germany), M. Krasnow (Stanford University School of Medicine, Palo Alto, CA), and S. Hayashi (RIKEN Center for Developmental Biology, Kobe, Japan) for sharing fly lines; E. Chen for sharing the S2R+ cell line; D. Barrick, J. Berger, G. Seydoux, and A. Deb Roy for their comments to help improve the manuscript; FlyBase, BDGP, BDSC, VDRC, and DSHB for curation and distribution of valuable reagents and resources for the fly community; staff from the Johns Hopkins Medical Institutions School of Medicine microscopy core and the transcriptomics and deep sequencing core for assistance.
This work was supported by National Institutes of Health grants R01DE013899 and R56DE029450 (D.J. Andrew) and R35GM119553 (M. Slattery).
The authors declare no competing financial interests.
Author contributions: Conceptualization and Experiment Design: R. Loganathan, D.J. Andrew; Investigation: R. Loganathan, D.J. Andrew, M. Slattery, H. Chiu, Y. Wu, J.H. Kim, M.B. Wells; Formal Analysis: R. Loganathan, D.C. Levings, M.B. Wells, M. Slattery, D.J. Andrew; Writing—original draft: R. Loganathan and D.J. Andrew; Writing—review & editing: R. Loganathan, D.J. Andrew, D.C. Levings, J.H. Kim, M.B. Wells, M. Slattery; Funding Acquisition: D.J. Andrew, M. Slattery; Supervision: D.J. Andrew.
References
- Abrams, E.W., and Andrew D.J.. 2005. CrebA regulates secretory activity in the Drosophila salivary gland and epidermis. Development. 132:2743–2758. 10.1242/dev.01863 [DOI] [PubMed] [Google Scholar]
- Abrams, E.W., Mihoulides W.K., and Andrew D.J.. 2006. Fork head and Sage maintain a uniform and patent salivary gland lumen through regulation of two downstream target genes, PH4alphaSG1 and PH4alphaSG2. Development. 133:3517–3527. 10.1242/dev.02525 [DOI] [PubMed] [Google Scholar]
- Andrew, D.J., Horner M.A., Petitt M.G., Smolik S.M., and Scott M.P.. 1994. Setting limits on homeotic gene function: Restraint of Sex combs reduced activity by teashirt and other homeotic genes. EMBO J. 13:1132–1144 [DOI] [PMC free article] [PubMed] [Google Scholar]
- Baena-Lopez, L.A., Baonza A., and Garcia-Bellido A.. 2005. The orientation of cell divisions determines the shape of Drosophila organs. Curr. Biol. 15:1640–1644. 10.1016/j.cub.2005.07.062 [DOI] [PubMed] [Google Scholar]
- Bailey, T.L., and Elkan C.. 1994. Fitting a mixture model by expectation maximization to discover motifs in biopolymers. Proc. Int. Conf. Intell. Syst. Mol. Biol. 2:28–36 [PubMed] [Google Scholar]
- Baker, N.E. 2013. Developmental regulation of nucleolus size during Drosophila eye differentiation. PLoS One. 8:e58266. 10.1371/journal.pone.0058266 [DOI] [PMC free article] [PubMed] [Google Scholar]
- Baker, N.E. 2020. Emerging mechanisms of cell competition. Nat. Rev. Genet. 21:683–697. 10.1038/s41576-020-0262-8 [DOI] [PMC free article] [PubMed] [Google Scholar]
- Baumann, D.G., and Gilmour D.S.. 2017. A sequence-specific core promoter-binding transcription factor recruits TRF2 to coordinately transcribe ribosomal protein genes. Nucleic Acids Res. 45:10481–10491. 10.1093/nar/gkx676 [DOI] [PMC free article] [PubMed] [Google Scholar]
- Blankenberg, D., Gordon A., Von Kuster G., Coraor N., Taylor J., Nekrutenko A., and Galaxy T.. 2010. Manipulation of FASTQ data with galaxy. Bioinformatics. 26:1783–1785. 10.1093/bioinformatics/btq281 [DOI] [PMC free article] [PubMed] [Google Scholar]
- Blankenship, J.T., Backovic S.T., Sanny J.S., Weitz O., and Zallen J.A.. 2006. Multicellular rosette formation links planar cell polarity to tissue morphogenesis. Dev. Cell. 11:459–470. 10.1016/j.devcel.2006.09.007 [DOI] [PubMed] [Google Scholar]
- Bolger, A.M., Lohse M., and Usadel B.. 2014. Trimmomatic: A flexible trimmer for Illumina sequence data. Bioinformatics. 30:2114–2120. 10.1093/bioinformatics/btu170 [DOI] [PMC free article] [PubMed] [Google Scholar]
- Booth, A.J.R., Blanchard G.B., Adams R.J., and Roper K.. 2014. A dynamic microtubule cytoskeleton directs medial actomyosin function during tube formation. Dev. Cell. 29:562–576. 10.1016/j.devcel.2014.03.023 [DOI] [PMC free article] [PubMed] [Google Scholar]
- Bradley, P.L., and Andrew D.J.. 2001. Ribbon encodes a novel BTB/POZ protein required for directed cell migration in Drosophila melanogaster. Development. 128:3001–3015 [DOI] [PubMed] [Google Scholar]
- Bradley, P.L., Myat M.M., Comeaux C.A., and Andrew D.J.. 2003. Posterior migration of the salivary gland requires an intact visceral mesoderm and integrin function. Dev. Biol. 257:249–262. 10.1016/s0012-1606(03)00103-9 [DOI] [PubMed] [Google Scholar]
- Campos-Ortega, J., and Hartenstein V.. 1997. The Embryonic Development of Drosophila melanogaster. Springer, Germany. [Google Scholar]
- Chen, J., Sayadian A.C., Lowe N., Lovegrove H.E., and St Johnston D.. 2018. An alternative mode of epithelial polarity in the Drosophila midgut. PLoS Biol. 16:e3000041. 10.1371/journal.pbio.3000041. [DOI] [PMC free article] [PubMed] [Google Scholar]
- Cheng, Y.L., and Andrew D.J.. 2015. Extracellular Mipp1 activity confers migratory advantage to epithelial cells during collective migration. Cell Rep. 13:2174–2188. 10.1016/j.celrep.2015.10.071 [DOI] [PMC free article] [PubMed] [Google Scholar]
- Cheshire, A.M., Kerman B.E., Zipfel W.R., Spector A.A., and Andrew D.J.. 2008. Kinetic and mechanical analysis of live tube morphogenesis. Dev. Dyn. 237:2874–2888. 10.1002/dvdy.21709 [DOI] [PMC free article] [PubMed] [Google Scholar]
- Chung, S., Hanlon C.D., and Andrew D.J.. 2014. Building and specializing epithelial tubular organs: The Drosophila salivary gland as a model system for revealing how epithelial organs are specified, form and specialize. Wiley Interdiscip. Rev. Dev. Biol. 3:281–300. 10.1002/wdev.140 [DOI] [PMC free article] [PubMed] [Google Scholar]
- Chung, S., Kim S., and Andrew D.J.. 2017. Uncoupling apical constriction from tissue invagination. Elife. 6:e22235. 10.7554/eLife.22235 [DOI] [PMC free article] [PubMed] [Google Scholar]
- Cikos, S., Bukovska A., and Koppel J.. 2007. Relative quantification of mRNA: Comparison of methods currently used for real-time PCR data analysis. BMC Mol. Biol. 8:113. 10.1186/1471-2199-8-113 [DOI] [PMC free article] [PubMed] [Google Scholar]
- Concha, M.L., and Adams R.J.. 1998. Oriented cell divisions and cellular morphogenesis in the zebrafish gastrula and neurula: A time-lapse analysis. Development. 125:983–994 [DOI] [PubMed] [Google Scholar]
- Diaz-de-la-Loza, M.D., Ray R.P., Ganguly P.S., Alt S., Davis J.R., Hoppe A., Tapon N., Salbreux G., and Thompson B.J.. 2018. Apical and basal matrix remodeling control epithelial morphogenesis. Dev. Cell. 46:23–39.e5. 10.1016/j.devcel.2018.06.006 [DOI] [PMC free article] [PubMed] [Google Scholar]
- dos Santos, G., Schroeder A.J., Goodman J.L., Strelets V.B., Crosby M.A., Thurmond J., Emmert D.B., Gelbart W.M., and FlyBase C.. 2015. FlyBase: Introduction of the Drosophila melanogaster release 6 reference genome assembly and large-scale migration of genome annotations. Nucleic Acids Res. 43:D690–D697. 10.1093/nar/gku1099 [DOI] [PMC free article] [PubMed] [Google Scholar]
- Elateri, I., Muller-Weeks S., and Caradonna S.. 2003. The transcription factor, NFI/CTF plays a positive regulatory role in expression of the hSMUG1 gene. DNA Repair (Amst). 2:1371–1385. 10.1016/j.dnarep.2003.08.009. [DOI] [PubMed] [Google Scholar]
- Fox, R.M., Hanlon C.D., and Andrew D.J.. 2010. The CrebA/Creb3-like transcription factors are major and direct regulators of secretory capacity. J. Cell Biol. 191:479–492. 10.1083/jcb.201004062 [DOI] [PMC free article] [PubMed] [Google Scholar]
- Fox, R.M., Vaishnavi A., Maruyama R., and Andrew D.J.. 2013. Organ-specific gene expression: The bHLH protein sage provides tissue specificity to Drosophila FoxA. Development. 140:2160–2171. 10.1242/dev.092924 [DOI] [PMC free article] [PubMed] [Google Scholar]
- Grewal, S.S., Li L., Orian A., Eisenman R.N., and Edgar B.A.. 2005. Myc-dependent regulation of ribosomal RNA synthesis during Drosophila development. Nat. Cell Biol. 7:295–302. 10.1038/ncb1223 [DOI] [PubMed] [Google Scholar]
- Gronostajski, R.M. 2000. Roles of the NFI/CTF gene family in transcription and development. Gene. 249:31–45. 10.1016/s0378-1119(00)00140-2. [DOI] [PubMed] [Google Scholar]
- Hartenstein, V., and Posakony J.W.. 1990. Sensillum development in the absence of cell division: The sensillum phenotype of the Drosophila mutant string. Dev. Biol. 138:147–158. 10.1016/0012-1606(90)90184-k [DOI] [PubMed] [Google Scholar]
- Henderson, K.D., and Andrew D.J.. 2000. Regulation and function of Scr, exd, and hth in the Drosophila salivary gland. Dev. Biol. 217:362–374. 10.1006/dbio.1999.9560 [DOI] [PubMed] [Google Scholar]
- Hirose, F., Yamaguchi M., Handa H., Inomata Y., and Matsukage A.. 1993. Novel 8-base pair sequence (Drosophila DNA replication-related element) and specific binding factor involved in the expression of Drosophila genes for DNA polymerase alpha and proliferating cell nuclear antigen. J. Biol. Chem. 268:2092–2099 [PubMed] [Google Scholar]
- Hirose, F., Yamaguchi M., Kuroda K., Omori A., Hachiya T., Ikeda M., Nishimoto Y., and Matsukage A.. 1996. Isolation and characterization of cDNA for DREF, a promoter-activating factor for Drosophila DNA replication-related genes. J. Biol. Chem. 271:3930–3937. 10.1074/jbc.271.7.3930 [DOI] [PubMed] [Google Scholar]
- Hochheimer, A., Zhou S., Zheng S., Holmes M.C., and Tjian R.. 2002. TRF2 associates with DREF and directs promoter-selective gene expression in Drosophila. Nature. 420:439–445. 10.1038/nature01167 [DOI] [PubMed] [Google Scholar]
- Huang da, W., Sherman B.T., and Lempicki R.A.. 2009a. Bioinformatics enrichment tools: Paths toward the comprehensive functional analysis of large gene lists. Nucleic Acids Res. 37:1–13. 10.1093/nar/gkn923 [DOI] [PMC free article] [PubMed] [Google Scholar]
- Huang da, W., Sherman B.T., and Lempicki R.A.. 2009b. Systematic and integrative analysis of large gene lists using DAVID bioinformatics resources. Nat. Protoc. 4:44–57. 10.1038/nprot.2008.211 [DOI] [PubMed] [Google Scholar]
- Ingelfinger, D., Arndt-Jovin D.J., Luhrmann R., and Achsel T.. 2002. The human LSm1-7 proteins colocalize with the mRNA-degrading enzymes Dcp1/2 and Xrnl in distinct cytoplasmic foci. RNA. 8:1489–1501 [PMC free article] [PubMed] [Google Scholar]
- Irizarry, R.A., Bolstad B.M., Collin F., Cope L.M., Hobbs B., and Speed T.P.. 2003a. Summaries of Affymetrix GeneChip probe level data. Nucleic Acids Res. 31:e15. 10.1093/nar/gng015 [DOI] [PMC free article] [PubMed] [Google Scholar]
- Irizarry, R.A., Hobbs B., Collin F., Beazer-Barclay Y.D., Antonellis K.J., Scherf U., and Speed T.P.. 2003b. Exploration, normalization, and summaries of high density oligonucleotide array probe level data. Biostatistics. 4:249–264. 10.1093/biostatistics/4.2.249 [DOI] [PubMed] [Google Scholar]
- Irvine, K.D., and Harvey K.F.. 2015. Control of organ growth by patterning and hippo signaling in Drosophila. Cold Spring Harb Perspect. Biol. 7:a019224. 10.1101/cshperspect.a019224 [DOI] [PMC free article] [PubMed] [Google Scholar]
- Jack, J., and Myette G.. 1997. The genes raw and ribbon are required for proper shape of tubular epithelial tissues in Drosophila. Genetics. 147:243–253. 10.1093/genetics/147.1.243 [DOI] [PMC free article] [PubMed] [Google Scholar]
- Johnson, D.M., Wells M.B., Fox R., Lee J.S., Loganathan R., Levings D., Bastien A., Slattery M., and Andrew D.J.. 2020. CrebA increases secretory capacity through direct transcriptional regulation of the secretory machinery, a subset of secretory cargo, and other key regulators. Traffic. 21:560–577. 10.1111/tra.12753 [DOI] [PMC free article] [PubMed] [Google Scholar]
- Johnston, L.A., Prober D.A., Edgar B.A., Eisenman R.N., and Gallant P.. 1999. Drosophila myc regulates cellular growth during development. Cell. 98:779–790. 10.1016/s0092-8674(00)81512-3 [DOI] [PMC free article] [PubMed] [Google Scholar]
- Jorgensen, P., Rupes I., Sharom J.R., Schneper L., Broach J.R., and Tyers M.. 2004. A dynamic transcriptional network communicates growth potential to ribosome synthesis and critical cell size. Genes Dev. 18:2491–2505. 10.1101/gad.1228804 [DOI] [PMC free article] [PubMed] [Google Scholar]
- Keller, R.E. 1980. The cellular basis of epiboly: An SEM study of deep-cell rearrangement during gastrulation in Xenopus laevis. J. Embryol. Exp. Morphol. 60:201–234 [PubMed] [Google Scholar]
- Kerman, B.E., Cheshire A.M., Myat M.M., and Andrew D.J.. 2008. Ribbon modulates apical membrane during tube elongation through Crumbs and Moesin. Dev. Biol. 320:278–288. 10.1016/j.ydbio.2008.05.541 [DOI] [PMC free article] [PubMed] [Google Scholar]
- Khetchoumian, K., Balsalobre A., Mayran A., Christian H., Chenard V., St-Pierre J., and Drouin J.. 2019. Pituitary cell translation and secretory capacities are enhanced cell autonomously by the transcription factor Creb3l2. Nat. Commun. 10:3960. 10.1038/s41467-019-11894-3 [DOI] [PMC free article] [PubMed] [Google Scholar]
- Kudron, M.M., Victorsen A., Gevirtzman L., Hillier L.W., Fisher W.W., Vafeados D., Kirkey M., Hammonds A.S., Gersch J., Ammouri H., et al. 2018. The ModERN resource: Genome-Wide binding profiles for hundreds of Drosophila and Caenorhabditis elegans transcription factors. Genetics. 208:937–949. 10.1534/genetics.117.300657 [DOI] [PMC free article] [PubMed] [Google Scholar]
- Lawrence, M., Gentleman R., and Carey V.. 2009. rtracklayer: An R package for interfacing with genome browsers. Bioinformatics. 25:1841–1842. 10.1093/bioinformatics/btp328 [DOI] [PMC free article] [PubMed] [Google Scholar]
- Lawrence, M., Huber W., Pages H., Aboyoun P., Carlson M., Gentleman R., Morgan M.T., and Carey V.J.. 2013. Software for computing and annotating genomic ranges. PLoS Comput. Biol. 9:e1003118. 10.1371/journal.pcbi.1003118 [DOI] [PMC free article] [PubMed] [Google Scholar]
- Lécuyer, E., Parthasarathy N., and Krause H.M.. 2008. Fluorescent in situ hybridization protocols in Drosophila embryos and tissues. Methods Mol. Biol. 420:289–302. 10.1007/978-1-59745-583-1_18 [DOI] [PubMed] [Google Scholar]
- Lee, S., Cook D., and Lawrence M.. 2019. plyranges: A grammar of genomic data transformation. Genome Biol. 20:4. 10.1186/s13059-018-1597-8 [DOI] [PMC free article] [PubMed] [Google Scholar]
- Li, H., and Durbin R.. 2009. Fast and accurate short read alignment with Burrows-Wheeler transform. Bioinformatics. 25:1754–1760. 10.1093/bioinformatics/btp324 [DOI] [PMC free article] [PubMed] [Google Scholar]
- Li, Q., Brown J.B., Huang H., and Bickel P.J.. 2011. Measuring reproducibility of high-throughput experiments. Ann. Appl. Stat. 5:1752–1779. 10.1214/11-aoas466 [DOI] [Google Scholar]
- Loganathan, R., Lee J.S., Wells M.B., Grevengoed E., Slattery M., and Andrew D.J.. 2016. Ribbon regulates morphogenesis of the Drosophila embryonic salivary gland through transcriptional activation and repression. Dev. Biol. 409:234–250. 10.1016/j.ydbio.2015.10.016 [DOI] [PMC free article] [PubMed] [Google Scholar]
- Lord, S.J., Velle K.B., Mullins R.D., and Fritz-Laylin L.K.. 2020. SuperPlots: Communicating reproducibility and variability in cell biology. J. Cell Biol. 219:e202001064. 10.1083/jcb.202001064 [DOI] [PMC free article] [PubMed] [Google Scholar]
- Marinho, J., Casares F., and Pereira P.S.. 2011. The Drosophila Nol12 homologue viriato is a dMyc target that regulates nucleolar architecture and is required for dMyc-stimulated cell growth. Development. 138:349–357. 10.1242/dev.054411 [DOI] [PubMed] [Google Scholar]
- Maruyama, R., Grevengoed E., Stempniewicz P., and Andrew D.J.. 2011. Genome-wide analysis reveals a major role in cell fate maintenance and an unexpected role in endoreduplication for the Drosophila FoxA gene Fork head. PLoS One. 6:e20901. 10.1371/journal.pone.0020901 [DOI] [PMC free article] [PubMed] [Google Scholar]
- Marygold, S.J., Roote J., Reuter G., Lambertsson A., Ashburner M., Millburn G.H., Harrison P.M., Yu Z., Kenmochi N., Kaufman T.C., et al. 2007. The ribosomal protein genes and Minute loci of Drosophila melanogaster. Genome Biol. 8:R216. 10.1186/gb-2007-8-10-r216 [DOI] [PMC free article] [PubMed] [Google Scholar]
- Morata, G., and Ripoll P.. 1975. Minutes: Mutants of Drosophila autonomously affecting cell division rate. Dev. Biol. 42:211–221. 10.1016/0012-1606(75)90330-9 [DOI] [PubMed] [Google Scholar]
- Myat, M.M., and Andrew D.J.. 2000a. Fork head prevents apoptosis and promotes cell shape change during formation of the Drosophila salivary glands. Development. 127:4217–4226 [DOI] [PubMed] [Google Scholar]
- Myat, M.M., and Andrew D.J.. 2000b. Organ shape in the Drosophila salivary gland is controlled by regulated, sequential internalization of the primordia. Development. 127:679–691 [DOI] [PubMed] [Google Scholar]
- Myat, M.M., and Andrew D.J.. 2002. Epithelial tube morphology is determined by the polarized growth and delivery of apical membrane. Cell. 111:879–891. 10.1016/s0092-8674(02)01140-6 [DOI] [PubMed] [Google Scholar]
- Negre, N., Lavrov S., Hennetin J., Bellis M., and Cavalli G.. 2006. Mapping the distribution of chromatin proteins by ChIP on chip. Methods Enzymol. 410:316–341. 10.1016/S0076-6879(06)10015-4 [DOI] [PubMed] [Google Scholar]
- Noyes, M.B., Meng X., Wakabayashi A., Sinha S., Brodsky M.H., and Wolfe S.A.. 2008. A systematic characterization of factors that regulate Drosophila segmentation via a bacterial one-hybrid system. Nucleic Acids Res. 36:2547–2560. 10.1093/nar/gkn048 [DOI] [PMC free article] [PubMed] [Google Scholar]
- Nusslein-Volhard, C., Wieschaus E., and Kluding H.. 1984. Mutations affecting the pattern of the larval cuticle in Drosophila melanogaster: I. Zygotic loci on the second chromosome. Wilehm Roux Arch. Dev. Biol. 193:267–282. 10.1007/BF00848156 [DOI] [PubMed] [Google Scholar]
- O’Farrell, P. 2004. How Metazoans Reach Their Full Size: The Natural History of Bigness. Cold Spring Harbor Laboratory Press, Cold Spring Harbor. [Google Scholar]
- Ohler, U., Liao G.C., Niemann H., and Rubin G.M.. 2002. Computational analysis of core promoters in the Drosophila genome. Genome Biol. 3:RESEARCH0087. 10.1186/gb-2002-3-12-research0087 [DOI] [PMC free article] [PubMed] [Google Scholar]
- Orr-Weaver, T.L. 2015. When bigger is better: The role of polyploidy in organogenesis. Trends Genet. 31:307–315. 10.1016/j.tig.2015.03.011 [DOI] [PMC free article] [PubMed] [Google Scholar]
- Paluch, E., and Heisenberg C.P.. 2009. Biology and physics of cell shape changes in development. Curr. Biol. 19:R790–R799. 10.1016/j.cub.2009.07.029 [DOI] [PubMed] [Google Scholar]
- Panzer, S., Weigel D., and Beckendorf S.K.. 1992. Organogenesis in Drosophila melanogaster: Embryonic salivary gland determination is controlled by homeotic and dorsoventral patterning genes. Development. 114:49–57 [DOI] [PubMed] [Google Scholar]
- Parker, R., and Sheth U.. 2007. P bodies and the control of mRNA translation and degradation. Mol. Cell. 25:635–646. 10.1016/j.molcel.2007.02.011. [DOI] [PubMed] [Google Scholar]
- Pederson, T. 2011. The nucleolus. Cold Spring Harb Perspect. Biol. 3:a000638. 10.1101/cshperspect.a000638. [DOI] [PMC free article] [PubMed] [Google Scholar]
- Peng, H.W., Slattery M., and Mann R.S.. 2009. Transcription factor choice in the Hippo signaling pathway: Homothorax and yorkie regulation of the microRNA bantam in the progenitor domain of the Drosophila eye imaginal disc. Genes Dev. 23:2307–2319. 10.1101/gad.1820009 [DOI] [PMC free article] [PubMed] [Google Scholar]
- Poulson, D.F. 1937. The Embryonic Development of Drosophila melanogaster. Actual Scient. [DOI] [PMC free article] [PubMed] [Google Scholar]
- Poulson, D.F. 1950. Histogenesis, Organogenesis and Differentiation in the Embryo of Drosophila melanogaster Meigen. Wiley, New York. [Google Scholar]
- Quinlan, A.R., and Hall I.M.. 2010. BEDTools: A flexible suite of utilities for comparing genomic features. Bioinformatics. 26:841–842. 10.1093/bioinformatics/btq033 [DOI] [PMC free article] [PubMed] [Google Scholar]
- Saburi, S., Hester I., Fischer E., Pontoglio M., Eremina V., Gessler M., Quaggin S.E., Harrison R., Mount R., and McNeill H.. 2008. Loss of Fat4 disrupts PCP signaling and oriented cell division and leads to cystic kidney disease. Nat. Genet. 40:1010–1015. 10.1038/ng.179 [DOI] [PubMed] [Google Scholar]
- Sanchez-Corrales, Y.E., Blanchard G.B., and Roper K.. 2018. Radially patterned cell behaviours during tube budding from an epithelium. Elife. 7:e35717. 10.7554/eLife.35717 [DOI] [PMC free article] [PubMed] [Google Scholar]
- Saxena, A., Denholm B., Bunt S., Bischoff M., VijayRaghavan K., and Skaer H.. 2014. Epidermal growth factor signalling controls myosin II planar polarity to orchestrate convergent extension movements during Drosophila tubulogenesis. PLoS Biol. 12:e1002013. 10.1371/journal.pbio.1002013 [DOI] [PMC free article] [PubMed] [Google Scholar]
- Sharrocks, A.D. 2001. The ETS-domain transcription factor family. Nat. Rev. Mol. Cell Biol. 2:827–837. 10.1038/35099076 [DOI] [PubMed] [Google Scholar]
- Sharrocks, A.D., Brown A.L., Ling Y., and Yates P.R.. 1997. The ETS-domain transcription factor family. Int. J. Biochem. Cell Biol. 29:1371–1387. 10.1016/s1357-2725(97)00086-1 [DOI] [PubMed] [Google Scholar]
- Shim, K., Blake K.J., Jack J., and Krasnow M.A.. 2001. The Drosophila ribbon gene encodes a nuclear BTB domain protein that promotes epithelial migration and morphogenesis. Development. 128:4923–4933 [DOI] [PubMed] [Google Scholar]
- Sidor, C., and Röper K.. 2016. Genetic control of salivary gland tubulogenesis. In Organogenetic Gene Networks. Hombría J.C.-G., and Bovolenta P., editors. Vol. 1. Springer, Switzerland. 125–150 [Google Scholar]
- Silva, D., Olsen K.W., Bednarz M.N., Droste A., Lenkeit C.P., Chaharbakhshi E., Temple-Wood E.R., and Jemc J.C.. 2016. Regulation of gonad morphogenesis in Drosophila melanogaster by BTB family transcription factors. PLoS One. 11:e0167283. 10.1371/journal.pone.0167283 [DOI] [PMC free article] [PubMed] [Google Scholar]
- Sin, O., de Jong T., Mata-Cabana A., Kudron M., Zaini M.A., Aprile F.A., Seinstra R.I., Stroo E., Prins R.W., Martineau C.N., et al. 2017. Identification of an RNA polymerase III regulator linked to disease-associated protein aggregation. Mol. Cell. 65:1096–1108.e6. 10.1016/j.molcel.2017.02.022 [DOI] [PMC free article] [PubMed] [Google Scholar]
- Smith, A.V., and Orr-Weaver T.L.. 1991. The regulation of the cell cycle during Drosophila embryogenesis: The transition to polyteny. Development. 112:997–1008 [DOI] [PubMed] [Google Scholar]
- Sotillos, S., Espinosa-Vazquez J.M., Foglia F., Hu N., and Hombria J.C.. 2010. An efficient approach to isolate STAT regulated enhancers uncovers STAT92E fundamental role in Drosophila tracheal development. Developmental Biology. 340:571–582. 10.1016/j.ydbio.2010.02.015 [DOI] [PMC free article] [PubMed] [Google Scholar]
- Sriskanthadevan-Pirahas, S., Deshpande R., Lee B., and Grewal S.S.. 2018a. Ras/ERK-signalling promotes tRNA synthesis and growth via the RNA polymerase III repressor Maf1 in Drosophila. PLoS Genet. 14:e1007202. 10.1371/journal.pgen.1007202 [DOI] [PMC free article] [PubMed] [Google Scholar]
- Sriskanthadevan-Pirahas, S., Lee J., and Grewal S.S.. 2018b. The EGF/Ras pathway controls growth in Drosophila via ribosomal RNA synthesis. Dev. Biol. 439:19–29. 10.1016/j.ydbio.2018.04.006 [DOI] [PubMed] [Google Scholar]
- St Pierre, S.E., Ponting L., Stefancsik R., McQuilton P., and FlyBase C.. 2014. FlyBase 102—Advanced approaches to interrogating FlyBase. Nucleic Acids Res. 42:D780–D788. 10.1093/nar/gkt1092 [DOI] [PMC free article] [PubMed] [Google Scholar]
- Teixeira, D., Sheth U., Valencia-Sanchez M.A., Brengues M., and Parker R.. 2005. Processing bodies require RNA for assembly and contain nontranslating mRNAs. RNA. 11:371–382. 10.1261/rna.7258505 [DOI] [PMC free article] [PubMed] [Google Scholar]
- Wang, Y.L., Duttke S.H., Chen K., Johnston J., Kassavetis G.A., Zeitlinger J., and Kadonaga J.T.. 2014. TRF2, but not TBP, mediates the transcription of ribosomal protein genes. Genes Dev. 28:1550–1555. 10.1101/gad.245662.114. [DOI] [PMC free article] [PubMed] [Google Scholar]
- Xu, N., Bagumian G., Galiano M., and Myat M.M.. 2011. Rho GTPase controls Drosophila salivary gland lumen size through regulation of the actin cytoskeleton and Moesin. Development. 138:5415–5427. 10.1242/dev.069831 [DOI] [PMC free article] [PubMed] [Google Scholar]
- Yamashita, D., Sano Y., Adachi Y., Okamoto Y., Osada H., Takahashi T., Yamaguchi T., Osumi T., and Hirose F.. 2007. hDREF regulates cell proliferation and expression of ribosomal protein genes. Mol. Cell Biol. 27:2003–2013. 10.1128/MCB.01462-06 [DOI] [PMC free article] [PubMed] [Google Scholar]
- Yu, G., Wang L.G., and He Q.Y.. 2015. ChIPseeker: An R/bioconductor package for ChIP peak annotation, comparison and visualization. Bioinformatics. 31:2382–2383. 10.1093/bioinformatics/btv145 [DOI] [PubMed] [Google Scholar]
- Zabidi, M.A., Arnold C.D., Schernhuber K., Pagani M., Rath M., Frank O., and Stark A.. 2015. Enhancer-core-promoter specificity separates developmental and housekeeping gene regulation. Nature. 518:556–559. 10.1038/nature13994 [DOI] [PMC free article] [PubMed] [Google Scholar]
- Zhang, Y., Liu T., Meyer C.A., Eeckhoute J., Johnson D.S., Bernstein B.E., Nusbaum C., Myers R.M., Brown M., Li W., and Liu X.S.. 2008. Model-based analysis of ChIP-seq (MACS). Genome Biol. 9:R137. 10.1186/gb-2008-9-9-r137. [DOI] [PMC free article] [PubMed] [Google Scholar]
- Zhu, L.J., Christensen R.G., Kazemian M., Hull C.J., Enuameh M.S., Basciotta M.D., Brasefield J.A., Zhu C., Asriyan Y., Lapointe D.S., et al. 2011. FlyFactorSurvey: A database of Drosophila transcription factor binding specificities determined using the bacterial one-hybrid system. Nucleic Acids Res. 39:D111–D117. 10.1093/nar/gkq858 [DOI] [PMC free article] [PubMed] [Google Scholar]
Associated Data
This section collects any data citations, data availability statements, or supplementary materials included in this article.
Supplementary Materials
(Related to Fig. 3.) List of the top 10 annotation clusters with associated enrichment scores and P values from DAVID analysis of genes bound by Rib in the SG.
(Related to Fig. 4.) List of RPGs expressed in third-instar larval (L3) and white prepupal (WPP) SGs showing values from Rib-binding data from embryonic tissue–specific ChIP-seq (yes or no, for above or below binding likelihood threshold), their fold-changes in rib versus WT whole embryonic RNA microarray analyses, and the overall transcript levels in the SG from BDGP-generated RNA-seq data (kindly provided by Sue Celnicker).
(Related to Fig. 4.) List of primers used for RT-qPCR experiments.
(Related to Fig. 6.) List of oligonucleotides used for EMSA experiments.
(Related to Fig. 8.) List of the top 10 annotation clusters with associated enrichment scores and P values from DAVID analysis of genes bound by Rib in the trachea.
(Related to Fig. 8.) List of Rib-bound tracheal genes annotated by three or more cell growth-related GO terms.
contains files for EMSAs (related to Figs. 6 and S9), and gel cutouts (related to Fig. 7) are provided. MS Excel spreadsheets with cell volume data (related to Figs. 4 and 7) are also provided.
is the source file for Fig. 6.
is the source file for Fig. 7.
is the source file for Fig. S5.


