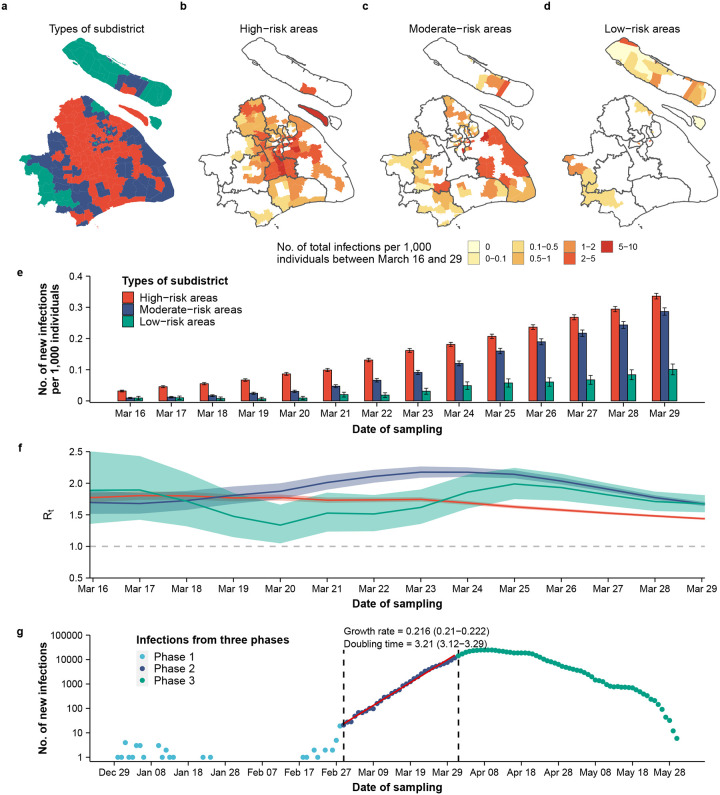
Figure 5. Characterization of the epidemic dynamics between March 16 and March 29, 2022.
(a) Location of high-risk, moderate-risk, and low-risk areas. For each area, its highest risk classification was used. (b-d) Number of reported infections between March 16 and March 29 by area type. (e) Number of new reported infection per 1,000 individuals by area type. (f) Estimated Rt between March 16 and March 29 by area type. (g) Estimated epidemic growth rate and doubling time (days).

