Abstract
Aim
Sepsis causes a systemic inflammatory reaction by destroying intestinal flora, which leads to a poor prognosis. In this study, we sought to clarify the characteristics of fecal flora and metabolites in a mouse model of sepsis by comprehensive metagenomic and metabolomic analysis.
Methods
We performed a cecal ligation and puncture model procedure to create a mild sepsis model. We collected fecal samples on day 0 (healthy condition) and days 1 and 7 after the cecal ligation and puncture to determine the microbiome and metabolites. We analyzed fecal flora using 16S rRNA gene sequencing and metabolites using capillary electrophoresis mass spectrometry with time‐of‐flight analysis.
Results
The abundance of bacteria belonging to the family Enterobacteriaceae significantly increased, but that of order Clostridiales such as the families Lachnospiraceae and Ruminococcaceae decreased on day 1 after the cecal ligation and puncture compared with those before the cecal ligation and puncture. The family Enterobacteriaceae significantly decreased, but that of order Clostridiales such as the families Lachnospiraceae and Ruminococcaceae increased on day 7 compared with those on day 1 after the cecal ligation and puncture. In the fecal metabolome, 313 metabolites were identified. Particularly, essential amino acids such as valine and non‐essential amino acids such as glycine increased remarkably following injury. Betaine and trimethylamine also increased. In contrast, short‐chain fatty acids such as isovaleric acid, butyric acid, and propionic acid decreased.
Conclusion
The fecal microbiota following injury showed that Enterobacteriaceae increased in acute phase, and Lachnospiraceae and Ruminococcaceae increased in subacute phase. The metabolites revealed an increase in essential amino acids and choline metabolites and a decrease in short‐chain fatty acids.
Keywords: Metabolome, metagenome, microbiome, microbiota, sepsis
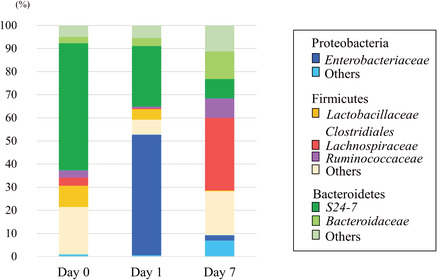
Fecal microbiota following injury showed that Enterobacteriaceae increased in acute phase, and Lachnospiraceae and Ruminococcaceae increased in subacute phase.
INTRODUCTION
The total number of genes in intestinal bacteria exceeds that of human genes by 100 times, 1 and these bacteria produce and secrete various metabolic components by unique metabolic pathways different from those in humans. 2
In recent years, along with the development of an analysis method, the characteristics of intestinal bacteria and metabolites in specific diseases have been clarified. 3 It has been revealed that treatment for maintaining intestinal homeostasis for each disease has a great influence on systemic homeostasis. 4 In critical diseases in the emergency medicine field, such as sepsis and heat stroke, it is reported that destruction of the intestinal flora causes a systemic inflammatory reaction that leads to a poor prognosis. 5 , 6 Although it is important to understand the intestinal environment in these diseases, the fecal flora and metabolites in critical disease have not been comprehensively analyzed from the perspective of systemic inflammation.
Therefore, the purpose of this study was to clarify the consecutive fecal flora and metabolites in a septic mouse model by comprehensive analysis using metagenomic and metabolomic analysis and to explore potential factors for systemic inflammation.
MATERIALS AND METHODS
Ethics statement
All animal experiments were approved by the Animal Care and Use Committee of Osaka University Graduate School of Medicine.
Cecal ligation and puncture model
Male‐specific pathogen‐free C57BL/6 mice (6 weeks old, 20–25 g) provided by Japan SLC. (Hamamatsu, Japan) were housed in laboratory cages in a 12‐h light/dark room at 22°C to 25°C and were given standard diet and water for 7 days until the experiments began. We performed a cecal ligation and puncture (CLP) model procedure to create a mild sepsis model with a 1‐week survival rate of 100%. We anesthetized the mice with intraperitoneal injection of medetomidine (0.3 mg/kg) and midazolam (4.0 mg/kg) and provided analgesia with butorphanol (5.0 mg/kg). We exposed the cecum with a 1‐cm abdominal midline incision and ligated 1 cm distal from the top of the cecum and made a single puncture with a 23‐gauge needle. We returned the cecum to the abdomen and closed the incision. All mice were injected with saline (50 mL/kg body weight) subcutaneously following the operation.
Sample collection
We collected fecal samples on day 0 (healthy condition) and days 1 and 7 after CLP to determine the microbiome and the metabolites.
Fecal bacterial DNA extraction and 16S rRNA gene sequencing
DNA was extracted from fecal samples using a PowerSoil DNA Extraction Kit (MO BIO Laboratories, Carlsbad, CA). Polymerase chain reaction (PCR) was performed using a primer set (784F: 5′‐AGGATTAGATACCCTGGTA‐3′ and 1061R: 5′‐CRRCACGAGCT‐GACGAC‐3′) targeting the V5‐V6 region of the 16S rRNA genes with KAPA HiFi HotStart Ready Mix (KAPA Biosystems, Woburn, MA). DNA libraries were prepared using an Ion Fragment Library Kit (Life Technologies, Gaithersburg, MD) according to the manufacturer's instructions. Sequencing was performed using two 318 chips and Ion PGM Sequencing Hi‐Q Kits on an Ion PGM sequencer (both, Life Technologies). The resulting sequences were analyzed with Quantitative Insights into the Microbial Ecology pipeline.
Metabolome analyses
The samples were subjected to capillary electrophoresis mass spectrometry with time‐of‐flight (CE‐TOFMS) analysis. Metabolome analysis was conducted with the Basic Scan package of Human Metabolome Technologies (HMT; Tsuruoka, Yamagata, Japan) using CE‐TOFMS based on the methods described previously. 7 , 8 CE‐TOFMS analysis was carried out using an Agilent CE capillary electrophoresis system equipped with an Agilent 6,210 TOF mass spectrometer (Agilent Technologies, Santa Clara, CA, USA). The systems were controlled by Agilent G2201AA ChemStation software version B.03.01 for CE (Agilent Technologies). The spectrometer was scanned from m/z 50 to 1,000, and peaks were extracted using MasterHands automatic integration software (Keio University, Tsuruoka, Yamagata, Japan) to obtain peak information including m/z, peak area, and migration time. 9 Signal peaks corresponding to isotopomers, adduct ions, and other product ions of known metabolites were excluded, and the remaining peaks were annotated according to the HMT metabolite database based on their m/z values with the migration times. Areas of the annotated peaks were then normalized based on internal standard levels and sample amounts to obtain relative levels of each metabolite. One hundred ten primary metabolites were absolutely quantified based on one‐point calibrations using their respective standard compounds.
Statistical analysis
Comparisons between the two groups were performed using the Mann–Whitney U test. Spearman's rank correlation coefficients (two‐tailed test) were calculated for co‐occurrence analysis. P values of <0.05 were considered statistically significant. Clustering analysis and principal component analysis (PCA) were performed with HMT's proprietary software, PeakStat and SampleStat, respectively. Detected metabolites were plotted on metabolic pathway maps using VANTED software. 10 Metabolite pathway enrichment analysis was conducted using MetaboAnalyst (http://www.metaboanalyst.ca). Biclustering analysis was done using JMP14. Network analysis was performed with Cytoscape software (https://www.cytoscape.org) version 3.8.0. The network was based on the significant Spearman's correlation coefficients between the metabolites. The metabolites with log2 fold change (0.5 > or < −0.5) were included. The log2 fold change was calculated by dividing average relative area of metabolites on day 1 or day 7 by those on day 0. The size of each node was determined based on the absolute value of the log2 fold change. Node shape reflects the log2 fold change (i.e., circle >0.5; rhombus <−0.5). Statistical analysis was carried out with JMP 14 (SAS Institute, Cary, NC, USA).
RESULTS
Microbial alterations after CLP
The abundant taxa from the fecal samples determined by 16S rRNA analysis are shown in Figure 1A,B (n = 12 each day). Bacteroidetes and Firmicutes were the main predominant phyla in the mice before CLP. After CLP, the family that mainly changed in phylum Proteobacteria was Enterobacteriaceae, and Escherichia coli was the main genus in this family (98.9%). The abundance of bacteria belonging to the phylum Proteobacteria increased significantly on day 1 after CLP compared with that before CLP, whereas that belonging to the phyla Bacteroidetes and Firmicutes decreased on day 1 after CLP compared with that before CLP. In contrast, the abundance of bacteria belonging to the phylum Proteobacteria decreased significantly on day 7 compared with that on day 1 after CLP, and that belonging to the phyla Bacteroidetes and Firmicutes increased on day 7 after CLP compared with that on day 1 after CLP (Fig. 1A).
Fig. 1.
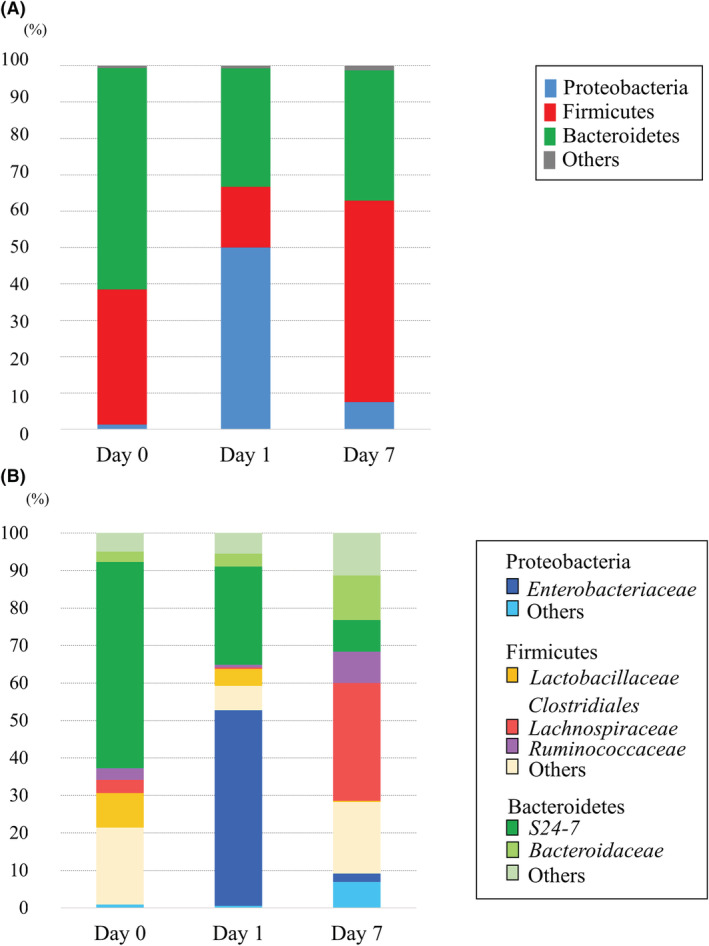
A, The differences in the phylum‐level taxonomic composition of intestinal microbiomes before and after cecal ligation and puncture (CLP). The intestinal microbiome after CLP was more variable than that before CLP. B, The family‐level taxonomic composition before and after CLP.
Those families that mainly increased in phylum Firmicutes on day 7 compared with day 0 and day 1 were Lachnospiraceae and Ruminococcaceae in the order Clostridiales. Those families that mainly changed in phylum Bacteroidetes were S24‐7 and Bacteroidaceae (Fig. 1B).
Metabolome alterations after CLP
From the fecal metabolome after CLP, CE‐TOFMS identified 313 metabolites. The results of PCA are shown in Figure 2. Remarkably different main components were observed in the fecal metabolome on days 0, 1, and 7. Fold changes and P‐values of the metabolites are shown in Appendix S1.
Fig. 2.
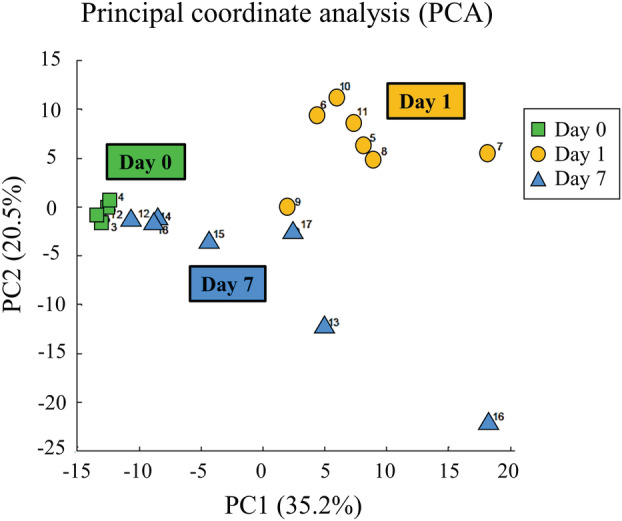
Principal component analysis (PCA) shows the patterns of the metabolites. Remarkably different main components were observed in the fecal metabolome on days 0, 1, and 7.
Volcano plot analysis in the CLP groups is shown in Figure 3A. Considering multiple comparisons adjusted for probabilities (adjusted for P < 0.05) and fold change (fold change >0.5, <−0.5), many metabolites were found to increase on day 1 (261 metabolites) and day 7 (236 metabolites) compared to those on day 0.
Fig. 3.
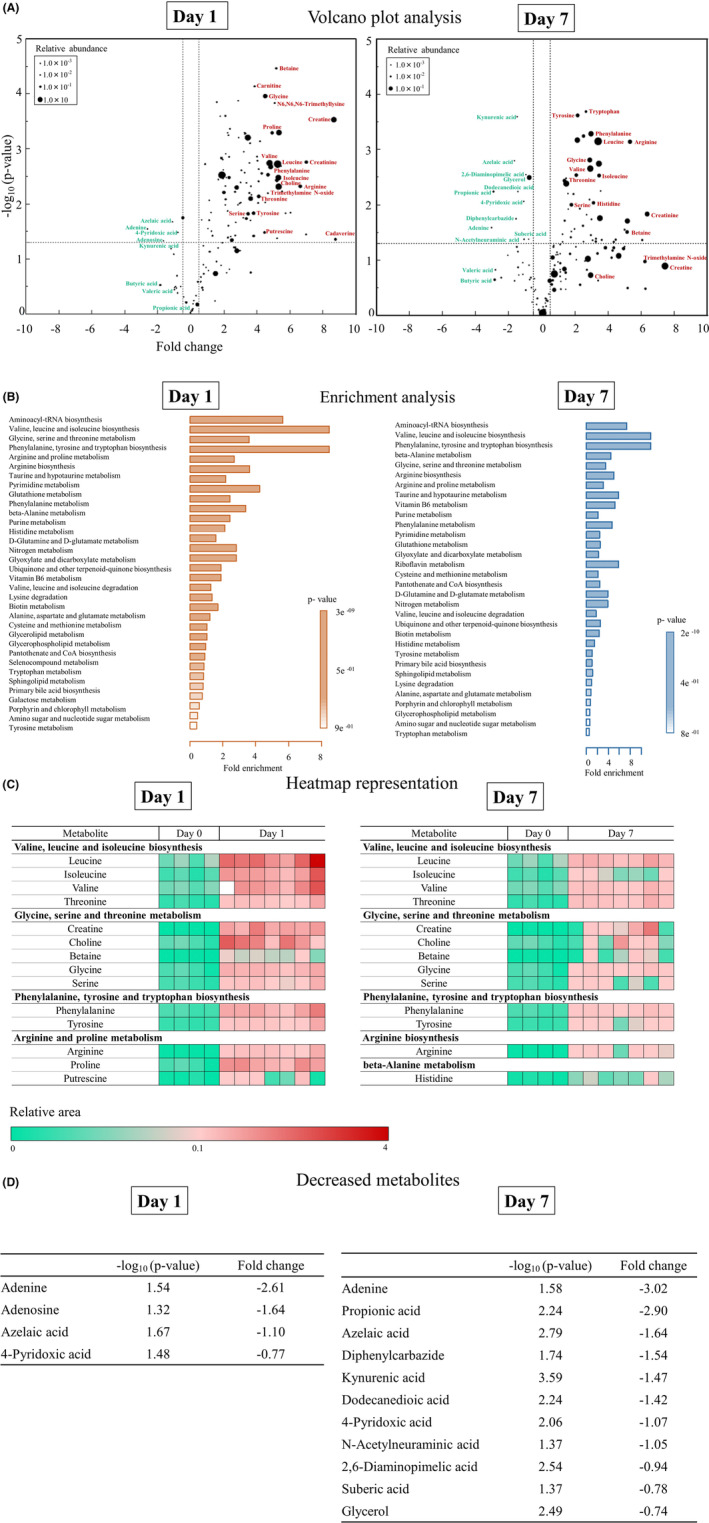
A, In volcano plots, the y axis shows adjusted P‐values (−log10(P‐value)), and the x axis shows fold change for the metabolites. The horizontal dashed line indicates a P‐value of 0.05. The vertical dashed lines indicate fold changes of 0.5 or − 0.5, respectively. The size of the circles indicates the averaged abundance of each metabolite. The names of the metabolites discussed in our study or previously reported are indicated next to each circle. Red color indicates over‐expressed metabolites, and turquoise indicates under‐expressed metabolites. B, Metabolite set enrichment analysis identified significantly enriched metabolite sets among the metabolites increased on day 1 (left) and day 7 (right) compared to day 0. C, Heatmap representation of metabolites that were significantly enriched on day 0 and day 1 (left) and on day 0 and day 7 (right). Red indicates high expression and turquoise, low expression. D, Metabolites that were significantly decreased on day 1 (left) and day 7 (right) compared to day 0.
Metabolite set enrichment analysis is shown in Figure 3B. The analysis identified significantly enriched metabolite sets among the metabolites that were increased on day 1 compared to day 0, with the strongest enrichment identified for valine, leucine, and isoleucine biosynthesis; glycine, serine, and threonine metabolism; phenylalanine, tyrosine, and tryptophan biosynthesis; and arginine and proline metabolism. The analysis also identified significantly enriched metabolite sets among the metabolites increased on day 7 compared to day 0, with the strongest enrichment identified for valine, leucine, and isoleucine biosynthesis; glycine, serine, and threonine metabolism; phenylalanine, tyrosine, and tryptophan biosynthesis; arginine biosynthesis; and β‐alanine metabolism.
A heatmap representation of the metabolites related to the significantly enriched metabolite sets is shown in Figure 3C. The relative area of the metabolites was found to increase on day 1 and day 7 compared to that on day 0. Considering multiple comparisons adjusted for probabilities and fold change, some metabolites were found to decrease on day 1 and day 7 compared to those on day 0 (Fig. 3A,D).
Biclustering and network visualization are shown in Figure 4A,B. The metabolites on day 1 were classified into 12 categories (left side of Fig. 4A), and networks of cluster number 12 included the elements of three enriched metabolite sets such as “valine, leucine, and isoleucine biosynthesis”, “glycine, serine, and threonine metabolism”, and “phenylalanine, tyrosine, and tryptophan biosynthesis” (right side of Fig. 4A). In addition, the metabolites on day 7 were classified into 6 categories (left side of Fig. 4B), and networks of cluster number 6 included the same enriched metabolite sets as shown for day 1 (right side of Fig. 4B).
Fig. 4.
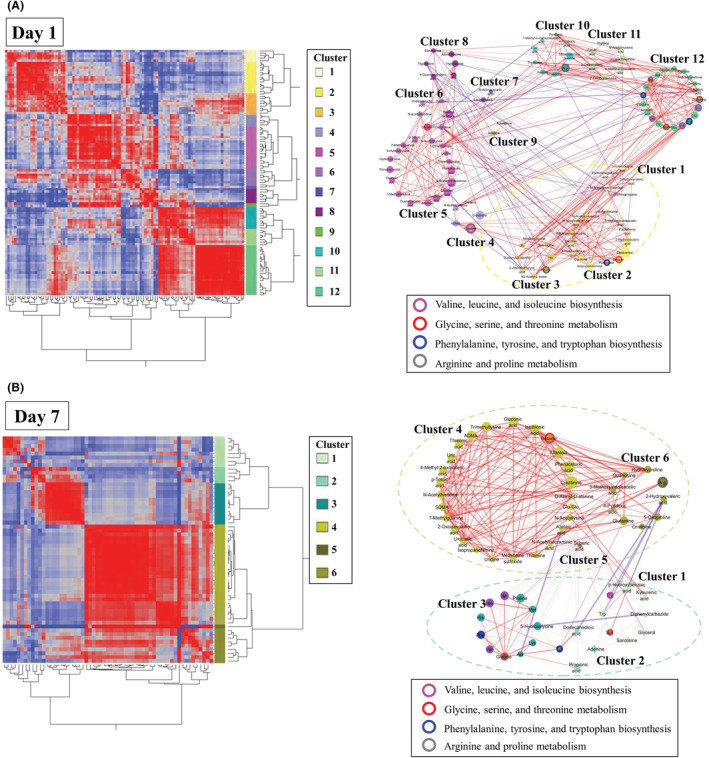
A, Biclustering of metabolites and network visualization on day 1. In the biclustering analysis, the metabolites were classified into 12 categories on day 1 (left side of A). The network visualizes the significant correlations of biclustering on day 1 (right side of A). The different node colors indicate different categories. The lines enclosing the nodes indicate those belonging to the enriched metabolite set. The thickness of the line between the nodes indicates the degree of correlation. Red and blue lines indicate positive and negative correlations, respectively. The dotted‐line boxes indicate categories corresponding to those in biclustering. B, Biclustering of metabolites and network visualization on day 7. In the biclustering analysis, the metabolites were classified into 6 categories on day 7 (left side of B). The network visualizes the significant correlations of biclustering on day 7 (right side of B).
The short‐chain fatty acids (SCFAs) in our study included butyric acid (isobutyric acid), valeric acid (isovaleric acid), and propionic acid. They were decreased on day 1 and day 7 compared to those on day 0 (Fig. 5).
Fig. 5.

The differences in butyric acid (isobutyric acid), valeric acid (isovaleric acid), and propionic acid of intestinal metabolites before and after cecal ligation and puncture (CLP). They were decreased after CLP compared to those before CLP (*P < 0.05 versus day 0).
DISCUSSION
The present study showed that the fecal flora and metabolites changed dramatically following the injury of CLP. We found that the rate of family Enterobacteriaceae increased in the acute phase (day 1), and that of order Clostridiales decreased, and those of the families Lachnospiraceae and Ruminococcaceae increased in the subacute phase (day 7).
Although the reason for the increase of Enterobacteriaceae has not been clarified, inflammatory mediators such as inducible nitric oxide synthase (iNOS) may have a key role. 11 The order Clostridiales, containing the families Lachnospiraceae and Ruminococcaceae, produces butyric acid. 12 Furusawa et al. 13 showed that the production of fecal butyric acid and regulatory T cells (Treg) of the colon in mice colonized with order Clostridiales increased significantly in the high‐fiber diet group compared with the low‐fiber diet group. Antharam et al. 14 showed that the proportions of families Lachnospiraceae and Ruminococcaceae in healthy patients were higher than those of patients with Clostridium difficile infection (CDI). The changes in these families in this study may have been a result of sepsis.
We found that most of the metabolites tended to increase following the injury of CLP. Particularly, essential amino acids such as valine, leucine, and phenylalanine and non‐essential amino acids such as glycine, serine, and threonine remarkably increased following the CLP injury. In contrast, SCFAs such as butyric acid, valeric acid, and propionic acid decreased on day 1 and day 7 after CLP compared with those before CLP.
Valine, leucine, and isoleucine are branched‐chain essential amino acids that are not normally produced from the intestinal epithelium. A previous study showed that branched‐chain essential amino acids increased especially in the intramucosal cancer stage of colorectal cancer. 15 However, to our knowledge, there are no previous reports on fecal branched‐chain essential amino acids in association with sepsis. There are three possible reasons why these amino acids increased in our study. First, the bacteria that can produce branched‐chain essential amino acids increased. Second, the bacteria that can resolve the amino acids decreased. Third, cell walls were shed because of intestinal cell death.
Choline is metabolized to trimethylamine N oxide (TMAO) and betaine in the body. 16 A previous study showed choline, TMAO, and betaine to be associated with the exacerbation of arteriosclerosis and increased cardiovascular events. 17 Although there appear to be no previous studies on the relationship between these metabolites and infectious diseases such as sepsis, these metabolites were increased in our study, and therefore, they may be associated with sepsis pathophysiology.
Polyamines such as putrescine, spermidine, and spermine are supplied from food or intestinal microbiota. 18 , 19 Matsumoto et al. showed that mice administered Bifidobacteria LKM512 had significantly higher fecal polyamine concentrations compared with control mice, and they had significantly lower colon permeability in a lactulose‐rhamnose load test compared with control mice. 20 It is possible that polyamines were increased by sepsis in our study.
SCFAs, the result of anaerobic metabolism in the microbiota, consist of acetic, propionic, and n‐butyric acids with 2–4 carbon atoms and possess anti‐inflammatory activity. 21 The concentrations of SCFAs were reported to be significantly lower in critically ill patients than in healthy volunteers. 22 , 23 The amounts of SCFAs continued low for more than 6 weeks 24 and were associated with mortality. 25 In our study, the concentrations of SCFAs such as isovaleric acid, butyric acid, and propionic acid decreased. This result supported the findings of these previous studies. We consider that supplementation with metabolites showing a decrease, such as SCFAs, may lead to improvement of the pathological condition. However, additional work is needed to confirm this.
This study has a limitation in that we used only juvenile male mice for our research. Therefore, our inferences may not be generalizable to all mice, and further studies are needed on the association between aging and the characteristics of fecal flora and metabolites.
CONCLUSIONS
We researched the consecutive fecal flora and metabolites for the first time in a CLP model of sepsis. Analysis of fecal microbiota following injury showed that Enterobacteriaceae increased in the acute phase, and Lachnospiraceae and Ruminococcaceae increased in the subacute phase. The metabolites revealed to increase were essential amino acids and choline metabolites, and those that decreased were SCFAs. The present findings may lead to a better understanding of pathological conditions and the discovery of new biomarkers by focusing on changes in the fecal microbiota and metabolites.
DISCLOSURE
Approval of the Research Protocol: N/A.
Informed Consent: N/A.
Registry and the Registration No. of the Study/trial: N/A.
Animal Studies: All procedures were performed in accordance with the Osaka University Medical School's Guidelines for the Care and Use of Laboratory Animals and were approved by the institutional ethics committee.
Conflict of Interest: None declared.
Supporting information
Appendix S1. Fold changes and P‐values of the metabolites.
ACKNOWLEDGEMENTS
The authors thank all of the staff of the Department of Microbiology and Immunology and Department of Infection Metagenomics, Research Institute for Microbial Disease, Osaka University Graduate School of Medicine, Osaka, Japan. This work was supported by the Japan Society for the Promotion of Science Grants‐in‐Aid for Scientific Research (19H03760, 19H03761, and 20K17861).
Funding information
This work was supported by the Japan Society for the Promotion of Science Grants‐in‐Aid for Scientific Research Grant Numbers 19H03760, 19H03761, and 20 K17861.
REFERENCES
- 1. Koboziev I, Reinoso Webb C, Furr KL, Grisham MB. Role of the enteric microbiota in intestinal homeostasis and inflammation. Free Radic. Biol. Med. 2014; 68: 122–33. [DOI] [PMC free article] [PubMed] [Google Scholar]
- 2. Ishii C, Nakanishi Y, Murakami S et al. A metabologenomic approach reveals changes in the intestinal environment of mice fed on American diet. Int. J. Mol. Sci. 2018; 19: 4079. [DOI] [PMC free article] [PubMed] [Google Scholar]
- 3. Aw W, Fukuda S. An integrated outlook on the metagenome and metabolome of intestinal diseases. Diseases 2015; 3: 341–59. [DOI] [PMC free article] [PubMed] [Google Scholar]
- 4. Rakoff‐Nahoum S, Paglino J, Eslami‐Varzaneh F, Edberg S, Medzhitov R. Recognition of commensal microflora by toll‐like receptors is required for intestinal homeostasis. Cell 2004; 118: 229–41. [DOI] [PubMed] [Google Scholar]
- 5. Ojima M, Motooka D, Shimizu K et al. Metagenomic analysis reveals dynamic changes of whole gut microbiota in the acute phase of intensive care unit patients. Dig. Dis. Sci. 2016; 61: 1628–34. [DOI] [PMC free article] [PubMed] [Google Scholar]
- 6. Shimizu K, Ogura H, Hamasaki T et al. Altered gut flora are associated with septic complications and death in critically ill patients with systemic inflammatory response syndrome. Dig. Dis. Sci. 2011; 56: 1171–7. [DOI] [PMC free article] [PubMed] [Google Scholar]
- 7. Ohashi Y, Hirayama A, Ishikawa T et al. Depiction of metabolome changes in histidine‐starved Escherichia coli by CE‐TOFMS. Mol. BioSyst. 2008; 4: 135–47. [DOI] [PubMed] [Google Scholar]
- 8. Ooga T, Sato H, Nagashima A et al. Metabolomic anatomy of an animal model revealing homeostatic imbalances in dyslipidaemia. Mol. BioSyst. 2011; 7: 1217–23. [DOI] [PubMed] [Google Scholar]
- 9. Sugimoto M, Wong DT, Hirayama A, Soga T, Tomita M. Capillary electrophoresis mass spectrometry‐based saliva metabolomics identified oral, breast and pancreatic cancer‐specific profiles. Metabolomics 2010; 6: 78–95. [DOI] [PMC free article] [PubMed] [Google Scholar]
- 10. Junker BH, Klukas C, Schreiber F. VANTED: a system for advanced data analysis and visualization in the context of biological networks. BMC Bioinform. 2006; 7: 109. [DOI] [PMC free article] [PubMed] [Google Scholar]
- 11. Winter SE, Winter MG, Xavier MN et al. Host‐derived nitrate boosts growth of E. coli in the inflamed gut. Science 2013; 339: 708–11. [DOI] [PMC free article] [PubMed] [Google Scholar]
- 12. Esquivel‐Elizondo S, Ilhan ZE, Garcia‐Peña EI, Krajmalnik‐Brown R. Insights into butyrate production in a controlled fermentation system via gene predictions. mSystems 2017; 2: e00051–17. [DOI] [PMC free article] [PubMed] [Google Scholar]
- 13. Furusawa Y, Obata Y, Fukuda S et al. Commensal microbe‐derived butyrate induces the differentiation of colonic regulatory T cells. Nature 2013; 504: 446–50. [DOI] [PubMed] [Google Scholar]
- 14. Antharam VC, Li EC, Ishmael A et al. Intestinal dysbiosis and depletion of butyrogenic bacteria in Clostridium difficile infection and nosocomial diarrhea. J. Clin. Microbiol. 2013; 51: 2884–92. [DOI] [PMC free article] [PubMed] [Google Scholar]
- 15. Yachida S, Mizutani S, Shiroma H et al. Metagenomic and metabolomic analyses reveal distinct stage‐specific phenotypes of the gut microbiota in colorectal cancer. Nat. Med. 2019; 25: 968–76. [DOI] [PubMed] [Google Scholar]
- 16. Tang WH, Wang Z, Levison BS et al. Intestinal microbial metabolism of phosphatidylcholine and cardiovascular risk. N. Engl. J. Med. 2013; 368: 1575–84. [DOI] [PMC free article] [PubMed] [Google Scholar]
- 17. Wang Z, Klipfell E, Bennett BJ et al. Gut flora metabolism of phosphatidylcholine promotes cardiovascular disease. Nature 2011; 472: 57–63. [DOI] [PMC free article] [PubMed] [Google Scholar]
- 18. Matsumoto M, Kibe R, Ooga T et al. Impact of intestinal microbiota on intestinal luminal metabolome. Sci. Rep. 2012; 2: 233. [DOI] [PMC free article] [PubMed] [Google Scholar]
- 19. Milovic V. Polyamines in the gut lumen: bioavailability and biodistribution. Eur. J. Gastroenterol. Hepatol. 2001; 13: 1021–5. [DOI] [PubMed] [Google Scholar]
- 20. Matsumoto M, Kurihara S, Kibe R, Ashida H, Benno Y. Longevity in mice is promoted by probiotic‐induced suppression of colonic senescence dependent on upregulation of gut bacterial polyamine production. PLoS One 2011; 6: e23652. [DOI] [PMC free article] [PubMed] [Google Scholar]
- 21. Topping DL, Clifton PM. Short‐chain fatty acids and human colonic function: Roles of resistant starch and nonstarch polysaccharides. Physiol. Rev. 2001; 81: 1031–64. [DOI] [PubMed] [Google Scholar]
- 22. Shimizu K, Ogura H, Goto M et al. Altered gut flora and environment in patients with severe SIRS. J. Trauma Acute Care Surg. 2006; 60: 126–33. [DOI] [PubMed] [Google Scholar]
- 23. Valdés‐Duque BE, Giraldo‐Giraldo NA, Jaillier‐Ramírez AM et al. Stool short‐chain fatty acids in critically ill patients with sepsis. J. Am. Coll. Nutr. 2020; 39: 706–12. [DOI] [PubMed] [Google Scholar]
- 24. Yamada T, Shimizu K, Ogura H et al. Rapid and sustained long‐term decrease of fecal short‐chain fatty acids in critically ill patients with systemic inflammatory response syndrome. JPEN 2015; 39: 569–77. [DOI] [PubMed] [Google Scholar]
- 25. Nakahori Y, Shimizu K, Ogura H et al. Impact of fecal short‐chain fatty acids on prognosis in critically ill patients. Acute Med. Surg. 2020; 7: e558. [DOI] [PMC free article] [PubMed] [Google Scholar]
Associated Data
This section collects any data citations, data availability statements, or supplementary materials included in this article.
Supplementary Materials
Appendix S1. Fold changes and P‐values of the metabolites.


