Abstract
Background
Elevated angiotensin II levels are thought to play an important role in atrial electrical and structural remodeling associated with atrial fibrillation. However, the mechanisms by which this remodeling occurs are still unclear. Accordingly, we explored the effects of angiotensin II on atrial remodeling using transgenic mice overexpressing angiotensin II type 1 receptor (AT1R) specifically in cardiomyocytes.
Methods and Results
Voltage‐clamp techniques, surface ECG, programmed electrical stimulations along with quantitative polymerase chain reaction, Western blot, and Picrosirius red staining were used to compare the atrial phenotype of AT1R mice and their controls at 50 days and 6 months. Atrial cell capacitance and fibrosis were increased only in AT1R mice at 6 months, indicating the presence of structural remodeling. Ca2+ (I CaL) and K+ currents were not altered by AT1R overexpression (AT1R at 50 days). However, I CaL density and CaV1.2 messenger RNA expression were reduced by structural remodeling (AT1R at 6 months). Conversely, Na+ current (I Na) was reduced (−65%) by AT1R overexpression (AT1R at 50 days) and the presence of structural remodeling (AT1R at 6 months) yields no further effect. The reduced I Na density was not explained by lower NaV1.5 expression but was rather associated with an increase in sarcolemmal protein kinase C alpha expression in the atria, suggesting that chronic AT1R activation reduced I Na through protein kinase C alpha activation. Furthermore, connexin 40 expression was reduced in AT1R mice at 50 days and 6 months. These changes were associated with delayed atrial conduction time, as evidenced by prolonged P‐wave duration.
Conclusions
Chronic AT1R activation leads to slower atrial conduction caused by reduced I Na density and connexin 40 expression.
Keywords: angiotensin II type 1 receptor, atrial conduction, connexins, protein kinase C alpha, sodium current
Subject Categories: Electrophysiology, Atrial Fibrillation, ACE/Angiotension Receptors/Renin Angiotensin System, Animal Models of Human Disease, Ion Channels/Membrane Transport
Nonstandard Abbreviations and Acronyms
- ANG II
angiotensin II
- AP
action potential
- AT1R
angiotensin II type 1 receptor
- Cx40
connexin 40
- Cx43
connexin 43
- EPS
programmed electrical stimulation
- PKC
protein kinase C
- PKCα
protein kinase C alpha
- qPCR
quantitative polymerase chain reaction
- RAS
renin‐angiotensin system
- TBST
Tris‐buffered saline Tween‐20
Clinical Perspective
What Is New?
Using transgenic mice with cardiomyocyte‐restricted overexpression of angiotensin II type 1 receptor (AT1R), we showed that chronic angiotensin II stimulation impairs atrial electrical conduction, Na+ current, and connexin 40 expression.
Moreover, AT1R overexpression increases sarcolemmal protein kinase C alpha expression in atria. Since protein kinase C alpha activation requires translocation to the sarcolemmal membrane, these results strongly support the role of protein kinase C alpha in Na+ current reduction in atrial myocytes of AT1R mice.
These changes occurred in the absence of hypertension and before the development of structural remodeling, thus highlighting the direct effect of angiotensin II/AT1R signaling on the atria and in the pathophysiology of atrial fibrillation.
What Are the Clinical Implications?
This study provides mechanistic insights on the atrial remodeling induced by angiotensin II, which may promote atrial fibrillation.
Moreover, together with our previous work, these findings show that chronic AT1R activation has distinct electrophysiological effects in the atria compared with the ventricles.
A better understanding of theses distinct regulatory mechanisms between the heart chambers could help develop more specific pharmacological tools and thus improve the management of cardiac arrhythmias.
Atrial fibrillation (AF) is the most common sustained cardiac arrhythmia, affecting 1% to 4% of the world’s population, and increases the risk of strokes and mortality. 1 Substantial atrial electrophysiological and structural remodeling are associated with AF. 2 Indeed, changes in atrial ionic currents and connexins can affect atrial conduction time, which, along with atrial fibrosis, can favor the development of AF. Chronic increase in angiotensin II (ANG II) levels, as commonly found in hypertension, have been identified as one of the major risk factors of AF, although underlying mechanisms are not completely understood.
ANG II, the main effector of the renin‐angiotensin system (RAS), plays a key role in regulating physiological processes within the cardiovascular system. Its overactivity, mediated through the ANG II type 1 receptor (AT1R), can lead to several detrimental effects such as heart failure and ventricular arrhythmias. 3 , 4 , 5 Accumulating evidence suggests that ANG II is also involved in atrial structural and electrical remodeling, which may act as triggers for the initiation and maintenance of AF. 6 , 7 For instance, Xiao et al 8 demonstrated in a mouse model that cardiac‐specific overexpression of angiotensin‐converting enzyme produces atrial enlargement causing AF. It has also been shown that patients with AF have increased angiotensin‐converting enzyme and AT1R levels in the left atrium. 9 , 10 In addition, angiotensin‐converting enzyme inhibitors and angiotensin receptor antagonists have been shown to reduce the risk of developing AF in patients with heart failure, while other antihypertensive drugs have no effect. 6 , 11 , 12 These data suggest that RAS may directly influence atrial structure and function and that the beneficial effects of RAS blockade may not be solely caused by hemodynamic effects. 13 , 14 , 15
Previously, using transgenic mice with cardiomyocyte‐specific overexpression of ANG II type 1 receptor (AT1R mice), we investigated the influence of chronic AT1R activation on ventricular electrophysiology. We found significant ventricular electrophysiological remodeling, with a marked reduction of several K+ currents, as well as Na+ and L‐type Ca2+ currents (I Na and I CaL, respectively). 3 , 16 , 17 , 18 Importantly, we demonstrated that there was no evidence of ventricular hypertrophy before the age of 60 days in the AT1R mice; however, significant hypertrophy and fibrosis were present at 6 months of age without any hemodynamic changes. 3 , 5 We therefore used these mice at 2 different ages to distinguish the direct effects of AT1R overexpression (50 days) from the effects of hypertrophy (6 months) on electrical ventricular function. 3 , 16 , 17 , 18 Together, these studies indicate that the ventricular electrical remodeling observed in AT1R mice is attributable to AT1R signaling and not secondary to ventricular hypertrophy. In the present study, we hypothesized that chronic AT1R activation also alters ionic currents in mouse atrial myocytes. Given that conduction delay is a common feature of AF, we also examined the effect of AT1R overexpression on connexin (Cx; Cx40 and Cx43) expression. PR interval and P‐wave duration were also determined to establish whether changes at the cellular level were reflected by a slower atrial conduction time. We then assessed whether the AT1R‐induced atrial remodeling increased AF susceptibility using programmed electrical stimulation protocols (EPS).
Methods
The data that support the findings of this study are available from the corresponding author on reasonable request.
Animals
Heterozygous male C57BL/6 overexpressing AT1R mice aged 50±5 days (50 days; no hypertrophy) and 6 to 8 months (6 months; presence of hypertrophy) and age‐matched male wild‐type littermate controls were used in this study. The generation of the AT1R mice was previously described. 5 Briefly, human AGT1R was expressed under the control of the murine α‐myosin heavy chain promoter, which directs transgene expression specifically in cardiomyocytes. Circulating levels of ANG II remain similar between controls and AT1R mice at both ages (Table). All experiments were performed in accordance with the guidelines of the Canadian Council on Animal Care and the Guide for the Care and Use of Laboratory Animals published by the National Research Council (8th edition, National Academies 2011). Experiments were also approved by the Montreal Heart Institute Animal Care Committee (Protocol 2015‐80‐03, 2018‐80‐01 and 2019‐80‐01).
Table .
Circulating ANG II Levels Are Similar Between Controls and AT1R Mice at 50 d and 6 mo
| Plasma ANG II concentration, ng/mL | 50 d, mean±SEM (n) | 6 mo, mean±SEM (n) |
|---|---|---|
| Controls | 0.20±0.04 (5) | 0.10±0.04 (6) |
| AT1R | 0.15±0.07 (3) | 0.13±0.03 (6) |
ANG II indicates angiotensin II; and AT1R, angiotensin II type 1 receptor.
Atrial Mouse Myocytes Isolation
Single atrial myocytes were isolated from the left atrium of mice by enzymatic dissociation as previously described. 19 , 20 Left atrium was used as it has been described to be more susceptible to AF. 2 Mice were administered heparin (100 U heparin [1000 U/mL]) 15 minutes before removal of the heart to prevent blood coagulation. Mice were then anesthetized by isoflurane inhalation and killed by cervical dislocation. The hearts were rapidly removed and retrogradely perfused through the aorta (2 mL/min) on a modified Langendorff apparatus with the following solutions: (1) 5 minutes with HEPES‐buffered Tyrode solution containing (in mmol/L): 130 NaCl, 5.4 KCl, 1 CaCl2, 1 MgCl2, 0.33 Na2HPO4, 10 HEPES, and 5.5 glucose (pH adjusted to 7.4 with NaOH); (2) 10 minutes with a Ca2+‐free Tyrode solution; (3) 35 minutes with a Tyrode solution containing 0.03 mmol/L Ca2+, 20 mmol/L taurine, 0.1% BSA (Fraction V, Sigma Chemicals), and 73.7 U/mL type II collagenase (Worthington); and (4) 5 minutes with a Kraft‐Brühe solution containing (in mmol/L): 100 K+‐glutamate, 10 K+‐aspartate, 25 KCl, 10 KH2PO4, 2 MgSO4, 20 taurine, 5 creatine base, 0.5 EGTA, 5 HEPES, 20 glucose, and 0.1% BSA (pH adjusted to 7.2 with KOH). All solutions were maintained at 37±1 °C. At the end of the perfusion, the left atrium was removed and placed in Kraft‐Brühe solution. The tissue was minced and triturated for 3 to 5 minutes in order to isolate individual atrial myocytes. Atrial myocytes cells were stored in Kraft‐Brühe at 4 °C until being used 2 to 6 hours later. Only rod‐shaped myocytes were used for electrophysiological experimental studies.
Cellular Electrophysiology
The voltage‐clamp protocols, recording methods, and data acquisition have already been described elsewhere. 17 , 20 , 21 In brief, the myocytes were placed in a recording chamber (volume ≈200 μL) on the stage of an inverted microscope, and given 10 minutes to adhere to the bottom of the bath. The cells were perfused with a solution at 2 mL/min. Pipettes were made from borosilicate glass (World Precision Instruments), and had resistances in the range of 2 to 4 MΩ when filled with pipette solutions. For I Na measurements, cells were perfused with a solution containing (in mmol/L): 132.5 CsCl, 10 glucose, 1 MgCl2, 1 CaCl2, 20 HEPES, and 5 NaCl (pH adjusted to 7.4 with CsOH). Patch pipettes were filled with the following solution (in mmol/L): 132.5 CsF, 5 NaCl, 5 Mg‐ATP, 10 EGTA, and 5 HEPES (pH adjusted to 7.2 with CsOH). 17 , 18 , 21 For K+ current and action potential (AP) measurements, cells were perfused with HEPES‐buffered Tyrode solution as previously described. 19 , 20 Patch pipettes were filled with the following solution (mmol/L): 110 K+‐aspartate, 20 KCl, 8 NaCl, 1 MgCl2, 1 CaC12, 10 BAPTA, 4 K2‐ATP, and 10 HEPES (pH adjusted to 7.2 with KOH). 19 , 20 For L‐type Ca2+ current recordings, atrial cells were perfused with a solution containing (in mmol/L): 10 CsCl, 5.5 glucose, 0.5 MgCl2, 2 CaCl2, 5 HEPES, and 145 TEACl (pH adjusted to 7.4 with CsOH). Patch pipettes were filled with the following solution (in mmol/L): 100 aspartic acid, 70 CsOH, 40 CsCl, 2 MgCl2, 4 Mg‐ATP, 10 EGTA, and 10 HEPES (pH adjusted to 7.2 with CsOH). 16 , 22
Whole‐cell current‐ and voltage‐clamp recordings were obtained using ruptured patch‐clamp technique with an AxoPatch 200B patch‐clamp amplifier (Molecular Devices). Only cells with a compensated series resistance (compensation set at 50%–70%) of ≤10 MΩ were kept for analysis. Voltage‐clamp currents were low‐pass filtered at 2 kHz with a 4‐pole Bessel analog filter, digitized at 4 kHz to 10 kHz using a pCLAMP 10.2 (Molecular Device). Recorded membrane potentials were corrected by −10 mV to compensate for the liquid junction potential. Briefly, the peak I Na was elicited by a series of 40‐milliseconds test potentials varying from −90 to +15 mV in 5‐mV increments from a holding potential of −90 mV at a frequency rate of 0.1 Hz. 17 Total K+ current was elicited by a series of 500‐milliseconds test potentials varying from −110 to +50‐mV in 10‐mV increments from a holding potential of −80 mV at a frequency rate of 0.1 Hz. 20 APs were recorded at a frequency rate of 4 Hz with whole‐cell current‐clamp protocol by injection of brief (2.5‐5 milliseconds) stimulus currents (0.4–0.7 nA). L‐type Ca2+ current (I CaL) was elicited by a series of 250‐milliseconds test potentials at a frequency of 0.1 Hz varying from −50 mV to +60 in 5‐ to 10‐mV increments from a holding potential of −90 mV preceded by a prepulse of 50 milliseconds at −50 mV in order to inactivate I Na and T‐type Ca2+ current (I CaT). 16 , 22 All cellular electrophysiological experiments were performed at room temperature (20–22 °C).
ELISA Experiments
Plasma concentrations of ANG II were measured using an Assay Max Human Angiotensin II Elisa Kit (AssayPro LLC), following the manufacturer’s instructions.
Surface ECG
Surface ECG recordings were obtained as previously described. 3 Briefly, mice were anesthetized with isoflurane (2%) and their body temperature was monitored and maintained at 37 °C using a heating pad. Platinum electrodes positioned subcutaneously were connected to a Biopac System MP100 (EMKA Technologies). Surface ECG in lead I configuration were recorded at a rate of 2 kHz for 5 minutes of continuous experimental recording. The signal was filtered at 100 Hz (low pass) and 60 kHz (notch filter). Data were analyzed using ECG auto 2.8 (EMKA Technologies). The P‐wave and PR interval were calculated manually by a blinded observer from signal‐averaged ECG recordings (on 500–1000 cardiac cycles).
EPS Protocols
AF susceptibility was assessed using EPS in anaesthetized mice (2% isoflurane). EPS protocols were used as previously described. 23 Briefly, a heating pad was used to monitor and keep the mice body temperature at 37 °C. A 1.2F or a 1.9F octapolar electrophysiology catheter (Transonic Scisense Inc.), for 50‐day and 6‐month mice, respectively, was introduced into the heart via the right jugular vein and slowly lowered towards the right atria. Bipolar recordings were obtained from the distal 2 electrode pairs. Pacing of the right atrium was performed by triggering a stimulus at twice the diastolic threshold using a custom‐built computer‐based stimulator (509 Stimulator, Grass‐Telefactor). The induction of arrhythmias was tested through 8‐atrial burst stimulation protocols (5 seconds at S1S1: 50–10, 10‐milliseconds stepwise reduction). AF was defined as a rapid, irregular atrial rhythm lasting for at least 1 second, measured from the end of the last stimulation burst‐spike to the first sinus rhythm P‐wave on the ECG. All mice underwent identical pacing stimulation protocols in the same controlled conditions. “n” for EPS experiments were 50 days: controls 13 and AT1R 12; and 6 months: controls 10 and AT1R 13.
Picrosirius Red
The atrial interstitial collagen was quantified using the Picrosirius red staining technique adapted from Boldt et al 24 protocol. Mice were anesthetized with 2% isoflurane and then euthanized by cervical dislocation. The left atria were removed and fixed in 10% buffered formalin overnight at 4 °C. The tissues were then embedded in paraffin and cut longitudinally at a thickness of 8 µm using a microtome. The sections were deparaffinized in xylene and rehydrated in graded ethanol series before being stained using a Picrosirius red solution (0.1% Direct Red 80 [Sigma‐Aldrich Corp] in saturated aqueous picric acid) for 1 hour. Slides were washed twice with acidified water (0.5% acetic acid) and dehydrated before coverslipping with Permount medium (Fisher Chemical). The images of the sections were taken in brightfield using a Qicam optic camera (Teledyne Qimaging). Endocardium fibrosis quantification was performed using the software ImageJ.
Quantitative Polymerase Chain Reaction
Nppa (coding for atrial natriuretic peptide) and Cacna1c (coding for CaV1.2) messenger RNA (mRNA) quantification was performed as previously published. 3 , 16 Reverse transcription and quantitative polymerase chain reaction (qPCR) were performed on total RNA isolated from left atria of control and AT1R mice. Total RNA was isolated from the left atria with a RNeasy fibrous tissue kit (Qiagen) and treated with DNase I to prevent contamination by genomic DNA. Complementary DNA was synthesized with a Maxima Reverse Transcriptase enzyme kit (Fermentas) and primers specific for the genes of interest. qPCR was then performed using a DyNAmo Color Flash SYBR Green qPCR kit (Thermo Scientific) and a real‐time polymerase chain reaction system (MX3005P QPCR system; Stratagene). Each sample was analyzed in triplicate and the analysis of mRNA expression was quantified relative to the mean level of 2 housekeeping genes (murine cyclophyllin and succinate dehydrogenase complex subunit A mRNA) signal. For these qPCR experiments, 2 left atria were used per sample (n).
qPCR experiments for the following genes: Gja5 (encoding Cx40), Gja1 (encoding Cx43), and Scn5a (encoding NaV1.5) were performed according to the following protocols. In brief, total RNA was isolated from the left atria of controls and AT1R mice using Trizol Reagent (Sigma‐Aldrich) and chloroform. Total RNA was then treated with DNase Kit Nucleospin RNA (Machery‐Nagel) to prevent contamination by genomic DNA. Complementary DNA was synthesized with a High‐Capacity cDNA Reverse Transcription Kit (Applied Biosystems). qPCR experiments were performed using Sybr Select Master Mix (Applied Biosystems) and a real‐time polymerase chain reaction system (Quantstudio 3; Applied Biosystems). Primers specific for the genes of interest were used and relative mRNA expression was quantified according to the 2−∆∆Ct analysis technique using the mean level of 3 housekeeping genes (hypoxanthine‐guanine phosphoribosyltransferase, β2 microglobulin, and cyclophilin mRNA), and the mean level of the corresponding controls group. Each sample was analyzed in duplicate and 1 left atrium was used per sample (n).
Sarcolemmal‐Enriched Protein Isolation
Protocols used for sarcolemmal‐enriched protein fraction isolation and Western blot experiments have been previously described. 3 , 17 , 25 In brief, atria were pooled and homogenized in an ice‐cold extraction buffer that contained a mix of protease and phosphatase inhibitors. Preparation was centrifuged at 10 000g for 10 minutes to remove cell debris. Supernatant was collected and centrifuged at 200 000g for 20 minutes. The pellet was resuspended in the KCl (0.6 mol/L)‐supplemented homogenizing buffer and incubated for 10 minutes to dissociate myofibrillar proteins. Samples were then centrifuged at 200 000g and pellets were washed 3 times with the homogenizing buffer and subsequently centrifuged at 200 000g. Samples were used as sarcolemmal‐enriched proteins and preserved for short‐time storage at −20 °C.
Western Blot Experiments
NaV1.5, Cx40, and Cx43 Western blot experiments were performed using 30 μg of protein isolated from both left and right atria of 8 mice (16 atria/n, n=3 per group, 24 mice per group). Protein concentration was assessed using a standard Bradford assay (Bio‐Rad Laboratories). For each sample, 30 μg of protein were loaded in separate wells and separated in stain‐free gel (TGX 7.5% Stain‐Free; Bio‐Rad Laboratories). Following migration, the gel stain‐free photoactivation was performed using a ChemiDoc apparatus (Bio‐Rad Laboratories). Proteins were then electrophorically transferred onto a polyvinylidene difluoride membrane. Membrane stain‐free imaging was used to quantify total protein per sample and confirm uniformity of loading and transfer. The membranes for NaV1.5 were blocked in Tris‐buffered saline Tween‐20 solution (TBST) containing 5% nonfat dry milk for 4 hours at room temperature, while the membranes for Cx40 and Cx43 were blocked in TBST containing 5% BSA for 4 hours. Primary antibodies (ABCAM Anti‐Nav [ab53724] 1:250; Invitrogen Anti‐Cx40 [36–4900] 1:1000; Invitrogen Anti‐Cx43 [71‐0700] 1:2500) were added to a TBST/5% nonfat dry milk or 5% BSA solution and incubated at 4 °C overnight. The membranes were washed in TBST/5% nonfat dry milk solution and then incubated for 2 hours with the horseradish peroxidase–conjugated secondary antibody at room temperature. Immunoreactive bands were detected using enhanced chemiluminescence reagents (ECL plus, Perkin Elmer) and bands were visualized in film‐free chemiluminescence using the ChemiDoc apparatus. The total protein content in each lane, as revealed by the stain‐free quantification, was determined and used to normalize the quantity of sarcolemmal protein immunoreactivity as concluded using Image Lab software (Bio‐Rad Laboratories). Figures S1 and S2 show stain‐free imaging used for total protein quantification for NaV1.5, Cx40, and Cx43 Western blot normalization.
For protein kinase C (PKC) alpha (PKCα), sarcolemmal‐enriched proteins from 50‐day and 6‐month‐old mice were isolated from left atrial tissues. At 50 days, 10 left atria were pooled per number (n=3 per group for a total of 30 left atria per group). Protein concentration was assessed using the standard Bradford assay, and 10 μg of protein for each sample was loaded into separate wells and separated in a precast gradient stain‐free gel (TGX 4%–15% Stain‐Free; Bio‐Rad Laboratories). At 6 months, 7 left atria were pooled per number (n=3 per group for a total of 21 left atria per group). Because of the limited amount of material available, protein assays were not performed. For each experimental condition, tissue was extracted at a constant ratio of sample buffer to tissue mass and, following centrifugation, the entire volume of sample extract was applied to the appropriate wells of 7.5% stain‐free gels. Following migration, the gels stain‐free photoactivation were performed using the ChemiDoc apparatus. Proteins were then electrophorically transferred onto a polyvinylidene difluoride membrane. Membrane stain‐free imaging was used to quantify total protein per sample and confirm loading and transfer uniformity. The membranes were blocked in TBST containing 5% nonfat dry milk for 2 hours at room temperature. Primary antibodies (PKCα 1:2000; Cell Signaling) were added to a TBST/3% nonfat dry milk solution and incubated at 4 °C overnight. The membranes were washed in TBST/5% nonfat dry milk solution and then incubated for 2 hours with the horseradish peroxidase–conjugated secondary antibody at room temperature. Immunoreactive bands were detected using enhanced chemiluminescence reagents (ECL plus, Perkin Elmer) and bands were visualized in film‐free chemiluminescence using the ChemiDoc apparatus. The total protein content in each lane, as revealed by the stain‐free quantification, was determined and used to normalize the quantity of sarcolemmal protein immunoreactivity as determined using Image Lab software (Bio‐Rad Laboratories). Figure S3 shows stain‐free imaging used for PKCα Western blot normalization.
Statistical Analysis
All of the results are expressed as mean±SEM, and “n” indicates the number of cells. Unpaired 2‐tailed Student t test or Pearson chi‐square test were used when appropriate. Statistical analysis was performed using Origin 8.0 (OriginLab Corporation). A P value <0.05 was considered statistically significant.
Results
Atrial Cellular Hypertrophy and Fibrosis in 6‐Month AT1R Mice
We first determined whether, using AT1R mice at 50 days and 6 months, we could discriminate the effects of AT1R overexpression from those resulting from atrial structural remodeling. Figure 1A shows that atrial cell capacitance of 50‐day AT1R mice (54.5±1.6 pF) was comparable to control mice (53.0±1.6 pF). However, in 6‐month AT1R mice, there was a 44% increase in cell capacitance (68.5±2.7 pF) compared with controls (47.9±1.3 pF). Nppa gene expression (encoding atrial natriuretic peptide) was comparable in 50‐day AT1R and control mice, but a 2‐fold increase in Nppa transcripts was observed in 6‐month AT1R mice compared with controls (*P<0.01) (Figure 1B). Atrial fibrosis was not different between left atrial tissues from 50‐day AT1R (3.1%±0.8%) and control (3.6%±0.3%) mice. However, collagen deposits were significantly increased in 6‐month AT1R mice (17.2%±2.5%) compared with controls (3.7%±0.8%, *P<0.01) (Figure 1C and 1D). These data demonstrate clear evidence of hypertrophy at the cellular and molecular levels and the presence of fibrosis in the left atrium of AT1R mice at 6 months but not at 50 days. Thus, these age groups are suitable to discriminate the effects induced by AT1R overexpression from those secondary to structural remodeling. Of note, ANG II circulating levels were unchanged by AT1R overexpression (Table).
Figure 1. Structural remodeling is only present in angiotensin II type 1 receptor (AT1R) mice at 6 months.
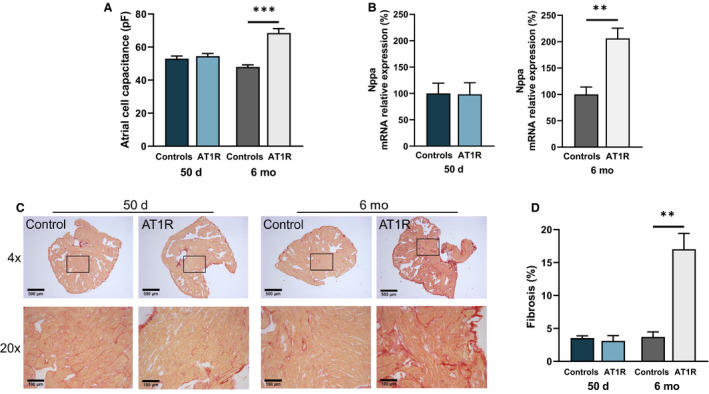
A, Cell capacitance measurements in left atrial myocytes from 50‐day (controls, n=60; AT1R, n=62 [P=0.1918]) and 6‐month (controls, n=29; AT1R, n=20 [***P<0.0001]) mice indicate that cellular hypertrophy is only observed in 6‐month AT1R mice. B, The relative messenger RNA (mRNA) expression of Nppa was unchanged between AT1R and control mice at 50 days (n=4; P=0.9517) but was increased in 6‐month AT1R mice compared with controls (controls, n=3; AT1R, n=4 [**P=0.0050]). C, An example of Picrosirius red staining of paraffin‐embedded left atrial sections of 50‐day and 6‐month controls and AT1R mice at 4× and 20× magnification. Collagen deposits are stained in red and myocardium in yellow. D, Interstitial fibrosis signal quantification (%) of 50‐day and 6‐month mice (n=3 per group) shows an increase only in 6‐month AT1R mice (50 days, P=0.5685; 6 months, **P=0.0030). Statistical analysis of Figures 1, 2, 3, 4, 5, 6, 7, 8 was performed using 2‐tailed Student t test. Statistical significance interpretation: *P<0.05; **P<0.01; ***P<0.0001.
AT1R Overexpression Reduces Atrial I Na Density in AT1R Mice
Data illustrated in Figure 2A show a clear reduction of ≈65% of I Na density in atrial myocytes from 50‐day AT1R mice (at −40 mV: −9.6±1.4 pA/pF) relative to their age‐matched controls (−27.1±2.1 pA/pF). In 6‐month AT1R mice, I Na density was reduced by 60% (at −40 mV, controls: −29.2±3.9 pA/pF; AT1R: −11.6±2.0 pA/pF) (Figure 2B). AT1R overexpression had no effects on the I Na activation and inactivation kinetics properties (Figure 2C through 2F), ruling out the possibility that change in these kinetics properties explained the reduced I Na density.
Figure 2. Electrophysiological properties of Na+ current (I Na) in left atrial myocytes of angiotensin II type 1 receptor (AT1R) and control mice.
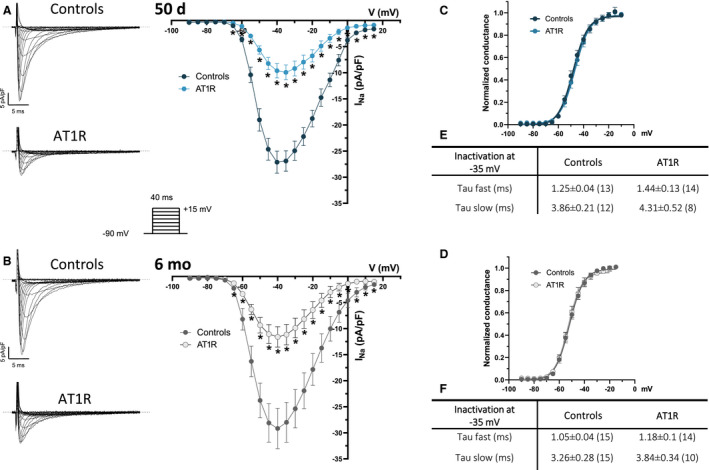
A and B, (Left) Typical current recordings of I Na in left atrial myocytes from controls and AT1R mice (voltage protocol shown in inset). The dotted lines indicate zero current in this figure. (Right) Mean I Na current‐voltage (I–V) relationships show a reduction of I Na density in AT1R at 50 days (controls, n=13; AT1R, n=14 [*P<0.05]) and 6 months (controls, n=15; AT1R, n=15 [*P<0.05]). C and D, At both ages, neither the voltage at half‐maximal activation (V 1/2) at 50 days (controls, −47.2±1.4 mV; AT1R, −46.6±1.3 mV [P=0.7721]) and 6 months (controls, −51.6±1.1 mV; AT1R, −50.8±1.5 mV [P=0.6488]) nor the slope factor at 50 days (controls, 6.0±0.5; AT1R, 5.2±0.3 [P=0.2208]) and 6 months (controls, 5.3±0.2; AT1R, 5.1±0.3 [P=0.5430]) were affected by AT1R overexpression. Activation kinetics parameters were obtained from the activation curves fitted to the Boltzmann equation. E and F, Summary tables show that inactivation kinetics are similar between controls and AT1R mice at both 50 days (at −35 mV, Tau fast: P=0.1676; Tau slow: P=0.3526) and 6 months (at −35 mV, Tau fast: P=0.1817; Tau slow: P=0.1813). Values represent mean±SEM and *P values <0.05 vs controls, with “n” in parenthesis.
AT1R Overexpression Has No Impact on Sodium Channel Expression But Increases Sarcolemmal PKCα Protein Expression
The cardiac Na+ channel gene transcript (Scn5a, encoding NaV1.5) was only reduced in 6‐month AT1R mice (Figure 3A). However, the sarcolemmal protein expression of NaV1.5 was similar in AT1R mice of both age groups compared with their respective controls (Figure 3B), indicating that change in sodium channel protein expression is not responsible for the lower I Na density observed in AT1R mice.
Figure 3. Angiotensin II type 1 receptor (AT1R) overexpression does not affect sodium channel protein expression, but increases protein kinase C alpha (PKCα) sarcolemmal protein expression.
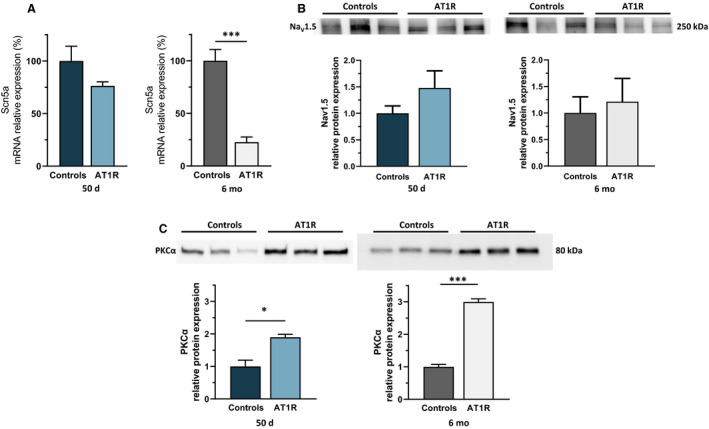
A, Scn5a messenger RNA (mRNA) expression is similar at 50 days in AT1R mice compared with controls (n=6; P=0.1053) but is reduced at 6 months (n=6; ***P<0.0001). B, However, Nav1.5 protein expression is unaffected at both 50 days (16 atria/n, n=3; P=0.2474) and 6 months (P=0.7086). C, Western blot analysis shows an increase in sarcolemmal PKCα protein expression in AT1R mice compared with controls at 50 days (10 left atria were pooled per n, n=3 per group; *P=0.0131) and at 6 months (7 left atria were pooled per n, n=3 per group; ***P<0.0001). Film‐free chemiluminescence protein signal was normalized by the total protein content using stain‐free quantification (see Figures S1 and S3 for corresponding stain‐free images). Statistical significance interpretation: *P<0.05; **P<0.01; ***P<0.0001.
PKCα is known to be activated by ANG II signaling 26 , 27 and to play major roles in cardiac electrophysiology, including modulation of NaV1.5. 17 , 28 Notably, we previously demonstrated that ventricular I Na is modulated by PKCα activity in AT1R mice. 17 Since PKCα activation requires translocation to the sarcolemmal membrane, we compared the sarcolemmal expression of PKCα using Western blot analysis. Sarcolemmal PKCα levels were higher in AT1R mice compared with controls at both 50 days and 6 months (7–10 left atria were pooled per n, n=3 per group) (Figure 3C), suggesting that chronic AT1R stimulation induces PKCα activation.
Atrial Structural Remodeling Decreases I CaL Density in AT1R Mice
The I CaL density was comparable between 50‐day AT1R (at 0 mV, −3.7±0.2 pA/pF) and control (−4.2±0.3 pA/pF) mice (Figure 4A) and there was no significant difference in mRNA expression of L‐type Ca2+ channel gene (Cacna1c, encoding Cav1.2) between both groups (Figure 4C). However, data obtained in 6‐month AT1R myocytes (Figure 4B) show that I CaL density was reduced (at 0 mV, AT1R: −3.6±0.2 pA/pF; controls: −5.4±0.4 pA/pF). Consistent with lower I CaL density, there was a 30% reduction of Cacna1c transcript in 6‐month AT1R mice (*P<0.05) (Figure 4D). These results indicate that unlike I Na, I CaL is not directly affected by the overexpression of AT1R. However, the presence of structural remodeling was associated with a reduced I CaL through Cacna1c transcriptional regulation.
Figure 4. L‐type Ca2+ current (I CaL) density and Cacna1c messenger RNA (mRNA) expression are reduced only by hypertrophy.
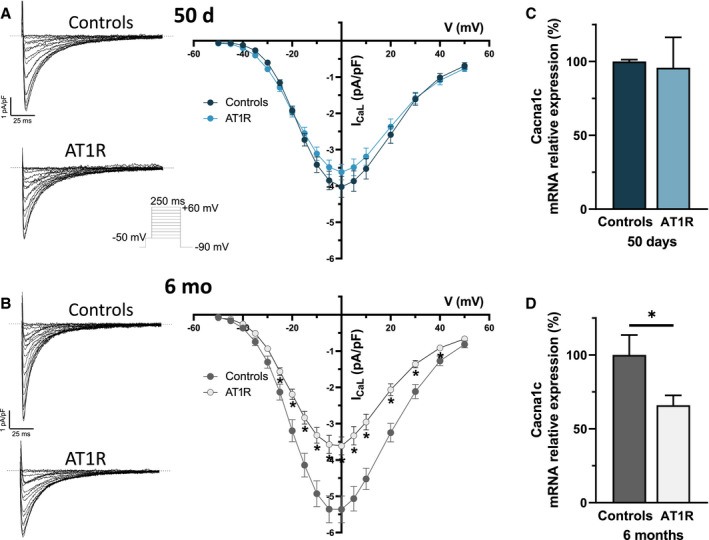
A and B, (Left) Typical I CaL recordings in left atrial myocytes of controls and angiotensin II type 1 receptor (AT1R) mice (voltage protocol shown in inset). (Right) Mean I CaL I–V curve show a reduction of I CaL density in AT1R only at 6 months (controls, n=28; AT1R, n=26 [*P<0.05]), whereas the current density is similar at 50 days (controls, n=21; AT1R, n=25 [P=0.12]). C and D, Cacna1c mRNA expression in AT1R mice compared with controls was similar at 50 days (controls, n=3; AT1R, n=4 [P=0.8247]) and reduced at 6 months (n=4; *P=0.0399).
Atrial K+ Currents Are Unchanged by AT1R Overexpression
In 50‐day mice, the density of the outward (at +30 mV, controls: 18.6±2.2 pA/pF; AT1R: 15.1±1.3 pA/pF) and inward (at −110 mV, controls: −14.8±3.7 pA/pF; AT1R: −14.5±2.8 pA/pF) portion of total K+ current was similar between controls and AT1R atrial myocytes (Figure 5A). In 6‐month mice, the outward portion of total K+ current was also similar between AT1R mice (at +30 mV, 12.6±0.8 pA/pF) and controls (at +30 mV, 14.1±0.9 pA/pF) (Figure 5B). However, in 6‐month AT1R mice, the inward portion of the K+ currents was reduced between −90 mV and −110 mV (at −110 mV, −17.8±1.7 pA/pF; n=9) compared with control mice (at −110 mV, −12.9±0.8 pA/pF; n=15 [*P=0.0464]). As these differences were observed only at voltages more negative than −90 mV, there was no impact on the resting membrane potential. Taken together, these results indicate that AT1R overexpression had no physiological impact on atrial K+ currents.
Figure 5. K+ currents in left atrial myocytes of controls and angiotensin II type 1 receptor (AT1R) mice.
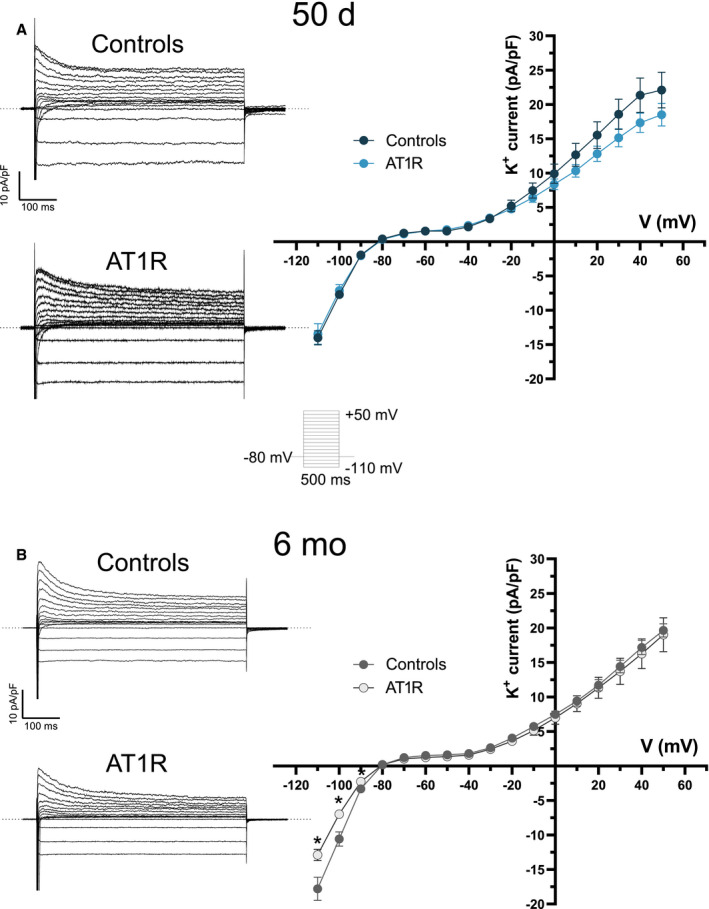
A and B, (Left) Typical recordings of total K+ currents in left atrial myocytes of controls and AT1R mice in both age groups obtained with the voltage protocol shown in inset. (Right) Mean K+ I–V relationships show no difference in K+ currents between controls and AT1R mice at 50 days (controls, n=17; AT1R, n=13). At 6 months, there was no difference in the density of the outward K+ current between the 2 groups, but a significant reduction in the inward current (I K1) between −110 mV and −90 mV (6 months: controls, n=15; AT1R, n=9) was observed in AT1R mice.
Atrial Cx40 Expression Is Decreased in AT1R Mice
The transcript level of Cx40 (Gja5) was reduced by 76% in AT1R mice of both age groups (Figure 6A) and a significant reduction in the mRNA expression of Cx43 (Gja1) was also observed in 50‐day (31%) and 6‐month (52%) AT1R mice (Figure 6C). The protein expression of Cx40 was also reduced by AT1R overexpression (50 days: 33%; 6 months: 48%) (Figure 6B). However, Cx43 protein expression levels remained similar between controls and AT1R mice of both ages (Figure 6D). These results indicate that changes in Cx40 expression, which is the main isoform responsible for atrial cell‐to‐cell coupling, occur before the development of structural remodeling.
Figure 6. Connexin 40 (Cx40) expression was reduced in angiotensin II type 1 receptor (AT1R) mice of both age groups but Connexin 43 (Cx43) protein expression was not affected.
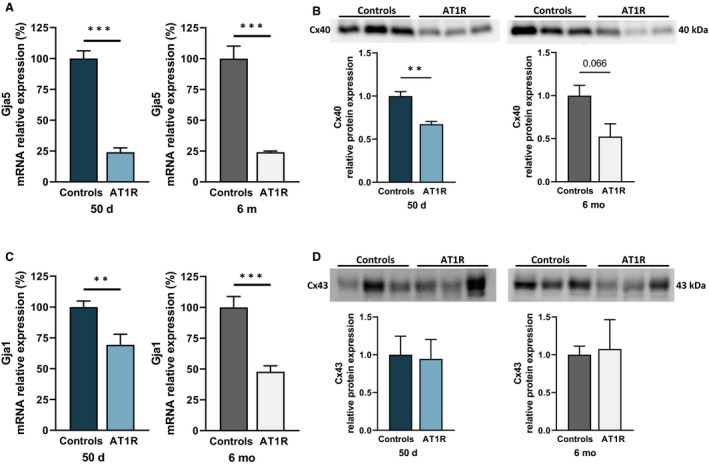
A, Atrial Gja5 (Cx40) messenger RNA (mRNA) expression was reduced at both ages in AT1R mice (50 days and 6 months, n=6; *P<0.0001). B, Cx40 protein expression was reduced in AT1R mice compared with their respective controls at 50 days and also tended to be reduced at 6 months (50 days, *P=0.0057; 6 months, P=0.0660 [n=3 per group]) (see Figures S1 and S2 for stain‐free images). C, Quantitative polymerase chain reaction results showed a reduction in Gja1 (Cx43) mRNA expression in 50‐day and 6‐month AT1R mice (50 days, *P=0.0068; 6 months, *P=0.0002; n=6 per group). D, However, Cx43 protein expression was not changed by AT1R overexpression (50 days, P=0.8846; 6 months, P=0.8606; n=3 per group). Film‐free chemiluminescence protein signal was normalized by the total protein content using stain‐free quantification (see Figure S2 for stain‐free images). Statistical significance interpretation: *P<0.05; **P<0.01; ***P<0.0001.
AT1R Overexpression Alters Atrial Action Potential Waveform and Atrial Conduction
We examined the atrial AP waveform, specifically the AP amplitude and the maximal velocity of the AP upstroke (V max) in AT1R mice. The results show that both parameters were significantly reduced in atrial myocytes from 50‐day and 6‐month AT1R mice (Figure 7). AP durations measured at 90% of repolarization and resting membrane potentials were similar between AT1R and control mice at both ages, consistent with the K+ current data. Furthermore, surface ECG recordings reveal that P‐wave duration and PR interval were significantly prolonged in 50‐day AT1R mice and further increased in the presence of hypertrophy (Figure 8). These results demonstrate that the decrease in I Na caused by AT1R overexpression leads to a reduction in AP amplitude and V max and that these alterations, associated with the lower Cx40 expression, delay atrial conduction time as evidenced by the prolonged P‐wave duration and the corresponding prolongation of the PR interval.
Figure 7. Action potential (AP) parameters of controls and angiotensin II type 1 receptor (AT1R) mice at 50 days and 6 months.
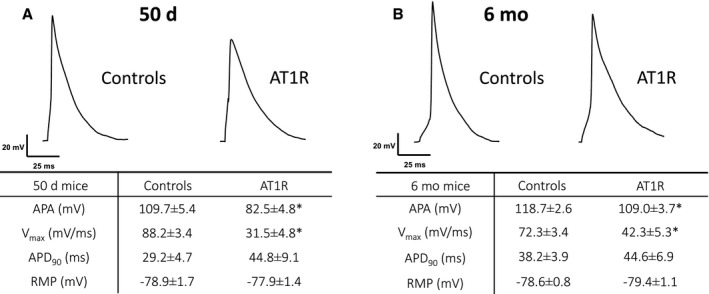
Typical AP recorded from isolated atrial myocytes of (A) 50‐day (controls, n=14–15; AT1R, n=10) and (B) 6‐month (controls, n=21; AT1R, n=15) mice. Associated tables show measurements of AP parameters (mean±SEM). AP amplitude (APA) and maximal velocity of AP upstroke (V max) were reduced at both ages by AT1R overexpression (APA: 50 days, *P=0.0012; 6 months, *P=0.0295) (V max: 50 days, *P=0.0002; 6 months, *P<0.0001), while the AP duration at 90% of repolarization (APD90) and the resting membrane potential (RMP) were similar between AT1R and control mice (50 days, P=not significant; 6 months, P=not significant).
Figure 8. Alteration of ECG parameters related to atrial conduction control and angiotensin II type 1 receptor (AT1R) mice at 50 days and 6 months.
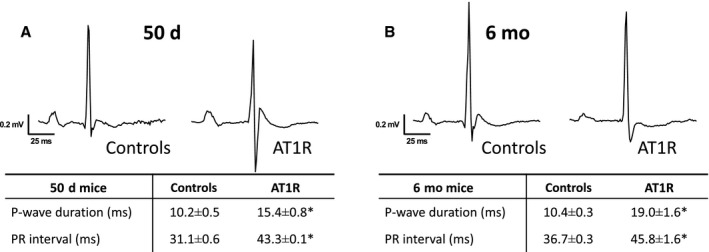
Typical recording of surface ECG from controls and AT1R mice at 50 days (A) and at 6 months (B). The associated tables show mean±SEM values of PR interval and P‐wave duration. AT1R overexpression is associated with prolonged PR interval (50 days, *P<0.0001; 6 months, *P=0.0008) and P‐wave duration (50 days and 6 months, *P<0.0001) in surface ECG at both 50 days (controls, n=11; AT1R, n=7) and 6 months (n=9 per group).
AF Susceptibility in AT1R Mice
When subjected to the same EPS protocols, 50‐day AT1R mice developed AF slightly more often than control mice (controls, 38.5%; AT1R, 50% [P=not significant]) (Figure 9), suggesting that AT1R‐induced electrical remodeling tends to favor AF. In 6‐month AT1R mice, the presence of structural remodeling further increased AF susceptibility (controls, 40%; AT1R, 69.2% [P=not significant]).
Figure 9. Angiotensin II type I receptor (AT1R) overexpression tends to favor atrial fibrillation (AF) vulnerability.
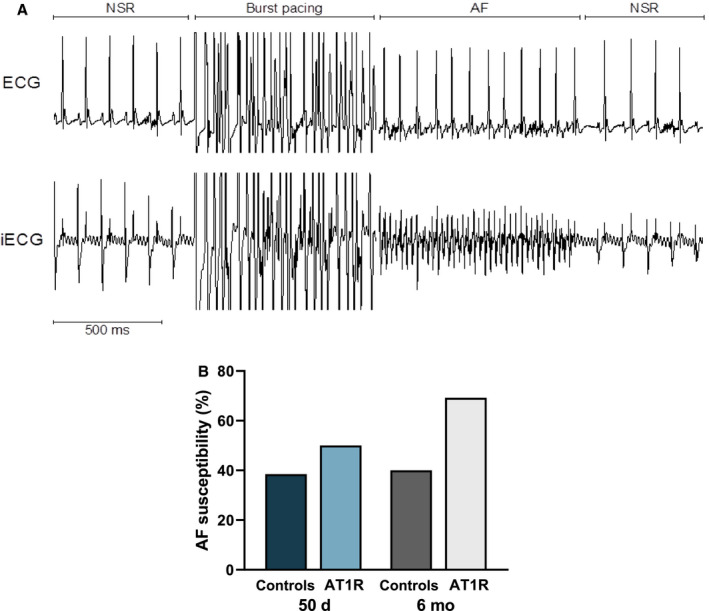
A, Typical recordings of surface ECG and intracardiac electrophysiological recordings (iECG) on a 6‐month mouse that experienced an AF episode after a burst pacing protocol followed by a return to normal sinus rhythm (NSR). B, Although the increase did not reach statistical significance, AF incidence was slightly increased in 50‐day AT1R mice and more markedly at 6 months. Pearson's chi‐square test was used to assess statistical significance.
Discussion
To determine whether ANG II directly influences atrial electrophysiological function, we used transgenic mice with cardiomyocyte‐specific overexpression of ANG II type 1 receptor (AT1R mice) before (50 days) and after (6 months) the development of atrial structural remodeling. Our results suggest that chronic AT1R activation reduced I Na through PKCα activation. Moreover, Cx40 expression was also decreased in AT1R mice, independently of structural remodeling. These alterations were associated with delayed atrial conduction and a relative increase in AF susceptibility.
Earlier studies have associated different heart diseases with a modulation of NaV1.5 channel by PKC isoforms. 17 , 26 , 27 We have previously been able to demonstrate that PKCα activation selectively downregulates I Na in the ventricles of AT1R mice, while other PKC isoforms were not involved. 17 PKCα is an effector present in the ANG II‐AT1R signaling pathway that is translocated to the membrane when activated. 26 , 29 The kinase proximity allows the phosphorylation of NaV1.5 channel, resulting in a decrease of I Na density. 17 Studies have shown that the use of a selective PKCα translocation blocker or PKC inhibitors restored I Na density to control levels and that PKC activators such as PMA reduced I Na. 17 , 28 , 29 Here, we showed increased PKCα expression in sarcolemmal protein isolated from atrial tissues of AT1R mice, suggesting that chronic AT1R stimulation leads to PKCα translocation and activation. These data, along with previous reports, strongly support the role of PKCα in reducing I Na density in the atrial myocytes of AT1R mice. Additionally, this regulation occurs before the development of structural remodeling, similarly to what has been observed in the ventricles of AT1R mice. 17
We found that Scn5a mRNA expression was reduced only in 6‐month AT1R mice, suggesting that its transcription is only regulated by structural remodeling, but without an effect on NaV1.5 protein expression or additional effect on I Na density. The fact that atrial structural remodeling is often already present in patients with AF and experimental models probably explains the reduction in Scn5a expression reported in some studies. 24 , 30
In our study, we found that among the different atrial ionic currents and connexins examined, only I CaL was decreased by the AT1R‐induced atrial structural remodeling. Consistent with our results, Alvin et al 31 found that volume overload hypertrophy reduced I CaL in rat myocytes and that 3 weeks of treatment with captopril, an angiotensin‐converting enzyme inhibitor, restored current density. Earlier studies, including ours, have reported an association between ANG II activity and lower I CaL density. Indeed, we previously observed a reduced I CaL density (and CaV1.2 expression) in ventricular myocytes from AT1R mice. 16 , 18 Moreover, Laszlo et al 32 have shown that the use of enalapril (an angiotensin‐converting enzyme inhibitor), increased I CaL density in rabbit atrial myocytes, but could not revert the decrease in I CaL density caused by rapid atrial pacing. Their results suggest that the benefits of RAS inhibition may depend on the involvement of RAS activation in the underlying mechanisms of AF generation. 33 , 34 Alternatively, the reduction of I CaL can be a compensatory mechanism in response to the increased cytosolic Ca2+ concentration following rapid atrial pacing, rendering the use of enalapril ineffective.
It has been reported that increased local production of ANG II in the heart leads to atrial morphological changes. 8 In addition, using a transgenic mouse model combining AT1R overexpression and angiotensinogen knockout (to block the synthesis of ANG II), Yasuda et al 35 found an increase in atrial dilatation accompanied by fibrosis, and these effects were prevented by candesartan, an AT1R antagonist. Here, we showed that younger mice overexpressing AT1R had longer atrial conduction time, independent of structural remodeling, which led to a slight increase in AF vulnerability. However, the presence of structural remodeling found in older AT1R mice further delayed atrial conduction, and leads to more episodes of AF. This is not surprising given that fibrosis worsens conduction heterogeneity, thereby promoting reentrant circuits and hence arrhythmias. It should be noted that atrial remodeling induced by ANG II signaling was independent of hemodynamic changes, thus highlighting the direct effect of RAS on the heart and in AF pathophysiology. Recently, Jansen et al 28 reported that ANG II–mediated hypertension was associated with significant atrial remodeling in mice and enhance AF vulnerability. Similar to our findings, they found that atrial conduction was impaired in association with a reduction in I Na mediated by PKCα. However, they described a more severe phenotype, with reduction of atrial K+ currents, more pronounced atrial fibrosis, and a significant increase in AF occurrence. Their results suggest that in addition to the direct effects of ANG II, the presence of hypertension and related hemodynamic changes result in more severe electrical and structural remodeling.
This study reveals significant differences between atrial and ventricular remodeling mediated by chronic AT1R activation. We previously showed that ventricular Ca2+ and K+ currents were both reduced in AT1R mice independently of hypertrophy. 3 , 16 , 17 , 18 Interestingly, in atrial myocytes, these ionic currents are not directly influenced by ANG II signaling. In fact, our results show that atrial K+ currents are unaffected by AT1R overexpression or structural remodeling, whereas I CaL is reduced only secondary to structural remodeling. These findings indicate that chronic AT1R activation regulates these ionic currents differently depending on the heart chamber. However, our studies show that chronic AT1R stimulation would reduce I Na through PKCα activation in both ventricles and atria. 17 A better understanding of these distinct regulatory mechanisms between the heart chambers could help develop more specific pharmacological tools and thus improve the management of cardiac arrhythmias.
There are some limitations to our study. Although we have provided supporting evidence for a role of PKCα in decreasing I Na density in atrial myocytes of AT1R mice, the detailed mechanism of this effect has not been investigated here. However, in our previous study, strong evidence established the effect of PKCα on I Na in AT1R ventricular myocytes. 17 Sarcolemmal PKCα expression was found to be elevated in AT1R ventricles in Western blot analysis and immunofluorescence imaging, which also showed co‐localization between PKCα and sarcolemmal NaV1.5 in AT1R ventricular myocytes. 17 Functional data on the effect of PKCα on I Na were obtained in human‐induced pluripotent stem cell–derived cardiomyocytes treated with ANG II, whereas concomitant treatment with a PKCα translocation inhibitor prevented the effect of ANG II. 17 Along with these studies, the findings reported here showing that I Na reduction is accompanied by higher PKCα expression in the sarcolemmal protein of AT1R atria, strongly suggest that the same mechanism also applies. Nevertheless, to fully delineate the mechanism, future studies could extend the findings reported here to include immunofluorescence imaging on atrial myocytes, similar to what we have done in the ventricles.
Conclusions
This study shows that cardiac‐specific AT1R overexpression decreased atrial I Na and connexins expression, which slowed atrial electrical conduction. Importantly, these changes occurred in the absence of hypertension and before the development of atrial structural remodeling. This study provides mechanistic insights into ANG II–induced atrial remodeling that can favor AF development.
Sources of Funding
This work was supported by operating grants to C.F. from the Canadian Institutes of Health Research (MOP‐89934) and the Montreal Heart Institute Foundation.
Disclosures
None.
Supporting information
Figures S1–S3
Acknowledgments
The authors thank N. Éthier, M.A. Gillis, M.E. Matte, K. Rivard, and J. Panasci for their skilled technical assistance, and B.G. Allen for his valuable assistance with Western blot analysis.
Supplemental Material for this article is available at https://www.ahajournals.org/doi/suppl/10.1161/JAHA.121.023974
For Sources of Funding and Disclosures, see page 14.
References
- 1. Chugh SS, Havmoeller R, Narayanan K, Singh D, Rienstra M, Benjamin EJ, Gillum RF, Kim YH, McAnulty JH, Zheng ZJ, et al. Worldwide epidemiology of atrial fibrillation: a Global Burden of Disease 2010 Study. Circulation. 2014;129:837–847. doi: 10.1161/CIRCULATIONAHA.113.005119 [DOI] [PMC free article] [PubMed] [Google Scholar]
- 2. Nattel S. New ideas about atrial fibrillation 50 years on. Nature. 2002;415:219–226. doi: 10.1038/415219a [DOI] [PubMed] [Google Scholar]
- 3. Rivard K, Paradis P, Nemer M, Fiset C. Cardiac‐specific overexpression of the human type 1 angiotensin II receptor causes delayed repolarization. Cardiovasc Res. 2008;78:53–62. doi: 10.1093/cvr/cvn020 [DOI] [PubMed] [Google Scholar]
- 4. Iravanian S, Sovari AA, Lardin HA, Liu H, Xiao HD, Dolmatova E, Jiao Z, Harris BS, Witham EA, Gourdie RG, et al. Inhibition of renin‐angiotensin system (RAS) reduces ventricular tachycardia risk by altering connexin43. J Mol Med. 2011;89:677–687. doi: 10.1007/s00109-011-0761-3 [DOI] [PMC free article] [PubMed] [Google Scholar]
- 5. Paradis P, Dali‐Youcef N, Paradis F, Thibault G, Nemer M. Overexpression of angiotensin II type 1 receptor in cardiomyocytes induces cardiac hypertrophy and remodeling. Proc Natl Acad Sci. 2000;97:931–936. doi: 10.1073/pnas.97.2.931 [DOI] [PMC free article] [PubMed] [Google Scholar]
- 6. Healey JS, Baranchuk A, Crystal E, Morillo CA, Garfinkle M, Yusuf S, Connolly SJ. Prevention of atrial fibrillation with angiotensin‐converting enzyme inhibitors and angiotensin receptor blockers: a meta‐analysis. J Am Coll Cardiol. 2005;45:1832–1839. doi: 10.1016/j.jacc.2004.11.070 [DOI] [PubMed] [Google Scholar]
- 7. Suo Y, Zhang Y, Wang Y, Yuan M, Kariyawasam S, Tse G, Liu T, Fu H, Li G. Renin–angiotensin system inhibition is associated with reduced risk of left atrial appendage thrombosis formation in patients with atrial fibrillation. Cardiol J. 2018;25:611–620. doi: 10.5603/CJ.a2017.0112 [DOI] [PubMed] [Google Scholar]
- 8. Xiao HD, Fuchs S, Campbell DJ, Lewis W, Dudley SC, Kasi VS, Hoit BD, Keshelava G, Zhao H, Capecchi MR, et al. Mice with cardiac‐restricted angiotensin‐converting enzyme (ACE) have atrial enlargement, cardiac arrhythmia, and sudden death. Am J Pathol. 2004;165:1019–1032. doi: 10.1016/S0002-9440(10)63363-9 [DOI] [PMC free article] [PubMed] [Google Scholar]
- 9. Boldt A, Wetzel U, Weigl J, Garbade J, Lauschke J, Hindricks G, Kottkamp H, Gummert JF, Dhein S. Expression of angiotensin II receptors in human left and right atrial tissue in atrial fibrillation with and without underlying mitral valve disease. J Am Coll Cardiol. 2003;42:1785–1792. doi: 10.1016/j.jacc.2003.07.014 [DOI] [PubMed] [Google Scholar]
- 10. Goette A, Staack T, Röcken C, Arndt M, Geller JC, Huth C, Ansorge S, Klein HU, Lendeckel U. Increased expression of extracellular signal‐regulated kinase and angiotensin‐converting enzyme in human atria during atrial fibrillation. J Am Coll Cardiol. 2000;35:1669–1677. doi: 10.1016/S0735-1097(00)00611-2 [DOI] [PubMed] [Google Scholar]
- 11. Kasi VS, Xiao HD, Shang LL, Iravanian S, Langberg J, Witham EA, Jiao Z, Gallego CJ, Bernstein KE, Dudley SC Jr. Cardiac‐restricted angiotensin‐converting enzyme overexpression causes conduction defects and connexin dysregulation. Am J Physiol. 2007;293:H182–H192. doi: 10.1152/ajpheart.00684.2006 [DOI] [PMC free article] [PubMed] [Google Scholar]
- 12. Maggioni AP, Latini R, Carson PE, Singh SN, Barlera S, Glazer R, Masson S, Cerè E, Tognoni G, Cohn JN, et al. Valsartan reduces the incidence of atrial fibrillation in patients with heart failure: results from the Valsartan Heart Failure Trial (Val‐HeFT). Am Heart J. 2005;149:548–557. doi: 10.1016/j.ahj.2004.09.033 [DOI] [PubMed] [Google Scholar]
- 13. Garg R, Yusuf S. Overview of randomized trials of angiotensin‐converting enzyme inhibitors on mortality and morbidity in patients with heart failure. Collaborative Group on ACE Inhibitor Trials. JAMA. 1995;273:1450–1456. doi: 10.1001/jama.1995.03520420066040 [DOI] [PubMed] [Google Scholar]
- 14. Hattori Y, Atsushi S, Hiroaki F, Toyama J. Effects of cilazapril on ventricular arrhythmia in patients with congestive heart failure. Clin Ther. 1997;19:481–486. doi: 10.1016/S0149-2918(97)80132-4 [DOI] [PubMed] [Google Scholar]
- 15. Lindholm LH, Dahlöf B, Edelman JM, Ibsen H, Borch‐Johnsen K, Olsen MH, Snapinn S, Wachtell K; LIFE study group . Effect of losartan on sudden cardiac death in people with diabetes: data from the LIFE study. Lancet. 2003;362:619–620. doi: 10.1016/S0140-6736(03)14183-9 [DOI] [PubMed] [Google Scholar]
- 16. Rivard K, Grandy SA, Douillette A, Paradis P, Nemer M, Allen BG, Fiset C. Overexpression of type 1 angiotensin II receptors impairs excitation‐contraction coupling in the mouse heart. Am J Physiol. 2011;301:H2018–H2027. doi: 10.1152/ajpheart.01092.2010 [DOI] [PubMed] [Google Scholar]
- 17. Mathieu S, El Khoury N, Rivard K, Gélinas R, Goyette P, Paradis P, Nemer M, Fiset C. Reduction in Na+ current by angiotensin II is mediated by PKCα in mouse and human‐induced pluripotent stem cell‐derived cardiomyocytes. Heart Rhythm. 2016;13:1346–1354. doi: 10.1016/j.hrthm.2016.02.015 [DOI] [PubMed] [Google Scholar]
- 18. Mathieu S, Khoury NE, Rivard K, Paradis P, Nemer M, Fiset C. Angiotensin II overstimulation leads to an increased susceptibility to dilated cardiomyopathy and higher mortality in female mice. Sci Rep. 2018;8:952. doi: 10.1038/s41598-018-19436-5 [DOI] [PMC free article] [PubMed] [Google Scholar]
- 19. Trépanier‐Boulay V, St‐Michel C, Tremblay A, Fiset C. Gender‐based differences in cardiac repolarization in mouse ventricle. Circ Res. 2001;89:437–444. doi: 10.1161/hh1701.095644 [DOI] [PubMed] [Google Scholar]
- 20. Brouillette J, Clark RB, Giles WR, Fiset C. Functional properties of K+ currents in adult mouse ventricular myocytes. J Physiol. 2004;559:777–798. doi: 10.1113/jphysiol.2004.063446 [DOI] [PMC free article] [PubMed] [Google Scholar]
- 21. Grandy SA, Brouillette J, Fiset C. Reduction of ventricular sodium current in a mouse model of HIV. J Cardiovasc Electrophysiol. 2010;21:916–922. doi: 10.1111/j.1540-8167.2009.01713.x [DOI] [PubMed] [Google Scholar]
- 22. El Khoury N, Mathieu S, Fiset C. Interleukin‐1β reduces L‐type Ca2+ current through protein kinase Cϵ activation in mouse heart. J Biol Chem. 2014;289:21896–21908. doi: 10.1074/jbc.M114.549642 [DOI] [PMC free article] [PubMed] [Google Scholar]
- 23. El Khoury N, Ross JL, Long V, Thibault S, Ethier N, Fiset C. Pregnancy and oestrogen regulate sinoatrial node calcium homeostasis and accelerate pacemaking. Cardiovasc Res. 2018;114:1605–1616. doi: 10.1093/cvr/cvy129 [DOI] [PMC free article] [PubMed] [Google Scholar]
- 24. Boldt A, Wetzel U, Lauschke J, Weigl J, Gummert J, Hindricks G, Kottkamp H, Dhein S. Fibrosis in left atrial tissue of patients with atrial fibrillation with and without underlying mitral valve disease. Heart. 2004;90:400–405. doi: 10.1136/hrt.2003.015347 [DOI] [PMC free article] [PubMed] [Google Scholar]
- 25. Lizotte E, Tremblay A, Allen BG, Fiset C. Isolation and characterization of subcellular protein fractions from mouse heart. Anal Biochem. 2005;345:47–54. doi: 10.1016/j.ab.2005.07.001 [DOI] [PubMed] [Google Scholar]
- 26. Malhotra A, Kang BPS, Cheung S, Opawumi D, Meggs LG. Angiotensin II promotes glucose‐induced activation of cardiac protein kinase C isozymes and phosphorylation of troponin I. Diabetes. 2001;50:1918–1926. doi: 10.2337/diabetes.50.8.1918 [DOI] [PubMed] [Google Scholar]
- 27. Murray KT, Hu N, Daw JR, Shin HG, Watson MT, Mashburn AB, George AL. Functional effects of protein kinase c activation on the human cardiac Na sup + channel. Circ Res. 1997;80:370–376. doi: 10.1161/01.RES.80.3.370 [DOI] [PubMed] [Google Scholar]
- 28. Jansen HJ, Mackasey M, Moghtadaei M, Belke DD, Egom EE, Tuomi JM, Rafferty SA, Kirkby AW, Rose RA. Distinct patterns of atrial electrical and structural remodeling in angiotensin II mediated atrial fibrillation. J Mol Cell Cardiol. 2018;124:12–25. doi: 10.1016/j.yjmcc.2018.09.011 [DOI] [PubMed] [Google Scholar]
- 29. Iqbal SM, Lemmens‐Gruber R. Phosphorylation of cardiac voltage‐gated sodium channel: potential players with multiple dimensions. Acta Physiol. 2019;225:e13210. doi: 10.1111/apha.13210 [DOI] [PMC free article] [PubMed] [Google Scholar]
- 30. Sossalla S, Kallmeyer B, Wagner S, Mazur M, Maurer U, Toischer K, Schmitto JD, Seipelt R, Schöndube FA, Hasenfuss G, et al. Altered Na+ currents in atrial fibrillation: effects of ranolazine on arrhythmias and contractility in human atrial myocardium. J Am Coll Cardiol. 2010;55:2330–2342. doi: 10.1016/j.jacc.2009.12.055 [DOI] [PubMed] [Google Scholar]
- 31. Alvin Z, Laurence GG, Coleman BR, Zhao A, Hajj‐Moussa M, Haddad GE. Regulation of L‐type inward calcium channel activity by captopril and angiotensin II via the phosphatidyl inositol 3‐kinase pathway in cardiomyocytes from volume‐overload hypertrophied rat hearts. Can J Physiol Pharmacol. 2011;89:206–215. doi: 10.1139/Y11-011 [DOI] [PMC free article] [PubMed] [Google Scholar]
- 32. Laszlo R, Eick C, Rueb N, Weretka S, Weig HJ, Schreieck J, Bosch RF. Inhibition of the renin‐angiotensin system: effects on tachycardia‐induced early electrical remodelling in rabbit atrium. J Renin‐Angiotensin‐Aldosterone Syst. 2008;9:125–132. doi: 10.1177/1470320308095262 [DOI] [PubMed] [Google Scholar]
- 33. Chaugai S, Meng WY, Ali SA. Effects of RAAS blockers on atrial fibrillation prophylaxis: an updated systematic review and meta‐analysis of randomized controlled trials. J Cardiovasc Pharmacol Ther. 2016;21:388–404. doi: 10.1177/1074248415619490 [DOI] [PubMed] [Google Scholar]
- 34. von Lewinski D, Kockskämper J, Rübertus SU, Zhu D, Schmitto JD, Schöndube FA, Hasenfuss G, Pieske B. Direct pro‐arrhythmogenic effects of angiotensin II can be suppressed by AT1 receptor blockade in human atrial myocardium. Eur J Heart Fail. 2008;10:1172–1176. doi: 10.1016/j.ejheart.2008.09.014 [DOI] [PubMed] [Google Scholar]
- 35. Yasuda N, Akazawa H, Ito K, Shimizu I, Kudo‐Sakamoto Y, Yabumoto C, Yano M, Yamamoto R, Ozasa Y, Minamino T, et al. Agonist‐independent constitutive activity of angiotensin II receptor promotes cardiac remodeling in mice. Hypertension. 2012;59:627–633. doi: 10.1161/HYPERTENSIONAHA.111.175208 [DOI] [PubMed] [Google Scholar]
Associated Data
This section collects any data citations, data availability statements, or supplementary materials included in this article.
Supplementary Materials
Figures S1–S3


