

Abstract
Background
The past decade has seen tremendous growth in patients with ambulatory ventricular assist devices. We sought to identify patients that present to the emergency department (ED) at the highest risk of death.
Methods and Results
This retrospective analysis of ED encounters from the Nationwide Emergency Department Sample includes 2010 to 2017. Using a random sampling of patient encounters, 80% were assigned to development and 20% to validation cohorts. A risk model was derived from independent predictors of mortality. Each patient encounter was assigned to 1 of 3 groups based on risk score.
A total of 44 042 ED ventricular assist device patient encounters were included. The majority of patients were male (73.6%), <65 years old (60.1%), and 29% presented with bleeding, stroke, or device complication. Independent predictors of mortality during the ED visit or subsequent admission included age ≥65 years (odds ratio [OR], 1.8; 95% CI, 1.3–4.6), primary diagnoses (stroke [OR, 19.4; 95% CI, 13.1–28.8], device complication [OR, 10.1; 95% CI, 6.5–16.7], cardiac [OR, 4.0; 95% CI, 2.7–6.1], infection [OR, 5.8; 95% CI, 3.5–8.9]), and blood transfusion (OR, 2.6; 95% CI, 1.8–4.0), whereas history of hypertension was protective (OR, 0.69; 95% CI, 0.5–0.9). The risk score predicted mortality areas under the curve of 0.78 and 0.71 for development and validation. Encounters in the highest risk score strata had a 16‐fold higher mortality compared with the lowest risk group (15.8% versus 1.0%).
Conclusions
We present a novel risk score and its validation for predicting mortality of patients with ED ventricular assist devices, a high‐risk, and growing, population.
Keywords: mortality, risk score, ventricular assist device
Subject Categories: Cardiovascular Disease, Heart Failure, Health Services, Intracranial Hemorrhage, Risk Factors
Nonstandard Abbreviations and Acronyms
- NEDS
Nationwide Emergency Department Sample
- VAD
ventricular assist devices
Clinical Perspective
What Is New?
In this study of over 44 000 emergency department visits of patients with advanced heart failure with ventricular assist devices, we derive and validate a novel risk score based on a combination of readily identifiable demographic and clinical factors.
Predictors of mortality include age ≥65 years; presenting with stroke, device complication, infection, or cardiac complaints; and receiving a blood transfusion. History of hypertension was a protective factor.
Patients with higher risk scores had significantly higher rates of mortality compared with those with lower risk scores; the higher risk group also had higher rates of admission, increased charges, and longer length of stay.
What Are the Clinical Implications?
This novel, simple, and validated emergency department–ventricular assist device risk score, which was generated using a large nationally representative sample, may serve as a useful tool for clinicians caring for a high risk, and rapidly growing, population of patients with ventricular assist devices.
The use of ventricular assist devices (VADs) has grown dramatically over the past decade, with more than 22 000 patients treated with durable VADs in the United States alone. 1 With a limited supply of available organs for transplantation, 2 the growing population of patients with endstage heart failure, 3 and the improvement in the long‐term survival of patients with VADs, this patient population is expected to continue to grow dramatically. 4
As the number of patients with VADs continues to rise, and with the relatively high occurrence of VAD‐associated complications in this clinically complex patient population, the prevalence of emergency department (ED) visits is increasing as well. 5 It is in this context that there has been a growing effort to educate emergency providers about VADs in a way that will allow them to identify VAD‐associated complications and effectively deliver care to a population known to be at high risk of death. 6 , 7 Although the utility of risk prediction before left VAD implantation has been well established, and has led to the development of several risk score models, 8 , 9 , 10 there is currently no validated risk score to evaluate survival in ambulatory patients with VADs who present to the ED. Predicting which patients who present to the ED are at the highest risk of death is essential in guiding management decisions. Thus, the purpose of this study was to create and validate a risk score model and tool to predict mortality in patients with VAD presenting to the ED using clinical characteristics that would be facile, informative, and reliable.
Methods
We used data from the Nationwide Emergency Department Sample (NEDS), sponsored by the Healthcare Cost and Utilization Project, from 2010 through 2017. This database is created and maintained by the Agency for Healthcare Research and Quality and can be accessed at https://www.hcup‐us.ahrq.gov/db/nation/neds/nedsdbdocumentation.jsp. As no patient identifying information was used in the study, the University of Pennsylvania institutional review board granted a waiver of submission for this study. NEDS contains a stratified sample, estimating 20% of ED visits across the United States. NEDS contains sample weights, through which we are able to calculate nationally representative estimates of encounters. The database includes encounter‐level information including patient and hospital demographics, discharge disposition, diagnoses, and resulting inpatient procedures.
Patients aged 18 years or older with a diagnosis code for a VAD (International Classification of Diseases, Ninth Revision [ICD‐9] and International Classification of Diseases, Tenth Revision [ICD‐10] codes: V43.21[9] and Z95.811 [10]) at the time of presentation to the ED were included in our analysis. The primary diagnosis for each encounter was evaluated and grouped into the following categories: cardiac, stroke, device complication, infection, bleeding, gastrointestinal, neurological, respiratory, trauma, and other. In this database, primary diagnoses are mutually exclusive. We prespecified 6 common comorbidities as potential predictors for mortality among these patients: diabetes, cirrhosis, hypertension, depression, dialysis‐dependence, and chronic obstructive pulmonary disease.
Statistical Analysis
We divided the study population randomly into an 80% development sample and 20% validation sample. Within the development cohort, we conducted univariate logistic regression models for each clinically relevant patient and hospital characteristics, with mortality in the ED or resulting inpatient visit as the outcome. The characteristics entered into the univariate models included all primary diagnosis categorizations, prespecified comorbidities, age groups (<65 and ≥65), sex, hospital region, teaching status of hospital, time of visit (weekend versus weekday), payer (government versus private), and location of patient (urban versus rural).
All primary diagnostic categories, and the demographic and chronic medical conditions with at P<0.2 in the univariate analysis, except a history of obesity and bleeding primary diagnoses were considered for inclusion into the multivariate model. Obesity was not considered in the multivariate model as obesity frequently cooccurred with hypertension (66.9%)—which was 4‐fold more common. Because bleeding diagnoses were negatively associated with mortality, whereas blood transfusion was positively associated with mortality, we interpreted this to indicate that the latter is a marker of clinically significant bleeding and therefore would have more clinical relevance for the development of the risk score. We used backward selection at the 0.05 significance level to determine the independent risk factors in our final model. Collinearity was assessed by evaluating the Pearson correlation coefficient for a value over 0.6.
Additionally, we used a bootstrapping method of 200 simulations to generate 200 beta coefficients of the parameters in the final multivariable logistic regression model. As has been previously described for generating risk scores using complex survey data, 11 , 12 median beta coefficients for each parameter were calculated and the lowest median coefficient value was assigned a value of 1. The remaining median coefficients were divided by this lowest median coefficient value and rounded to the nearest integer to derive a component risk score for each variable.
All reference categories were assigned a score of 0. Total risk scores were then summed for each encounter and associated probabilities of mortality were calculated for each score. Total scores were stratified into low‐risk, intermediate‐risk, and high‐risk strata. Weighted logistic regression was used to evaluate the relationship between risk score and death.
We assessed discrimination through the area under the receiver operator characteristic curve (AUC) to estimate the predictive accuracy of the risk score model. An AUC >0.7 has been considered a threshold for good discrimination. 13 Discrimination was assessed similarly in the validation cohort. In addition, we calculated the Youden’s J index to determine the optimal probability cutoff. Using this cutoff, we calculated positive predictive value and negative predictive value.
Furthermore, we evaluated the association between risk strata and admission to an inpatient setting, length of stay if admitted, and overall ED and inpatient charges. Weighted logistic regression was used to evaluate admission, whereas weighted linear regression was used for length of stay and charges. Charges were adjusted to 2017 US dollars using the Consumer Price Index. SAS version 9.4 (SAS Institute, Cary, NC) was used for this analysis.
Results
A total of 882 million ED visits were screened from the NEDS database from 2010 to 2017, of which 44 042 ED encounters of patients with VADs over 8 years were identified. The overall mortality rate was 3.0%, including deaths in either the ED or during an associated admission. The development cohort (N=35 264) and the validation cohort (N=8778) had no significant differences with respect to demographic variables (Table 1). The majority of patients in both the development and validation cohorts were male (73.6% and 73.5%, respectively), younger than 65 years (60.3% and 59.3%), living in an urban zip code (86.5% and 87.1%), and had government insurance as a primary payer (76.9% and 77.3%). Similarly, hospitals were most often metropolitan teaching (86.2% and 85.1%) with a similar distribution across US regions. (P>0.2, for all).
Table 1.
Baseline Demographic Characteristics of Derivation and Validation Cohort
| Characteristic |
Development (80% sample) (n=35 264) |
Validation (20% sample) (n=8778) |
P value |
|---|---|---|---|
| Sex | 0.9616 | ||
| Male | 25 937 (73.6%) | 6451 (73.5%) | |
| Female | 9327 (26.4%) | 2327 (26.5%) | |
| Patient age | 0.3917 | ||
| 18–64 y | 21 253 (60.3%) | 5202 (59.3%) | |
| ≥65 y | 14 010 (39.7%) | 3576 (40.7%) | |
| Time of visit | 0.6239 | ||
| Weekday | 26 413 (74.9%) | 6623 (75.4%) | |
| Weekend | 8851 (25.1%) | 2155 (24.6%) | |
| Region | 0.5085 | ||
| Northeast | 4228 (12.0%) | 1108 (12.6%) | |
| Midwest | 12 915 (36.6%) | 3289 (37.5%) | |
| South | 14 036 (39.8%) | 3462 (39.4%) | |
| West | 4084 (11.6%) | 918 (10.5%) | |
| Teaching status of hospital | 0.1993 | ||
| Metropolitan nonteaching | 2666 (7.6%) | 760 (8.7%) | |
| Metropolitan teaching | 30 399 (86.2%) | 7471 (85.1%) | |
| Nonmetropolitan | 2198 (6.2%) | 547 (6.2%) | |
| Location of patient | 0.4796 | ||
| Urban | 30 438 (86.5%) | 7624 (87.1%) | |
| Rural | 4749 (13.5%) | 1131 (12.9%) | |
| Primary payer | |||
| Government | 26 094 (76.9%) | 6545 (77.3%) | 0.7543 |
| Private | 7826 (23.1%) | 1924 (22.7%) | |
Primary diagnoses, chronic medical conditions, and outcomes were well matched between development and validation cohorts, with no significant differences (Table 2). Mortality was also not significantly different between the groups (3.0% versus 3.2% P=0.5069). Unadjusted predictors of mortality are included in Table S1.
Table 2.
Baseline Clinical Characteristics of Derivation and Validation Cohort
| Characteristic |
Development (80% Sample) |
Validation (20% Sample) |
P value |
|---|---|---|---|
| (N=35 264) | (N=8778) | ||
| Chronic medical conditions | |||
| Dialysis‐dependent | 758 (2.1%) | 208 (2.4%) | 0.5332 |
| Cirrhosis | 241 (0.7%) | 83 (0.9%) | 0.2050 |
| Hypertension | 19 217 (54.5%) | 4709 (53.6%) | 0.5310 |
| Diabetes | 13 386 (38.0%) | 3360 (38.3%) | 0.7867 |
| Obesity | 4576 (13.0%) | 1042 (11.9%) | 0.2210 |
| Chronic obstructive pulmonary disease | 3805 (10.8%) | 972 (11.1) | 0.7120 |
| Depression | 4249 (12.0%) | 962 (11.0%) | 0.1472 |
| Chronic condition, No. | 0.4546 | ||
| 0 | 9204 (26.1%) | 2234 (25.5%) | |
| 1 | 11 642 (33.0%) | 3051 (34.8%) | |
| ≥2 | 14 418 (40.9%) | 3492 (39.8%) | |
| Primary diagnoses | |||
| Device complication | 1469 (4.2%) | 372 (4.2%) | 0.8694 |
| Stroke (ischemic or hemorrhagic) | 2051 (5.8%) | 474 (5.4%) | 0.5056 |
| Bleeding | 6856 (19.4%) | 1704 (19.4%) | 0.9789 |
| Infection | 4425 (12.5%) | 1094 (12.5%) | 0.9150 |
| Cardiac | 7563 (21.4%) | 1905 (21.7%) | 0.8135 |
| Blood transfusion | 4312 (12.2%) | 1003 (11.4%) | 0.2772 |
| Died | 1051 (3.0%) | 285 (3.2%) | 0.5069 |
Predictors of Mortality
In a multivariate analysis, independent predictors of mortality in the development cohort were as follows: age >65 years (odds ratio [OR], 1.785; 95% CI, 1.296–2.459), primary diagnoses: cardiac (OR, 4.045; 95% CI, 2.681–6.103), infectious (OR, 5.570; 95% CI, 3.471–8.937), ischemic or hemorrhagic stroke (OR, 19.447; 95% CI, 13.141–28.770), device complication (OR, 10.089; 95% CI, 6.468–15.736), or having a bleeding event significant enough to require blood transfusion (OR, 2.644; 95% CI, 1.756–3.981). A history of hypertension was shown to be protective against death (OR, 0.689; 95% CI, 0.523–0.908). No covariates had significant interaction with one another, and no collinearity was observed (Table 3).
Table 3.
Predictors of Mortality With Assigned Risk Score
| Predictors | Beta coefficient | Odds ratio | 95% CI | P value | Risk score |
|---|---|---|---|---|---|
| Patient age | |||||
| 19–64 y | Ref | Ref | |||
| ≥65 y | 0.2898 | 1.785 | 1.296–2.459 | 0.0004 | 1 |
| Primary diagnosis | |||||
| Other | Ref | Ref | |||
| Cardiac | 0.6987 | 4.045 | 2.681–6.103 | <0.0001 | 2 |
| Device complication | 1.1557 | 10.089 | 6.468–15.736 | <0.0001 | 4 |
| Infection | 0.8587 | 5.570 | 3.471–8.937 | <0.0001 | 3 |
| Stroke | 1.5839 | 19.447 | 13.141–28.780 | <0.0001 | 5 |
| Blood transfusion | 0.4862 | 2.644 | 1.756–3.981 | <0.0001 | 2 |
| History of hypertension | −0.3722 | 0.689 | 0.523–0.908 | 0.0082 | −1 |
| Maximum risk score | 8 | ||||
Development of Risk Score Model
As part of the risk score, each parameter received a value by assigning the lowest median coefficient value of 1, with the remaining median coefficients divided by this lowest median coefficient value and rounded to the nearest integer. Component risk score values for each variable include stroke (5 points), device complication (4 points), infection (3), cardiac (2), blood transfusion (2), age ≥65 years (1), and a history of hypertension (−1). Overall risk scores ranged from −1 to 8. The frequency of the risk scores across the cohort is shown in Figure 1 and the observed mortality in Figure 2. An online calculator was created for easier application of the formula (https://edvadriskscore.weebly.com). For ease of use, encounters were divided into 3 clinically meaningful categories and labeled as low risk (−1 to 1), medium risk (2 to 4), and high risk (5+). Corresponding observed mortality in the low‐risk group was 1.0% and increased to 3.7% and 15.8% in the medium‐ and high‐risk groups, respectively. When these low‐, medium‐, and high‐risk scores were applied to the validation cohort, a similar relationship of increasing risk score correlating with an increased risk of death was observed (Figure 3) (P<0.0001 for trend for both cohorts).
Figure 1. Risk score frequency in the development cohort.

Figure 2. Observed mortality in the development cohort.

An increasing risk score correlated with an increased rate of observed mortality.
Figure 3. Observed mortality by risk group.

Validation of Risk Score Model Using Receiver Operating Characteristics Curves
The AUC for predicting mortality using the proposed risk score model for development and validation cohorts were 0.78 (95% CI, 0.75–0.81) and 0.71 (95% CI, 0.64–0.78) respectively, demonstrating good discrimination. (Figures 4A and 4B). Using the Youden’s index, the optimal cutoff on the receiver operator characteristic curve was a risk score of 3. The positive predictive value for a risk score of 3 is 0.0796 (ie, given that a subject was assigned a risk score of 3, there is a 7.96% chance the subject will truly die). The negative predictive value at this cutoff is 0.9857 (the chance is 98.57% that getting a risk score of 3, the subject will truly not die).
Figure 4. Receiver operator characteristic curves for development (A) and validation cohorts (B).
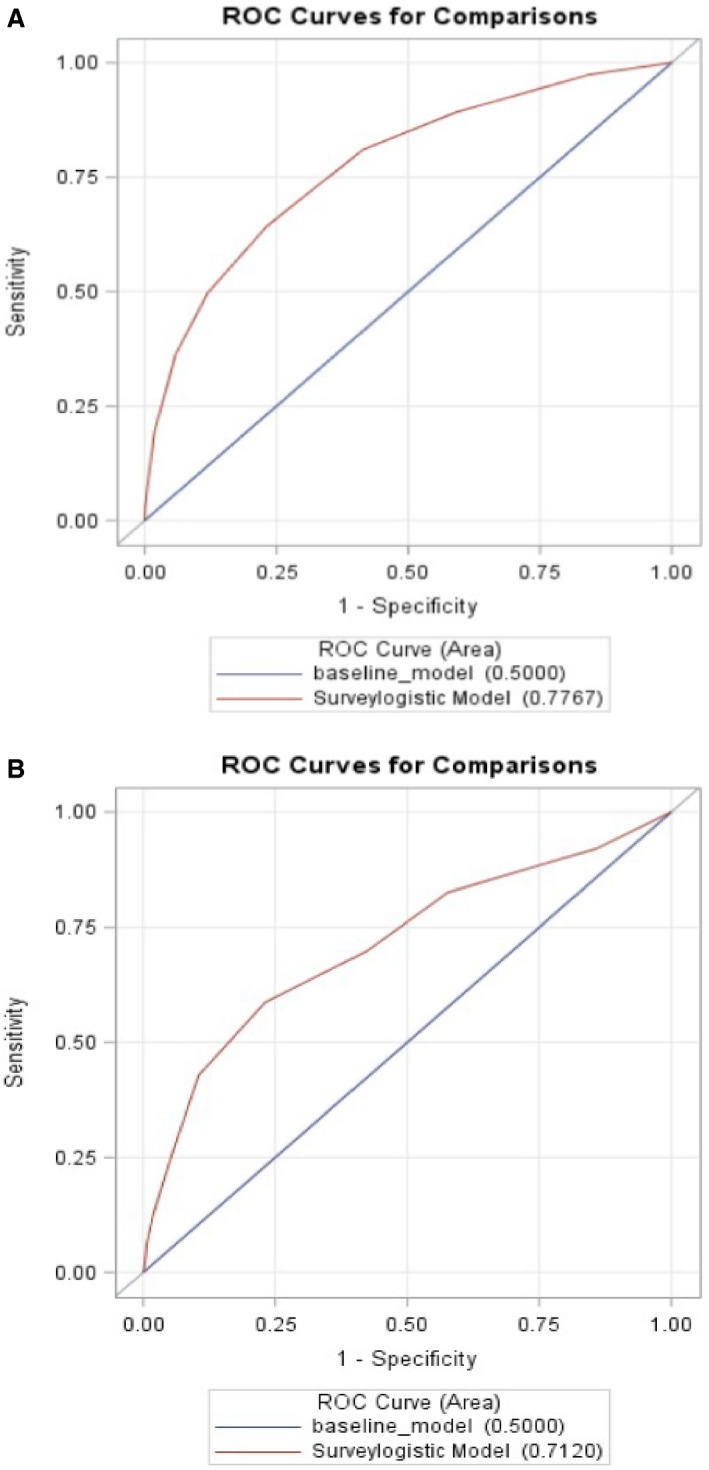
The risk score model had a good discrimination on receiver operating characteristics with an area under the curve in development and validation cohorts of 0.78 and 0.71. ROC indicates receiver operator characteristic.
Applying the Risk Score to Resource Use
There were significant positive associations between risk stratum and resource use across the entire cohort. Approximately 62% in the low‐risk group were admitted compared with 85% and 94% in the medium‐ and high‐risk groups, respectively. For those admitted, the mean length of stay for a low‐risk patient was 3.86 days compared with a mean of 9.85 days for a high‐risk patient. Mean charges for the low‐risk group were $43 310 (95% CI, 36 728–45 893) compared with $135 174 for high risk (95% CI, 106 139–164, 208). (P for trend <0.0001) (Figure 5).
Figure 5. Relationship between risk score to resource use.

An increased risk score also correlated with increased resource use.
Discussion
According to the recent Intermacs‐Society of Thoracic Surgeons report, the number of patients supported with durable VADs continues to rise. 1 With the concurrent increase in the number of patients with VADs seeking care in the ED, it is critical to determine which of those patients are at the highest risk of death. In this study, the first of its kind, we derived a novel risk score based on a combination of readily identifiable demographic and clinical factors, and validated it. The following are the major findings:
Predictors of mortality during the ED visit or subsequent admission include age ≥65 years; presenting with stroke, device complication, infection, or cardiac complaints; and receiving a blood transfusion. History of hypertension was a protective factor.
Patients with higher risk scores had significantly higher rates of mortality compared with those with lower risk scores. The higher risk group also had higher rates of admission, increased charges, and longer LOS.
The risk score model had a good discrimination on receiver operating characteristics with an AUC in development and validation cohorts of 0.78 and 0.71 respectively.
Predictors of Mortality
Many of the variables included in our risk model have previously been associated with worse outcomes, although our study enhances understanding of these associations and has several unique findings. Multiple studies have shown that age at the time of implantation was associated with worse postimplantation outcomes, 9 , 14 and our study extends those findings, showing that the risk conferred by age remains even after a successful implant and hospital discharge. VAD‐associated comorbidities, including infection, hemodynamically significant bleeding, and stroke are established risk factors for decreased survival in other similar populations, and our findings continue to bear this out. 1 Although prior studies have documented heart failure and arrhythmia to be highly prevalent and predict readmission in patients with VADs, our findings are novel in their identification as independent predictors of death. 15 , 16
Of the variables included in our model, blood transfusion is distinct in that it is the one characteristic we identified that is not necessarily known to the clinician at the time of presentation. However, we propose that this variable can be thought of as a surrogate for hemodynamically significant bleeding, a characteristic that can be identified relatively quickly by a clinician.
Interestingly, our data show that a history of hypertension was protective against death. McCullough et al evaluated patients with VADs based on their medical therapies and found that those on optimal medical therapy with angiotensin‐converting enzyme inhibitors or angiotensin receptor blockers, a beta blocker and an aldosterone antagonist had the best outcomes. 17 We hypothesize that many patients in this data set are coded as having a history of hypertension because they are being treated with neurohormonal blockade, and thus hypertension represents a proxy for the protective effect on mortality observed with the use of appropriate medical therapy. Importantly, our study aligns with other studies using administrative databases to evaluate the effect of comorbidities on outcomes that show hypertension to be protective, which may also reflect coding practices for patients who present with lower acuity. 18
Clinical Application of Our Novel Risk Score Model
The integer‐based risk score proposed in this study is an important step in the standardization of care for patients with VADs presenting to the ED and promotes the timely and effective allocation of resources toward the highest risk cohort. It seems essential that all patients with the highest risk score should be admitted to the cardiac or cardiothoracic surgical care unit where close monitoring can take place, and developing an increased awareness with regard to resource use seems especially appropriate in the current climate, where the limits of the health care infrastructure are becoming increasingly apparent. Furthermore, our model highlights the impact of VAD‐associated comorbidities on outcomes and suggests that measures minimizing the risk of bleeding, stroke, and infection in these patients is a critical method by which to mitigate mortality risk. This model may also provide some prognostic utility to patients and their families and allow for realistic expectations and appropriate guidance of goals of care.
Limitations
Although this database consists of the largest number of ED encounters nationwide, with more than 880 million visits, it is limited in part by its retrospective design and use of administrative claims data. Findings in a retrospective analysis may differ from those in a prospectively enrolled cohort. Encounters in NEDS are at the visit level, meaning a single patient may therefore be represented multiple times. Patients were identified using ICD‐9 and ICD‐10 codes, thus excluding and including patients who were either misdiagnosed or miscoded. Also, some chronic medical conditions may have resolved by the time of the associated ED encounter, which might account for the number of chronic medical conditions not being associated with mortality in the multivariate model. Although the Healthcare Cost and Utilization Project performs several analyses to ensure internal consistency and data validity, some encounters may have misclassified information. Using machine learning methods would be an alternative way of creating a risk score; however, the current method has the added benefit of clinical transparency, which we believe will more likely facilitate its uptake and use in clinical practice.
Conclusions
In conclusion, we present a novel, simple, and validated ED‐VAD risk score to predict mortality in ambulatory patients with VADs presenting to the ED. The risk model was generated using a large nationally representative sample and showed high validity on receiver operator characteristic curves with AUC of 0.78 and 0.71 for development and validation cohorts, respectively. Moreover, the risk score also predicts resource use, which may increase its utility. This novel risk score may serve as a useful tool for clinicians caring for a high‐risk, and rapidly growing, patient population with VADs.
Sources of Funding
J.J.E. receives grant funding from the National Institutes of Health (5T32HL00791).
Disclosures
Dr Mazurek reports personal fees from Abbott and personal fees from United Therapeutics outside the submitted work. Dr Atluri reports personal fees from Abbott and personal fees from Medtronic outside the submitted work. Dr Goldberg reports personal fees from Abbott and personal fees from Respircardia outside the submitted work. Dr Rossano reports personal fees from Novartis, personal fees from Bayer, personal fees from Amgen, personal fees from Abiomed, personal fees from Cytokinetics, and personal fees from Myokardia during the conduct of the study. Dr Birati reports research support paid to the University – Medtronic Inc, Impulse Dynamics Ltd. The remaining authors have no disclosures to report.
Supporting information
Table S1
Acknowledgments
The authors would like to acknowledge the Cardiac Center Clinical Research Core at the Children’s Hospital of Philadelphia for providing statistical support for this article.
Supplementary Material for this article is available at https://www.ahajournals.org/doi/suppl/10.1161/JAHA.121.020942
For Sources of Funding and Disclosures, see page 8.
See Article by Strueber
References
- 1. Kirklin JK, Pagani FD, Kormos RL, Stevenson LW, Blume ED, Myers SL, Miller MA, Baldwin JT, Young JB, Naftel DC. Eighth annual INTERMACS report: special focus on framing the impact of adverse events. J Heart Lung Transplant. 2017;36:1080–1086. doi: 10.1016/j.healun.2017.07.005 [DOI] [PubMed] [Google Scholar]
- 2. Colvin M, Smith JM, Hadley N, Skeans MA, Uccellini K, Lehman R, Robinson AM, Israni AK, Snyder JJ, Kasikse BL. OPTN/SRTR 2017 annual data report: heart. Am J Transplant. 2019;19:323–403. doi: 10.1111/ajt.15278 [DOI] [PubMed] [Google Scholar]
- 3. Adler ED, Goldfinger JZ, Kalman J, Park ME, Meier DE. Palliative care in the treatment of advanced heart failure. Circulation. 2009;120:2597–2606. doi: 10.1161/CIRCULATIONAHA.109.869123 [DOI] [PubMed] [Google Scholar]
- 4. Teuteberg JJ, Cleveland JC, Cowger J, Higgins RS, Goldstein DJ, Keebler M, Kirklin JK, Myers SL, Salerno CT, Stehlik J, et al. The Society of Thoracic Surgeons Intermacs 2019 Annual Report: the changing landscape of devices and indications. Ann Thorac Surg. 2020;109:649–660. doi: 10.1016/j.athoracsur.2019.12.005 [DOI] [PubMed] [Google Scholar]
- 5. Edelson JB, Edwards JJ, Katcoff H, Mondal A, Reza N, Hanff TC, Griffis H, Mazurek JA, Wald J, Owens AT, et al. An increasing burden of disease: emergency department visits among patients with ventricular assist devices from 2010–2017. J Am Heart Assoc. 2021;10:e018035. doi: 10.1161/JAHA.120.018035 [DOI] [PMC free article] [PubMed] [Google Scholar]
- 6. Givertz MM, DeFilippis EM, Colvin M, Darling CE, Elliott T, Hamad E, Hiestand BC, Martindale JL, Pinney SP, Shah KB, et al. HFSA/SAEM/ISHLT clinical expert consensus document on the emergency management of patients with ventricular assist devices. J Card Fail. 2019;25:494–515. doi: 10.1016/j.cardfail.2019.01.012 [DOI] [PubMed] [Google Scholar]
- 7. Perim D, Mazer‐Amirshahi M, Trvalik A, Pourmand A. Approach to complications of ventricular assist devices: a clinical review for the emergency provider. J Emerg Med. 2019;56:611–623. doi: 10.1016/j.jemermed.2019.03.012 [DOI] [PubMed] [Google Scholar]
- 8. Birati EY, Hanff TC, Maldonado D, Grandin EW, Kennel PJ, Mazurek JA, Vorovich E, Seigerman M, Howard JLL, Acker MA, et al. Predicting long term outcome in patients treated with continuous flow left ventricular assist device: the Penn‐Columbia risk score. J Am Heart Assoc. 2018;7:e006408. doi: 10.1161/JAHA.117.006408 [DOI] [PMC free article] [PubMed] [Google Scholar]
- 9. Lietz K, Long JW, Kfoury AG, Slaughter MS, Silver MA, Milano CA, Rogers JG, Naka Y, Mancini D, Miller LW. Outcomes of left ventricular assist device implantation as destination therapy in the post‐REMATCH era: implications for patient selection. Circulation. 2007;116:497–505. doi: 10.1161/CIRCULATIONAHA.107.691972 [DOI] [PubMed] [Google Scholar]
- 10. Cowger JA, Shah P, Pagani FD, Grafton G, Stulak J, Chamogeorgakis T, Lanfear D, Nemeh H, Pinney S. Outcomes based on blood pressure in patients on continuous flow left ventricular assist device support: an interagency registry for mechanically assisted circulatory support analysis. J Heart Lung Transpl. 2020;39(5):441–453. doi: 10.1016/j.healun.2019.11.016 [DOI] [PMC free article] [PubMed] [Google Scholar]
- 11. Kassam Z, Cribb Fabersunne C, Smith MB, Alm EJ, Kaplan GG, Nguren GC, Ananthakrishan AN. Clostridium difficile associated risk of death score (CARDS): a novel severity score to predict mortality among hospitalised patients with C. difficile infection. Aliment Pharmacol Ther. 2016;43:725–733. doi: 10.1111/apt.13546 [DOI] [PMC free article] [PubMed] [Google Scholar]
- 12. Gunda S, Padala SK, Saini A, Kang L, Ellenbogen KA, Koneru JN. Risk score model for predicting complications in patients undergoing ventricular tachycardia ablation: insights from the National Inpatient Sample database. EP Europace. 2019;21:475–483. doi: 10.1093/europace/euy213 [DOI] [PubMed] [Google Scholar]
- 13. Šimundić A‐M. Measures of diagnostic accuracy: basic definitions. EJIFCC. 2009;19:203‐211. Accessed February 28, 2020. http://www.ncbi.nlm.nih.gov/pubmed/27683318 [PMC free article] [PubMed] [Google Scholar]
- 14. Cowger J, Sundareswaran K, Rogers JG, Park SJ, Pagani FD, Bhat G, Jaski B, Farrar DJ, Slaughter MS. Predicting survival in patients receiving continuous flow left ventricular assist devices: the Heartmate II risk score. J Am Coll Cardiol. 2013;61:313–321. doi: 10.1016/j.jacc.2012.09.055 [DOI] [PubMed] [Google Scholar]
- 15. Hasin T, Marmor Y, Kremers W, Topilsky Y, Severson CJ, Schirger JA, Boilson BA, Clavell AL, Rodeheffer RJ, Frantz RP, et al. Readmissions after implantation of axial flow left ventricular assist device. J Am Coll Cardiol. 2013;61:153–163. doi: 10.1016/j.jacc.2012.09.041 [DOI] [PubMed] [Google Scholar]
- 16. Agrawal S, Garg L, Shah M, Agrawal M, Patel B, Singh A, Garg A, Jorde UP, Kapur NK. Thirty‐day readmissions after left ventricular assist device implantation in the United States: insights from the nationwide readmissions database. Circ Heart Fail. 2018;11:e004628. doi: 10.1161/CIRCHEARTFAILURE.117.004628 [DOI] [PubMed] [Google Scholar]
- 17. McCullough M, Caraballo C, Ravindra NG, Miller PE, Mezzacappa C, Levin A, Gruen J, Rodwin B, Reinhardt S, van Dijk D, et al. Neurohormonal blockade and clinical outcomes in patients with heart failure supported by left ventricular assist devices. JAMA Cardiol. 2020;5:175–182. doi: 10.1001/jamacardio.2019.4965 [DOI] [PMC free article] [PubMed] [Google Scholar]
- 18. Elixhauser A, Steiner C, Harris DR, Coffey RM. Comorbidity measures for use with administrative data. Med Care. 1998;36:8–27. doi: 10.1097/00005650-199801000-00004 [DOI] [PubMed] [Google Scholar]
Associated Data
This section collects any data citations, data availability statements, or supplementary materials included in this article.
Supplementary Materials
Table S1