

Abstract
Background
Left ventricular hypertrophy (LVH) has often been supposed to be associated with abnormal myocardial blood flow and resistance. The aim of this study was to evaluate and quantify the physiological and pathological changes in myocardial blood flow and microcirculatory resistance in patients with and without LVH attributable to severe aortic stenosis.
Methods and Results
Absolute coronary blood flow and microvascular resistance were measured using a novel technique with continuous thermodilution and infusion of saline. In addition, myocardial mass was assessed with cardiac magnetic resonance imaging. Fifty‐three patients with aortic valve stenosis were enrolled in the study. In 32 patients with LVH, hyperemic blood flow per gram of tissue was significantly decreased compared with 21 patients without LVH (1.26±0.48 versus 1.66±0.65 mL·min−1·g−1; P=0.018), whereas minimal resistance indexed for left ventricular mass was significantly increased in patients with LVH (63 [47–82] versus 43 [35–63] Wood Units·kg; P=0.014).
Conclusions
Patients with LVH attributable to severe aortic stenosis had lower hyperemic blood flow per gram of myocardium and higher minimal myocardial resistance compared with patients without LVH.
Keywords: aortic stenosis, cardiac magnetic resonance imaging, coronary flow, left ventricular hypertrophy, microvascular function, thermodilution
Subject Categories: Coronary Circulation
Nonstandard Abbreviations and Acronyms
- AS
aortic stenosis
- CFR
coronary flow reserve
- LVM
left ventricular mass
- LVMi
left ventricular mass index
- IMR
index of microcirculatory resistance
- RCA
right coronary artery
- R µ
absolute hyperemic microvascular resistance
- T mn
mean transit time
Clinical Perspective
What Is New?
Hyperemic capacity per gram of myocardium is significantly lower in patients with severe aortic stenosis and left ventricular hypertrophy compared with patients with severe aortic stenosis without left ventricular hypertrophy.
Consequently, minimal microvascular resistance indexed to myocardial mass is significantly higher in those with severe aortic stenosis and left ventricular hypertrophy.
What Are the Clinical Implications?
Left ventricular hypertrophy in the context of severe aortic stenosis may represent an additional challenge to the coronary microcirculation, possibly warranting a lower threshold for referral to aortic valve replacement.
Long‐standing severe aortic stenosis (AS) often causes left ventricular hypertrophy (LVH), 1 myocardial fibrosis, 2 and exhaustion of coronary flow reserve (CFR), 3 which are all associated with a poorer prognosis.4, 5, 6, 7 The coronary microcirculation undergoes several anatomical and physiological changes in the pressure‐overloaded left ventricle. Most notably, increased systolic extravascular compression, 8 increased left ventricular filling pressure, 9 decreased diastolic perfusion time, 10 capillary rarefaction, perivascular fibrosis, 11 and abnormal cardiac‐coronary coupling 12 all affect myocardial perfusion. Whether LVH is an adaptive or maladaptive response to pressure overload may depend on the associated changes in microvascular function and capacity. Today, it is possible to study the coronary microcirculation invasively by measuring thermodilution‐derived CFR, 13 absolute coronary blood flow, and resistance. 14 The aim of the present study was to quantify differences in absolute myocardial blood flow and microcirculatory resistance in patients with and without LVH attributable to severe AS and relate these measures to left ventricular mass (LVM) assessed with cardiac magnetic resonance imaging (CMR) and indexes of AS severity.
Methods
The data that support the findings of this study are available from the corresponding author on reasonable request.
Study Design and Patient Population
This was a cross‐sectional observational study in 53 patients undertaken in 2 centers. Inclusion required severe AS and Heart Team referral for either surgical aortic valve replacement or transcatheter aortic valve implantation. Patients were excluded if they had left ventricular ejection fraction <45%, estimated glomerular filtration rate <30 mL/min per 1.73 m2, moderate or severe disease in other heart valves, or contraindications to CMR. Aortic valve area, maximum aortic transvalvular blood flow velocity, and mean and peak aortic valve gradients were derived from echocardiography. Coronary physiology was assessed following a diagnostic coronary angiogram performed as part of routine workup before aortic valve replacement. Patients with focal coronary lesions with diameter stenosis >50% were not included in the study. CMR to assess myocardial mass was done after coronary angiography but before valve replacement. The study complied with the Declaration of Helsinki, and the protocol was approved by the regional ethics committee (Videnskabsetisk komite – Region Hovedstaden). The study was conducted at 2 centers (Rigshospitalet and Gentofte Hospital, Denmark). All patients provided informed written consent.
Coronary Catheterization
Coronary catheterization was performed via radial or femoral access using a 6F sheath and 6F guide catheter. Intravenous heparin (100 IU/kg plus supplemental heparin every 30 minutes to achieve an activated clotting time[ACT] of 250–350 s) and intracoronary nitroglycerine (0.2 mg) were given according to standard practice. Invasive physiological measurements were performed in the left anterior decending artery (LAD) in all patients, and in the right coronary artery (RCA) in 21 patients, as previously described.13, 14 Briefly, a sensor‐tipped guidewire (PressureWireX; Abbott, MN) for combined pressure and temperature measurement was used for all arteries. Equalization of wire pressure with aortic pressure was done with the pressure sensor at the tip of the guide catheter, and equalization was repeated when measurements were done in different coronary arteries. At the end of every measurement, potential drift was checked (maximum of ±2 mm Hg allowed). Data from the guidewire were transmitted wirelessly to a computer with dedicated software (CoroFlow v.3.01; Coroventis, Uppsala, Sweden).
CFR, Fractional Flow Reserve, and Index of Microcirculatory Resistance
The theoretical basis of measuring CFR by thermodilution has been described elsewhere. 13 Briefly, the guidewire was advanced to the distal third of the coronary artery. Then, a brisk intracoronary injection of 3 mL of room temperature saline was given via the guide catheter. Mean transit time (T mn ) of the saline bolus was automatically derived from the generated thermodilution curves and served as a surrogate for flow. Injections were repeated at least 3 times to obtain an average resting T mn . Resting T mn measurements were separated by a 20‐ to 30‐second period to ensure any saline‐induced hyperemic response had ended. The software automatically flagged any T mn deviating >30% from the average value, after which they were repeated. Then, hyperemia was induced with intravenous adenosine infusion at 140 µg/kg per minute. During steady‐state hyperemia, T mn was measured again with 3 measurements as described. CFR was calculated as the ratio between hyperemic and resting T mn . Simultaneously recorded aortic pressure (Pa) and distal coronary pressure (Pd) were used to automatically calculate resting Pd/Pa as well as fractional flow reserve (FFR) and index of microcirculatory resistance (IMR; defined as T mn ∙Pd, both during hyperemia). 15
Absolute Coronary Flow and Resistance
Absolute hyperemic coronary flow was measured using continuous thermodilution of saline, as previously described. 14 In short, a specifically designed monorail infusion catheter (RayFlow; Hexacath, Paris, France) was passed over the guidewire and connected to an infusion pump (Angiomat Illumena; Liebel‐Flarsheim, OH) configured to infuse saline at room temperature at a rate of 20 mL/min, thereby inducing maximum hyperemia. 16 The infusion catheter was positioned in the proximal part of the coronary artery, thus measuring blood flow and resistance of the entire myocardial territory. The guidewire was positioned with the pressure/temperature sensor 4 to 6 cm distal to the tip of the infusion catheter to ensure adequate mixing of saline and blood before reaching the sensor. The guidewire temperature reading was zeroed (ie, equaled to body temperature) before start of saline infusion. After achieving a stable distal mixing temperature (T), the sensor was pulled back to the tip of the infusion catheter to record the infusion temperature (Ti) (Figure 1). Using the mixing temperature, infusion temperature, and infusion rate (Qi), absolute blood flow (Q) was calculated as follows:
Figure 1. Absolute hyperemic coronary flow measurement in the LAD by continuous thermodilution.
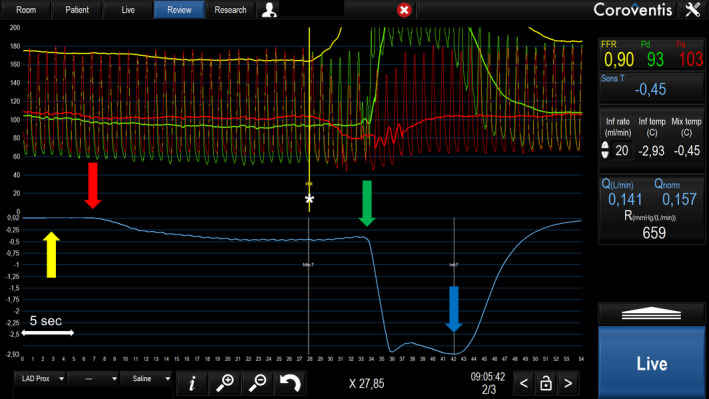
Top traces represent aortic pressure (Pa; red) and distal coronary pressure (Pd; green), recorded simultaneously with coronary temperature (blue trace). The x axis represents time in seconds. The guidewire tip is positioned distally in the left anterior decending artery (LAD) and the side holes of the infusion catheter in the proximal LAD. Yellow arrow: before start of saline infusion, temperature is zeroed (ie, set equal to body temperature). Red arrow: infusion of room temperature saline at 20 mL/min starts and induces steady‐state hyperemia in the LAD and steady‐state decrease in temperature is observed after mixing of saline with blood (*). Green arrow: the sensor is pulled back to the tip of the infusion catheter to measure the infusion temperature, close to the tip of the infusion catheter. Blue arrow: infusion of saline is stopped, and temperature quickly returns to baseline. FFR indicates fractional flow reserve; and LAD, left anterior descending artery.
The constant 1.08 accounts for differences in specific heat capacity of blood and saline. 17 Absolute flow in mL∙min−1 is referred to as global flow (ie, not indexed to myocardial mass). Absolute flow indexed for LVM (Q index ) is referred to as regional flow, and was calculated as follows:
and microvascular resistance (R µ ) as follows:
mm Hg∙min∙L−1 is also known as Wood Units (WU). As described elsewhere, 18 we calculated minimal microvascular resistance indexed to LVM (R µ,index ) as follows:
Cardiac Magnetic Resonance
CMR was performed on a 1.5‐T scanner (Aera; Siemens, Erlangen, Germany). Images were analyzed with dedicated software (CVI42 v5.11.2; Circle Cardiovascular Imaging Inc, Calgary, Alberta, Canada). Short‐axis plane imaging was prepared with scout images and electrocardiographic gated breath‐hold steady‐state free‐precession images in 2‐, 4‐, and 3‐chamber views. A standard electrocardiographic‐triggered balanced steady‐state free‐precession short‐axis cine stack consisting of contiguous 10‐mm slices perpendicular to the septum was used to calculate all measures of LVM, volume, and function. Endocardial and epicardial contours were traced using the automatic tracing function, and all slices were reviewed individually for accuracy and adjusted when necessary. LVM was measured in end diastole and included the papillary muscles. All CMR analyses were done blinded to coronary physiological data. Body surface area was calculated using the formula by Tikuisis. 19
Classification of LVH
LVH was defined as LVM/body surface area >74 g/m2 for women and >87 g/m2 for men. 20 In 5 cases, CMR was not possible because of logistical reasons (n=4) and unrecognized claustrophobia (n=1). In those cases, LVM was derived from computed tomography and used to determine if LVH was present using computed tomography–specific cutoffs for LVM/body surface area, 21 but not in calculations of mass‐indexed flow or resistance. Concentricity of myocardial mass was estimated as LVM divided by left ventricular end‐diastolic volume, 22 with an upper limit of 0.9 g/mL for men and 0.8 g/mL for women. 20
Statistical Analysis
Continuous variables are expressed as mean±SD or median and interquartile range. Categorical variables are expressed as percentages. Group differences in continuous data were analyzed with Student t test or Mann‐Whitney U test. Group differences between proportions were assessed with the χ2 test or Fisher exact test. Linear correlations were tested with the Pearson correlation, or with the Spearman correlation. We compared study metrics between patients with AS with and without LVH. Absolute blood flow was measured in mL∙min−1, flow indexed to LVM in mL∙min−1∙g−1, absolute resistance in WU, and resistance indexed to LVM in WU∙kg. Two‐sided P< 0.05 was considered significant. IBM SPSS Statistics for Windows, version 25 (IBM Corp, Armonk, NY) was used for statistical analyses, and figures were made in GraphPad Prism version 9.0 for Windows (GraphPad Software, La Jolla, CA) and BioRender.com.
Results
Successful and uneventful measurements were performed in all patients. Baseline characteristics are summarized in Table 1. Left ventricular mass index ranged from 53 to 126 g/m2; 32 patients had LVH, and 21 patients did not. Compared with patients without LVH, patients with LVH had significantly worse indexes of AS severity and higher plasma pro‐brain‐natriuretic peptide, but not significantly reduced ejection fraction. Nearly all patients (96%) showed concentric remodeling of the left ventricle. However, patients with LVH had higher left ventricular end‐diastolic and end‐systolic volume than patients without LVH.
Table 1.
Baseline Characteristics for All Patients and According to Presence of LVH
| Characteristic |
All (n=53) |
LVH (n=32) |
No LVH (n=21) |
P value |
|---|---|---|---|---|
| Male sex, n (%) | 30 (57) | 20 (63) | 10 (48) | 0.29 |
| Age, y | 74±7 | 74±8 | 74±7 | 0.95 |
| BMI, kg/m2 | 28±5 | 29±5 | 28±5 | 0.54 |
| Comorbidities, n (%) | ||||
| Diabetes | 10 (19) | 7 (22) | 3 (14) | 0.49 |
| Hypercholesterolemia | 30 (57) | 19 (59) | 11 (52) | 0.62 |
| Hypertension | 40 (75) | 26 (81) | 14 (67) | 0.23 |
| Smoking, n (%) | ||||
| Never | 30 (57) | 19 (59) | 11 (52) | |
| Previous/active | 23 (43) | 13 (41) | 10 (48) | 0.81 |
| Previous MI, n (%)* | 2 (4) | 2 (6) | 0 (0) | 0.24 |
| Previous PCI, n (%) | 4 (8) | 2 (6) | 2 (10) | 0.66 |
| Symptoms, n (%) | ||||
| NYHA class II–IV | 45 (85) | 28 (88) | 17 (81) | 0.85 |
| CCS 1–4 | 21 (40) | 10 (31) | 11 (52) | 0.21 |
| Syncope | 3 (6) | 3 (9) | 0 (0) | 0.15 |
| Medication, n (%) | ||||
| Statin | 34 (64) | 19 (59) | 15 (71) | 0.37 |
| β Blocker | 14 (28) | 7 (22) | 8 (38) | 0.20 |
| Calcium‐channel blocker | 15 (28) | 11 (34) | 4 (19) | 0.23 |
| Nitroglycerin | 5 (9) | 1 (3) | 4 (19) | 0.052 |
| ARB or ACE inhibitor | 27 (51) | 16 (50) | 11 (52) | 0.87 |
| Thiazides | 11 (21) | 7 (22) | 4 (19) | 0.80 |
| Loop diuretics | 6 (11) | 2 (6) | 4 (19) | 0.15 |
| Aldosterone antagonists | 2 (4) | 1 (3) | 1 (5) | 0.76 |
| Biochemistry | ||||
| Creatinine, µmol/L | 76 (67–94) | 80 (70–98) | 73 (60–88) | 0.08 |
| eGFR, mL/min per 1.73 m2 | 76 (65–88) | 72 (63–85) | 84 (70–90) | 0.047 |
| Pro‐BNP, pmol/L | 42 (22–135) | 91 (30–216) | 26 (12–70) | 0.002 |
| Hemoglobin, mmol/L | 8.5±1.2 | 8.5±1.2 | 8.4±1.2 | 0.60 |
| Echocardiography | ||||
| AVA, cm2 | 0.74±0.20 | 0.70±0.22 | 0.80±0.15 | 0.07 |
| AVAi, cm2/m2 | 0.37±0.09 | 0.35±0.11 | 0.40±0.06 | 0.04 |
| MG, mm Hg | 54±14 | 57±14 | 49±13 | 0.03 |
| PG, mm Hg | 86±22 | 92±21 | 78±22 | 0.03 |
| AV Vmax, m/s | 4.61±0.59 | 4.75±0.56 | 4.39±0.56 | 0.03 |
| BAV, n (%) | 12 (23) | 7 (22) | 5 (24) | 0.87 |
| Cardiac magnetic resonance † | ||||
| LVEF, % | 68±11 | 65±12 | 71±7 | 0.09 |
| LVEDVi, mL/ m2 | 74±16 | 80±16 | 66±10 | 0.001 |
| LVESVi, mL/ m2 | 25±12 | 29±14 | 20±7 | 0.004 |
| SVi, mL/ m2 | 49±9 | 51±10 | 47±8 | 0.09 |
| Concentricity, g/mL | 1.22±0.33 | 1.34±0.38 | 1.06±0.16 | 0.001 |
| LVM, g | 177±49 | 206±38 | 138±34 | ‐ |
| LVMi, g/m2 | 88±21 | 103±15 | 69±10 | ‐ |
Data are presented as number (percentage), mean±SD, or median (interquartile range). ACE indicates angiotensin‐converting enzyme; ARB, angiotensin II receptor blocker; AV, aortic valve; AVA, AV area; AVAi, AVA indexed to body surface area; BAV, bicuspid aortic valve; BMI, body mass index; CCS, Canadian Cardiovascular Society angina score; eGFR, estimated glomerular filtration rate; LVEDVi, left ventricular end‐diastolic volume indexed to body surface area; LVEF, left ventricular ejection fraction; LVESVi, left ventricular end‐systolic volume indexed to body surface area; LVH, left ventricular hypertrophy; LVM, left ventricular mass; LVMi, LVM indexed to body surface area; MG, mean aortic valve pressure gradient; MI, myocardial infarction; NYHA, New York Heart Association; PCI, percutaneous coronary intervention; PG, peak aortic valve pressure gradient; Pro‐BNP, pro‐brain‐natriuretic peptide; SVi, stroke volume indexed to body surface area; and Vmax, peak velocity.
All patients with previous MI had their MI >12 months before enrollment in this study.
Data represent only patients with cardiac magnetic resonance data, n=27 with LVH and n=21 without LVH.
CFR, FFR, and IMR
All patients had CFR, Pd/Pa, FFR, and IMR measured in the LAD (Table 2). Five patients had an FFR <0.80 (diffuse atherosclerosis), of whom 3 had LVH and 2 did not. Median FFR was slightly higher in the LVH group, but this was not reflected in the CFR, as both actual and FFR corrected CFR values were not different between groups (Table 2). Moreover, CFR was not linearly correlated with LVM index (LVMi) (r=−0.03; P=0.84) or any echocardiographic indexes of AS severity.
Table 2.
Invasive Coronary Measurements in the LAD
| Variable |
LAD, all (n=53) |
LAD, LVH (n=32) |
LAD, no LVH (n=21) |
P value |
|---|---|---|---|---|
| Pd, rest, mm Hg | 76±14 | 77±14 | 75±13 | 0.58 |
| Pa, rest, mm Hg | 83±13 | 83±13 | 82±12 | 0.78 |
| Pd/Pa, rest | 0.93 (0.91–0.95) | 0.93 (0.90–0.96) | 0.93 (0.91–0.94) | 0.30 |
| Pd, hyperemia, mm Hg | 67±15 | 68±13 | 66±16 | 0.52 |
| Pa, hyperemia, mm Hg | 76±14 | 76±13 | 75±16 | 0.80 |
| FFR | 0.90 (0.87–0.93) | 0.91 (0.88–0.94) | 0.87 (0.87–0.91) | 0.04 |
| Average resting T mn , s | 0.51±0.32 | 0.43±0.23 | 0.63±0.41 | 0.054 |
| Average hyperemic T mn , s | 0.21±0.12 | 0.19±0.12 | 0.24±0.12 | 0.18 |
| CFR | 2.5 (1.5–3.6) | 2.2 (1.5–3.2) | 2.7 (1.5–3.9) | 0.52 |
| CFR corrected for FFR | 2.9 (1.7–3.9) | 2.5 (1.7–3.3) | 3.1 (1.8–4.5) | 0.37 |
| IMR, mm Hg∙s | 13±8 | 13±8 | 15±7 | 0.37 |
Data are presented as mean±SD or median (interquartile range). CFR indicates coronary flow reserve; FFR, fractional flow reserve; IMR, index of microcirculatory resistance; LAD, left anterior decending artery; LVH, left ventricular hypertrophy; Pa, aortic blood pressure; Pd, distal coronary blood pressure; and T mn , mean transit time.
Global Hyperemic Flow and Resistance and Their Relation to LVH
Patients with LVH had 19% higher global hyperemic LAD flow, but the difference was not significant (Table 3). However, when LVMi was analyzed as a continuous variable, there was a positive linear correlation with global hyperemic LAD flow (r=0.32; P=0.028) (similar results with LVMi). After removal of one extreme outlier (with a heavily right‐dominant system), the correlation was stronger and more significant (r=0.41; P=0.004). Likewise, for R µ, LAD and LVM, r=−0.32 (P=0.025) and r=−0.41 (P=0.005) without the same extreme outlier. When comparing groups, the correlation between R µ, LAD and LVM was nonexistent in patients without LVH, but strong in those with LVH (Figure 2). Neither global hyperemic RCA flow nor R µ, RCA was correlated with LVM.
Table 3.
Continuous Thermodilution‐Derived Absolute and Mass‐Index Hyperemic Flow and Resistance in the LAD and RCA
| Variable |
LAD, all (n=53) |
LAD, LVH (n=32) |
LAD, no LVH (n=21) |
P value |
RCA, all (n=21) |
RCA, LVH (n=13) |
RCA, no LVH (n=8) |
P value |
|---|---|---|---|---|---|---|---|---|
| Q, mL∙min−1 | 242±100 | 259±115 | 216±67 | 0.13 | 249±109 | 239±109 | 266±116 | 0.60 |
| Q index , mL∙min−1∙g−1 | 1.43±0.59* | 1.26±0.48 † | 1.66±0.65 | 0.018 | 1.50±0.70 | 1.18±0.55 | 2.02±0.61 | 0.004 |
| R µ , WU | 328 (228–428) | 326 (223–425) | 348 (252–459) | 0.50 | 319 (251–482) | 387 (227–530) | 319 (279–368) | 0.60 |
| R µ,index WU∙kg | 57 (41–74) | 63 (47–82) † | 43 (35–63) | 0.014 | 49 (40–91) | 77 (46–118) | 40 (35–43) | 0.003 |
Data are presented as mean±SD or median (interquartile range). LAD indicates left anterior decending artery; LVH, left ventricular hypertrophy; Q, absolute hyperemic flow; Q index , hyperemic flow per gram of left ventricular mass; RCA, right coronary artery; R µ , minimal microvascular resistance in WU; R µ , index , minimal microvascular resistance indexed to left ventricular mass (see Methods section for details); WU, Wood Units.
n=48 (5 patients did not undergo cardiac magnetic resonance imaging to assess myocardial mass).
n=27 (5 patients did not undergo cardiac magnetic resonance imaging to assess myocardial mass).
Figure 2. Correlation between absolute minimal microvascular resistance in the left anterior decending artery (LAD) and left ventricular mass (LVM) in patients with vs without left ventricular hypertrophy (LVH).
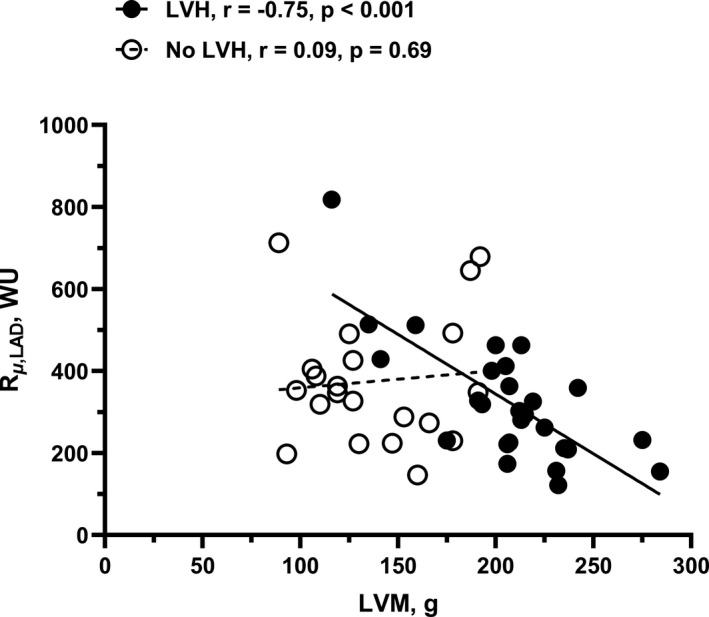
In patients without LVH, there was no correlation between absolute minimal microvascular resistance (R µ ,LAD) and LVM. In contrast, patients with LVH showed a clear negative correlation. Data are shown with omission of one extreme outlier in the LVH group. When included, r=−0.50 (P=0.008). LAD indicates left anterior descending artery; and WU, Wood Units.
Regional Hyperemic Flow and Resistance and Their Relation to LVH
Hyperemic LAD flow indexed to LVM was significantly lower in patients with LVH versus patients without LVH (1.26±0.48 versus 1.66±0.65 mL∙min−1∙g−1, respectively; P=0.018), whereas hyperemic microvascular resistance indexed to LVM was significantly higher (63 [47–82] versus 43 [35–63] WU∙kg, respectively; P=0.017) (Table 3 and Figure 3). Consequently, both LAD flow per gram and mass‐indexed minimal resistance were correlated with left ventricular mass index (Figure 4). To investigate heterogeneity between different territories, similar measurements were also done in the RCA in 21 patients showing the same pattern as in the LAD (Table 3 and Figures 3 and 4).
Figure 3. Mass‐indexed hyperemic coronary blood flow and minimal microvascular resistance in the LAD and right coronary artery (RCA), according to left ventricular hypertrophy (LVH) status.
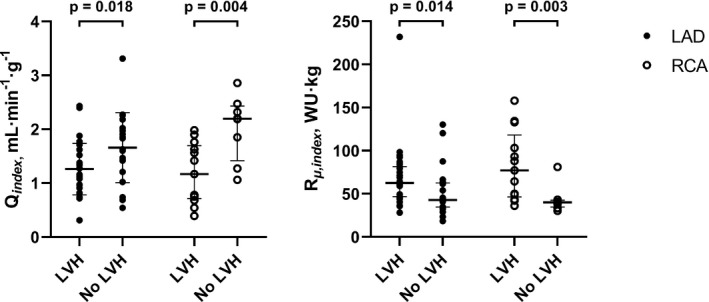
Left: Hyperemic coronary blood flow in the left anterior decending artery (LAD) and right coronary artery (RCA) indexed to left ventricular mass (LVM) (Q index ). Data show mean±SD for patients with LVH vs patients without LVH. Right: Minimal microvascular resistance (in Wood Units [WU], mm Hg∙min∙L−1) indexed to LVM (R µ,index ) in the LAD and RCA for patients with LVH vs no LVH. Data show median and interquartile range.
Figure 4. Relationship between myocardial mass, coronary blood flow, and minimal microvascular resistance in the left anterior descending artery (LAD) and right coronary artery (RCA).
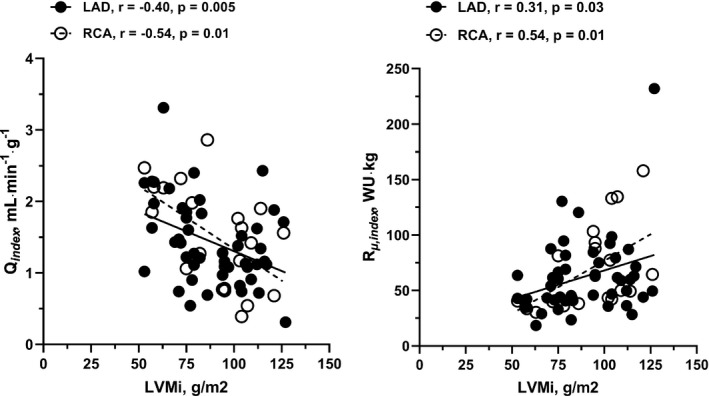
Left: Correlation between hyperemic blood flow per gram of myocardium (Q index ) and left ventricular mass index (LVMi), showing decreasing hyperemic capacity with increasing severity of left ventricular hypertrophy. Data shown for the left anterior decending artery (LAD) and right coronary artery (RCA). Right: Correlation between minimal microvascular resistance (in Wood Units [WU], mm Hg∙min∙L−1) indexed to left ventricular mass (R µ,index ), showing increased resistance with increasing LVMi. Data shown for LAD and RCA.
Discussion
The most important findings are that hyperemic blood flow per gram of myocardium was severely reduced in patients with AS with LVH compared with patients with AS without LVH, and that myocardial resistance accordingly was significantly increased. These findings are important in terms of understanding the pathophysiology of the coronary microcirculation in LVH in severe AS, and the impact of varying degrees of myocardial adaptation to AS on microvascular function. Several studies have reported data on coronary hemodynamics in patients with AS, but without relating findings to myocardial mass.23, 24, 25, 26, 27, 28, 29 As such, previous work on the differences in mass‐indexed flow between hypertrophic and nonhypertrophic patients with AS is scarce. Carpeggiani et al used positron emission tomography and were thus able to report myocardial flow per gram. 30 However, all 15 patients in the cohort had LVH. Rajappan et al also used positron emission tomography in 22 patients, 7 of whom did not have LVH, 10 but the study focused on longitudinal changes following valve replacement, without comparing hypertrophic versus nonhypertrophic patients. 10 More recently, Gutiérrez‐Barrios et al reported a surrogate for flow—thermodilution‐derived transit mean time—in 36 patients, and related it to myocardial mass estimated with echocardiography. 31 However, this is the first study to invasively characterize absolute coronary flow and resistance in patients with and without LVH and relate it to myocardial mass assessed with CMR.
The results of this study are most appropriately analyzed from 2 vantage points: that of regional and global flow (ie, mass indexed) and total nonindexed flow.
Global Flow
Although hyperemic global LAD flow was not different between groups, there was a significant positive correlation with LVMi, suggesting that global hyperemic flow does increase progressively with LVM. This is likely facilitated by a decreased global minimal microvascular resistance, as evidenced by the correlation between R µ and LVM, which was only present in patients with LVH (ie, those with large LVM). However, this seemingly increased hyperemic flow did not manifest in an increased CFR compared with nonhypertrophic patients. In addition, there was no correlation between CFR and LVMi. An explanation for this is that the expected effects of a higher hyperemic flow on CFR may be diminished by a concomitantly increased global resting flow in the LVH group, attributable to more extensive AS severity. We did not measure resting flow directly in this study, but resting transit mean time in the LAD was 32% shorter in the LVH group, with the difference being borderline significant. If real, this difference may explain the comparable CFR values between groups, despite the difference in AS severity disadvantaging the LVH group (Figure 5). Moreover, like others, we found no correlation between CFR and LVMi,30, 32, 33, 34, 35 although Gutiérrez‐Barrios et al have contested this finding. 31
Figure 5. Dynamic changes in coronary flow reserve (CFR) in severe aortic stenosis (AS).
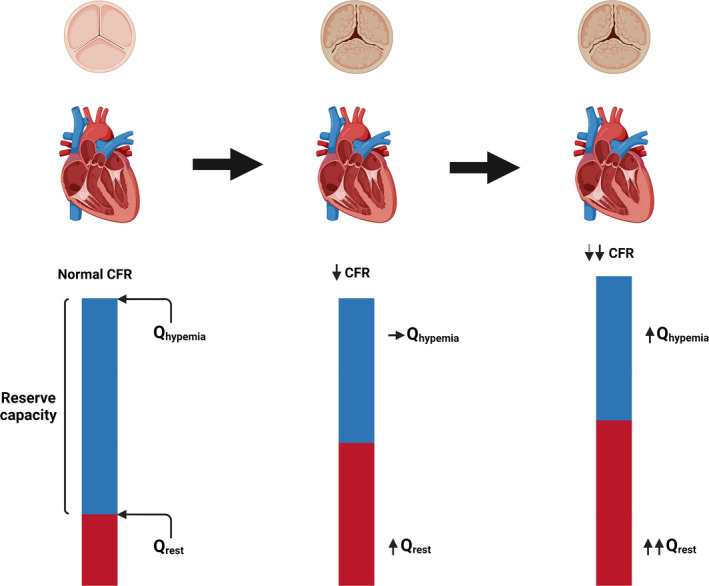
Illustration of the continuum (left to right) going from a normal state to severe AS, and finally to severe AS with left ventricular hypertrophy. In the normal state, the difference between global resting and hyperemic flow (Qrest and Qhyperemia, respectively) ensures a normal CFR. When AS develops, resting flow increases with no change in hyperemic flow, thus leading to a decrease in CFR. When the myocardium hypertrophies, so does resting flow and CFR declines further. However, the further decline in CFR is attenuated by a concomitant increase in global hyperemic flow.
Regional Flow
It seems reasonable to assume that absolute hyperemic capacity ought to increase in proportion to myocardial mass, such that flow per gram of myocardium is kept constant. However, this was not the case, as hyperemic LAD flow per gram of myocardium was 24% lower, and resistance 47% higher, in patients with LVH compared with patients without LVH, and in the RCA these differences were even more pronounced. The failure of hypertrophic patients to match hyperemic flow per gram with that of patients without LVH indicates that the adaptive decrease in global minimal microvascular resistance described above is simply inadequate in terms of increasing global flow sufficiently. In other words, adaptive changes fail to normalize regional perfusion. This does not necessarily indicate microvascular dysfunction per se, but may simply be a consequence of decreased capillary density, as demonstrated in animal models of pressure and volume overload.36, 37
Compared with controls, patients with severe AS have higher resting global flow,31, 32 the reason commonly referred to when explaining the generally low CFR in patients with AS. In this study, we have shown that in patients with severe AS and LVH, reduced regional hyperemic capacity also plays a role as it exposes the failure of adapting global flow to maintain a normal CFR. Thus, LVH in the context of severe AS may be considered as an additional challenge for an already stressed coronary microcirculation. The clinical implication of this may be that the threshold for Heart Team referral should be lower for patients with severe AS and LVH compared with patients with AS alone, as the former likely have reached the limit of vascular compensation for their AS.
Indexes of Microvascular Function
As global indexes of microvascular function, both CFR and IMR were not significantly different between patients with and without LVH. IMR is defined as the product of hyperemic distal coronary pressure and hyperemic mean transit time, both indexes not necessarily influenced by the presence of LVH. In contrast, R µ,index was significantly increased in patients with LVH.
Limitations
Although the sample size in this exploratory study was limited, it is the largest study of this type to date in patients with AS.10, 23, 24, 25, 26, 27, 28, 29, 30, 31, 32 Because of the extensive measurement protocol, we performed additional measurements in the RCA in only 21 of the 53 patients. Moreover, our data only refer to LVH in the context of severe AS in patients referred for transcatheter or surgical valve replacement. Our data cannot be extrapolated to other causes of LVH. Another important limitation is that mass‐indexed flow does not reflect true tissue perfusion as LVM was used instead of the vessel‐specific territory. However, in this context, group differences are more informative than the absolute values of tissue perfusion. Finally, we did not measure resting coronary blood flow and resting resistance as the method for resting indexes with continuous thermodilution was not available at the time when study data were collected. In the meantime, it has been shown that resting blood flow and baseline myocardial resistance can be measured using the same method used in this study, 38 thus allowing calculation of microvascular resistance reserve, a recently introduced index synthesizing microvascular measures irrespective of the extent of the myocardial territory, epicardial abnormalities, or hemodynamics.38, 39
Conclusions
Hyperemic blood flow per gram of myocardium is significantly reduced in patients with severe LVH compared with nonhypertrophic patients with AS, and minimal myocardial resistance is significantly increased, suggesting abnormal structure of the coronary microcirculation. Mass‐indexed microvascular resistance detects these pathological changes better than CFR or IMR.
Sources of Funding
This work was supported by a PhD grant (No. R198‐A8805‐B44165), Rigshospitalet–Copenhagen University Hospital, Copenhagen, Denmark.
Disclosures
Dr Pijls received Institutional Research Grants from Abbott and Hexacath; received consultancy fees from Abbott and Opsens; has minor equity in Philips, ASML, Heartflow, and General Electric; and has patents pending on diagnostic methods for quantifying aortic valve stenosis severity and microvascular physiology. The remaining authors have no disclosures to report.
For Sources of Funding and Disclosures, see page 10.
References
- 1. Cioffi G, Faggiano P, Vizzardi E, Tarantini L, Cramariuc D, Gerdts E, de Simone G. Prognostic effect of inappropriately high left ventricular mass in asymptomatic severe aortic stenosis. Heart. 2011;97:301–307. doi: 10.1136/hrt.2010.192997 [DOI] [PubMed] [Google Scholar]
- 2. Treibel TA, Kozor R, Schofield R, Benedetti G, Fontana M, Bhuva AN, Sheikh A, López B, González A, Manisty C, et al. Reverse myocardial remodeling following valve replacement in patients with aortic stenosis. J Am Coll Cardiol. 2018;71:860–871. doi: 10.1016/j.jacc.2017.12.035 [DOI] [PMC free article] [PubMed] [Google Scholar]
- 3. Rajappan K, Rimoldi OE, Dutka DP, Ariff B, Pennell DJ, Sheridan DJ, Camici PG. Mechanisms of coronary microcirculatory dysfunction in patients with aortic stenosis and angiographically normal coronary arteries. Circulation. 2002;105:470–476. doi: 10.1161/hc0402.102931 [DOI] [PubMed] [Google Scholar]
- 4. Beach JM, Mihaljevic T, Rajeswaran J, Marwick T, Edwards ST, Nowicki ER, Thomas J, Svensson LG, Griffin B, Gillinov AM, et al. Ventricular hypertrophy and left atrial dilatation persist and are associated with reduced survival after valve replacement for aortic stenosis. J Thorac Cardiovasc Surg. 2014;147:362–369.e8. doi: 10.1016/j.jtcvs.2012.12.016 [DOI] [PubMed] [Google Scholar]
- 5. Cortigiani L, Rigo F, Gherardi S, Bovenzi F, Molinaro S, Picano E, Sicari R. Coronary flow reserve during dipyridamole stress echocardiography predicts mortality. JACC Cardiovasc Imaging. 2012;5:1079–1085. doi: 10.1016/j.jcmg.2012.08.007 [DOI] [PubMed] [Google Scholar]
- 6. Lee H, Park J‐B, Yoon YE, Park E‐A, Kim H‐K, Lee W, Kim Y‐J, Cho G‐Y, Sohn D‐W, Greiser A, et al. Noncontrast myocardial T1 mapping by cardiac magnetic resonance predicts outcome in patients with aortic stenosis. JACC Cardiovasc Imaging. 2018;11:974–983. doi: 10.1016/j.jcmg.2017.09.005 [DOI] [PubMed] [Google Scholar]
- 7. Barone‐Rochette G, Piérard S, De Meester de Ravenstein C, Seldrum S, Melchior J, Maes F, Pouleur A‐C, Vancraeynest D, Pasquet A, Vanoverschelde J‐L, et al. Prognostic significance of LGE by CMR in aortic stenosis patients undergoing valve replacement. J Am Coll Cardiol. 2014;64:144–154. doi: 10.1016/j.jacc.2014.02.612 [DOI] [PubMed] [Google Scholar]
- 8. Omran H, Fehske W, Rabahieh R, Hagendorff A, Lüderitz B. Relation between symptoms and profiles of coronary artery blood flow velocities in patients with aortic valve stenosis: a study using transoesophageal Doppler echocardiography. Heart. 1996;75:377–383. doi: 10.1136/hrt.75.4.377 [DOI] [PMC free article] [PubMed] [Google Scholar]
- 9. Hess OM, Villari B, Krayenbuehl HP. Diastolic dysfunction in aortic stenosis. Circulation. 1993;87. Available at https://pubmed.ncbi.nlm.nih.gov/8485837/. Accessed March 29, 2021. [PubMed] [Google Scholar]
- 10. Rajappan K, Rimoldi OE, Camici PG, Bellenger NG, Pennell DJ, Sheridan DJ. Functional changes in coronary microcirculation after valve replacement in patients with aortic stenosis. Circulation. 2003;107:3170–3175. doi: 10.1161/01.CIR.0000074211.28917.31 [DOI] [PubMed] [Google Scholar]
- 11. Schwartzkopff B, Frenzel H, Dieckerhoff J, Betz P, Flasshove M, Schulte HD, Mundhenke M, Motz W, Strauer BE. Morphometric investigation of human myocardium in arterial hypertension and valvular aortic stenosis. Eur Heart J. 1992;13:17–23. doi: 10.1093/eurheartj/13.suppl_D.17 [DOI] [PubMed] [Google Scholar]
- 12. Lumley M, Williams R, Asrress KN, Arri S, Briceno N, Ellis H, Rajani R, Siebes M, Piek JJ, Clapp B, et al. Coronary physiology during exercise and vasodilation in the healthy heart and in severe aortic stenosis. J Am Coll Cardiol. 2016;68:688–697. doi: 10.1016/j.jacc.2016.05.071 [DOI] [PubMed] [Google Scholar]
- 13. Pijls NHJ, De Bruyne B, Smith L, Aarnoudse W, Barbato E, Bartunek J, Bech GJW, Van De Vosse F. Coronary thermodilution to assess flow reserve: validation in humans. Circulation. 2002;105:2482–2486. doi: 10.1161/01.CIR.0000017199.09457.3D [DOI] [PubMed] [Google Scholar]
- 14. Aarnoudse W, van’t Veer M, Pijls NHJ, ter Woorst J, Vercauteren S, Tonino P, Geven M, Rutten M, van Hagen E, de Bruyne B, et al. Direct volumetric blood flow measurement in coronary arteries by thermodilution. J Am Coll Cardiol. 2007;50:2294–2304. doi: 10.1016/j.jacc.2007.08.047 [DOI] [PubMed] [Google Scholar]
- 15. Fearon WF, Balsam LB, Farouque HMO, Robbins RC, Fitzgerald PJ, Yock PG, Yeung AC. Novel index for invasively assessing the coronary microcirculation. Circulation. 2003;107:3129–3132. doi: 10.1161/01.CIR.0000080700.98607.D1 [DOI] [PubMed] [Google Scholar]
- 16. De Bruyne B, Adjedj J, Xaplanteris P, Ferrara A, Mo Y, Penicka M, Floré V, Pellicano M, Toth G, Barbato E, et al. Saline‐induced coronary hyperemia: mechanisms and effects on left ventricular function. Circ Cardiovasc Interv. 2017;10. doi: 10.1161/CIRCINTERVENTIONS.116.004719 [DOI] [PubMed] [Google Scholar]
- 17. Pavek K, Boska D, Selecky FV. Measurement of cardiac output by thermodilution with constant rate. Circ Res. 1964;15:311–319. doi: 10.1161/01.res.15.4.311 [DOI] [PubMed] [Google Scholar]
- 18. Fournier S, Keulards DCJ, van 't Veer M, Colaiori I, Di Gioia G, Zimmermann FM, Mizukami T, Nagumo S, Kodeboina M, El Farissi M, et al. Normal values of thermodilution‐derived absolute coronary blood flow and microvascular resistance in humans. EuroIntervention. 2021;17:e309–e316. doi: 10.4244/EIJ-D-20-00684 [DOI] [PMC free article] [PubMed] [Google Scholar]
- 19. Tikuisis P, Meunier P, Jubenville CE. Human body surface area: measurement and prediction using three dimensional body scans. Eur J Appl Physiol. 2001;85:264–271. doi: 10.1007/s004210100484 [DOI] [PubMed] [Google Scholar]
- 20. Kawel‐Boehm N, Hetzel SJ, Ambale‐Venkatesh B, Captur G, Francois CJ, Jerosch‐Herold M, Salerno M, Teague SD, Valsangiacomo‐Buechel E, van der Geest RJ, et al. Reference ranges (“normal values”) for cardiovascular magnetic resonance (CMR) in adults and children: 2020 update. J Cardiovasc Magn Reson. 2020;22:87. doi: 10.1186/s12968-020-00683-3 [DOI] [PMC free article] [PubMed] [Google Scholar]
- 21. Fuchs A, Mejdahl MR, Kühl JT, Stisen ZR, Nilsson EJP, Køber LV, Nordestgaard BG, Kofoed KF. Normal values of left ventricularmass and cardiac chamber volumes assessed by 320‐detector computed tomography angiography in the Copenhagen General Population Study. Eur Heart J Cardiovasc Imaging. 2016;17:1009–1017. doi: 10.1093/ehjci/jev337 [DOI] [PubMed] [Google Scholar]
- 22. Chuang ML, Gona P, Hautvast GLTF, Salton CJ, Breeuwer M, O’Donnell CJ, Manning WJ. CMR reference values for left ventricular volumes, mass, and ejection fraction using computer‐aided analysis: the Framingham Heart Study. J Magn Reson Imaging. 2014;39:895–900. doi: 10.1002/jmri.24239 [DOI] [PMC free article] [PubMed] [Google Scholar]
- 23. Hildick‐Smith DJ, Shapiro LM. Coronary flow reserve improves after aortic valve replacement for aortic stenosis: an adenosine transthoracic echocardiography study. J Am Coll Cardiol. 2000;36:1889–1896. doi: 10.1016/S0735-1097(00)00947-5 [DOI] [PubMed] [Google Scholar]
- 24. Nemes A, Forster T, Kovács Z, Thury A, Ungi I, Csanády M. The effect of aortic valve replacement on coronary flow reserve in patients with a normal coronary angiogram. Herz. 2002;27:780–784. doi: 10.1007/s00059-002-2355-x [DOI] [PubMed] [Google Scholar]
- 25. Nemes A, Forster T, Kovács Z, Csanády M. Is the coronary flow velocity reserve improvement after aortic valve replacement for aortic stenosis transient? Results of a 3‐year follow‐up. Heart Vessels. 2006;21:157–161. doi: 10.1007/s00380-005-0883-z [DOI] [PubMed] [Google Scholar]
- 26. Camuglia AC, Syed J, Garg P, Kiaii B, Chu MW, Jones PM, Bainbridge D, Teefy PJ. Invasively assessed coronary flow dynamics improve following relief of aortic stenosis with transcatheter aortic valve implantation. J Am Coll Cardiol. 2014;63:1808–1809. doi: 10.1016/j.jacc.2013.11.040 [DOI] [PubMed] [Google Scholar]
- 27. Wiegerinck EMA, van de Hoef TP, Rolandi MC, Yong Z, van Kesteren F, Koch KT, Vis MM, de Mol BAJM, Piek JJ, Baan J. Impact of aortic valve stenosis on coronary hemodynamics and the instantaneous effect of transcatheter aortic valve implantation. Circ Cardiovasc Interv. 2015;8:e002443. doi: 10.1161/CIRCINTERVENTIONS.114.002443 [DOI] [PubMed] [Google Scholar]
- 28. Rolandi MC, Wiegerinck EMA, Casadonte L, Yong Z‐Y, Koch KT, Vis M, Piek JJ, Baan J, Spaan JAE, Siebes M. Transcatheter replacement of stenotic aortic valve normalizes cardiac‐coronary interaction by restoration of systolic coronary flow dynamics as assessed by wave intensity analysis. Circ Cardiovasc Interv. 2016;9:e002356. doi: 10.1161/CIRCINTERVENTIONS.114.002356 [DOI] [PubMed] [Google Scholar]
- 29. Stoller M, Gloekler S, Zbinden R, Tueller D, Eberli F, Windecker S, Wenaweser P, Seiler C. Left ventricular afterload reduction by transcatheter aortic valve implantation in severe aortic stenosis and its prompt effects on comprehensive coronary haemodynamics. EuroIntervention. 2018;14:166–173. doi: 10.4244/EIJ-D-17-00719 [DOI] [PubMed] [Google Scholar]
- 30. Carpeggiani C, Neglia D, Paradossi U, Pratali L, Glauber M, LʼAbbate A. Coronary flow reserve in severe aortic valve stenosis: a positron emission tomography study. J Cardiovasc Med. 2008;9:893–898. doi: 10.2459/JCM.0b013e3282fdc3f1 [DOI] [PubMed] [Google Scholar]
- 31. Gutiérrez‐Barrios A, Gamaza‐Chulián S, Agarrado‐Luna A, Ruiz‐Fernández D, Calle‐Pérez G, Marante‐Fuertes E, Zayas‐Rueda R, Alba‐Sánchez M, Oneto‐Otero J, Vázquez‐Garcia R. Invasive assessment of coronary flow reserve impairment in severe aortic stenosis and ecochadiographic correlations. Int J Cardiol. 2017;236:370–374. doi: 10.1016/j.ijcard.2017.01.150 [DOI] [PubMed] [Google Scholar]
- 32. Eberli FR, Ritter M, Schwitter J, Bortone A, Schneider J, Hess OM, Krayenbuehl HP. Coronary reserve in patients with aortic valve disease before and after successful aortic valve replacement. Eur Heart J. 1991;12:127–138. doi: 10.1093/oxfordjournals.eurheartj.a059858 [DOI] [PubMed] [Google Scholar]
- 33. Opherk D, Mall G, Zebe H, Schwarz F, Weihe E, Manthey J, Kübler W. Reduction of coronary reserve: a mechanism for angina pectoris in patients with arterial hypertension and normal coronary arteries. Circulation. 1984;69:1–7. doi: 10.1161/01.CIR.69.1.1 [DOI] [PubMed] [Google Scholar]
- 34. Houghton J, Frank M, Carr A, von Dohlen T, Prisant L. Relations among impaired coronary flow reserve, left ventricular hypertrophy and thallium perfusion defects in hypertensive patients without obstructive coronary artery disease. J Am Coll Cardiol. 1990;15:43–51. doi: 10.1016/0735-1097(90)90173-m. [DOI] [PubMed] [Google Scholar]
- 35. Houghton J, Prisant L, Carr A, von Dohlen T, Frank M. Relationship of left ventricular mass to impairment of coronary vasodilator reserve in hypertensive heart disease. Am Heart J. 1991;121:1107–1112. doi: 10.1016/0002-8703(91)90669-9 [DOI] [PubMed] [Google Scholar]
- 36. Breisch EA, Houser SR, Carey RA, Spann JF, Bove AA. Myocardial blood flow and capillary density in chronic pressure overload of the feline left ventricle. Cardiovasc Res. 1980;14:469–475. doi: 10.1093/cvr/14.8.469 [DOI] [PubMed] [Google Scholar]
- 37. Thomas D, Phillips S, Bove A. Myocardial morphology and blood flow distribution in chronic volume‐overload hypertrophy in dogs. Basic Res Cardiol. 1984;79:379–388. doi: 10.1007/BF01908137 [DOI] [PubMed] [Google Scholar]
- 38. Gallinoro E, Candreva A, Colaiori I, Kodeboina M, Fournier S, Nelis O, Di Gioia G, Sonck J, van 't Veer M, Pijls NHJ, et al. Thermodilution‐derived volumetric resting coronary blood flow measurement in humans. EuroIntervention. 2021;17:e672–e679. doi: 10.4244/EIJ-D-20-01092 [DOI] [PMC free article] [PubMed] [Google Scholar]
- 39. De Bruyne B, Pijls N, Gallinoro E, Candreva A, Fournier S, Keulards D, Sonck J, Van’t Veer M, Barbato E, Bartunek J, et al. Microvascular resistance reserve for assessment of coronary microvascular function: JACC technology corner. J Am Coll Cardiol. 2021;78:1541–1549. doi: 10.1016/j.jacc.2021.08.017 [DOI] [PubMed] [Google Scholar]