

Abstract
Background
Hyperuricemia is associated with poor cardiovascular outcomes, although it is uncertain whether this relationship is causal in nature. This study aimed to: (1) assess the heritability of serum uric acid (SUA) levels, (2) conduct a genome‐wide association study on SUA levels, and (3) investigate the association between certain single‐nucleotide polymorphisms and target organ damage.
Methods and Results
The STANISLAS (Suivi Temporaire Annuel Non‐Invasif de la Santé des Lorrains Assurés Sociaux) study cohort is a single‐center longitudinal cohort recruited between 1993 and 1995 (visit 1), with a last visit (visit 4 [V4]) performed ≈20 years apart. Serum lipid profile, SUA, urinary albumin/creatinine ratio, estimated glomerular filtration rate, 24‐hour ambulatory blood pressure monitoring, transthoracic echocardiography, pulse wave velocity, and genotyping for each participant were assessed at V4. A total of 1573 participants were included at V4, among whom 1417 had available SUA data at visit 1. Genome‐wide association study results highlighted multiple single‐nucleotide polymorphisms on the SLC2A9 gene linked to SUA levels. Carriers of the most associated mutated SLC2A9 allele (rs16890979) had significantly lower SUA levels. Although SUA level at V4 was highly associated with diabetes, prediabetes, higher body mass index, CRP (C‐reactive protein) levels, estimated glomerular filtration rate variation (visit 1–V4), carotid intima‐media thickness, and pulse wave velocity, rs16890979 was only associated with higher carotid intima‐media thickness.
Conclusions
Our findings demonstrate that rs16890979, a genetic determinant of SUA levels located on the SLC2A9 gene, is associated with carotid intima‐media thickness despite significant associations between SUA levels and several clinical outcomes, thereby lending support to the hypothesis of a link between SUA and cardiovascular disease.
Keywords: cardiovascular disease, genome‐wide association study, single‐nucleotide polymorphism, uric acid
Subject Categories: Genetic, Association Studies
Nonstandard Abbreviations and Acronyms
- GRM
genetic relatedness matrix
- STANISLAS
Suivi Temporaire Annuel Non‐Invasif de la Santé des Lorrains Assurés Sociaux
- SUA
serum uric acid
- V1
visit 1
- V4
visit 4
Clinical Perspective
What Is New?
Genetic polymorphisms located on the SLC2A9 gene, involved in urate transportation, are associated with serum uric acid levels.
Meanwhile, genetic polymorphisms are not associated with cardiovascular outcomes, except for carotid intima‐media thickness.
What Are the Clinical Implications?
Serum uric acid level might be associated with diabetes, prediabetes, higher body mass index levels, and decline in glomerular filtration rate and CRP (C‐reactive protein) levels.
Cardiovascular outcome related with serum uric acid level is likely dependent on multiple factors, including polygenetic inheritance and environmental factors, such as diet.
Cardiovascular diseases (CVDs), including coronary heart diseases, heart failure, and stroke, are the most common noncommunicable diseases globally, resulting in annually 17.8 million deaths and 35.6 million years lived with disability. 1 Nonmodifiable risk factors, such as age, sex, and genetic mutations, as well as modifiable risk factors, including dyslipidemia, diabetes, obesity, physical inactivity, tobacco smoking, hypertension, and numerous systemic diseases, have been identified. 2 , 3 Hyperuricemia has emerged as a significant contributor in the development of hypertension, chronic kidney disease (CKD), diabetes, CVD, and hepatosteatosis. 4 , 5 , 6 , 7 , 8 Increased activation of the renin‐angiotensin‐aldosterone system, endothelial dysfunction, oxidative stress, inflammation, fibrosis, and the decline in NO availability have all been shown to play a critical role in the pathogenesis of hyperuricemia‐related cardiovascular and renal diseases. 9 , 10 , 11 , 12 In addition to its direct role in the pathophysiology of CVD, hyperuricemia also appears to have an indirect role by altering other risk factors, such as diabetes and hypertension. 13 , 14 Patients with hyperuricemia have significantly lower levels of estimated glomerular filtration rate (eGFR) and a higher incidence of atherosclerosis assessed by carotid intima‐media thickness. 15 , 16 , 17 A large‐scale meta‐analysis furthermore revealed that a 1‐mg/dL increase in serum uric acid (SUA) level results in an ≈13% increase in rates of incident hypertension. 18
Individual variations in SUA levels stem from genetic and environmental factors, including dietary modifications, such as high fructose, purin‐rich food (meat and fish), and/or alcohol intake, medication use, and poor glycemic control. 19 , 20 , 21 , 22 Heritable causative factors are believed to contribute to 35% to 77% of cases, whereas recent genome‐wide association studies (GWASs) have pointed out mutations on the SLC2A9 gene located on chromosome 4. 23 , 24 SLC2A9, a uric acid transporter (also known as GLUT9), is highly expressed in proximal tubules and is involved in the transport of uric acid from tubular cells into the peritubular interstitial space, whereas absorption from the glomerular ultrafiltrate is predominantly dependent on another carrier, SLC22A12. 25 , 26 Single‐nucleotide polymorphisms (SNPs) of both genes have been associated with hyperuricemia and clinical features of gout. For example, in a study conducted in 104 primary patients with gout and 300 control subjects, rs11231825, the G allele of GLUT9 rs16890979, was found to be linked to underexcretion of uric acid in proximal tubules. 27
Studies investigating the role of genetic polymorphisms, in particular SNPs, in systemic diseases, including CVD, hypertension, diabetes, and diabetic complications, have yielded conflicting results with no consensus on the causal relationship between genetic variants and clinical outcome. 28 , 29 , 30 , 31 , 32 , 33 Within the framework of the large‐scale familial STANISLAS (Suivi Temporaire Annuel Non‐Invasif de la Santé des Lorrains Assurés Sociaux) study cohort, 34 in which SUA data were available at 2 time points with an ≈20‐year follow‐up, we previously reported that increased SUA is associated with the development of hypertension and vascular/renal target organ damage (blood pressure increase, eGFR decline, and arterial stiffness) in initially healthy midlife subjects. 35 In the present study, our aim was to (1) assess the heritability of SUA levels, (2) assess the relationship between SNPs (GWAS) and SUA levels, and (3) investigate the association between SNPs most associated with SUA and metabolic outcomes and target organ damage.
Methods
Study Design and Study Population
The data that support the findings of this study are available from the corresponding author on reasonable request. The STANISLAS study cohort is a single‐center longitudinal cohort recruited between 1993 and 1995 at the Center for Preventive Medicine in Nancy, France, composed of 1006 families with 4295 subjects. After the baseline visit (visit 1 [V1]), 1705 subjects were reassessed 20 years later on their last visit (visit 4 [V4]). Serum lipid profile, SUA, urinary albumin/creatinine ratio, CRP (C‐reactive protein), and serum creatinine were measured through obtained serum and urine samples at each visit. V4 also included 24‐hour ambulatory blood pressure monitoring, transthoracic echocardiography, and pulse wave velocity. eGFR calculations were performed using the CKD Epidemiology Collaboration formula. 36 Subjects were considered healthy at the baseline visit (V1) with absence of any acute or chronic diseases, thereby allowing observation of the development of diseases and intermediary phenotypes. 34
Definition and measurement methods of hypertension, diabetes, pulse wave velocity, and carotid intima‐media thickness were previously defined. 35 Glomerular filtration rate variation V1 to V4 is defined as the decline in glomerular filtration rate in subjects between V1 and V4. This study was approved by our institutional review board. All participants gave written informed consent before enrollment in the study.
Statistical Analysis
For heritability estimation, a dedicated linear mixed model was used, allowing us to simultaneously include additive genetic effects across the genome, common environment effects shared by family members, as well as fixed effects (sex and age). Two approaches were used to take into account genetic relatedness: first, a kinship matrix based on declared family relationships; second, a genetic relatedness matrix (GRM) based on genotype correlation computed using the polymorphic SNPs of genotyped participants. The use of the GRM allowed a better inference of relatedness between siblings, as opposed to an expected average. 37
GWAS was used to investigate the association between variations in SUA levels and genetic polymorphisms, with the results presented as Manhattan plots. GWASs with SUA level at V1 and V4 were tested using a linear mixed‐effect model to take into account pedigree data under an additive genetic model, with age and sex of the subjects used as covariates. Results were considered genome‐wide significant at P<1E‐8 as usual.
Logistic or linear mixed models with age and sex as covariates were used to test for association between CVD and organ damage outcomes with SUA levels as well as with SNPs most associated with SUA.
All analyses were performed with R (version 3.5.0) using the R package Gaston (version 1.5.7) 38 for heritability estimation and GWAS analysis.
Results
Participant Characteristics
SUA data were available for 1697 participants at V4, for whom 1573 (mean age, 48.8 years; range, 18–88 years; 48.9% men) also had genotype data. Among them, 1538 participants had SUA data at V1, for whom 1417 (mean age, 31.7 years; range, 6–71 years; 48.0% men) were genotyped. In addition to general characteristics of the cohort, mean SUA levels are shown in Table 1.
Table 1.
General Characteristics and Mean SUA Levels of the Study Participants
| Variable | All subjects | Genotyped subjects | ||
|---|---|---|---|---|
| Visit 1 | Visit 4 | Visit 1 | Visit 4 | |
| No. of subjects | 1538 | 1697 | 1417 | 1573 |
| Age, mean (range), y | 31.78 (6–71) | 48.9 (18–88) | 31.7 (6–71) | 48.8 (18–88) |
| Male/female ratio, n (%) | 734/804 (47.7/52.3) | 824/873 (48.5/51.5) | 680/737 (48.0/52.0) | 768/805 (48.9/51.1) |
| Smoker, n (%) | 254 (16.5) | 363 (21.4) | 226 (15.9) | 332 (21.1) |
| Systolic BP office, mean±SD, mm Hg | … | 125.6±15.5 | / | 125.6±15.5 |
| Diastolic BP office, mean±SD, mm Hg | … | 72.4±8.9 | / | 72.4±8.9 |
| Systolic BP 24 h, mean±SD, mm Hg | … | 120.2±10.3 | / | 120.1±10.2 |
| Diastolic BP 24 h, mean±SD, mm Hg | … | 74.2±7.2 | / | 74.2±7.2 |
| Systolic BP daytime, mean±SD, mm Hg | … | 124.5±10.7 | / | 124.4±10.7 |
| Diastolic BP daytime, mean±SD, mm Hg | … | 78.3±7.6 | / | 78.3±7.6 |
| Systolic BP nighttime, mean±SD, mm Hg | / | 111.5±10.4 | / | 111.5±10.4 |
| Diastolic BP nighttime, mean±SD, mm Hg | / | 66.1±7.5 | / | 66.2±7.5 |
| Antihypertensive treatment, n (%) | / | 307 (18.1) | / | 281 (17.9) |
| Atherosclerosis plaques, n (%) | / | 211 (12.4) | / | 190 (12.1) |
| Index LVM, mean±SD, g/m² | / | 76.2±19.2 | / | 76.1±19.3 |
| Left ventricular hypertrophy, n (%) | / | 220 (13.0) | / | 203 (12.9) |
| Pulse wave velocity, mean±SD, m/s | / | 8.5±1.8 | / | 8.5±1.8 |
| Pulse wave velocity >10 m/s, n (%) | / | 266 (15.7) | / | 236 (15.0) |
| Carotid intima‐media thickness, mean±SD, μm | / | 631.9±146.9 | / | 630.3±146.5 |
| Carotid intima‐media thickness >900 μm, n (%) | / | 76 (4.5) | / | 71 (4.5) |
| CRP, mean±SD, mg/dL | / | 3.0±5.7 | / | 2.9±5.7 |
| Urine ACR, mean±SD, mg/mmol | / | 1.4±8.2 | / | 14.1±80.5 |
| Urine ACR >3 mg/mmol, n (%) | / | 77 (4.5) | ||
| Glomerular filtration rate, mean±SD, mL/min per 1.73 m² | 103.3±23.3 | 96.4±15.3 | 103.5±23.5 | 96.5±15.4 |
| Glomerular filtration rate decline between visit 4 and visit 1, mean±SD, mL/min per 1.73 m² | / | 8.1±16.6 | / | 8.3±16.8 |
| Diabetes, n (%) | 9 (0.6) | 74 (4.4) | 9 (0.64) | 72 (4.7) |
| Prediabetes, n (%) | 151 (9.8) | 664 (39.1) | 143 (10.1) | 611 (39.7) |
| Body mass index, mean±SD, kg/m2 | 22.6±4.3 | 26.0±4.8 | 22.5±4.3 | 25.9±4.8 |
| SUA level, mean±SD, µmol/L | 265.6±67.6 | 306.3±75.9 | 265.3±68.1 | 305.3±75.4 |
| Hypouricemia (<119 µmol/L), n (%) | 1 (0.1) | 3 (0.2) | 1 (0.1) | 3 (0.2) |
| Hyperuricemia (>420 µmol/L), n (%) | 32 (2.1) | 124 (7.31) | 31 (2.2) | 108 (6.9) |
The slash mark (/) indicate that the data is not available for the Visit 1.
ACR indicates albumin/creatinine ratio; BP, blood pressure; CRP, C‐reactive protein; LVM, left ventricular mass; and SUA, serum uric acid.
Heritability of SUA Level
At V1, the heritability estimation through variance decomposition analysis for SUA levels, measured with the kinship matrix for 1538 participants, revealed heritability rates of 28.1% and 8% for family effect. When estimation was assessed with GRM for the 1417 subjects with available genomic data, the heritability rates accounted for 34.6% and 5.6% for family effect (Table 2). At V4, ≈20 years later, analysis using the kinship matrix for SUA levels for 1697 participants revealed higher rates of heritability estimation (65.3%) as well as with GRM for the 1573 subjects with available genomic data (heritability rate, 66.3%) (Table 2). Combined variance decomposition analysis for SUA levels including both visits is shown in Table 2. Analysis with the kinship matrix revealed 39.6% for heritability, 0.4% for family effect, and 18.4% for repeated measures effect (because subjects appear in both V1 and V4), whereas GRM analysis revealed 40.1% for heritability, 0.8% for family effect, and 17.1% for repeated measures effect.
Table 2.
Percentage of Variance Decomposition for SUA at V1 (for All Participants With Kinship and for Genotyped Participants With GRM)
| Variable | Heritability, % | Family effect, % | Repeated measures, % | Residual effect, % |
|---|---|---|---|---|
| V1 | ||||
| Kinship (n=1538) | 28.1 | 8.0 | 63.9 | |
| GRM (n=1417) | 34.6 | 5.6 | 60.2 | |
| V4 | ||||
| Kinship (n=1697) | 65.3 | 7.2 | 27.5 | |
| GRM (n=1573) | 66.3 | 7.7 | 26.0 | |
| Both visits | ||||
| Kinship (n=3235) | 39.6 | 0.4 | 18.4 | 41.6 |
| GRM (n=2990) | 40.1 | 0.8 | 17.1 | 42.0 |
GRM indicates genetic relatedness matrix; SUA, serum uric acid; V1, visit 1; and V4, visit 4.
GWAS Results
Numerous SNPs located on the SLC2A9 gene on chromosome 4 as well as certain SNPs from other chromosomes, including chromosomes 10 to 11, were highly associated with SUA levels, as shown in the Manhattan plot (Figure 1), demonstrating the association between SNP ranking by chromosomes and SUA levels at V1 (Figure 1). Of all significantly associated SNPs (Table 3), only rs16890979 corresponded to a missense mutation in the SLC2A9 gene; the remaining SNPs, located in introns of the SLC2A9 gene, were in high linkage disequilibrium with rs16890979 (data not shown). ANOVA of SUA levels at V1 across rs16890979 genotypes revealed that carriers of the T allele had lower SUA levels (Figure 2).
Figure 1. Manhattan plot, illustrating the association between single‐nucleotide polymorphisms and serum uric acid level at visit 1.
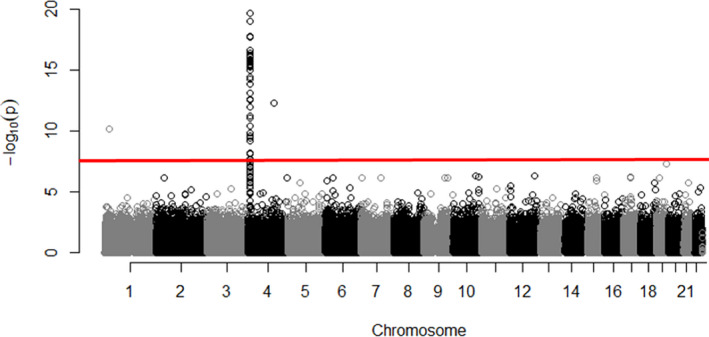
Table 3.
Characteristics of the 78 SNPs Having the Highest Association With SUA Level at V4 (P<10−8)
| rs Name | Chromosome | A1 | A2 | Freq A2 | β | SD | P value | Variation | Gene |
|---|---|---|---|---|---|---|---|---|---|
| rs938554 | 4 | C | G | 0.777 | 3.808 | 0.467 | 3.65E‐16 | Intron | SLC2A9 |
| rs6832439 | 4 | A | G | 0.777 | 3.808 | 0.467 | 3.65E‐16 | Intron | SLC2A9 |
| rs16890979 * | 4* | T* | C* | 0.777* | 3.796* | 0.467* | 4.52E‐16* | Missense* | SLC2A9 * |
| rs734553 | 4 | G | T | 0.747 | 3.644 | 0.449 | 5.07E‐16 | Intron | SLC2A9 |
| rs13129697 | 4 | G | T | 0.712 | 3.420 | 0.430 | 1.85E‐15 | Intron | SLC2A9 |
| rs10805346 | 4 | C | T | 0.552 | 3.100 | 0.391 | 2.35E‐15 | Intron | SLC2A9 |
| rs737267 | 4 | T | G | 0.741 | 3.484 | 0.445 | 4.68E‐15 | Intron | SLC2A9 |
| rs6855911 | 4 | G | A | 0.740 | 3.480 | 0.445 | 5.34E‐15 | Intron | SLC2A9 |
| rs4475146 | 4 | A | C | 0.768 | 3.587 | 0.460 | 6.20E‐15 | Intron | SLC2A9 |
| rs6838021 | 4 | T | C | 0.775 | 3.607 | 0.464 | 7.22E‐15 | Intron | SLC2A9 |
| rs7669607 | 4 | T | C | 0.775 | 3.661 | 0.471 | 7.48E‐15 | Intron | SLC2A9 |
| rs28592748 | 4 | T | C | 0.777 | 3.671 | 0.472 | 7.60E‐15 | Intron | SLC2A9 |
| rs4591605 | 4 | T | C | 0.777 | 3.671 | 0.472 | 7.60E‐15 | Intron | SLC2A9 |
| rs7678287 | 4 | A | G | 0.776 | 3.663 | 0.472 | 8.18E‐15 | Intron | SLC2A9 |
| rs9991278 | 4 | T | C | 0.777 | 3.666 | 0.472 | 8.34E‐15 | Intron | SLC2A9 |
| rs7696983 | 4 | A | C | 0.776 | 3.652 | 0.471 | 8.93E‐15 | Intron | SLC2A9 |
| rs4481233 | 4 | T | C | 0.810 | 3.849 | 0.498 | 1.03E‐14 | Intron | SLC2A9 |
| rs7683856 | 4 | A | G | 0.776 | 3.645 | 0.472 | 1.10E‐14 | Intron | SLC2A9 |
| rs13111638 | 4 | T | C | 0.805 | 3.779 | 0.493 | 1.84E‐14 | Intron | SLC2A9 |
| rs6449213 | 4 | C | T | 0.803 | 3.754 | 0.491 | 2.16E‐14 | Intron | SLC2A9 |
| rs3775948 | 4 | G | C | 0.735 | 3.330 | 0.442 | 4.76E‐14 | Intron | SLC2A9 |
| rs4697701 | 4 | A | G | 0.709 | 3.207 | 0.426 | 4.86E‐14 | Intron | SLC2A9 |
| rs13106991 | 4 | A | G | 0.782 | 3.474 | 0.469 | 1.26E‐13 | Intron | SLC2A9 |
| rs7442295 | 4 | G | A | 0.779 | 3.457 | 0.467 | 1.33E‐13 | Intron | SLC2A9 |
| rs4529048 | 4 | C | A | 0.729 | 3.254 | 0.441 | 1.62E‐13 | Intron | SLC2A9 |
| rs11942223 | 4 | C | T | 0.779 | 3.434 | 0.467 | 2.01E‐13 | Intron | SLC2A9 |
| rs4144 | 4 | T | C | 0.778 | 3.497 | 0.479 | 2.74E‐13 | Intron | SLC2A9 |
| rs9998811 | 4 | A | G | 0.780 | 3.410 | 0.467 | 2.97E‐13 | Intron | SLC2A9 |
| rs4639073 | 4 | C | T | 0.781 | 3.420 | 0.469 | 3.02E‐13 | Intron | SLC2A9 |
| rs7696092 | 4 | C | A | 0.777 | 3.471 | 0.478 | 3.99E‐13 | Intron | SLC2A9 |
| rs4637402 | 4 | C | T | 0.776 | 3.460 | 0.477 | 4.04E‐13 | None | |
| rs17251963 | 4 | C | T | 0.806 | 3.552 | 0.490 | 4.25E‐13 | None | |
| rs12509955 | 4 | T | C | 0.778 | 3.454 | 0.479 | 5.34E‐13 | Intron | SLC2A9 |
| rs7671266 | 4 | T | C | 0.780 | 3.442 | 0.477 | 5.59E‐13 | Intron | WDR1 |
| rs16868246 | 4 | C | G | 0.788 | 3.389 | 0.475 | 9.92E‐13 | Intron | SLC2A9 |
| rs13125646 | 4 | A | G | 0.788 | 3.357 | 0.474 | 1.49E‐12 | Intron | SLC2A9 |
| rs62288518 | 4 | C | T | 0.785 | 3.321 | 0.479 | 4.06E‐12 | Intron | WDR1 |
| rs7680126 | 4 | G | A | 0.770 | 3.149 | 0.460 | 7.80E‐12 | Intron | SLC2A9 |
| rs4697933 | 4 | A | G | 0.792 | 3.293 | 0.483 | 8.98E‐12 | None | |
| rs17420080 | 4 | T | C | 0.786 | 3.243 | 0.478 | 1.13E‐11 | None | |
| rs2868937 | 4 | T | C | 0.791 | 3.281 | 0.484 | 1.22E‐11 | None | |
| rs35782983 | 4 | A | G | 0.805 | 3.332 | 0.493 | 1.41E‐11 | Intron | WDR1 |
| rs4640669 | 4 | A | G | 0.792 | 3.243 | 0.482 | 1.75E‐11 | None | |
| rs4697703 | 4 | G | A | 0.786 | 3.207 | 0.478 | 2.02E‐11 | Intron | WDR1 |
| rs11728093 | 4 | C | A | 0.789 | 3.222 | 0.483 | 2.59E‐11 | None | |
| rs78030862 | 4 | A | G | 0.799 | 3.257 | 0.489 | 2.69E‐11 | None | |
| rs17198547 | 4 | T | C | 0.800 | 3.240 | 0.491 | 3.99E‐11 | None | |
| rs10022911 | 4 | G | A | 0.801 | 3.190 | 0.491 | 8.50E‐11 | None | |
| rs6827401 | 4 | G | A | 0.851 | 3.465 | 0.552 | 3.35E‐10 | Intron | SLC2A9 |
| rs4698036 | 4 | G | T | 0.757 | 2.881 | 0.464 | 5.56E‐10 | None | |
| rs6827946 | 4 | C | T | 0.774 | 2.822 | 0.469 | 1.80E‐09 | None | |
| rs9291640 | 4 | C | T | 0.784 | 2.864 | 0.481 | 2.63E‐09 | Intron | SLC2A9 |
| rs147801768 | 10 | A | G | 0.999 | −33.108 | 5.727 | 7.41E‐09 | Missense | NOLC1 |
| rs6449144 | 4 | T | G | 0.653 | −2.380 | 0.412 | 7.53E‐09 | Intron | SLC2A9 |
| rs4698014 | 4 | T | C | 0.772 | 2.730 | 0.473 | 7.93E‐09 | None | |
| rs7666545 | 4 | C | T | 0.813 | 2.847 | 0.502 | 1.47E‐08 | Intron | SLC2A9 |
| rs11723742 | 4 | G | A | 0.768 | 2.650 | 0.468 | 1.47E‐08 | Intron | WDR1 |
| rs149582759 | 11 | A | G | 0.998 | −27.249 | 4.824 | 1.62E‐08 | Missense | SYTL2 |
| rs11722228 | 4 | T | C | 0.650 | −2.298 | 0.410 | 2.00E‐08 | Intron | SLC2A9 |
| rs6825187 | 4 | T | C | 0.650 | −2.298 | 0.410 | 2.00E‐08 | Intron | SLC2A9 |
| rs714436 | 4 | C | A | 0.783 | 2.676 | 0.480 | 2.44E‐08 | None |
SNPs are listed according to their P value order. Sex and age are used as covariates. A1, Allele 1; A2, Allele 2; Freq A2, Frequency of A2 Allele 2; SNP indicates single‐nucleotide polymorphism; SUA, serum uric acid; and V4, visit 4.
Indicates rs16890979, which is the mutated allele of SLC2A9.
Figure 2. Boxplot for serum uric acid (SUA) at visit 1, according to genotype at rs16890979 (ANOVA P value=2.0E‐12; pairwise t tests; P value for TT/TC=0.0006; P value for TC/CC=2.4E‐7; P value for TT/CC=7.9E‐9).
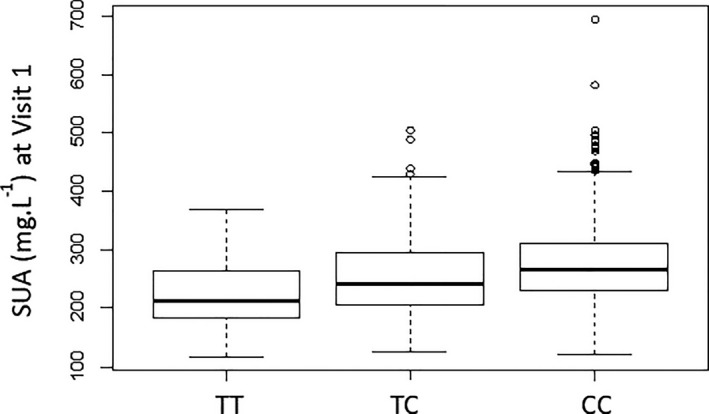
The box represents the median and the interquartile range (IQR), and the whiskers represent Q1–1.5 IQR for the minimum and Q3+1.5 IQR for the maximum. Q1, quartile 1; Q3, quartile 3.
Similarly, the Manhattan plot demonstrating the association between SNPs and SUA levels at V4 illustrated a similar pattern of associated SNPs on the SLC2A9 gene with the highest peak (Figure 3). In addition, ANOVA indicated that carriers of the T allele had significantly lower SUA levels at V4 (Figure 4).
Figure 3. Manhattan plot, illustrating the association between single‐nucleotide polymorphisms and serum uric acid at visit 4.
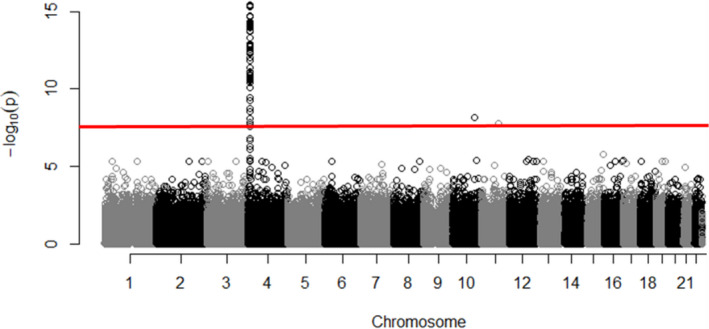
Figure 4. Boxplot for serum uric acid (SUA) at visit 4, according to genotype at rs16890979.
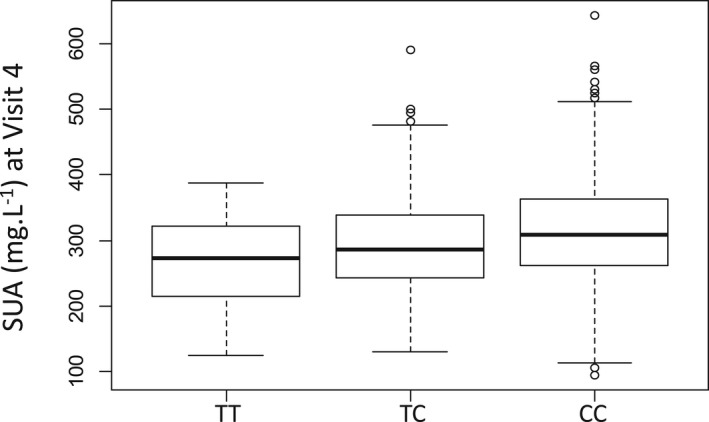
ANOVA P value=1.0E‐10; pairwise t tests; P value for TT/TC=0.002; P value for TC/CC=1.5E‐6; P value for TT/CC=1.4E‐7. The box represents the median and the interquartile range (IQR), and the whiskers represent Q1–1.5 IQR for the minimum and Q3+1.5 IQR for the maximum. Q1, quartile 1; Q3, quartile 3.
Associations With Metabolic Outcomes and Target Organ Damage
SUA level at V4 was highly associated with systemic (sub)clinical outcomes, including diabetes, prediabetes, higher body mass index levels, V1 to V4 eGFR variation, and CRP levels. However, rs16890979 was only associated with carotid intima‐media thickness and pulse wave velocity (at binary analysis) (Table 4).
Table 4.
Associations of SUA Level and rs16890979 With Metabolic as Well as Clinical, Cardiovascular, and Renal Outcomes
| Variable | Association with SUA level at visit 4* | Association with rs16890979 † | ||||
|---|---|---|---|---|---|---|
| β | SD | P value | β | SD | P value | |
| Hypertension (binary) | 0.001 | 0.0001 | 4E‐10 | 0.014 | 0.016 | 0.36 |
| Pulse wave velocity (m/s) | 0.0001 | 0.0006 | 0.91 | 0.087 | 0.063 | 0.17 |
| Pulse wave velocity >10 m/s (binary) | 0.0001 | 0.0001 | 0.51 | 0.029 | 0.014 | 0.04 |
| Carotid intima‐media thickness (μm) | 0.035 | 0.047 | 0.45 | 14.88 | 5.04 | 0.003 |
| Carotid intima‐media thickness >90 µm (binary) | 0.0001 | 0.0001 | 0.41 | 0.005 | 0.009 | 0.57 |
| CRP (mg/dL) | 0.0096 | 0.0023 | 3E‐5 | −0.366 | 0.249 | 0.14 |
| Urine albumin‐creatinine ratio (mg/mmol) | 0.0047 | 0.0034 | 0.17 | −0.570 | 0.370 | 0.12 |
| Urine albumin‐creatinine ratio >3 mg/mmol | 0.0001 | 0.0001 | 0.26 | −0.013 | 0.009 | 0.13 |
| Estimated glomerular filtration rate (mL/min per 1.73 m²) | −0.036 | 0.044 | 1E‐15 | −0.27 | 0.49 | 0.59 |
| Glomerular filtration rate variation V1–V4 (mL/min per 1.73 m²) | 0.026 | 0.006 | 1E‐5 | 0.53 | 0.65 | 0.41 |
| Prediabetes (binary) | 0.0001 | 0.0002 | 9E‐7 | 0.007 | 0.019 | 0.73 |
| Diabetes (binary) | 0.0003 | 0.0001 | 0.03 | −0.003 | 0.013 | 0.82 |
| Body mass index (kg/m2) | 0.025 | 0.002 | <1E‐16 | 0.248 | 0.199 | 0.21 |
| Hyperuricemia | 0.022 | 0.0001 | <1E‐16 | −0.03 | 0.01 | 0.005 |
| Atherosclerosis plaques | 0.0001 | 0.0001 | 0.26 | −0.013 | 0.014 | 0.41 |
| Index LVM (g/m²) | 0.026 | 0.007 | 0.0002 | 1.37 | 0.74 | 0.07 |
| LVH | 0.0002 | 0.0001 | 0.14 | 0.028 | 0.014 | 0.06 |
| Systolic BP office (mm Hg) | 0.013 | 0.006 | 0.02 | 1.12 | 0.63 | 0.08 |
| Diastolic BP office (mm Hg) | 0.0041 | 0.003 | 0.21 | 0.60 | 0.37 | 0.11 |
| Systolic BP 24 h (mm Hg) | 0.013 | 0.004 | 0.001 | 0.71 | 0.42 | 0.09 |
| Diastolic BP 24 h (mm Hg) | 0.0037 | 0.003 | 0.19 | 0.20 | 0.31 | 0.51 |
| Systolic BP daytime (mm Hg) | 0.013 | 0.004 | 0.002 | 0.76 | 0.44 | 0.09 |
| Diastolic BP daytime (mm Hg) | 0.003 | 0.003 | 0.32 | 0.24 | 0.33 | 0.46 |
| Systolic BP nighttime (mm Hg) | 0.009 | 0.004 | 0.02 | 0.68 | 0.45 | 0.13 |
| Diastolic BP nighttime (mm Hg) | 0.0018 | 0.003 | 0.55 | 0.19 | 0.33 | 0.57 |
Mixed model with random effect on family, with age and sex as covariates. BP indicates blood pressure; CRP, C‐reactive protein; LVH, left ventricular hypertrophy; LVM, left ventricular mass; SUA, serum uric acid; V1, visit 1; and V4, visit 4.
Effect per 1‐µmol/L increment.
Effect per minor allele.
Discussion
This long‐term follow‐up study revealed a rather high heritability for SUA level (ranking from 28% to 66%, according to the model and analyzed time point). More specifically, the GWAS on SUA levels showed a highly significant signal associated with the SLC2A9 gene, encoding for a glucose transporter also involved in urate transportation, which significantly increases SUA. Meanwhile, rs16890979, the most associated SNP of SUA and responsible for a missense mutation on the SCL2A9 gene, was conversely not associated with clinical cardiovascular outcomes, except for carotid intima‐media thickness. More important, SUA levels were associated with most metabolic and clinical cardiovascular and renal outcomes. These findings are compatible with the hypothetical link between SUA and CVD.
As for most common noncommunicable diseases worldwide causing significant mortality and morbidity, CVDs have multiple modifiable and nonmodifiable risk factors, among which SUA levels have gained considerable attention and scientific curiosity. Although the exact underlying pathophysiology remains unclear, elevated SUA levels have been shown to be related with CVD, including atherosclerosis, hypertension, and ischemic heart diseases. 39 In addition, lowering SUA with allopurinol mitigates endothelial dysfunction, insulin resistance, as well as left ventricular hypertrophy. 14 , 40 , 41
SUA is under the strong influence of genetic control, among which the SLC2A9 gene, encoding primarily for the glucose transporter GLUT9, is reported by large‐scale GWASs to have the greatest effect. 31 , 42 , 43 Nevertheless, the causal relationship between cardiovascular outcomes and genetic polymorphisms remains to be determined.
The mutated SLC2A9 allele rs16890979 has been linked to variations in SUA levels in comprehensive meta‐analysis studies, in which only the genetic susceptibility for gout has been extensively assessed. 44 Indeed, an association between rs16890979 and the underexcretion of urate has been reported in proximal tubules, thereby causing hyperuricemia. 27 , 44 Moreover, in a GWAS of SUA levels in association with GLUT9, each copy of the wild‐type allele resulted in a 0.47‐mg/dL decline in SUA (95% CI, 0.31–0.63; P=1.43E‐11), with a more prominent effect in women. 45 Similarly, rs16890979 has been linked to gout in the FHS (Framingham Heart Study). 46 In a study involving 516 Amish participants on 6 days of standardized diets and no antihypertensive medication use, rs16890979 was shown to have an effect on blood pressure assessed by 24‐hour ambulatory blood pressure monitoring. 47 However, such a short follow‐up period for the development of chronic conditions, such as hypertension, may be misleading. Conversely, the more comprehensive cardiovascular assessment of healthy subjects performed herein, including baseline and end of follow‐up assessments of carotid intima‐media thickness, pulse wave velocity, CRP, albuminuria, 24‐hour ambulatory blood pressure monitoring, and eGFR variation, represents one of the significant strengths of our study.
Another SNP located on introns of the SLC2A9 gene, rs734553, which was found in high linkage disequilibrium with rs16890979 in the current study, was associated with changes in carotid intima‐media thickness, internal diameter, and pulse wave velocity in a study conducted with 449 subjects from 107 families in Italy. A similar genotype‐cardiovascular outcome pattern with rs734553 allele has also been demonstrated in a meta‐analysis composed of 1227 subjects. 30 However, assessment of individual studies included in the meta‐analysis revealed 353 subjects with type 2 diabetes and coronary artery disease in the GHS (Gargano Heart Study) population, 119 subjects with a history of myocardial infarction in the Tor Vergata Atherosclerosis Study and 755 participants with stage 2 to 5 CKD in the Multiple Intervention and Audit in Renal Disease to Optimise Care study. 30 Although investigation of genotype‐cardiovascular outcome interactions in individuals with severe comorbidities can potentially lead to noncomprehensive interpretations because of numerous confounding factors, one of the major strengths of our study, on the other hand, was the ability to assess a healthy familial cohort at baseline with a wide‐ranging age distribution and longer follow‐up periods. Accordingly, investigation of the relationship between the rs734553 allele and CKD progression in a study composed of 755 participants with CKD and 211 controls demonstrated that participants with 2 copies of the mutated gene had a higher SUA compared with carriers, whereas the risk for CKD progression was similar in both groups, with a 2.35 times higher risk of CKD progression (hazard ratio, 2.35; 95% CI, 1.25–4.42; P=0.008). 48
Although various observational studies have demonstrated a link between SUA and ischemic heart disease or cardiovascular mortality, large‐scale Mendelian randomization studies have failed to show such association. One such large‐scale Mendelian randomization analysis, including 2 cohorts with 58 072 and 10 602 subjects, which analyzed SLC2A9 (rs7442295) gene variation for SUA levels, failed to demonstrate a causal relationship between SUA and ischemic heart disease and found higher body mass index as a major confounding factor. 49 Similar findings have been demonstrated in a few other Mendelian randomization analyses. 50 , 51 Thus, the association found in the present study between SUA levels and outcomes, such as carotid intima‐media thickness, may not be causal in nature. However, contradictory findings implicating a causal role of SUA levels on cardiovascular outcome have been shown in another Mendelian randomization analysis with 166 486 subjects from 17 prospective observational studies. 52
Contradictory findings illustrating no causal relationship between genomic variants of the SLC2A9 gene and hypertension have also been reported in a meta‐analysis assessing 6 case‐control studies, including a total of 11 897 adult participants, in which all of the included case‐control studies were composed of both hypertensive and normotensive subjects at baseline. 32 Furthermore, no risk for elevated blood pressure has been reported in a GLUT9 knockout mice study, even under inosine‐induced hyperuricemic conditions and despite development of mild kidney dysfunction, as evidenced by a decline in glomerular filtration rate, elevated serum creatinine levels, and demonstration of fibrosis and chronic inflammation in kidney biopsies. 53
Diabetes, along with multiple other medical conditions, has mostly been linked to hyperuricemia, whereas our findings demonstrated that uncontrolled diabetes with high plasma glucose levels is associated with hypouricemia. Certain studies have furthermore shown that hypouricemia in patients with type 2 diabetes was associated with poor metabolic control, late‐onset presentation, progression to overt nephropathy, or hyperfiltration. 54 , 55 Although hyperuricemia is a more typical feature in patients with diabetes, hypouricemia should not be overlooked because it may indicate poor metabolic control or kidney involvement.
The relatively small sample size of our cohort, which included 1006 families and 4295 subjects, is a major limitation of our study and raises the possibility of overlooking certain statistically significant associations in terms of genetic polymorphism and medical characteristics. A large‐scale phenome‐wide association study, including 339 256 subjects at the age of 40 to 69 years, demonstrated statistically significant associations between SUA levels and various medical comorbidities, including inflammatory polyarthropathies, hypertensive disease, circulatory disease, metabolic disorders, 56 carotid intima‐media thickness, and pulse wave velocity, whereas our study failed to demonstrate some of these associations, which may be attributable to smaller sample size, variations in study group characteristics, and various other environmental factors. Therefore, the SNP rs16890979 was found herein to be correlated with the same parameters in contrast to SUA levels; nevertheless, the association is weak, which may support the notion of sample group variations and environmental factors. However, another possible hypothesis is that SNP rs16890979 may cause these outcomes through different mechanisms in addition to its effect on SUA levels. SNPs of SLC22A12, SLC11A2, and ABCG2 have been linked to hyperuricemia in certain GWASs in contrast to our study, a feature that may be attributable to the smaller sample size. Another limitation of our study is the difference between assessment methods between V1 and V4, whereby V4 is more comprehensive and detailed, which possibly may lead to a miscomparison of certain outcomes. Furthermore, for estimation of heritability, we attempted to consider common environmental effects shared by the families, although in the present cohort, only a low family effect was observed. Nevertheless, as a limitation of this study, the confounding effect of various other environmental factors, ranging from diet to drugs, as well as the effect of lifestyle‐dependent factors on SUA and coexisting comorbidities, whether SUA dependent or SUA independent, should be kept in mind. The analysis of these confounding factors requires the use of multiple different statistical tests for various clinical outcomes and genetic polymorphisms, which leads to poor level of evidence on genetic polymorphisms and clinical outcomes in the literature.
CONCLUSIONS
SUA levels, which are highly heritable and varied, depending on individual genotypes, have a significant impact on cardiovascular outcomes. Genetic polymorphisms located on the SLC2A9 gene, encoding for a glucose transporter, which is also involved in urate transportation, are associated with SUA levels. However, these genetic polymorphisms are not associated with cardiovascular outcomes, except for carotid intima‐media thickness, whereas SUA levels, on the other hand, are associated with most cardiovascular outcomes. Therefore, it could be hypothesized that cardiovascular outcomes are likely dependent on multifactorial pathophysiology, including polygenetic inheritance, along with a possible large‐scale role of environmental factors, including diet and exposures, all of which cause an increase in SUA. Future comprehensive studies are clearly needed to investigate the role of environmental factors in association with genotype on SUA levels and cardiovascular outcomes.
Sources of Funding
The STANISLAS (Suivi Temporaire Annuel Non‐Invasif de la Santé des Lorrains Assurés Sociaux) study is sponsored by the Nancy Centre Hospitalier Régional Universitaire. This work is supported by the French Ministry of Health “Programme Hospitalier de Recherche Clinique Inter regional 2013,” by the Contrat de Plan Etat‐Lorraine and Fonds Européen de Développement Régional Lorraine, and a public grant overseen by the French National Research Agency (ANR) as part of the second “Investissements d’Avenir” program FIGHT‐heart failure (reference: ANR‐15‐RHU‐0004) and by the French Plan d'Investissement d'Avenir project “Lorraine Université d’Excellence,” reference ANR‐15‐IDEX‐04‐LUE. It is also supported by the European Fibro‐Targets Project (grant agreement No. SP7#602904), European HOMAGE project (grant agreement No. Heart “Omics” in Ageing, 7th Framework Program grant No. 305507), the MEDIA project (Européen “Cooperation”–Theme "Health"/FP7‐HEALTH‐2010‐single‐stage (reference: 261409), FOCUS‐MR (reference: ANR‐15‐CE14‐0032‐01), ERA‐CVD EXPERT (reference: ANR‐16‐ECVD‐0002‐02), and the Fondation de Recherche en Hypertension Artérielle.
Disclosures
None.
Acknowledgments
The authors thank the Centre de Ressources Biologique Lorrain of Centre Hospitalier Régional Universitaire de Nancy for biobank handling.
Author contributions: Conception and design: Mehmet Kanbay, Faiez Zannad, Sandra Wagner, Constance Xhaard, Nicolas Girerd, and Patrick Rossignol; data acquisition: Constance Xhaard, Nicolas Girerd, Sandra Wagner, and Patrick Rossignol; analysis and interpretation of the data: Constance Xhaard, Nicolas Girerd, and Patrick Rossignol; drafting of the manuscript or revision for intellectual content: Mehmet Kanbay, Constance Xhaard, Edith Le Floch, Claire Dandine‐Roulland, Nicolas Girerd, João Pedro Ferreira, Jean‐Marc Boivin, Sandra Wagner, Delphine Bacq‐Daian, Jean‐François Deleuze, Faiez Zannad, and Patrick Rossignol; final approval of the version to be published: Mehmet Kanbay, Constance Xhaard, Edith Le Floch, Claire Dandine‐Roulland, Nicolas Girerd, João Pedro Ferreira, Jean‐Marc Boivin, Sandra Wagner, Delphine Bacq‐Daian, Jean‐François Deleuze, Faiez Zannad, and Patrick Rossignol.
For Sources of Funding and Disclosures, see page 10.
References
- 1. Roth GA, Abate D, Abate KH, Abay SM, Abbafati C, Abbasi N, Abbastabar H, Abd‐Allah F, Abdela J, Abdelalim A, et al. Global, regional, and national age‐sex‐specific mortality for 282 causes of death in 195 countries and territories, 1980–2017: a systematic analysis for the global burden of disease study 2017. Lancet. 2018;392:1736–1788. doi: 10.1016/S0140-6736(18)32203-7 [DOI] [PMC free article] [PubMed] [Google Scholar]
- 2. Francula‐Zaninovic S, Nola IA. Management of measurable variable cardiovascular disease' risk factors. Curr Cardiol Rev. 2018;14:153–163. doi: 10.2174/1573403X14666180222102312 [DOI] [PMC free article] [PubMed] [Google Scholar]
- 3. Afsar B, Turkmen K, Covic A, Kanbay M. An update on coronary artery disease and chronic kidney disease. Int J Nephrol. 2014;2014:767424. doi: 10.1155/2014/767424 [DOI] [PMC free article] [PubMed] [Google Scholar]
- 4. Mallat SG, Al Kattar S, Tanios BY, Jurjus A. Hyperuricemia, hypertension, and chronic kidney disease: an emerging association. Curr Hypertens Rep. 2016;18:74. doi: 10.1007/s11906-016-0684-z [DOI] [PubMed] [Google Scholar]
- 5. Wang J, Qin T, Chen J, Li Y, Wang L, Huang H, Li J. Hyperuricemia and risk of incident hypertension: a systematic review and meta‐analysis of observational studies. PLoS One. 2014;9:e114259. doi: 10.1371/journal.pone.0114259 [DOI] [PMC free article] [PubMed] [Google Scholar]
- 6. Mortada I. Hyperuricemia, type 2 diabetes mellitus, and hypertension: an emerging association. Curr Hypertens Rep. 2017;19:69. doi: 10.1007/s11906-017-0770-x [DOI] [PubMed] [Google Scholar]
- 7. Jensen T, Niwa K, Hisatome I, Kanbay M, Andres‐Hernando A, Roncal‐Jimenez CA, Sato Y, Garcia G, Ohno M, Lanaspa MA, et al. Increased serum uric acid over five years is a risk factor for developing fatty liver. Sci Rep. 2018;8:11735. doi: 10.1038/s41598-018-30267-2 [DOI] [PMC free article] [PubMed] [Google Scholar]
- 8. Kanbay M, Solak Y, Afsar B, Nistor I, Aslan G, Çağlayan OH, Aykanat A, Donciu M‐D, Lanaspa MA, Ejaz AA, et al. Serum uric acid and risk for acute kidney injury following contrast. Angiology. 2017;68:132–144. doi: 10.1177/0003319716644395 [DOI] [PubMed] [Google Scholar]
- 9. Mazzali M, Hughes J, Kim YG, Jefferson JA, Kang DH, Gordon KL, Lan HY, Kivlighn S, Johnson RJ. Elevated uric acid increases blood pressure in the rat by a novel crystal‐independent mechanism. Hypertension. 2001;38:1101–1106. doi: 10.1161/hy1101.092839 [DOI] [PubMed] [Google Scholar]
- 10. Mazzali M, Kanbay M, Segal MS, Shafiu M, Jalal D, Feig DI, Johnson RJ. Uric acid and hypertension: cause or effect? Curr Rheumatol Rep. 2010;12:108–117. doi: 10.1007/s11926-010-0094-1 [DOI] [PubMed] [Google Scholar]
- 11. Kang D‐H, Nakagawa T, Feng L, Watanabe S, Han L, Mazzali M, Truong L, Harris R, Johnson RJ. A role for uric acid in the progression of renal disease. J Am Soc Nephrol. 2002;13:2888–2897. doi: 10.1097/01.ASN.0000034910.58454.FD [DOI] [PubMed] [Google Scholar]
- 12. Kanbay M, Jensen T, Solak Y, Le M, Roncal‐Jimenez C, Rivard C, Lanaspa MA, Nakagawa T, Johnson RJ. Uric acid in metabolic syndrome: from an innocent bystander to a central player. Eur J Intern Med. 2016;29:3–8. doi: 10.1016/j.ejim.2015.11.026 [DOI] [PMC free article] [PubMed] [Google Scholar]
- 13. Kuwabara M, Kuwabara R, Niwa K, Hisatome I, Smits G, Roncal‐Jimenez C, MacLean P, Yracheta J, Ohno M, Lanaspa M, et al. Different risk for hypertension, diabetes, dyslipidemia, and hyperuricemia according to level of body mass index in Japanese and American subjects. Nutrients. 2018;10:1011. doi: 10.3390/nu10081011 [DOI] [PMC free article] [PubMed] [Google Scholar]
- 14. Takir M, Kostek O, Ozkok A, Elcioglu OC, Bakan A, Erek A, Mutlu HH, Telci O, Semerci A, Odabas AR, et al. Lowering uric acid with allopurinol improves insulin resistance and systemic inflammation in asymptomatic hyperuricemia. J Investig Med. 2015;63:924–929. doi: 10.1097/JIM.0000000000000242 [DOI] [PubMed] [Google Scholar]
- 15. Buzas R, Tautu O‐F, Dorobantu M, Ivan V, Lighezan D. Serum uric acid and arterial hypertension‐data from Sephar III survey. PLoS One. 2018;13:e0199865. doi: 10.1371/journal.pone.0199865 [DOI] [PMC free article] [PubMed] [Google Scholar]
- 16. Zhao J, Chen H, Liu N, Chen J, Gu Y, Chen J, Yang K. Role of hyperhomocysteinemia and hyperuricemia in pathogenesis of atherosclerosis. J Stroke Cerebrovasc Dis. 2017;26:2695–2699. doi: 10.1016/j.jstrokecerebrovasdis.2016.10.012 [DOI] [PubMed] [Google Scholar]
- 17. Kanbay M, Yilmaz MI, Sonmez A, Turgut F, Saglam M, Cakir E, Yenicesu M, Covic A, Jalal D, Johnson RJ. Serum uric acid level and endothelial dysfunction in patients with nondiabetic chronic kidney disease. Am J Nephrol. 2011;33:298–304. doi: 10.1159/000324847 [DOI] [PMC free article] [PubMed] [Google Scholar]
- 18. Grayson PC, Kim SY, LaValley M, Choi HK. Hyperuricemia and incident hypertension: a systematic review and meta‐analysis. Arthritis Care Res. 2011;63:102–110. doi: 10.1002/acr.20344 [DOI] [PMC free article] [PubMed] [Google Scholar]
- 19. Jamnik J, Rehman S, Blanco Mejia S, de Souza RJ, Khan TA, Leiter LA, Wolever TMS, Kendall CWC, Jenkins DJA, Sievenpiper JL. Fructose intake and risk of gout and hyperuricemia: a systematic review and meta‐analysis of prospective cohort studies. BMJ Open. 2016;6:e013191. doi: 10.1136/bmjopen-2016-013191 [DOI] [PMC free article] [PubMed] [Google Scholar]
- 20. Caliceti C, Calabria D, Roda A, Cicero AFG. Fructose intake, serum uric acid, and cardiometabolic disorders: a critical review. Nutrients. 2017;9:395. doi: 10.3390/nu9040395 [DOI] [PMC free article] [PubMed] [Google Scholar]
- 21. Yerlikaya A, Dagel T, King C, Kuwabara M, Lanaspa MA, Andres‐Hernando A, Covic A, Manitius J, Sag AA, Kanbay M. Dietary and commercialized fructose: sweet or sour? Int Urol Nephrol. 2017;49:1611–1620. doi: 10.1007/s11255-017-1544-8 [DOI] [PubMed] [Google Scholar]
- 22. Kaneko K, Aoyagi Y, Fukuuchi T, Inazawa K, Yamaoka N. Total purine and purine base content of common foodstuffs for facilitating nutritional therapy for gout and hyperuricemia. Biol Pharm Bull. 2014;37:709–721. doi: 10.1248/bpb.b13-00967 [DOI] [PubMed] [Google Scholar]
- 23. Wallace C, Newhouse SJ, Braund P, Zhang F, Tobin M, Falchi M, Ahmadi K, Dobson RJ, Marçano ACB, Hajat C, et al. Genome‐wide association study identifies genes for biomarkers of cardiovascular disease: serum urate and dyslipidemia. Am J Hum Genet. 2008;82:139–149. doi: 10.1016/j.ajhg.2007.11.001 [DOI] [PMC free article] [PubMed] [Google Scholar]
- 24. Li S, Sanna S, Maschio A, Busonero F, Usala G, Mulas A, Lai S, Dei M, Orrù M, Albai G, et al. The GLUT9 gene is associated with serum uric acid levels in Sardinia and Chianti cohorts. PLoS Genet. 2007;3:e194. doi: 10.1371/journal.pgen.0030194 [DOI] [PMC free article] [PubMed] [Google Scholar]
- 25. Anzai N, Ichida K, Jutabha P, Kimura T, Babu E, Jin CJ, Srivastava S, Kitamura K, Hisatome I, Endou H, et al. Plasma urate level is directly regulated by a voltage‐driven urate efflux transporter uratv1 (SLC2A9) in humans. J Biol Chem. 2008;283:26834–26838. doi: 10.1074/jbc.C800156200 [DOI] [PubMed] [Google Scholar]
- 26. Sugihara S, Hisatome I, Kuwabara M, Niwa K, Maharani N, Kato M, Ogino K, Hamada T, Ninomiya H, Higashi Y, et al. Depletion of uric acid due to SLC22A12 (URAT1) loss‐of‐function mutation causes endothelial dysfunction in hypouricemia. Circ J. 2015;79:1125–1132. doi: 10.1253/circj.CJ-14-1267 [DOI] [PubMed] [Google Scholar]
- 27. Torres RJ, de Miguel E, Bailén R, Banegas JR, Puig JG. Tubular urate transporter gene polymorphisms differentiate patients with gout who have normal and decreased urinary uric acid excretion. J Rheumatol. 2014;41:1863–1870. doi: 10.3899/jrheum.140126 [DOI] [PubMed] [Google Scholar]
- 28. Voruganti VS, Kent JW, Debnath S, Cole SA, Haack K, Göring HHH, Carless MA, Curran JE, Johnson MP, Almasy L, et al. Genome‐wide association analysis confirms and extends the association of SLC2A9 with serum uric acid levels to Mexican Americans. Front Genet. 2013;4:279. doi: 10.3389/fgene.2013.00279 [DOI] [PMC free article] [PubMed] [Google Scholar]
- 29. Yan D, Wang J, Jiang F, Zhang R, Sun X, Wang T, Wang S, Peng D, He Z, Bao Y, et al. Association between serum uric acid related genetic loci and diabetic kidney disease in the Chinese type 2 diabetes patients. J Diabetes Complicat. 2016;30:798–802. doi: 10.1016/j.jdiacomp.2016.02.018 [DOI] [PubMed] [Google Scholar]
- 30. Testa A, Prudente S, Leonardis D, Spoto B, Sanguedolce MC, Parlongo RM, Tripepi G, Rizza S, Mallamaci F, Federici M, et al. A genetic marker of hyperuricemia predicts cardiovascular events in a meta‐analysis of three cohort studies in high risk patients. Nutr Metab Cardiovasc Dis. 2015;25:1087–1094. doi: 10.1016/j.numecd.2015.08.004 [DOI] [PubMed] [Google Scholar]
- 31. Voruganti VS, Laston S, Haack K, Mehta NR, Cole SA, Butte NF, Comuzzie AG. Serum uric acid concentrations and SLC2A9 genetic variation in hispanic children: the viva la familia study. Am J Clin Nutr. 2015;101:725–732. doi: 10.3945/ajcn.114.095364 [DOI] [PMC free article] [PubMed] [Google Scholar]
- 32. Caulfield MJ, Munroe PB, O'Neill D, Witkowska K, Charchar FJ, Doblado M, Evans S, Eyheramendy S, Onipinla A, Howard P, et al. SLC2A9 is a high‐capacity urate transporter in humans. PLoS Medicine. 2008;5:e197. doi: 10.1371/journal.pmed.0050197 [DOI] [PMC free article] [PubMed] [Google Scholar]
- 33. Macias‐Kauffer LR, Villamil‐Ramírez H, León‐Mimila P, Jacobo‐Albavera L, Posadas‐Romero C, Posadas‐Sánchez R, López‐Contreras BE, Morán‐Ramos S, Romero‐Hidalgo S, Acuña‐Alonzo V, et al. Genetic contributors to serum uric acid levels in Mexicans and their effect on premature coronary artery disease. Int J Cardiol. 2019;279:168–173. doi: 10.1016/j.ijcard.2018.09.107 [DOI] [PubMed] [Google Scholar]
- 34. Ferreira JP, Girerd N, Bozec E, Mercklé L, Pizard A, Bouali S, Eby E, Leroy C, Machu J‐L, Boivin J‐M, et al. Cohort profile: rationale and design of the fourth visit of the stanislas cohort: a familial longitudinal population‐based cohort from the nancy region of france. Int J Epidemiol. 2018;47:395–395j. doi: 10.1093/ije/dyx240 [DOI] [PubMed] [Google Scholar]
- 35. Kanbay M, Girerd N, Machu JL, Bozec E, Duarte K, Boivin JM, Wagner S, Ferreira JP, Zannad F, Rossignol P. Impact of uric acid on hypertension occurrence and target organ damage: insights from the stanislas cohort with a 20‐year follow‐up. Am J Hypertens. 2020;33:869–878. doi: 10.1093/ajh/hpaa030 [DOI] [PubMed] [Google Scholar]
- 36. Levey AS, Stevens LA, Schmid CH, Zhang Y, Castro AF, Feldman HI, Kusek JW, Eggers P, Van Lente F, Greene T, et al; CKD‐EPI (Chronic Kidney Disease Epidemiology Collaboration). A new equation to estimate glomerular filtration rate. Ann Intern Med. 2009;150:604–612. doi: 10.7326/0003-4819-150-9-200905050-00006 [DOI] [PMC free article] [PubMed] [Google Scholar]
- 37. Xhaard C, Dandine‐Roulland C, Villemereuil PD, Floch EL, Bacq‐Daian D, Machu J‐L, Ferreira JP, Deleuze J‐F, Zannad F, Rossignol P, et al. Heritability of a resting heart rate in a 20‐year follow‐up family cohort with gwas data: insights from the stanislas cohort. Eur J Prev Cardiol. 2019;2047487319890763. doi: 10.1177/2047487319890763 [DOI] [PubMed] [Google Scholar]
- 38. Dandine CPH. Manipulation of genetic data (SNPS). Computation of grm and dominance matrix, ld, heritability with efficient algorithms for linear mixed model (aireml). Hum Hered, In 46th European Mathematical Genetics Meeting (EMGM) 2018, Cagliari, Italy. 2018:1‐29
- 39. Ndrepepa G. Uric acid and cardiovascular disease. Clin Chim Acta. 2018;484:150–163. doi: 10.1016/j.cca.2018.05.046 [DOI] [PubMed] [Google Scholar]
- 40. Kanbay M, Siriopol D, Nistor I, Elcioglu OC, Telci O, Takir M, Johnson RJ, Covic A. Effects of allopurinol on endothelial dysfunction: a meta‐analysis. Am J Nephrol. 2014;39:348–356. doi: 10.1159/000360609 [DOI] [PubMed] [Google Scholar]
- 41. Szwejkowski BR, Gandy SJ, Rekhraj S, Houston JG, Lang CC, Morris AD, George J, Struthers AD. Allopurinol reduces left ventricular mass in patients with type 2 diabetes and left ventricular hypertrophy. J Am Coll Cardiol. 2013;62:2284–2293. doi: 10.1016/j.jacc.2013.07.074 [DOI] [PubMed] [Google Scholar]
- 42. Merriman TR. An update on the genetic architecture of hyperuricemia and gout. Arthritis Res Ther. 2015;17:98. doi: 10.1186/s13075-015-0609-2 [DOI] [PMC free article] [PubMed] [Google Scholar]
- 43. Kawamura Y, Nakaoka H, Nakayama A, Okada Y, Yamamoto K, Higashino T, Sakiyama M, Shimizu T, Ooyama H, Ooyama K, et al. Genome‐wide association study revealed novel loci which aggravate asymptomatic hyperuricaemia into gout. Ann Rheum Dis. 2019;78:1430–1437. doi: 10.1136/annrheumdis-2019-215521 [DOI] [PMC free article] [PubMed] [Google Scholar]
- 44. Zhang XU, Yang X, Wang M, Li X, Xia Q, Xu S, Xu J, Cai G, Wang LI, Xin L, et al. Association between SLC2A9 (GLUT9) gene polymorphisms and gout susceptibility: an updated meta‐analysis. Rheumatol Int. 2016;36:1157–1165. doi: 10.1007/s00296-016-3503-6 [DOI] [PubMed] [Google Scholar]
- 45. McArdle PF, Parsa A, Chang Y‐PC, Weir MR, O'Connell JR, Mitchell BD, Shuldiner AR. Association of a common nonsynonymous variant in glut9 with serum uric acid levels in old order amish. Arthritis Rheum. 2008;58:2874–2881. doi: 10.1002/art.23752 [DOI] [PMC free article] [PubMed] [Google Scholar]
- 46. Cupples LA, Arruda HT, Benjamin EJ, D'Agostino RB, Demissie S, DeStefano AL, Dupuis J, Falls KM, Fox CS, Gottlieb DJ, et al. The Framingham heart study 100K SNP genome‐wide association study resource: overview of 17 phenotype working group reports. BMC Med Genet. 2007;8(suppl 1):S1. doi: 10.1186/1471-2350-8-S1-S1 [DOI] [PMC free article] [PubMed] [Google Scholar]
- 47. Parsa A, Brown E, Weir MR, Fink JC, Shuldiner AR, Mitchell BD, McArdle PF. Genotype‐based changes in serum uric acid affect blood pressure. Kidney Int. 2012;81:502–507. doi: 10.1038/ki.2011.414 [DOI] [PMC free article] [PubMed] [Google Scholar]
- 48. Testa A, Mallamaci F, Spoto B, Pisano A, Sanguedolce MC, Tripepi G, Leonardis D, Zoccali C. Association of a polymorphism in a gene encoding a urate transporter with CKD progression. Clin J Am Soc Nephrol. 2014;9:1059–1065. doi: 10.2215/CJN.11041013 [DOI] [PMC free article] [PubMed] [Google Scholar]
- 49. Palmer TM, Nordestgaard BG, Benn M, Tybjærg‐Hansen A, Davey Smith G, Lawlor DA, Timpson NJ. Association of plasma uric acid with ischaemic heart disease and blood pressure: Mendelian randomisation analysis of two large cohorts. BMJ. 2013;347:f4262. doi: 10.1136/bmj.f4262 [DOI] [PMC free article] [PubMed] [Google Scholar]
- 50. Keenan T, Zhao W, Rasheed A, Ho WK, Malik R, Felix JF, Young R, Shah N, Samuel M, Sheikh N, et al. Causal assessment of serum urate levels in cardiometabolic diseases through a Mendelian randomization study. J Am Coll Cardiol. 2016;67:407–416. doi: 10.1016/j.jacc.2015.10.086 [DOI] [PMC free article] [PubMed] [Google Scholar]
- 51. Efstathiadou A, Gill D, McGrane F, Quinn T, Dawson J. Genetically determined uric acid and the risk of cardiovascular and neurovascular diseases: a Mendelian randomization study of outcomes investigated in randomized trials. J Am Heart Assoc. 2019;8:e012738. doi: 10.1161/JAHA.119.012738 [DOI] [PMC free article] [PubMed] [Google Scholar]
- 52. White J, Sofat R, Hemani G, Shah T, Engmann J, Dale C, Shah S, Kruger FA, Giambartolomei C, Swerdlow DI, et al. Plasma urate concentration and risk of coronary heart disease: a Mendelian randomisation analysis. Lancet Diabetes Endocrinol. 2016;4:327–336. doi: 10.1016/S2213-8587(15)00386-1 [DOI] [PMC free article] [PubMed] [Google Scholar]
- 53. Preitner F, Pimentel A, Metref S, Berthonneche C, Sarre A, Moret C, Rotman S, Centeno G, Firsov D, Thorens B. No development of hypertension in the hyperuricemic liver‐glut9 knockout mouse. Kidney Int. 2015;87:940–947. doi: 10.1038/ki.2014.385 [DOI] [PubMed] [Google Scholar]
- 54. Bo S, Cavallo‐Perin P, Gentile L, Repetti E, Pagano G. Hypouricemia and hyperuricemia in type 2 diabetes: two different phenotypes. Eur J Clin Invest. 2001;31:318–321. doi: 10.1046/j.1365-2362.2001.00812.x [DOI] [PubMed] [Google Scholar]
- 55. Shichiri M, Iwamoto H, Marumo F. Diabetic hypouricemia as an indicator of clinical nephropathy. Am J Nephrol. 1990;10:115–122. doi: 10.1159/000168065 [DOI] [PubMed] [Google Scholar]
- 56. Li X, Meng X, He Y, Spiliopoulou A, Timofeeva M, Wei W‐Q, Gifford A, Yang T, Varley T, Tzoulaki I, et al. Genetically determined serum urate levels and cardiovascular and other diseases in UK biobank cohort: a phenome‐wide Mendelian randomization study. PLoS Medicine. 2019;16:e1002937. doi: 10.1371/journal.pmed.1002937 [DOI] [PMC free article] [PubMed] [Google Scholar]