

Abstract
Background
Epidemiological studies show that women are generally at lower risk for cardiovascular disease than men. Here, we investigated the sex‐specific differential effect of genetically increased low‐density lipoprotein cholesterol (LDL‐C) on cardiovascular disease (CVD) and other lipid‐associated diseases.
Methods and Results
This is a 2‐sample Mendelian randomization study that uses individual participant data from 425 043 participants from the UK Biobank, including 229 279 female participants. An 80‐variant LDL‐C weighted genetic score was generated. Linear and logistic regression models with interactions were used to identify differences between sex‐specific LDL‐C effects on lipids, carotid‐intima media thickness, and multiple cardiovascular outcomes such as CVD, ischemic heart disease, peripheral artery disease, heart failure, aortic valve disease, type 2 diabetes, atrial fibrillation, and aortic aneurysm and dissection. After correction for multiple testing, we observed that the genetically increased LDL‐C effect on CVD events was sex specific: per SD genetically increased LDL‐C, female participants had a higher LDL‐C increase but an attenuated CVD risk increase compared with male participants (LDL‐C: female participants 0.71 mmol/L, 95% CI, 0.70–0.72 and male participants 0.57 mmol/L, 95% CI, 0.56–0.59. P for interaction: 5.03×10−60; CVD: female participants: odds ratio [OR], 1.32; 95% CI 1.24–1.40 and male participants: OR, 1.52; 95% CI, 1.46–1.58. P for interaction: 9.88×10⁻⁵). We also observed attenuated risks for ischemic heart disease and (nominally for) heart failure in female participants, and genetically increased LDL‐C results in higher risk for aortic valve disease in female participants compared with male participants. Genetically increased LDL‐C was also associated with an attenuated carotid‐intima media thickness increase in female participants. We did not observe other significant attenuations. Sensitivity analyses with an unweighted genetic score and sex‐specific weighted genetic scores showed similar results.
Conclusions
We found that genetically increased LDL‐C has a sex‐specific differential effect on the risk for cardiovascular disease, ischemic heart disease, heart failure, and aortic valve stenosis. Our observations provide evidence that LDL‐C might be a less important determinant of CVD in women compared with men, suggesting that male patients might benefit more from LDL‐C targeted therapies for CVD management than female patients and warranting investigations into the sex‐specific relative contribution of risk factors for CVD.
Keywords: cardiovascular disease, genetics, risk factor, sex‐differences
Subject Categories: Atherosclerosis; Atrial Fibrillation; Big Data and Data Standards; Cardiovascular Disease; Coronary Artery Disease; Diabetes, Type 2; Epidemiology; Genetics; Heart Failure; Ischemia; Lipids and Cholesterol; Myocardial Infarction; Precision Medicine; Risk Factors; Valvular Heart Disease; Women
Nonstandard Abbreviations and Acronyms
- AVS
aortic valve stenosis
- cIMT
carotic intima media thickness
- CTT
Cholesterol Treatment Trialists’ Collaboration
- MR
Mendelian randomization
Clinical Perspective
What Is New?
Observational data have shown that female patients are at lower risk for cardiovascular disease than male patients.
Using Mendelian randomization in the UK Biobank, we observe that the causal effect of low‐density lipoprotein cholesterol on cardiovascular disease is stronger in male than in female participants.
We also observed that the causal effect of low‐density lipoprotein cholesterol on aortic valve stenosis is stronger in female than in male participants.
What Are the Clinical Implications?
Our observations warrant more research into the sex‐specific attributions of risk factors for cardiovascular and related diseases.
Male patients might benefit more from low‐density lipoprotein cholesterol targeted therapies than female patients.
Sex‐differential effects should be taken into account in the design of clinical trials.
Cardiovascular disease (CVD) remains a major cause of morbidity and mortality, 1 and lowering plasma concentrations of low‐density lipoprotein cholesterol (LDL‐C) is the cornerstone in CVD prevention, irrespective of the sex of the patient at risk. Observational data have shown, however, that women are at lower risk for CVD than men. 2
The sex differential CVD risk, along with underrepresentation of female participants in major cardiovascular trials, has spurred a debate about the mechanisms of optimal cardiovascular risk reduction in women and men. 3 , 4 This is supported by a recent meta‐analysis of 27 randomized clinical trials, reporting significant heterogeneity between men and women in the effect of statins (compared with placebo) to prevent a first CVD event (rate ratio [RR] for men: 0.72 per 1 mmol/L decrease in LDL‐C; 95% CI, 0.67–0.77; RR for women: 0.85; 95% CI, 0.75–0.96, interaction P value=0.02). 5
To evaluate the presence of a sex‐dependent difference in the effect of LDL‐C in the risk for CVD, we used Mendelian randomization (MR), which uses naturally occurring genetic variation to investigate the causal effect of an exposure on an outcome and has previously been used to explore the causal relation between LDL‐C and CVD. 6 , 7 Here we apply MR to explore the potential sex‐differential CVD‐effects of increased LDL‐C concentration, leveraging an LDL‐C genetic score. We additionally consider effects on specific cardiometabolic traits such as intermediate phenotype carotid intima media thickness (cIMT), aortic valve stenosis (AVS), atrial fibrillation, heart failure (HF), aortic aneurysm and dissection, and type 2 diabetes.
Methods
Design, Data Sources, and Study Participants
The data sets used for this study are available upon approval from the UK Biobank consortium. The scripts used to analyze the data are deposited on https://github.com/arjencupido/Sex‐differential‐effect‐LDLC. We used a 2‐sample MR approach using both summary data (the first sample) and individual participant data from the UK Biobank (the second sample) to assess the effect of an externally weighted LDL‐C genetic instrument on a range of clinical outcomes (including LDL‐C as a positive control), stratified for sex. Similar MR studies using both summary and individual participant data have been described before, 6 , 8 and MR methods using individual participant data have been shown to provide similar estimates as 2‐sample MR analyses using summary data. 9 , 10 We used summary data from a genome‐wide association study (GWAS) on LDL‐C in up to 188 577 participants from the Global Lipid Genetics Consortium. 11 The design of the UK Biobank study has been described elsewhere 12 ; all participants provided written consent and the UK Biobank has gained study approval from the North West Multi‐centre Research Ethics Committee. This research has been conducted under Application Number 44 972. We included participants who self‐identified as being from a White British, White Irish, or other White background. We excluded participants that were more than third degree related (kinship coefficient >0.0844). Sex was defined as genetically reported male (XY) and female (XX), and we excluded participants with discordant genetically determined sex and self‐reported sex. We will further report our results using the biological terms male and female. 13 Genotyping was performed using the Affymetrix UK BiLEVE Axiom array or the Affymetrix UK Biobank Axiom array. Anthropometric markers and biomarkers were collected at the baseline visit.
Selection of Genetic Variants and Construction of Instruments
To prevent Winner’s curse and weak instrument bias, genetic variants were identified based on external GWAS data on LDL‐C from the Global Lipid Genetics Consortium; selecting all common (minor allele frequency >0.01) independent (R2<0.001; using 25 000 participants from the UK Biobank as reference sample) genetic variants associated with LDL‐C with a P value <5×10⁻⁸ (Table S1). 11 We calculated genetic scores for each participant of the UK Biobank cohort by summing the number of LDL‐C increasing alleles a participant has, weighed by the effect that specific allele has on LDL‐C levels as found by the Global Lipid Genetics Consortium GWAS. Because the original LDL‐C GWAS was conducted in a cohort with both male and female participants, we also constructed an unweighted score with these single‐nucleotide polymorphisms and we constructed additional weighted scores where we extracted male‐ and female‐specific estimates for these single‐nucleotide polymorphisms from a UK Biobank GWAS. 14
Outcomes
We investigated the effects of genetically increased LDL‐C levels on the following individual CVD end points: first occurrence of CVD (which is a composite of the first occurrence of either a prevalent or incident event of ischemic heart disease, death due to ischemic heart disease, a coronary intervention procedure, as well as the UK Biobank definition of ischemic stroke), all the subcomponents of the CVD composite, peripheral artery disease, AVS, atrial fibrillation, HF, aortic aneurysm and dissection, and type 2 diabetes. These outcomes are defined by International Classification of Diseases, Tenth Revision (ICD‐10) codes, International Classification of Diseases, Ninth Revision (ICD‐9) codes, procedure codes, and self‐report (Table S2). Finally, we also investigated the effects of our genetic score on a subset of up to 41 025 patients who underwent a carotid ultrasound following a standardized protocol. 15 We used the mean cIMT on 4 different angles (120, 150, 210, 240 degrees) in our analysis, as well as the pooled average of the mean cIMT of the 4 angles.
Statistical Analysis
The effects of the genetic instruments on continuous markers such as LDL‐C and cIMT were assessed by linear regression, and the effects of the genetic instruments on clinical outcome were assessed by logistic regression. All analyses accounted for age and for sex in both conventional and interaction analyses. A 1‐unit increase in the genetic instrument represents an SD genetically increased LDL‐C, as reported by the Global Lipid Genetics Consortium, which we will also refer to as “genetically increased LDL‐C.” 11 To illustrate the directional concordance of our data with data from clinical trials, we used the genetic score to dichotomize each sex group by the median of the genetic score for each sex. This approach (sometimes called “Nature’s randomized trial”) creates 2 groups randomized by their (approximately randomly inherited) allele distribution, which is similar to the procedure used in a randomized clinical trial. 16 We then measured the differences in baseline characteristics and specifically LDL‐C levels between these groups, as well as the difference in the first occurrence of CVD. We then standardized the effects of our randomization scheme toward the risk on major cardiovascular events per 1 mmol/L reduction in LDL‐C, by dividing the effects of our genetic instrument on CVD by the effects of our genetic instrument on LDL‐C, 17 and calculated heterogeneity statistics between male and female participants using the meta package. 18 Because there is a possibility that the weights from the initial GWAS are driven by sex‐specific factors, we performed sensitivity analyses: First, we used unweighted instruments in interaction analyses. Second, we calculated male‐ and female‐specific weighted genetic scores for each group and calculated heterogeneity statistics. Finally, to investigate potential pleiotropy, we performed leave‐one‐out analyses where we iteratively excluded 1 genetic variant from our genetic instrument and estimated the interaction of the LDL‐C genetic instrument with sex on CVD. A nominal P value of 0.05 was used as threshold for statistical significance, and in case of the 11 end points, we considered a P value below 4.54×10⁻³ (0.05 divided by 11) to be the multiple testing corrected level of significance. The analyses were performed using R v4.0.3. 19 Genetic variants in the UK Biobank were extracted from the BGEN files using Rbgen. 20 The plots were made using the ggplot2 21 package and the meta package. 18
Results
Description of UK Biobank Cohort
We included a total of 425 043 participants in the study, of whom 229 279 were female (54.3%). Demographic characteristics stratified for sex are listed in Table 1. A total of 39 032 participants suffered from a first CVD event; 11 620 of these events occurred in female participants (5.1%), and 27 412 (14.0%) in male participants. When each sex group was stratified based on the median of the weighted genetic instrument, potential confounding cardiovascular risk factors were similarly distributed within the 2 dichotomized groups for each sex (Table 2).
Table 1.
Baseline Values Stratified for Sex
| Female participants | Male participants | P value | |
|---|---|---|---|
| n | 229 279 | 195 764 | |
| Age at baseline, y, median [IQR] | 58.00 [51.00, 63.00] | 59.00 [51.00, 64.00] | <0.001 |
| Total cholesterol, mmol/L (median [IQR]) | 5.84 [5.12, 6.61] | 5.47 [4.72, 6.23] | <0.001 |
| LDL‐C, mmol/L (median [IQR]) | 3.58 [3.02, 4.19] | 3.46 [2.88, 4.05] | <0.001 |
| High‐density lipoprotein cholesterol mmol/L (median [IQR]) | 1.56 [1.33, 1.83] | 1.24 [1.07, 1.45] | <0.001 |
| Triglycerides, mmol/L (median [IQR]) | 1.34 [0.97, 1.90] | 1.70 [1.19, 2.45] | <0.001 |
| Apolipoprotein B, g/L (median [IQR]) | 1.02 [0.87, 1.19] | 1.02 [0.86, 1.18] | <0.001 |
| Apolipoprotein A1, g/L (median [IQR]) | 1.62 [1.45, 1.79] | 1.41 [1.27, 1.56] | <0.001 |
| Lipoprotein(a), nmol/L (median [IQR]) | 21.30 [9.73, 59.81] | 19.00 [9.00, 60.00] | <0.001 |
| Systolic blood pressure, mm/Hg (median [IQR]) | 135.00 [123.00, 150.00] | 141.00 [130.00, 154.00] | <0.001 |
| Diastolic blood pressure, mm/Hg (median [IQR]) | 80.00 [73.00, 87.00] | 84.00 [77.00, 91.00] | <0.001 |
| Average mean carotid intima media thickness, µm (median [IQR]) | 649.75 [585.50, 729.50] | 694.75 [611.25, 794.50] | <0.001 |
| Body mass index, kg/m² (median [IQR]) | 26.05 [23.41, 29.62] | 27.32 [25.00, 30.07] | <0.001 |
| Smoking status, % | <0.001 | ||
| Never smoked | 133 833 (58.6) | 94 591 (48.5) | |
| Former smoking | 74 190 (32.5) | 76 665 (39.3) | |
| Current smoking | 20 471 (9.0) | 23 829 (12.2) | |
| Townsend deprivation index (median [IQR]) | −2.27 [−3.70, 0.18] | −2.26 [−3.71, 0.33] | <0.001 |
| Education score (median [IQR]) | 7.99 [2.57, 18.72] | 8.42 [2.76, 19.91] | <0.001 |
| Lipid‐lowering therapy, % | 28 773 (12.5) | 44 870 (22.9) | <0.001 |
| Cardiovascular disease, % | 11 620 (5.1) | 27 412 (14.0) | <0.001 |
| Diabetes, % | 7454 (3.3) | 13 670 (7.0) | <0.001 |
| Weighted LDL‐C score (median [IQR]) | 6.64 [6.42, 6.84] | 6.64 [6.42, 6.84] | 0.035 |
| Unweighted LDL‐C score (median [IQR]) | 82.00 [79.00, 86.00] | 82.00 [79.00, 86.00] | 0.005 |
This table outlines differences in clinical parameters stratified by biological sex, at the baseline visit.
Townsend deprivation index is a measure of material deprivation. Education score is a measure of educational deprivation. IQR indicates interquartile range; and LDL‐C, Low‐density lipoprotein cholesterol.
Table 2.
Baseline Table for Male and Female Participants, Stratified by the Median of the LDL‐C Increasing Genetic Instrument
| Female participants | Male participants | |||||
|---|---|---|---|---|---|---|
| < Median LDL‐C score | > Median LDL‐C score | P value | < Median LDL‐C score | > Median LDL‐C score | P value | |
| No. | 114 650 | 114 629 | 97 897 | 97 867 | ||
| Age, years (median [IQR]) | 58.00 [51.00, 63.00] | 58.00 [51.00, 63.00] | 0.404 | 59.00 [51.00, 64.00] | 59.00 [51.00, 64.00] | 0.618 |
| Total cholesterol, mmol/L (median [IQR]) | 5.64 [4.96, 6.36] | 6.06 [5.30, 6.84] | <0.001 | 5.30 [4.61, 6.01] | 5.66 [4.85, 6.44] | <0.001 |
| LDL‐C, mmol/L (median [IQR]) | 3.41 [2.89, 3.98] | 3.77 [3.18, 4.39] | <0.001 | 3.33 [2.79, 3.87] | 3.62 [2.99, 4.23] | <0.001 |
| HDL‐C, mmol/L (median [IQR]) | 1.57 [1.33, 1.83] | 1.56 [1.33, 1.82] | <0.001 | 1.24 [1.07, 1.46] | 1.24 [1.06, 1.45] | <0.001 |
| Triglycerides, mmol/L (median [IQR]) | 1.31 [0.95, 1.87] | 1.37 [0.99, 1.93] | <0.001 | 1.67 [1.16, 2.40] | 1.73 [1.21, 2.50] | <0.001 |
| ApoB, g/L (median [IQR]) | 0.97 [0.83, 1.13] | 1.07 [0.92, 1.24] | <0.001 | 0.97 [0.83, 1.13] | 1.06 [0.90, 1.23] | <0.001 |
| ApoA, g/L (median [IQR]) | 1.62 [1.46, 1.80] | 1.61 [1.45, 1.79] | <0.001 | 1.42 [1.28, 1.57] | 1.40 [1.27, 1.56] | <0.001 |
| Lp(a), nmol/L (median [IQR]) | 19.95 [9.40, 58.16] | 22.84 [10.20, 61.40] | <0.001 | 17.80 [8.61, 58.50] | 20.20 [9.39, 61.44] | <0.001 |
| Systolic blood pressure, mm/Hg (median [IQR]) | 135.00 [122.00, 150.00] | 135.00 [123.00, 150.00] | 0.011 | 141.00 [130.00, 154.00] | 141.00 [130.00, 154.00] | 0.769 |
| Diastolic blood pressure, mm/Hg (median [IQR]) | 80.00 [73.00, 88.00] | 80.00 [73.00, 87.00] | 0.019 | 84.00 [77.00, 91.00] | 84.00 [77.00, 91.00] | <0.001 |
| Average mean carotid intima media thickness, µm (median [IQR]) | 647.50 [585.00, 724.00] | 652.50 [586.06, 735.50] | 0.001 | 689.25 [610.00, 788.19] | 701.25 [613.00, 800.75] | <0.001 |
| BMI, kg/m2 (median [IQR]) | 26.10 [23.44, 29.68] | 26.01 [23.38, 29.55] | <0.001 | 27.36 [25.04, 30.13] | 27.28 [24.96, 30.01] | <0.001 |
| Smoking Status (%) | 0.018 | 0.494 | ||||
| Never smoked | 66 740 (58.4) | 67 093 (58.7) | 47 181 (48.4) | 47 410 (48.6) | ||
| Former smoking | 37 057 (32.4) | 37 133 (32.5) | 38 456 (39.4) | 38 209 (39.2) | ||
| Current smoking | 10 426 (9.1) | 10 045 (8.8) | 11 936 (12.2) | 11 893 (12.2) | ||
| Townsend deprivation index (median [IQR]) | −2.28 [−3.70, 0.17] | −2.27 [−3.70, 0.19] | 0.597 | −2.27 [−3.71, 0.33] | −2.26 [−3.71, 0.33] | 0.781 |
| Education score (median [IQR]) | 8.02 [2.59, 18.76] | 7.93 [2.56, 18.66] | 0.27 | 8.43 [2.74, 19.99] | 8.41 [2.77, 19.82] | 0.807 |
| Lipid lowering therapy (%) | 11 628 (10.1) | 17 145 (15.0) | <0.001 | 18 753 (19.2) | 26 117 (26.7) | <0.001 |
| CVD (%) | 5447 (4.8) | 6173 (5.4) | <0.001 | 12 585 (12.9) | 14 827 (15.2) | <0.001 |
| Diabetes (%) | 3767 (3.3) | 3687 (3.2) | 0.356 | 6973 (7.1) | 6697 (6.8) | 0.016 |
| Weighted LDL‐C score (median [IQR]) | 6.42 [6.25, 6.54] | 6.84 [6.74, 6.97] | <0.001 | 6.42 [6.24, 6.54] | 6.84 [6.74, 6.97] | <0.001 |
| Unweighted LDL‐C score (median [IQR]) | 79.00 [76.00, 82.00] | 85.00 [83.00, 88.00] | <0.001 | 79.00 [76.00, 82.00] | 85.00 [82.00, 88.00] | <0.001 |
This table outlines differences in clinical parameters stratified by biological sex and after dividing each sex into groups with the weighted genetic LDL‐C score below and above the median, at the baseline visit.
Townsend deprivation index is a measure of material deprivation. Education score is a measure of educational deprivation. ApoA1 indicates apolipoprotein A1; ApoB, apolipoprotein B; BMI, body mass index; CVD, cardiovascular disease; HDL‐C, high‐density lipoprotein cholesterol; LDL‐C, Low‐density lipoprotein cholesterol; and Lp(a), lipoprotein (a).
Distribution of Genetic Instrument and Effect on LDL‐C and CVD
A total of 80 independent genetic variants that were associated with LDL‐C at genome‐wide significance level were used to generate the genetic instrument (Table S1). The median weighted genetic instrument for both female and male participants was 6.64 (interquartile range 6.42; 6.84, P for difference 0.035) and the unweighted instrument was 82 (interquartile range 79; 86, P for difference 0.005, Figure 1B, Table 1). Using the entire cohort, the weighted LDL‐C genetic instrument was strongly associated with LDL‐C (0.65 mmol/L, 95% CI, 0.64–0.65 mmol/L). The LDL‐C instrument was highly associated with CVD in all participants (OR, 1.45; 95% CI 1.40–1.50).
Figure 1. Genetic instrument distribution and effect on lipids and CVD, stratified for sex.
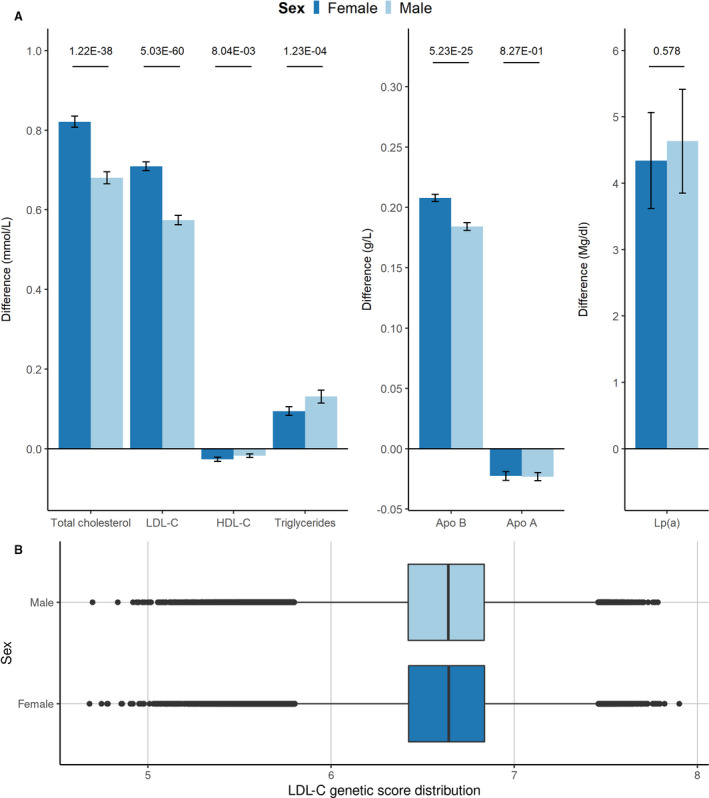
A, difference in lipids due to 1 SD genetically increased LDL‐C in female participants and in male participants, with 95% CIs. Values on the top represent P value for interaction. B, Boxplot summarizing the distribution of the genetic instrument in the cohort (in median and interquartile range), stratified for female and male participants. ApoA indicates apolipoprotein A; ApoB, apolipoprotein B; CVD, cardiovascular disease; HDL‐C, high‐density lipoprotein cholesterol; LDL‐C, low‐density lipoprotein cholesterol; and Lp(a), lipoprotein(a).
Effect of Genetically Increased LDL‐C on CVD Is Different in Female Participants Compared With Male Participants
We observed significant interactions between our genetic instrument and sex for all lipid traits except for lipoprotein(a) and apolipoprotein A1 (apoA1) (Figure 1A, Table S3). LDL‐C levels of female participants increased with ≈0.13 mmol/L more than for male participants per 1 SD genetically increased LDL‐C (female participants 0.71, 95% CI, 0.70–0.72; male participants 0.57 mmol/L, 95% CI, 0.56–0.59; P for interaction: 5.03×10−60). To account for potential mediation by lipid‐lowering therapy, we corrected LDL‐C concentration in patients receiving lipid‐lowering therapy by dividing their LDL‐C by 0.68, which is in accordance with a previously described method. 22 The difference between men and women remained significantly different (0.05 mmol/L difference, P for interaction: 1.95×10⁻⁹, Table S4). In contrast, the increased odds for CVD were lower for female participants than for male participants, per 1 SD genetically increased LDL‐C (female participants: OR, 1.32; 95% CI, 1.24–1.40; male participants: OR, 1.52; 95% CI, 1.46–1.58; P for interaction: 9.88×10⁻⁵, Figure 2). We observed sex‐specific differential effects in the association of genetically increased LDL‐C with the first occurrences of ischemic heart disease (female participants: OR, 1.34; 95% CI, 1.26–1.44; male participants: OR, 1.60; 95% CI, 1.53–1.68; P for interaction 7.99×10⁻⁶), HF (female participants: OR, 1.08; 95% CI, 0.95–1.22; male participants: OR, 1.29; 95% CI, 1.19–1.41; P for interaction 1.54×10⁻²), and AVS (female participants: OR, 2.09; 95% CI, 1.68–2.61; male participants: OR, 1.42; 95% CI, 1.22–1.66; P for interaction 4.48×10⁻³, all interaction estimates can be found in Table S3). After correcting for multiple testing, all effects remained significant, except for the effect on HF. We did not observe sex‐specific differential effects for the outcomes ischemic stroke, death due to ischemic stroke, coronary interventions, peripheral artery disease, atrial fibrillation, aortic aneurysm and dissection and type 2 diabetes.
Figure 2. The effects of an SD genetically increased LDL‐C on clinical outcome, stratified for sex.
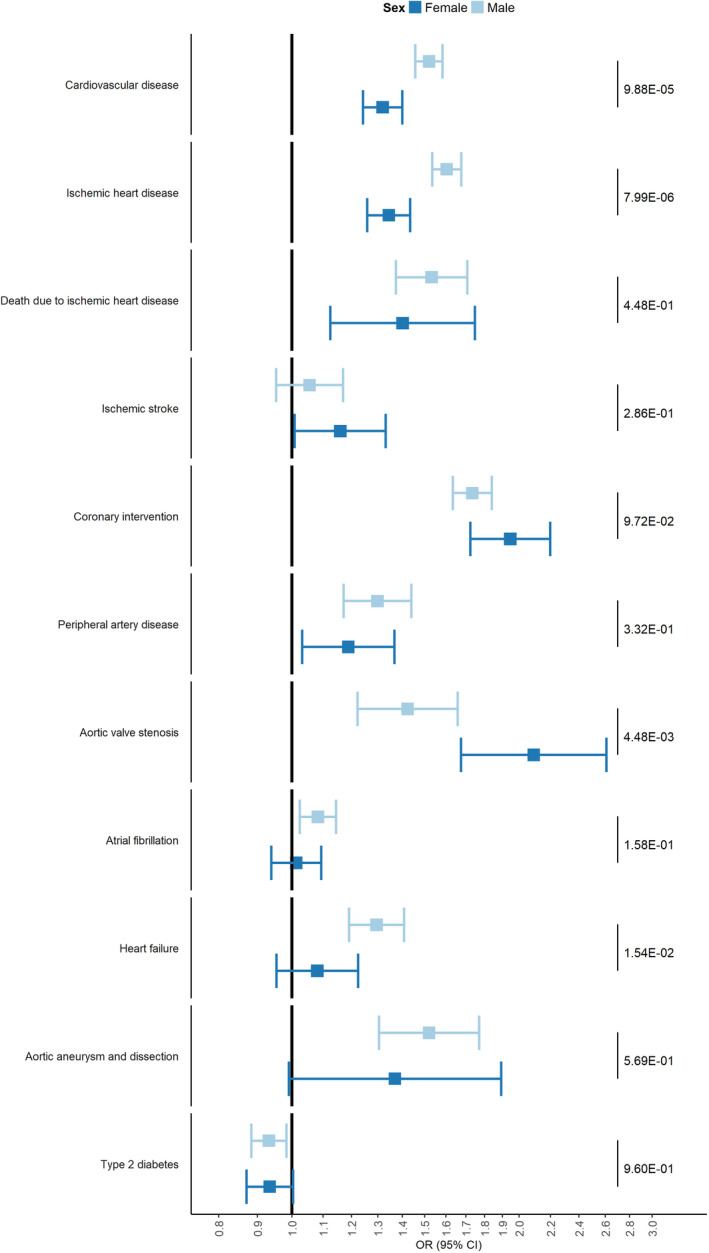
Forest plot with odds ratios per 1 SD genetically increased LDL‐C for CVD, its subcomponents and other cardiovascular outcome, stratified for female participants and male participants. Values on the right side of the panel represent P values for interaction. LDL‐C indicates low‐density lipoprotein cholesterol; and OR, odds ratio.
Effect of Genetically Increased LDL‐C on Carotid Intima Media Thickness Is Different in Female Participants Compared With Male Participants
Our genetic instrument was significantly associated with mean cIMT in both male and female participants, but the mean increase in the pooled cIMT measurements, per 1 SD genetically increased LDL‐C increase, was smaller in female participants compared with male participants (female participants: 11.8 µm, 95% CI, 7.5–16.0 µm; male participants: 22.3 µm, 95% CI, 16.8–27.8 µm; P for interaction 2.90×10⁻³). The interaction terms for all 4 ultrasound angles were significant (Figure 3).
Figure 3. Effect of 1 SD genetically increased LDL‐C on mean IMT.
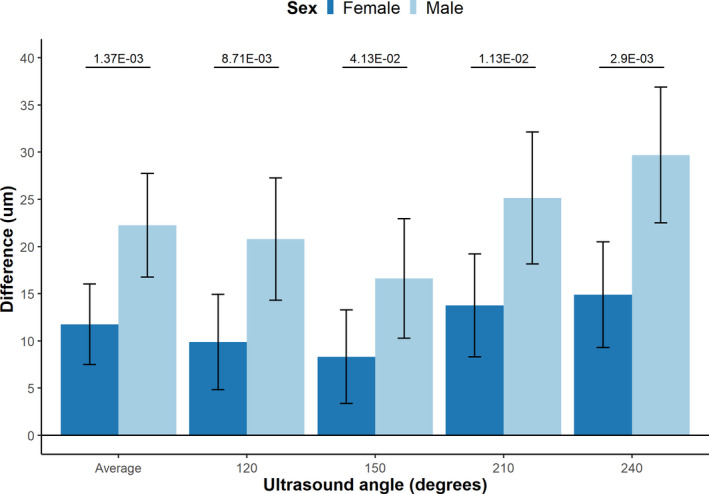
Bar plot comparing the difference in mean carotid intima media thickness (cIMT) between male and female participants per 1 SD genetically increased LDL‐C, Including 95% CI. Values on the top represent P‐value for interaction. LDL‐C indicates low‐density lipoprotein cholesterol.
Sensitivity Analyses Confirm the Observed Interactions Between Genetically Increased LDL‐C and Sex
We performed sensitivity analyses using an unweighted instrument to determine to what extent the sex‐averaged LDL‐C weights influenced the previously presented analyses. There was no meaningful difference between the effects, using both an unweighted genetic score and scores using male‐ and female‐specific weights. Most notably, the effects on all clinical outcome measures remained in concordant direction while using the unweighted score, with HF losing nominal significance and AVS being significant after multiple testing (Table S5). Sex‐specific weighted scores showed similar effects compared with the weighted genetic score, with significant heterogeneity for CVD and ischemic heart disease and nominally for HF. Heterogeneity for AVS was suggestive (Table S6). Leave‐one‐out analyses showed that for exclusion of each single‐nucleotide polymorphism, the interaction term of the genetic instrument with sex on CVD remained significant (Table S7, Figure S1). To further assess the issue of multiple testing, we employed a Kolmogorov‐Smirnov test on the 11 interaction P values for each genetic instrument. 23 The P values for these tests were 0.008, 0.003, and 0.0005 for the weighted score, unweighted score, and sex‐specific weighted score, respectively, indicating that the results for each genetic score are unlikely to be driven by false positive results. Finally, a recent GWAS on biological sex reported on the possibility of spurious genetic associations owing to the influence of a trait on sex‐differential participation in population studies. 24 Because there is a possibility that LDL‐C could lead to sex‐differential participation in the UK Biobank, we further investigated this issue. First, we cross‐referenced variants from our genetic instrument with the 160 identified hits in the GWAS of sex. We found 1 variant that was in low linkage with a variant in this GWAS (R2=0.274), whereas all other variants used as instruments in our study were independent from sex‐related variants (R2<0.01). Second, sex‐differential participation bias can be identified through identification of sex‐related discordant genetic allele frequencies. Allele frequencies were highly correlated between male and female participants, both in the entire cohort (correlation coefficient of 1.00), as well as in subgroups with or without CVD (again with correlation coefficient of 1.00 irrespective of CVD status; see Figure S2). Additionally, the mean weighted genetic instrument was not numerically different between the groups (Table 1). Finally, we explored if any of the included genetic variants in our score were directly associated with sex. Three variants were nominally associated with sex at an alpha of 0.05. Excluding these 3 variants from the instrument did not change our results for CVD (female participants: OR, 1.33; 95% CI, 1.25–1.41; male participants: OR, 1.52; 95% CI, 1.45–1.58; P for interaction 3.01×10⁻⁴).
Comparing the Concordance of the Genetic Evidence to Clinical Trial Data
To provide a clinically meaningful illustration and to compare the directional concordance of the genetic estimates with clinical trial data, we next divided each sex group into 2 groups based on the median of the genetic instrument in each group (creating 2 groups randomized by their genetic variation, similar to randomization in a clinical trial) and standardized the difference in CVD risk estimates to a 1 mmol/L reduction in LDL‐C. Baseline values for each group are listed in Table 2. We observed that a lifelong genetically 1 mmol/L reduction in LDL‐C levels was associated with an OR for CVD of 0.69 in female participants (95% CI, 0.62–0.77) and an OR of 0.49 (95% CI, 0.45–0.54) in male participants, with significant heterogeneity of the estimates (I2=95.2%, 95% CI, 85.5–98.4%; Q P value=5.5×10⁻⁶, Figure 4). This is directionally concordant with the data previously aggregated by the Cholesterol Treatment Trialists’ Collaboration (CTT, risk ratio [RR] in women: 0.85; 95% CI, 0.75–0.96; RR in men: 0.72; 95% CI, 0.67–0.77; I2=80.2%, 95% CI, 14.9–95.4; Q P value=0.025 5 ). It should be noted that the lifetime effect size observed in this genetic study cannot be compared with the (short‐term) effect size found in clinical trials as aggregated by the CTT.
Figure 4. Visualization of directional concordance of genetic data with clinical trial data.
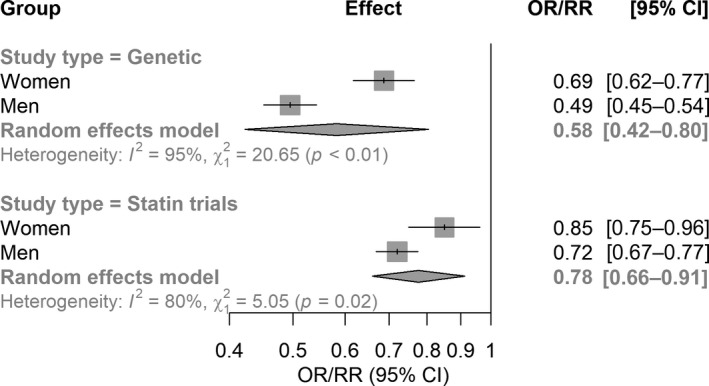
Forest plot illustrating the concordance of the genetic data and statin trial data on the significant difference between male and female participants on the risk ratio (genetic) and rate ratio (statin trials) for cardiovascular events, scaled to 1 mmol/L LDL‐C reduction, as defined by the CTT. The genetic data is based on dichotomization of the genetic risk instrument, effectively creating 2 groups within the separate male and female groups, similar to 2 groups in a clinical trial. CTT indicates Cholesterol Treatment Trialists’ Collaboration; LDL‐C, low‐density lipoprotein cholesterol; OR, odds ratio; and RR, rate ratio.
Discussion
In this study we used MR to investigate sex‐specific differences of the causal association of LDL‐C with the risk for CVD. We observed that the association of genetically increased LDL‐C with the risk for a first cardiovascular event is smaller in female participants compared with male participants. We also observed that genetically increased LDL‐C was associated with a smaller effect in female participants for the cardiovascular suboutcomes ischemic heart disease and HF, whereas genetically increased LDL‐C was associated with a stronger effect on the risk for AVS in female participants. In support of our observations, we found that genetically increased LDL‐C was associated with smaller increases in mean carotid intima media levels in female participants compared with male participants. These results were replicated using unweighted and sex‐specific weighted genetic scores. Together, these results suggest that the causal effect of LDL‐C on cardiovascular risk is attenuated in women compared with men and provide further evidence for causal sex‐specific differences in the pathogenesis of atherosclerosis.
Our results showing that the association of genetically increased LDL‐C on CVD is different between male participants and female participants supports observational evidence that women are at lower risk for CVD. The added value of MR over and above observational epidemiology is that it reduces the impact of potential biases. 9 Our data are in accordance with observations in randomized clinical trials evaluating the effect of LDL‐C lowering by statins on CVD risk. In a recent meta‐analysis of the CTT, a sex‐specific differential effect of statin therapy on the occurrence of a first CVD event was found (Figure 4). 5 Apart from the effect on clinical CVD events, we also observed a differential effect of LDL‐C on arterial wall thickness, as being ascertained by cIMT. Progression of cIMT has been shown to be a predictor of coronary artery disease and can thus function as an intermediate phenotype for atherosclerosis progression. 25
Interestingly, the differential effect on CVD risk found by the CTT is observed only in patients on statins without a known history of CVD, whereas no significant sex difference in clinical outcome was observed in the setting of secondary prevention trials investigating statins, ezetimibe, and PCSK9 inhibitors. 5 , 26 , 27 The severe decrease in sample size by selecting only participants with a primary event would prevent us from testing the hypothesis of the sex‐differential effect of genetically increased LDL‐C in a secondary prevention setting. However, some data on a sex‐specific difference in secondary prevention are available. Among others, a meta‐analysis on all trials with PCSK9 inhibitors reported on a sex‐specific attenuation in the LDL‐C reduction in female patients, 28 and in the CTT meta‐analysis the effects of statins in secondary prevention followed a similar pattern as in primary prevention (RR for male patients, 0.79; 99% CI, 0.76–0.82; RR for female patients, 0.84; 99% CI, 0.77–0.91; P for heterogeneity=0.43). Future studies should investigate this matter, for example through the Genetics of Subsequent Coronary Heart Disease consortium. 29
Our analysis does not provide a mechanistic explanation for the difference in risk. However, there is a vast amount of literature on sex‐differences in pathophysiological processes in atherosclerosis and on the impact of sex hormones on lipid metabolism. 30 Among others, invasive and noninvasive imaging studies have shown that there is a significant sex difference in plaque morphology and anatomy, with male patients having more diffuse eccentric atheroma burden and more frequent thrombotic plaque and ulceration, which suggests that other, maybe non‐LDL‐C‐related risk factors may be more relevant in female patients. 31 , 32 Moreover, sex hormones have been shown to have differential effects on all cell types and many cellular pathways involved in atherosclerosis, including oxidative stress, smooth muscle cell proliferation, increased vasodilation, and macrophage lipid metabolism. 31 , 33 Androgens, for example, have been shown to induce foam cell formation, atherogenic gene expression, and vascular endothelial cell apoptosis, which are processes that might be driven by increased LDL‐C. 31 In turn, studies in cynomolgus macaque monkeys and atherosclerotic mouse models have shown that an ovariectomy in these animals increased plaque burden, which was reversible by estrogen therapy. 32 Sex hormones also have been shown to affect lipoprotein composition, which could result in a differential proatherogenic effect even in the setting of similar cholesterol concentration between male patients and female patients. 30 It is important to note that the results of preclinical models using nonhuman primates, minipigs, rabbits, or mice are conflicting with observations within human studies. Studies on the latter 3 animal models consistently show larger atherosclerotic plaques in females compared with males. 32 However, it has also been shown that plaque burden (determined by morphology and inflammation) instead of plaque size is a more important predictor for CVD. 32 Combined, these data suggest that it is likely the sex‐specific biological response to increased LDL‐C that drives the attenuation observed in this study.
In contrast to the effect on CVD, we observed an increased risk for genetically increased LDL‐C on AVS in female participants compared with male participants. AVS is the most prevalent valvular disease in the world, and it is the most frequent indication for aortic valve replacement. 34 The prevalence is similar between male and female sex, but sex‐related differences have been found for the clinical presentation, progression, and pathophysiology of AVS. 35 High plasma LDL‐C levels have been shown to increase the risk for AVS, and our results support a previous MR study showing that LDL‐C is a causal risk factor for the development of AVS. 36 In addition, a recent study in patients suffering from familial hypercholesterolemia found a 5.71‐fold increase in aortic valve replacements in patients with familial hypercholesterolemia compared with healthy relatives. The study showed a trend toward a lower risk for aortic valve replacement in male patients with familial hypercholesterolemia (HR, 0.56; 95% CI, 0.28–1.11) compared with female patients with familial hypercholesterolemia. 37 It has been suggested that the underlying pathophysiology is different in men and women, which is supported by the finding that in the setting of equal hemodynamic valvular impairment, aortic valves in women were shown to be characterized by less calcification compared with men. 34 , 38 It is possible that, owing to the cumulative effect of LDL‐C, female patients reach the threshold for symptomatic AVS quicker than male patients and that this drives the difference in our study. Other studies found potential differences in the pathophysiology of valvular dysfunction. 34 Among others, it was suggested that fibrosis instead of calcification is a more important contributor to AVS in women, which could indicate a sex‐differential cellular response to LDL‐C instead. Future studies should further investigate the sex‐differential effect of LDL‐C on the pathophysiology of AVS. We also observed nominally significant sex‐specific differences in the risk for HF (which is likely due to the downstream effects of CAD diagnosis), which remained nominally significant in the sensitivity analyses using sex‐specific weighted scores. Although this potential association did not reach significance after multiple testing, we note that a Bonferroni correction as used here is often regarded as being conservative and that many of the included clinical outcomes are phenotypically correlated.
It is of note that multiple lipid classes have been affected by our genetic score, with total cholesterol, high‐density lipoprotein cholesterol, triglycerides, and apolipoprotein B (apoB) also being affected, increasing the risk for horizontal pleiotropy. However, this risk is likely to be limited given the fact that, based on the potentially affected pathways involved, apoB, triglycerides, and total cholesterol changes can be expected for an LDL‐C derived genetic score. It is currently widely accepted that the majority of the CVD risk is mediated through apoB‐containing lipoproteins. Because LDL‐C is the main apoB‐containing lipoprotein, our reported differential cardiovascular effects due to LDL‐C may primarily represent differential cardiovascular effects due to a concentration change in apoB‐containing lipoprotein. 39 , 40 Indeed, we observed a more prominent effect on apoB levels in female participants compared with male participants, which thus further supports our observation that atherogenic lipoproteins have an attenuated effect on CVD in women. The relatively small effect of our score on triglycerides and high‐density lipoprotein cholesterol and no significant difference in the sex‐differential effect on apoA1 are further evidence that the influence of horizontal pleiotropy is likely limited. Further risk on (unobserved) horizontal pleiotropy is minimized because of the use of 80 independent variants throughout the genome, which may result in balanced, instead of directional, horizontal pleiotropy. Finally, because a recent GWAS on biological sex by Pirastu and coworkers found that sex‐differential participation could influence genetic studies, 24 we further investigated this potential source of bias. Our results are suggesting a minimal impact, if any, of this type of bias.
Our results suggest that LDL‐C is a less important predictor for cardiovascular risk in women than in men and we hypothesize that treatment of other risk factors (eg, hypertension, coagulation, inflammation) might be of more importance. 41 In other words, our data thus not only suggest that the prospective risk differs per sex but also that the relative contribution of predictors might be dependent on sex as well. Moreover, our data warrant further evaluation of potential benefits and risks of lipid‐lowering therapy. Although the risk for serious adverse events for all lipid‐lowering compounds is very low, our data might imply that the evaluation of the benefits compared with experienced side effects (eg, myalgia for statins) could differ based on sex. Our study also has implications for future LDL‐C‐lowering clinical trials in a primary prevention setting, because the observed sex difference implies that more female participants are needed to ensure sufficient power to detect a significant effect. 41 Our observations possibly apply to many more therapeutic agents in other fields and might implicate that sex‐specific dose finding studies should be conducted for certain therapeutic compounds, especially for compounds with a relatively unfavorable benefit/harm ratio. In the case of novel clinical trials involving “polypills” (with for example multiple complementary CVD‐targeting compounds), specific combinations of compounds and concentrations can be made based on sex. MR can be helpful to provide a first clue of a sex‐specific difference and can thus aid in the optimal selection of complementary drugs and in power calculations for clinical trials.
Our study has limitations. First, although we employed various sensitivity analyses to further minimize the possibility of bias, we cannot entirely exclude bias risk. Future (genetic or drug) studies in different cohorts should validate our findings. Second, this study investigates the lifetime effect of increased LDL‐C, because of the use of genetic variation. Although we have illustrated the directional concordance of our results with clinical trial data, caution is warranted in translating our effect sizes to drug treatment effects. Third, our study includes participants of European descent. Caution is warranted in extrapolating our results to patients with a different ethnic background. Fourth, epidemiological studies report that although women have lower absolute cardiovascular risk before menopause, this attenuation largely disappears in the years after menopause. Owing to the (largely) cross‐sectional nature of the UK Biobank, we could not investigate a potential interaction between menopause and the causal effects of genetically increased LDL‐C.
Conclusions
In conclusion, we found that genetically increased LDL‐C has a sex‐specific differential causal effect on the risk for CVD, ischemic heart disease, HF, and AVS. These observations implicate that women are less susceptible to LDL‐C‐associated CVD and more susceptible to LDL‐C‐associated AVS compared with men. Our observations may benefit analyses for treatment guidance, clinical trial design, and dose‐finding studies and warrant more sex‐specific evaluations of the relative contribution of cardiovascular risk factors to disease.
Sources of Funding
AJC is supported by grants from the Atheros fund, the Academic Medical Center Young Talent Fund, Prince Bernhard Culture fund and Stichting de Drie Lichten. FWA is supported by University College London Hospitals National Institute for Health Research Biomedical Research Centre and received support from the BigData@Heart Consortium, funded by the Innovative Medicines Initiative‐2 joint undertaking under grant agreement no 116074 and National Institutes of Health grant LM010098. GKH is supported by grants from Netherlands Organization for Scientific Research (vidi 016.156.445), grants from Klinkerpad fonds, and grants from the European Union. AFS is supported by British Heart Foundation grant PG/18/5033837 and the University College London British Heart Foundation Research Accelerator AA/18/6/34223.
Disclosures
AJC: none. FWA has received funding from Servier for unrelated work. AFS has received funding from Servier for unrelated work. GKH has received funding for clinical trial activities and/or lecture fees from Regeneron, Aegerion, Amgen, AstraZeneca, Eli Lilly, Genzyme, Kowa, Pfizer, Regeneron Pharmaceuticals, Roche, Sanofi, The Medicines Company, Ionis until April 2019, and fees were paid to his institute. GKH is since April 2019 part‐time employed by Novo Nordisk.
Supporting information
Tables S1–S7
Figures S1–S2
Supplemental Material for this article is available at https://www.ahajournals.org/doi/suppl/10.1161/JAHA.121.024248
For Sources of Funding and Disclosures, see page 11.
References
- 1. Virani SS, Alonso A, Benjamin EJ, Bittencourt MS, Callaway CW, Carson AP, Chamberlain AM, Chang AR, Cheng S, Delling FN, et al. Heart disease and stroke statistics‐2020 update a report from the American Heart Association WRITING GROUP MEMBERS on behalf of the American Heart Association Council on Epidemiology and Prevention Statistics Committee and Stroke Statistics Subcommittee. Circulation. 2020;141:139–596. doi: 10.1161/CIR.0000000000000757 [DOI] [Google Scholar]
- 2. Swiger KJ, Martin SS, Blaha MJ, Toth PP, Nasir K, Michos ED, Gerstenblith G, Blumenthal RS, Jones SR. Narrowing sex differences in lipoprotein cholesterol subclasses following mid‐life: the very large database of lipids (VLDL‐10B). J Am Heart Assoc. 2014;3. doi: 10.1161/JAHA.114.000851 [DOI] [PMC free article] [PubMed] [Google Scholar]
- 3. Cangemi R, Romiti GF, Campolongo G, Ruscio E, Sciomer S, Gianfrilli D, Raparelli V. Gender related differences in treatment and response to statins in primary and secondary cardiovascular prevention: the never‐ending debate. Pharmacol Res. 2017;117:148–155. doi: 10.1016/j.phrs.2016.12.027 [DOI] [PubMed] [Google Scholar]
- 4. Schmidt AF, Groenwold RHH, van Delden JJM, van der Does Y, Klungel OH, Roes KCB, Hoes AW, van der Graaf R. Justification of exclusion criteria was underreported in a review of cardiovascular trials. J Clin Epidemiol. 2014;67:635–644. doi: 10.1016/j.jclinepi.2013.12.005 [DOI] [PubMed] [Google Scholar]
- 5. Cholesterol Treatment Trialists' (CTT) Collaboration .Efficacy and safety of LDL‐lowering therapy among men and women: meta‐analysis of individual data from 174 000 participants in 27 randomised trials. The Lancet. 2015;385:1397–1405. doi: 10.1016/s0140-6736(14)61368-4 [DOI] [PubMed] [Google Scholar]
- 6. Ference BA, Bhatt DL, Catapano AL, Packard CJ, Graham I, Kaptoge S, Ference TB, Guo Q, Laufs U, Ruff CT, et al. Association of genetic variants related to combined exposure to lower low‐density lipoproteins and lower systolic blood pressure with lifetime risk of cardiovascular disease. JAMA. 2019;322:1381. doi: 10.1001/jama.2019.14120 [DOI] [PMC free article] [PubMed] [Google Scholar]
- 7. Holmes MV, Asselbergs FW, Palmer TM, Drenos F, Lanktree MB, Nelson CP, Dale CE, Padmanabhan S, Finan C, Swerdlow DI, et al. Mendelian randomization of blood lipids for coronary heart disease. Eur Heart J. 2015;36:539–550. doi: 10.1093/eurheartj/eht571 [DOI] [PMC free article] [PubMed] [Google Scholar]
- 8. Eiriksdottir G, Harris TB, Launer LJ, Gudnason V, Folsom AR, Andrews G, Ballantyne CM, Samani NJ, Hall AS, Braund PS, et al. Association between C reactive protein and coronary heart disease: Mendelian randomisation analysis based on individual participant data. BMJ. 2011;342. doi: 10.1136/bmj.d548 [DOI] [PMC free article] [PubMed] [Google Scholar]
- 9. Burgess S, Thompson SG. Use of allele scores as instrumental variables for Mendelian randomization. Int J Epidemiol. 2013;42:1134–1144. doi: 10.1093/ije/dyt093 [DOI] [PMC free article] [PubMed] [Google Scholar]
- 10. Burgess S, Dudbridge F, Thompson SG, Library WO, Burgess S, Dudbridge F, Thompson SG. Combining information on multiple instrumental variables in Mendelian randomization: comparison of allele score and summarized data methods. Stat Med. 2015;35:1880–1906. doi: 10.1002/sim.6835 [DOI] [PMC free article] [PubMed] [Google Scholar]
- 11. Willer CJ, Schmidt EM, Sengupta S, Peloso GM, Gustafsson S, Kanoni S, Ganna A, Chen J, Buchkovich ML, Mora S, et al; Global Lipids Genetics Consortium . Discovery and refinement of loci associated with lipid levels. Nat Genet. 2013;45:1274–1285. doi: 10.1038/ng.2797 [DOI] [PMC free article] [PubMed] [Google Scholar]
- 12. Bycroft C, Freeman C, Petkova D, Band G, Elliott LT, Sharp K, Motyer A, Vukcevic D, Delaneau O, O’Connell J, et al. The UK Biobank resource with deep phenotyping and genomic data. Nature. 2018;562:203–209. doi: 10.1038/s41586-018-0579-z [DOI] [PMC free article] [PubMed] [Google Scholar]
- 13. Clayton JA, Tannenbaum C. Reporting sex, gender, or both in clinical research? JAMA. 2016;316:1863–1864. doi: 10.1001/jama.2016.16405 [DOI] [PubMed] [Google Scholar]
- 14. UK Biobank — Neale lab . Available at http://www.nealelab.is/uk‐biobank. Accessed June 14, 2021.
- 15. Coffey S, Lewandowski AJ, Garratt S, Meijer R, Lynum S, Bedi R, Paterson J, Yaqub M, Noble JA, Neubauer S, et al. Protocol and quality assurance for carotid imaging in 100,000 participants of UK Biobank: development and assessment. Eur J Prev Cardiol. 2017;24:1799–1806. doi: 10.1177/2047487317732273 [DOI] [PubMed] [Google Scholar]
- 16. Ference BA. How to use Mendelian randomization to anticipate the results of randomized trials. Eur Heart J. 2018;39:360–362. doi: 10.1093/eurheartj/ehx462 [DOI] [PubMed] [Google Scholar]
- 17. Burgess S, Small DS, Thompson SG. A review of instrumental variable estimators for Mendelian randomization. Stat Methods Med Res. 2017;26:2333–2355. doi: 10.1177/0962280215597579 [DOI] [PMC free article] [PubMed] [Google Scholar]
- 18. Balduzzi S, Rücker G, Schwarzer G. How to perform a meta‐analysis with R: a practical tutorial. Evidence‐Based Mental Health. 2019;22:153–160. doi: 10.1136/ebmental-2019-300117 [DOI] [PMC free article] [PubMed] [Google Scholar]
- 19. R Core Team . R: A language and environment for statistical computing. R Foundation for Statistical Computing. 2019. Available at https://www.r‐project.org/
- 20. Band G, Marchini J. BGEN: a binary file format for imputed genotype and haplotype data. bioRxiv. 2018. [Google Scholar]
- 21. Hadley Wickham . ggplot2 ‐ Elegant Graphics for Data Analysis. New York: Springer; 2016. Available at https://www.springer.com/gp/book/9783319242750. Accessed July 2, 2020. [Google Scholar]
- 22. Sinnott‐Armstrong N, Tanigawa Y, Amar D, Mars N, Benner C, Aguirre M, Venkataraman GR, Wainberg M, Ollila HM, Kiiskinen T, et al. Genetics of 35 blood and urine biomarkers in the UK Biobank. Nat Genet. 2021;53:185–194. doi: 10.1038/s41588-020-00757-z [DOI] [PMC free article] [PubMed] [Google Scholar]
- 23. Storey JD. A direct approach to false discovery rates. J Royal Stat Soc: Series B (Stat Methodol). 2002;64:479–498. doi: 10.1111/1467-9868.00346 [DOI] [Google Scholar]
- 24. Pirastu N, Cordioli M, Nandakumar P, Mignogna G, Abdellaoui A, Hollis B, Kanai M, Rajagopal VM, Parolo PDB, Baya N, et al. Genetic analyses identify widespread sex‐differential participation bias. Nat Genet 2021;53:663–671. doi: 10.1038/s41588-021-00846-7. [DOI] [PMC free article] [PubMed] [Google Scholar]
- 25. Willeit P, Tschiderer L, Allara E, Reuber K, Seekircher L, Gao LU, Liao X, Lonn E, Gerstein HC, Yusuf S, et al. Carotid intima‐media thickness progression as surrogate marker for cardiovascular risk: meta‐analysis of 119 clinical trials involving 100,667 patients. Circulation. 2020;142:621–642. doi: 10.1161/CIRCULATIONAHA.120.046361 [DOI] [PMC free article] [PubMed] [Google Scholar]
- 26. Kato ET, Cannon CP, Blazing MA, Bohula E, Guneri S, White JA, Murphy SA, Park JG, Braunwald E, Giugliano RP. Efficacy and safety of adding ezetimibe to statin therapy among women and men: insight from IMPROVE‐IT (improved reduction of outcomes: vytorin efficacy international trial). J Am Heart Assoc. 2017;6. doi: 10.1161/JAHA.117.006901 [DOI] [PMC free article] [PubMed] [Google Scholar]
- 27. Sever P, Gouni‐Berthold I, Keech A, Giugliano R, Pedersen TR, Im K, Wang H, Knusel B, Sabatine MS, O’Donoghue ML. LDL‐cholesterol lowering with evolocumab, and outcomes according to age and sex in patients in the FOURIER Trial. Eur J Prev Cardiol. 2020;8:805–812. doi: 10.1177/2047487320902750 [DOI] [PubMed] [Google Scholar]
- 28. Schmidt AF, Carter J‐PL, Pearce LS, Wilkins JT, Overington JP, Hingorani AD, Casas J. PCSK9 monoclonal antibodies for the primary and secondary prevention of cardiovascular disease. Cochrane Database Syst Rev. 2020. doi: 10.1002/14651858.CD011748.pub3 [DOI] [PMC free article] [PubMed] [Google Scholar]
- 29. Patel RS, Tragante V, Schmidt AF, McCubrey RO, Holmes MV, Howe LJ, Direk K, Åkerblom A, Leander K, Virani SS et al. Subsequent event risk in individuals with established coronary heart disease. Circ: Genom Precis Med. 2019;12:e002470. doi: 10.1161/CIRCGEN.119.002470 [DOI] [PMC free article] [PubMed] [Google Scholar]
- 30. Palmisano BT, Zhu L, Eckel RH, Stafford JM. Sex differences in lipid and lipoprotein metabolism. Mol Metab. 2018;15:45–55. doi: 10.1016/j.molmet.2018.05.008 [DOI] [PMC free article] [PubMed] [Google Scholar]
- 31. Mathur P, Ostadal B, Romeo F, Mehta JL. Gender‐related differences in atherosclerosis. Cardiovasc Drugs Ther. 2015;29:319–327. doi: 10.1007/s10557-015-6596-3 [DOI] [PubMed] [Google Scholar]
- 32. Man JJ, Beckman JA, Jaffe IZ. Sex as a biological variable in atherosclerosis. Circ Res. 2020;126:1297–1319. doi: 10.1161/CIRCRESAHA.120.315930 [DOI] [PMC free article] [PubMed] [Google Scholar]
- 33. Villablanca AC, Jayachandran M, Banka C. Atherosclerosis and sex hormones: current concepts. Clin Sci. 2010;119:493–513. doi: 10.1042/CS20100248 [DOI] [PubMed] [Google Scholar]
- 34. Summerhill VI, Moschetta D, Orekhov AN, Poggio P, Myasoedova VA. Sex‐specific features of calcific aortic valve disease. Int J Mol Sci. 2020;21:5620. doi: 10.3390/ijms21165620 [DOI] [PMC free article] [PubMed] [Google Scholar]
- 35. Shan Y, Pellikka PA. Aortic stenosis in women. Heart. 2020;106:970–976. doi: 10.1136/heartjnl-2019-315407 [DOI] [PubMed] [Google Scholar]
- 36. Gustav Smith J, Luk K, Schulz C‐A, Engert JC, Do R, Hindy G, Rukh G, Dufresne L, Almgren P, Owens DA, et al; Cohorts for Heart and Aging Research in Genetic Epidemiology (CHARGE) Extracoronary Calcium Working Group . Association of low‐density lipoprotein cholesterol‐related genetic variants with aortic valve calcium and incident aortic stenosis. JAMA. 2014;312:17674–21771. doi: 10.1001/jama.2014.13959 [DOI] [PMC free article] [PubMed] [Google Scholar]
- 37. Pérez de Isla L, Watts GF, Alonso R, Díaz‐Díaz JL, Muñiz‐Grijalvo O, Zambón D, Fuentes F, de Andrés R, Padró T, López‐Miranda J, et al. LDL‐cholesterol, and hypertension: predictors of the need for aortic valve replacement in familial hypercholesterolaemia. Eur Heart J. 2021;42:2201–2211. doi: 10.1093/eurheartj/ehaa1066 [DOI] [PubMed] [Google Scholar]
- 38. Saeed S, Dweck MR, Chambers J. Expert review of cardiovascular therapy sex differences in aortic stenosis: from pathophysiology to treatment sex differences in aortic stenosis: from pathophysiology to treatment. Expert Rev Cardiovas Ther. 2020;2:65–75. doi: 10.1080/14779072.2020.1732209 [DOI] [PubMed] [Google Scholar]
- 39. Mach F, Baigent C, Catapano AL, Koskinas KC, Casula M, Badimon L, Chapman MJ, De Backer GG, Delgado V, Ference BA, et al. 2019 ESC/EAS guidelines for the management of dyslipidaemias: Lipid modification to reduce cardiovascular risk. Atherosclerosis. 2019;290:140–205. doi: 10.1016/j.atherosclerosis.2019.08.014 [DOI] [PubMed] [Google Scholar]
- 40. Ference BA, Kastelein JJP, Catapano AL. Lipids and lipoproteins in 2020. JAMA. 2020;324:595–596. doi: 10.1001/jama.2020.5685 [DOI] [PubMed] [Google Scholar]
- 41. Tannenbaum C, Norris CM, McMurtry MS. Sex‐specific considerations in guidelines generation and application. Can J Cardiol. 2019;35:598–605. doi: 10.1016/j.cjca.2018.11.011 [DOI] [PubMed] [Google Scholar]
Associated Data
This section collects any data citations, data availability statements, or supplementary materials included in this article.
Supplementary Materials
Tables S1–S7
Figures S1–S2