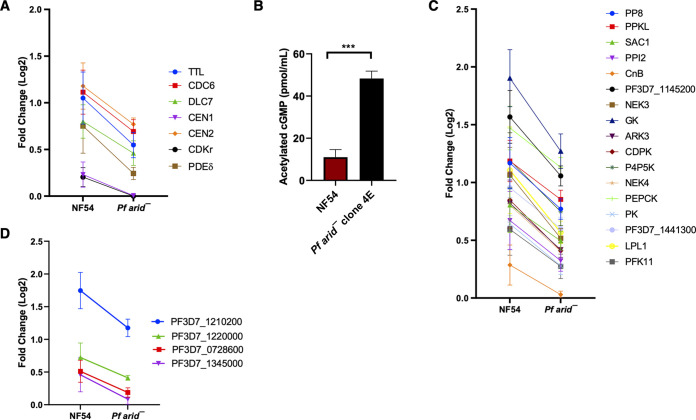
FIG 4.
Target-by-target comparison of differential gene expression in WT PfNF54 and Pfarid– stage V game oocytes. (A) Graph showing differentially expressed genes (DEGs) from genes predicted to have a role in gametogenesis. Log2 fold changes are indicated. (B) Acetylated cGMP levels in day 15 gametocyte extracts prepared for WT PfNF54 and Pfarid–. Bar graph represents means standard errors of the means. Unpaired t test with Welch’s correction was used for statistical analysis. (C) Graph showing DEGs belonging to signaling (kinases, phosphatases, and phospholipases). (D) Graph showing DEGs belonging zinc finger proteins (ZFPs). Log2 fold changes are indicated.

