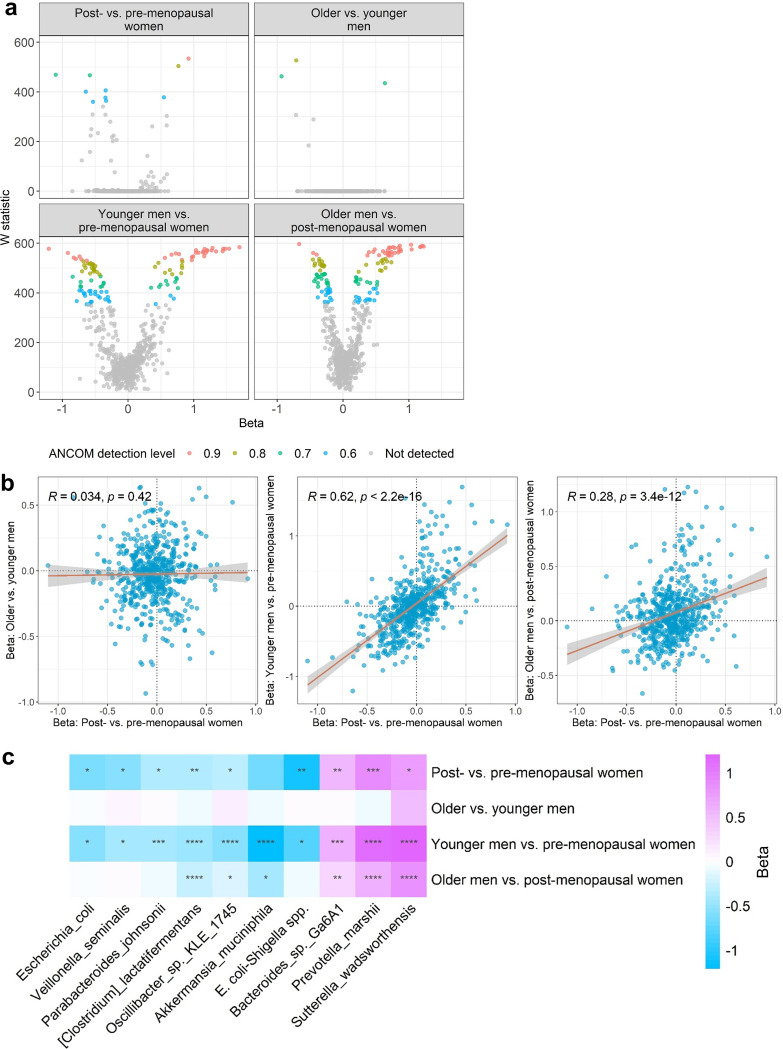
FIG 2.
Gut microbiome species associated with menopause also differ between men and women. (a) Volcano plots show differentially abundant species for the group comparisons. W statistics are from ANCOM2 analysis adjusting for age, Hispanic/Latino background, U.S. nativity, AHEI2010, field center, hormonal contraceptive use, antibiotics use in last 6 months, Bristol stool scale, cigarette use, alcohol use, education, income, physical activity, and BMI. Effect size (beta) coefficients are from multivariable linear regression on clr-transformed species abundance, adjusting for aforementioned covariates. Effect size represents difference in clr-transformed species abundance between the specified groups. (b) Correlation of effect sizes (beta) for the different group comparisons. Spearman correlation coefficients are displayed on the plots. (c) Heatmap of effect size (beta) for species with detection level of ≥0.6 in ANCOM2 analysis of post- versus premenopausal women. *, P < 0.05; **, P < 0.01; ***, P < 0.001; ****, P < 0.0001 in multivariable linear regression.

