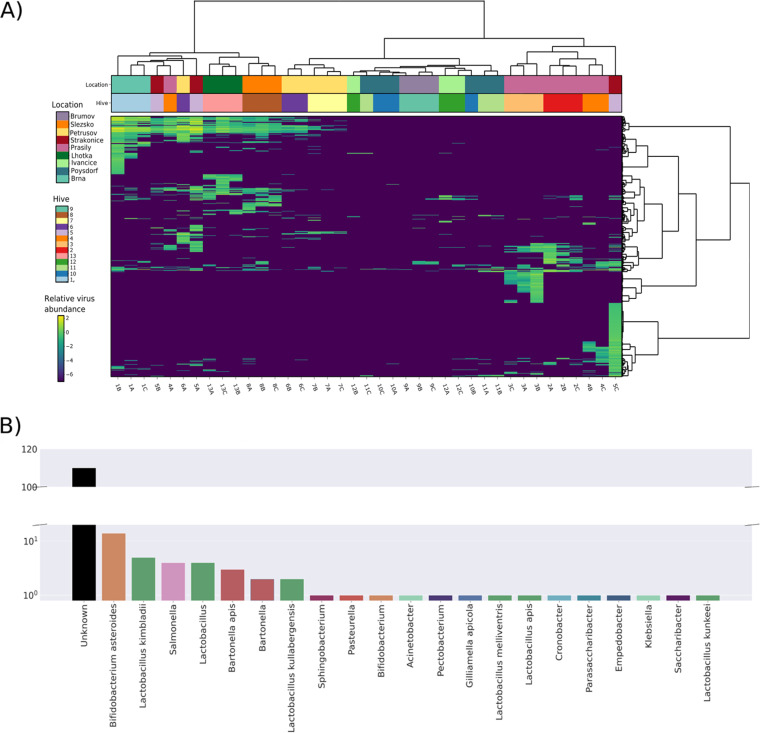
FIG 6.
Host calling and clustering of prokaryotic viruses. (A) Heatmap of all contigs classified as bacteriophages. Relative abundances (viruses per 1 million sequencing reads) are shown on a log10 scale. Samples (columns) and contigs (rows) are clustered by Ward’s minimum variance method; both columns and rows are seriated by optimal leaf ordering. (B) Count of predicted hosts for 158 bacteriophage contigs identified by VirSorter2. Contigs with no prediction are in the “Unknown” category.

