Abstract
Objective
To compare a deep learning-based reconstruction (DLR) algorithm for pediatric abdominopelvic computed tomography (CT) with filtered back projection (FBP) and iterative reconstruction (IR) algorithms.
Materials and Methods
Post-contrast abdominopelvic CT scans obtained from 120 pediatric patients (mean age ± standard deviation, 8.7 ± 5.2 years; 60 males) between May 2020 and October 2020 were evaluated in this retrospective study. Images were reconstructed using FBP, a hybrid IR algorithm (ASiR-V) with blending factors of 50% and 100% (AV50 and AV100, respectively), and a DLR algorithm (TrueFidelity) with three strength levels (low, medium, and high). Noise power spectrum (NPS) and edge rise distance (ERD) were used to evaluate noise characteristics and spatial resolution, respectively. Image noise, edge definition, overall image quality, lesion detectability and conspicuity, and artifacts were qualitatively scored by two pediatric radiologists, and the scores of the two reviewers were averaged. A repeated-measures analysis of variance followed by the Bonferroni post-hoc test was used to compare NPS and ERD among the six reconstruction methods. The Friedman rank sum test followed by the Nemenyi-Wilcoxon-Wilcox all-pairs test was used to compare the results of the qualitative visual analysis among the six reconstruction methods.
Results
The NPS noise magnitude of AV100 was significantly lower than that of the DLR, whereas the NPS peak of AV100 was significantly higher than that of the high- and medium-strength DLR (p < 0.001). The NPS average spatial frequencies were higher for DLR than for ASiR-V (p < 0.001). ERD was shorter with DLR than with ASiR-V and FBP (p < 0.001). Qualitative visual analysis revealed better overall image quality with high-strength DLR than with ASiR-V (p < 0.001).
Conclusion
For pediatric abdominopelvic CT, the DLR algorithm may provide improved noise characteristics and better spatial resolution than the hybrid IR algorithm.
Keywords: Abdomen, Deep learning, Image reconstruction, Pediatrics, Tomography
INTRODUCTION
Computed tomography (CT) has undergone considerable technical advances over the past few decades, with improvements in image quality, shorter scan times, and reduced radiation doses. Despite the potential risks of ionizing radiation in children, these technical advances have led to important clinical applications. Children have a larger potential risk of stochastic effects from ionizing radiation because of their smaller body size, developing organs, and long life expectancy [1].
Among the many technological advances in CT scanning, reduction of image noise is essential for pediatric patients to allow scanning with a lower radiation dose. Iterative reconstruction (IR) has been proven to improve image quality while reducing radiation dose in both adult and pediatric patients [2,3,4,5,6]. IR changes the noise properties, giving a different visual impression compared to filtered back projection (FBP) images, with IR tending to aggressively reduce image noise in uniform image regions and less aggressively reduce noise in regions with many structural edges [7]. However, it has been reported that noise texture appears “smooth,” “blotchy,” “plastic-looking,” or simply “unnatural” [3].
Recently developed deep learning-based reconstruction (DLR) can suppress image noise while minimally changing the noise texture. In several phantom studies, DLR has reduced noise and improved spatial resolution compared with FBP and IR, whereas in patient studies, it has showed better image noise properties than hybrid IR [8,9,10,11,12]. Additionally, DLR shows improved edge sharpness compared with hybrid IR in coronary CT angiography (measured using the edge rise distance [ERD] method) [8,13]. However, the spatial resolution of DLR abdominopelvic CT images has not been assessed in recent studies, and only few studies have been conducted on the feasibility and effectiveness of DLR in pediatric body CT scans.
Thus, this study aimed to compare a DLR algorithm with the FBP and IR algorithms for pediatric abdominopelvic CT.
MATERIALS AND METHODS
This retrospective study was approved by our Institutional Review Board, which waived the requirement for informed consent (IRB No. 05-2021-079).
Study Population
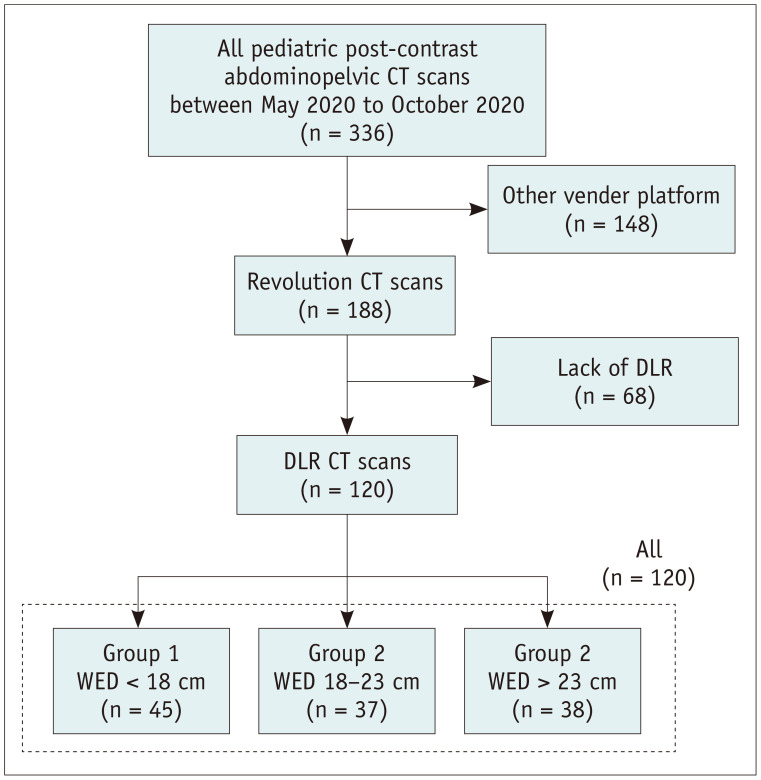
A total of 336 pediatric post-contrast abdominopelvic CT scans were performed at our institution between May 2020 and October 2020. Among them, 188 CT scans, which were performed using a CT scanner capable of DLR (Revolution CT; GE Healthcare), were considered for the present study. After excluding 68 CT scans without DLR, 120 consecutive CT examinations were included in this study (60 boys and 60 girls). The patients were categorized into three subgroups according to their water equivalent diameter (WED): group 1 (< 18 cm, n = 45), group 2 (18–23 cm, n = 37), and group 3 (> 23 cm, n = 38) (Fig. 1). The WED was calculated using an automated dose management system (Radimetrics; Bayer Healthcare) [14]. Patient information, including age, sex, and body weight, was obtained from an electronic medical record or radiological database system. The patient characteristics are shown in Table 1.
Fig. 1. Flow diagram of the study patients.
DLR = deep learning-based reconstruction, WED = water equivalent diameter
Table 1. Study Population Characteristics.
| Characteristic | All | Group (WED Rrange) | ||
|---|---|---|---|---|
| Group 1 (< 18 cm) | Group 2 (18–23 cm) | Group 3 (> 23 cm) | ||
| Number of patients | 120 | 45 | 37 | 38 |
| WED, cm | 20.6 ± 4.4 | 16.0 ± 1.3 | 20.7 ± 1.6 | 25.8 ± 2.4 |
| Age, year | 8.7 ± 5.2 | 3.2 ± 2.5 | 10.6 ± 2.3 | 13.6 ± 2.9 |
| Male:female | 60:60 | 23:22 | 20:17 | 17:21 |
| Weight, kg | 37.4 ± 21.2 | 16.6 ± 5.6 | 37.6 ± 10.0 | 61.9 ± 13.3 |
| CTDIvol, mGy | 2.9 ± 1.6 | 1.5 ± 0.5 | 3.1 ± 0.8 | 4.4 ± 1.4 |
| SSDE, mGy | 4.8 ± 1.9 | 3.0 ± 0.9 | 5.3 ± 1.0 | 6.3 ± 1.6 |
| DLP, mGy∙cm | 141.2 ± 97.5 | 54.1 ± 24.9 | 148.6 ± 46.2 | 237.1 ± 94.6 |
Data are mean ± standard deviation or patient number. CTDIvol = volume CT dose index, DLP = dose-length product, SSDE = size-specific dose estimates, WED = water equivalent diameter
CT Scanning Protocol
The detailed CT scanning protocol is described in Supplement.
Image Reconstruction
Raw projection data were reconstructed with FBP, adaptive statistical iterative reconstruction–V (ASiR-V; GE Healthcare) with blending factors of 50% and 100% (AV50 and AV100, respectively), and TrueFidelity (GE Healthcare) with low-, medium-, and high-strength levels (TFL, TFM, and TFH, respectively). ASiR-V is a hybrid IR algorithm adapted from statistical modeling [3,6]. It can be blended with FBP in increments of 10%, with AV50 and AV100 being routinely used in our practice. TrueFidelity is a DLR algorithm that provides three reconstruction strength levels to control noise levels. Axial images were reconstructed with 2.5 mm thickness and 2.5 mm slice intervals, with a standard soft tissue kernel applied for image reconstruction.
Quantitative Image Analysis
Noise power spectrum (NPS) and ERD were measured for quantitative image analysis. All measurements were performed by a single radiologist with three years of experience in radiologic imaging interpretation.
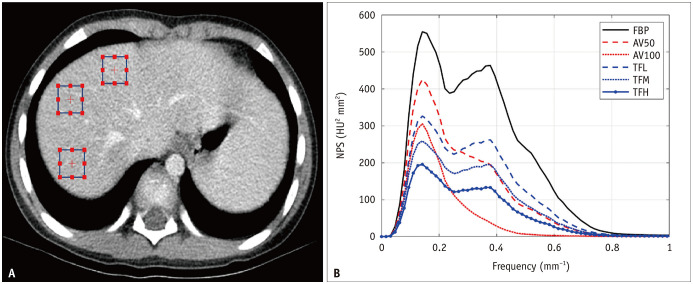
Noise magnitude, NPS peak, and NPS average spatial frequency were obtained using the imQuest open-source software package (https://deckard.duhs.duke.edu/~samei/tg233.html). The noise magnitude is the square root of the integral of the two-dimensional NPS. The NPS peak has the highest value of the one-dimensional NPS which is the radial average of the two-dimensional NPS. The noise magnitude and NPS peak were used to compare noise amplitudes. The NPS average spatial frequency, which is the average frequency of the one-dimensional NPS, was used to compare the noise textures. For NPS measurements, three 15 × 15 mm square regions of interest (ROIs) were placed in relatively homogeneous portions of liver segments 4, 7, and 8 on five sequential axial image slices (Fig. 2A). Each ROI was placed at the same location for each reconstruction image.
Fig. 2. NPS measurement in a 7-year-old, 33.0 kg male patient (WED: 17.5 cm).
A. Three rectangular regions of interest placed over the liver parenchyma to calculate NPS on axial image. B. NPS in same patient. AV50 and AV100 = ASIR-V with a blending factor of 50% and 100%, respectively, FBP = filtered back projection, HU = Hounsfield unit, NPS = noise power spectrum, TFL, TFM and TFH = TrueFidelity with low, medium and high strength levels, respectively, WED = water equivalent diameter
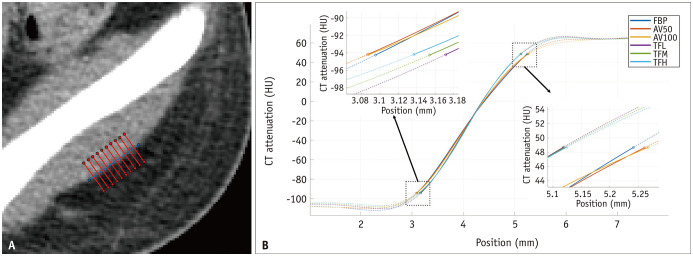
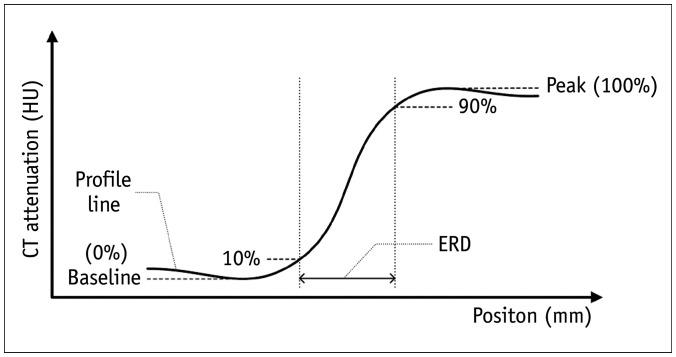
ERD, defined as the 10% to 90% distance of the edge response, is a metric used to measure spatial resolution [15] and was adopted as a measure of the spatial resolution of the axial CT images. To measure ERD, a 1 cm reference line was drawn along the lateral border of the left gluteus medius muscle, and 100 CT attenuation lines were automatically extracted perpendicular to the reference line (Fig. 3A). The attenuation values along each CT attenuation line were extracted, and the profile lines were plotted (Fig. 4). Finally, the ERD was measured on the averaged curve of the CT attenuation lines (Fig. 3B). ERD measurements were performed using MATLAB (version R2020b; MathWorks). The same 10% and 90% values of the edge response on the FBP images were applied for the ERD measurements on each reconstruction image.
Fig. 3. ERD measurement in a 15-year-old, 58.1 kg male patient (WED: 23.7 cm).
A. A hundred CT attenuation lines along the 1 cm length of boundary between the gluteus medius muscle and subcutaneous fat (only 10 CT attenuation lines are displayed on this image). B. Averaged curve of a hundred CT attenuation lines for ERD measurement, ERD values (FBP: 2.146 mm, AV50: 2.176 mm, AV100: 2.180 mm, TFL: 1.947 mm, TFM: 1.966 mm, TFH: 1.987 mm). AV50 and AV100 = ASIR-V with a blending factor of 50% and 100%, respectively, ERD = edge rise distance, FBP = filtered back projection, HU = Hounsfield unit, TFL, TFM and TFH = TrueFidelity with low, medium and high strength levels, respectively, WED = water equivalent diameter
Fig. 4. Schematic drawing of a CT profile line at the border between a muscle and fat.
ERD is measured as the distance by edge response to rise from 10% to 90% CT attenuation value. The peak value is 100% CT attenuation value of edge response. The baseline CT attenuation value of edge response is 0%. ERD = edge rise distance, HU = Hounsfield unit
Qualitative Visual Analysis
Qualitative visual assessments of 720 CT images (six reconstructed images from 120 patients) were performed using a dedicated PACS workstation. Axial images at the main portal vein level were selected by a radiologist with three years of experience in image interpretation, and these were provided to the reviewers in a randomized order. The CT images were analyzed independently by two board-certified pediatric radiologists with 20 and 10 years of experience in interpreting pediatric abdominopelvic CT images. Both reviewers were blinded to the reconstruction algorithms used.
The reviewers were provided with a predesigned five-point scale assessment form for image noise, edge definition, and overall image quality (1 = very poor; 2 = suboptimal; 3 = acceptable; 4 = above average; 5 = excellent). Image noise was defined as the degree of quantum mottle. Edge definition was defined as the degree of perceptual sharpness of the stomach and intrahepatic vessels. The overall image quality was defined according to a comprehensive assessment of image quality.
Detectability and conspicuity of abnormalities were assessed in cases with focal lesions less than 3 mm in diameter or acute appendicitis. Each reviewer independently evaluated lesion detectability and conspicuity (1 = poor lesion conspicuity, nondiagnostic; 2 = suboptimal lesion conspicuity without diagnostic limitation; 3 = good lesion conspicuity).
Distortion artifacts, which may be present as diffuse checkered line-like artifacts in CT images [16], were assessed in 15 randomly selected patients in each WED group (45 patients). The degree of artifact was scored using a three-point scale (1 = artifact with limited diagnostic limitation; 2 = artifact without diagnostic limitation; 3 = no artifact). Beam-hardening artifacts were assessed using CT images containing catheters or tubes in the abdominopelvic cavity.
Statistical Analysis
A repeated-measures analysis of variance followed by the Bonferroni post-hoc test was used to compare NPS measurements and ERD between all reconstruction image sets. For qualitative analysis, the Friedman rank sum test followed by the Nemenyi-Wilcoxon-Wilcox all-pairs test was used to compare image noise, edge definition, overall quality, and distortion artifacts between all reconstruction methods. The qualitative visual analysis scores of the two reviewers were averaged for qualitative analysis. Furthermore, inter-rater agreement for the readers’ scores was calculated using a linear weighted (κ) statistic, with κ-values interpreted as follows: 0–0.2 (poor), 0.21–0.40 (fair), 0.41–0.60 (moderate), 0.61–0.80 (good), and 0.81–1.00 (excellent) [17]. Analyses were performed for all patients and individual WED groups. Statistical analyses were performed using R (version 4.1.2; R Foundation). Statistical significance was set at p < 0.05.
RESULTS
Quantitative NPS Measurement
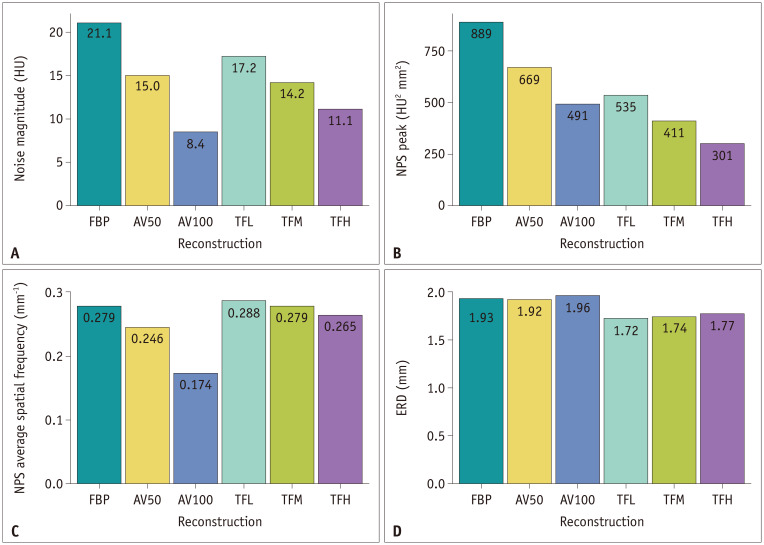
Table 2 summarizes the NPS measurements of the noise magnitude, NPS peak, and NPS average spatial frequency of all reconstructed image sets, both separately for the three WED groups and for all patients. A higher blending factor in ASiR-V (AV100 > AV50 > FBP) and a higher strength in TrueFidelity (TFH > TFM > TFL > FBP) resulted in significantly lower noise magnitudes and NPS peaks in all WED groups (Fig. 5A, B). Noise magnitudes were significantly lower with AV100 than with TrueFidelity in all WED groups, while NPS peaks were significantly higher with AV100 than with TFM and TFH in all WED groups, except for group 1.
Table 2. Summary of Noise Power Spectrum Measurement.
| Patients (WED Range) | Parameter | FBP | AV50 | AV100 | TFL | TFM | TFH | P * |
|---|---|---|---|---|---|---|---|---|
| All | Noise magnitude (HU) | 21.1f ± 3.4 | 15.0d ± 2.1 | 8.44a ± 1.6 | 17.2e ± 2.7 | 14.2c ± 2.3 | 11.1b ± 2.2 | < 0.001 |
| NPSpeak (HU2 mm2) | 889f ± 574 | 669e ± 494 | 491c ± 406 | 535d ± 317 | 411b ± 259 | 301a ± 211 | < 0.001 | |
| NPSfav (mm−1) | 0.279d ± 0.041 | 0.246b ± 0.038 | 0.174a ± 0.038 | 0.288e ± 0.032 | 0.279d ± 0.034 | 0.265c ± 0.038 | < 0.001 | |
| Group 1 (< 18 cm) | Noise magnitude (HU) | 18.8e ± 1.7 | 14.2c ± 1.6 | 8.36a ± 1.32 | 16.8d ± 3.0 | 14.6c ± 2.8 | 12.3b ± 2.7 | < 0.001 |
| NPSpeak (HU2 mm2) | 556d ± 195 | 418c ± 185 | 289a ± 140 | 430c ± 228 | 353b ± 209 | 283a ± 189 | < 0.001 | |
| NPSfav (mm−1) | 0.306c, d, e ± 0.032 | 0.280b ± 0.021 | 0.213a ± 0.038 | 0.316e ± 0.020 | 0.308d ± 0.021 | 0.298c ± 0.022 | < 0.001 | |
| Group 2 (18–23 cm) | Noise magnitude (HU) | 20.6f ± 1.8 | 14.1d ± 1.1 | 7.6a ± 1.1 | 15.8e ± 1.8 | 13.1c ± 1.7 | 10.1b ± 1.6 | < 0.001 |
| NPSpeak (HU2 mm2) | 719f ± 225 | 507e ± 221 | 359d ± 191 | 426c ± 208 | 325b ±195 | 236a ± 182 | < 0.001 | |
| NPSfav (mm−1) | 0.283d, e ± 0.027 | 0.246b ± 0.020 | 0.168a ± 0.018 | 0.286e ± 0.020 | 0.278d ± 0.022 | 0.264c ± 0.024 | < 0.001 | |
| Group 3 (> 23 cm) | Noise magnitude (HU) | 24.5f ± 3.4 | 16.9d ± 2.1 | 9.3a ± 1.8 | 18.9e ± 2.1 | 14.9c ± 1.6 | 10.7b ± 1.2 | < 0.001 |
| NPSpeak (HU2 mm2) | 1450f ± 692 | 1126e ± 616 | 860d ± 514 | 767c ± 373 | 562b ± 303 | 385a ± 239 | < 0.001 | |
| NPSfav (mm−1) | 0.242d ± 0.032 | 0.206b ± 0.025 | 0.134a ± 0.017 | 0.257e ± 0.024 | 0.246d ± 0.026 | 0.228c ± 0.029 | < 0.001 |
Data are presented as mean ± standard deviation. The same superscript represents the same group in the Bonferroni post hoc test (the alphabetical order [a-f] indicates ascending order). *p values were calculated with repeated measures ANOVA among the six groups. AV50 and AV100 = adaptive statistical iterative reconstruction–V with a blending factor of 50% and 100%, respectively, FBP = filtered back projection, HU = Hounsfield unit, NPSfav = noise power spectrum average spatial frequency, NPSpeak = noise power spectrum peak, TFL, TFM and TFH = TrueFidelity with low, medium and high strength levels, respectively, WED = water equivalent diameter
Fig. 5. Bar graphs of (A) noise magnitude, (B) NPS peak, (C) NPS average spatial frequency, and (D) ERD for six different reconstruction images for all patients.
AV50 and AV100 = ASIR-V with a blending factor of 50% and 100%, respectively, ERD = edge rise distance, FBP = filtered back projection, HU = Hounsfield unit, NPS = noise power spectrum, TFL, TFM and TFH = TrueFidelity with low, medium and high strength levels, respectively
The NPS average spatial frequency significantly shifted towards lower frequencies with the use of higher blending factors in ASiR-V (AV100 > AV50 > FBP) and a higher strength in TrueFidelity (TFH > TFM > TFL > FBP) (Fig. 5C). The NPS average spatial frequencies were significantly higher for TrueFidelity than for ASiR-V in all WED groups.
Quantitative ERD Measurement
ERD measurements are listed in Table 3. In all groups, ERD with TrueFidelity was significantly shorter than that with ASiR-V and FBP (Fig. 5D). Lower TrueFidelity strength resulted in a significantly shorter ERD in all groups (TFL < TFM < TFH). The ERDs of TrueFidelity for all patients were 1.72 mm, 1.74 mm, and 1.77 mm for TFL, TFM, and TFH, respectively, which were 10.9%, 9.8%, and 8.3% lower than the 1.93 mm of FBP, whereas the ERD of AV100 was 1.96 mm, which was 1.6% higher than that for FBP.
Table 3. Summary of Edge Rise Distance Measurement.
| Patients (WED Range) | FBP | AV50 | AV100 | TFL | TFM | TFH | P * |
|---|---|---|---|---|---|---|---|
| All | 1.93d ± 0.44 | 1.92d ± 0.45 | 1.96e ± 0.47 | 1.72a ± 0.41 | 1.74b ± 0.41 | 1.77c ± 0.42 | < 0.001 |
| Group 1 (< 18 cm) | 1.65e ± 0.25 | 1.62d ± 0.25 | 1.64e ± 0.23 | 1.46a ± 0.24 | 1.47b ± 0.24 | 1.48c ± 0.24 | < 0.001 |
| Group 2 (18–23 cm) | 1.95d ± 0.37 | 1.96d ± 0.37 | 2.00e ± 0.37 | 1.75a ± 0.33 | 1.76b ± 0.33 | 1.78c ± 0.33 | < 0.001 |
| Group 3 (> 23 cm) | 2.24d ± 0.48 | 2.25d ± 0.48 | 2.31e ± 0.51 | 2.01a ± 0.44 | 2.05b ± 0.43 | 2.09c ± 0.43 | < 0.001 |
Data are presented as mean ± standard deviation in mm. The same superscript represents the same group in the Bonferroni post hoc test (the alphabetical order [a-e] indicates ascending order). *p values were calculated with repeated measures ANOVA among the six groups. AV50 and AV100 = adaptive statistical iterative reconstruction–V with a blending factor of 50% and 100%, respectively, FBP = filtered back projection, TFL, TFM and TFH = TrueFidelity with low, medium and high strength levels, respectively, WED = water equivalent diameter
Qualitative Image Quality Parameters
The image noise, edge definition, and overall quality ratings for all images are summarized in Table 4. AV100 provided a better image noise assessment score than TrueFidelity, while TrueFidelity achieved a better edge definition than ASiR-V for all patients. For overall quality, TFH scored higher than ASiR-V in all patients. The inter-reader agreement between the two readers was good (κ = 0.65).
Table 4. Summary of Qualitative Visual Analysis Scores.
| Patients (WED Range) | Parameter | FBP | AV50 | AV100 | TFL | TFM | TFH | P * |
|---|---|---|---|---|---|---|---|---|
| All | Image noise | 2.2 ± 0.3 | 2.9 ± 0.5 | 3.8 ± 0.6 | 2.7 ± 0.6 | 3.1 ± 0.7 | 3.5 ± 0.6 | < 0.001 |
| Edge definition | 2.9 ± 0.5 | 2.8 ± 0.5 | 2.2 ± 0.4 | 3.1 ± 0.4 | 3.1 ± 0.5 | 3.2 ± 0.5 | < 0.001 | |
| Overall quality | 2.4 ± 0.5 | 3.0 ± 0.5 | 2.8 ± 0.5 | 2.9 ± 0.6 | 3.1 ± 0.6 | 3.4 ± 0.6 | < 0.001 | |
| Group 1 (< 18 cm) | Image noise | 2.1 ± 0.2 | 2.6 ± 0.3 | 3.5 ± 0.4 | 2.3 ± 0.4 | 2.6 ± 0.5 | 3.2 ± 0.6 | < 0.001 |
| Edge definition | 2.7 ± 0.5 | 2.5 ± 0.5 | 2.0 ± 0.3 | 2.8 ± 0.4 | 2.8 ± 0.4 | 3.0 ± 0.6 | < 0.001 | |
| Overall quality | 2.2 ± 0.4 | 2.7 ± 0.5 | 2.5 ± 0.5 | 2.4 ± 0.5 | 2.6 ± 0.5 | 3.1 ± 0.7 | < 0.001 | |
| Group 2 (18–23 cm) | Image noise | 2.3 ± 0.3 | 3.1 ± 0.5 | 4.0 ± 0.6 | 2.9 ± 0.4 | 3.4 ± 0.4 | 3.5 ± 0.5 | < 0.001 |
| Edge definition | 3.0 ± 0.4 | 3.0 ± 0.3 | 2.3 ± 0.4 | 3.2 ± 0.3 | 3.2 ± 0.4 | 3.3 ± 0.4 | < 0.001 | |
| Overall quality | 2.4 ± 0.4 | 3.1 ± 0.5 | 3.1 ± 0.3 | 3.1 ± 0.4 | 3.3 ± 0.4 | 3.5 ± 0.5 | < 0.001 | |
| Group 3 (> 23 cm) | Image noise | 2.2 ± 0.4 | 3.2 ± 0.6 | 4.1 ± 0.7 | 3.0 ± 0.6 | 3.5 ± 0.6 | 3.8 ± 0.5 | < 0.001 |
| Edge definition | 3.0 ± 0.4 | 3.0 ± 0.5 | 2.1 ± 0.3 | 3.3 ± 0.4 | 3.4 ± 0.5 | 3.4 ± 0.6 | < 0.001 | |
| Overall quality | 2.5 ± 0.5 | 3.1 ± 0.5 | 3.0 ± 0.3 | 3.2 ± 0.5 | 3.4 ± 0.6 | 3.5 ± 0.5 | < 0.001 |
Data are the mean visual scores ± standard deviation. Nemenyi-Wilcoxon-Wilcox all-pairs test was used in the pairwise comparison of all groups. Pairwise comparison results are summarized in Supplementary Tables 2-13. Inter-reader agreement was calculated using a linear-weighted (κ) statistic. The inter-reader agreement between the two readers was substantial (κ = 0.65). *p values were calculated with Friedman rank sum test among the six groups. AV50 and AV100 = adaptive statistical iterative reconstruction–V with a blending factor of 50% and 100%, respectively, FBP = filtered back projection, TFL, TFM and TFH = TrueFidelity with low, medium and high strength levels, respectively, WED = water equivalent diameter
Evaluation of Lesion Detectability and Conspicuity
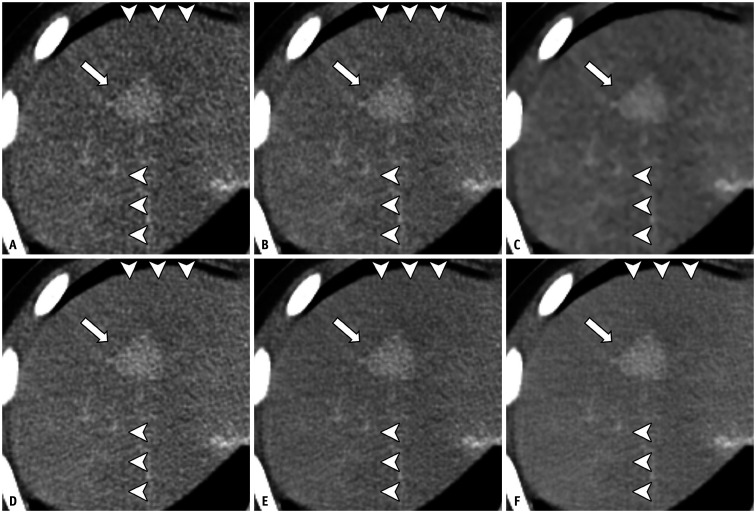
The results of the focal lesion assessments are summarized in Supplementary Table 1. Five patients had focal lesions (renal angiomyolipoma, hepatic hemangioma, ovarian cyst, scrotal mass, and renal cyst) and six patients had perforated (n = 4) or unperforated (n = 2) acute appendicitis (Fig. 6). All lesions were discernible on all reconstructed images without any distortion. TFM (average score = 3) and TFH (average score = 3) scored higher than FBP (average score = 2.5) and AV100 (average score = 2.4) in terms of lesion conspicuity, although inter-reader agreement was poor (κ = 0.38).
Fig. 6. Ten-year-old female patient (WED = 23.2 cm) with hemophagocytic lymphohistiocytosis and small enhancing lesion in hepatic segment VIII.
A-F. The focal hepatic lesion (arrows) is detected on all images FBP (A), AV50 (B), AV100 (C), TFL (D), TFM (E), and TFH (F). Diffuse checkered line-like artifacts are also shown on all images (arrowheads). AV50 and AV100 = ASIR-V with a blending factor of 50% and 100%, respectively, FBP = filtered back projection, TFL, TFM and TFH = TrueFidelity with low, medium and high strength levels, respectively, WED = water equivalent diameter
Evaluation of Artifacts
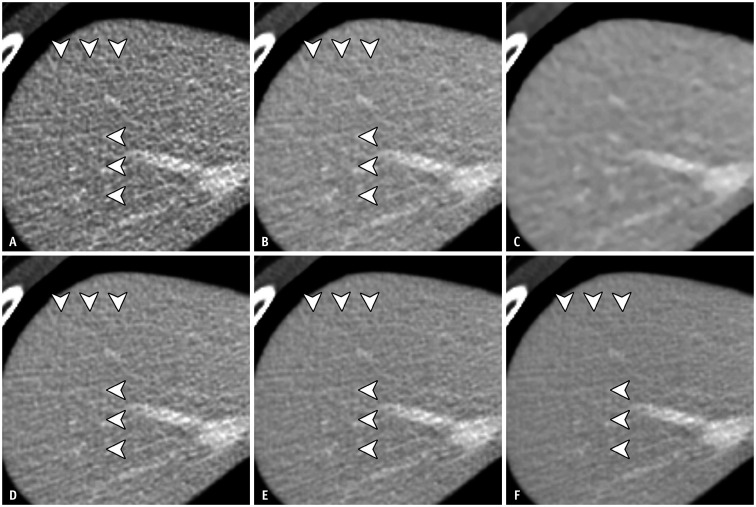
The results of the distortion artifact assessment are summarized in Table 5. There were no intergroup differences in artifact scores between FBP, AV50, TFL, TFM, and TFH; however, AV100 scored significantly higher than the other reconstruction sets in all the WED groups. Although distortion artifacts were noted in most of the TrueFidelity reconstructions (135 cases for reader 1 and 133 cases for reader 2), they were also observed with FBP (37 cases for reader 1, 41 cases for reader 2), AV50 (28 cases for reader 1, 40 cases for reader 2), and AV100 (2 cases for reader 1 and 3 cases for reader 2) (Figs. 6, 7). None of the cases showed distortion artifacts that were reported to affect the diagnostic value. The inter-reader agreement was good (κ = 0.74). Beam-hardening artifacts were observed in the images of six patients, and all cases were scored as grade 2 by both readers.
Table 5. Summary of Distortion Artifact for Six Reconstruction Algorithms.
| Patients (WED Range) | FBP | AV50 | AV100 | TFL | TFM | TFH | P * |
|---|---|---|---|---|---|---|---|
| All | 2.13a ± 0.29 | 2.24a ± 0.33 | 2.94b ± 0.19 | 2.02a ± 0.10 | 2.00a ± 0.00 | 2.00a ± 0.00 | < 0.001 |
| Group 1 (< 18 cm) | 2.27a ± 0.37 | 2.3a, b ± 0.37 | 2.9b ± 0.27 | 2.07a ± 0.18 | 2.00a ± 0.00 | 2.00a ± 0.00 | < 0.001 |
| Group 2 (18–23 cm) | 2.10a ± 0.28 | 2.27a ± 0.37 | 3.00b ± 0.00 | 2.00a ± 0.00 | 2.00a ± 0.00 | 2.00a ± 0.00 | < 0.001 |
| Group 3 (> 23 cm) | 2.03a ± 0.13 | 2.17a ± 0.24 | 2.93b ± 0.18 | 2.00a ± 0.00 | 2.00a ± 0.00 | 2.00a ± 0.00 | < 0.001 |
Data are the mean visual scores ± standard deviation. Nemenyi-Wilcoxon-Wilcox all-pairs test was used in the pairwise comparison of all groups. The same superscript represents the same group in the Nemenyi-Wilcoxon-Wilcox all-pairs test (the alphabetical order [a, b] indicates ascending order). Inter-reader agreement was calculated using a linear-weighted (κ) statistic. The inter-reader agreement between the two readers was good (κ = 0.74). *p values were calculated with Friedman rank sum test among the six groups. AV50 and AV100 = adaptive statistical iterative reconstruction–V with a blending factor of 50% and 100%, respectively. FBP = filtered back projection, TFL, TFM and TFH = TrueFidelity with low, medium and high strength levels, respectively, WED = water equivalent diameter
Fig. 7. Ten-year-old female patient (WED = 20.9 cm) with renal angiomyolipoma (not shown).
A-F. FBP (A), AV50 (B), TFL (D), TFM (E), and TFH (F) show diffuse checkered line-like artifacts (arrowheads). These artifacts are not apparent in AV100 (C). AV50 and AV100 = ASIR-V with a blending factor of 50% and 100%, respectively, FBP = filtered back projection, TFL, TFM and TFH = TrueFidelity with low, medium and high strength levels, respectively, WED = water equivalent diameter
DISCUSSION
This study compared a DLR algorithm with FBP and IR algorithms for the reconstruction of pediatric abdominopelvic CT. In summary, we found that DLR resulted in improved noise characteristics and spatial resolution compared with FBP and IR. The TFH algorithm showed a lower NPS peak than that of the AV100 algorithm for all patients; however, AV100 showed the best noise magnitude reduction, followed by TFH. When the average spatial frequency was measured, AV100 provided a high-frequency shift towards lower frequencies in comparison with FBP, whereas TrueFidelity did not show a distinctive shift in any of the WED groups. In other words, AV100 suppressed the high-frequency components of NPS more than TrueFidelity did. These results are consistent with the fact that the higher the blending factor of ASiR-V, the smoother the image texture observed because the high-frequency component in the frequency domain describes sharp edges in the spatial domain [18]. In comparison, TrueFidelity showed a trivial left shift in the NPS average spatial frequency, a relatively preserved NPS pattern, and a comparable noise magnitude reduction as ASiR-V. These findings suggest that TrueFidelity provides relatively uniform noise reduction in the frequency domain, and as a result, provides superior image sharpness while maintaining comparable image noise suppression as ASiR-V.
In the ERD measurement, TrueFidelity resulted in a significantly shorter ERD than FBP, with an 8.3%–10.9% reduction for all patients, whereas ASiR-V and FBP showed similar ERD. This implies that TrueFidelity provides better spatial resolution than ASiR-V. ERD, which is inversely proportional to the modulation transfer function (MTF), reflects spatial resolution, and has been employed to measure margin sharpness in several studies [8,13,19,20]. Although both the high blending factor ASiR-V and high-strength TrueFidelity resulted in a high image noise score for all patients, TFH showed better edge definition and overall quality scores than FBP and ASiR-V.
Our results support previously published studies using the same vendor platform [9,11,16,21,22,23]. In phantom studies, TrueFidelity reduced noise without changing the noise texture and improved spatial resolution [22,23]. In patient studies, TrueFidelity showed reduced image noise and qualitatively better spatial resolution and image quality scores than ASiR-V [9,11,21]. A recent study assessed the image sharpness of TrueFidelity using blur metrics and showed that TrueFidelity resulted in improved image sharpness compared with ASiR-V in the imaging of adult patients [11]. Moreover, DLR offered better image quality than IR in phantom and patient studies, even on different platforms [8,10,12,13,24]. Brady et al. [10] showed that DLR is beneficial in pediatric body CT because it can improve the image quality, allowing a reduced radiation dose. They analyzed the object detectability by calculating the task transfer function on phantom images and measuring the NPS on patient images. Using ERD measurement, Tatsugami et al. [13] and Hong et al. [8] demonstrated that edges were sharper on DLR images than on hybrid IR images.
Diffuse line-like “checkered pattern” artifacts in chest CT images of adult populations were assessed in a recent study [16], and it was found that distortion artifacts were more frequent with the DLR algorithm; however, they seemed to have a negligible effect on diagnostic image quality. In our study, distortion artifacts were detected in most DLR images and were also observed in the FBP and ASiR-V images. We hypothesize that the distortion artifacts were due to the characteristics of the CT scanner hardware or reconstruction algorithm, rather than the DLR itself. Further studies are required to address this issue.
This study had several limitations. First, phantom studies were not evaluated to measure the MTF for spatial resolution assessment. Although the MTF in patient studies may be derived from the correlation between phantom and patient studies, the primary objective of this study was to measure the noise characteristics and spatial resolution of the patient images. Second, the ERD was measured only at the muscle and fat interfaces. Because the system resolution depends on the object contrast and background noise level, ERD can also be affected by these factors [25]. However, MTF values at different interfaces were similar in previous studies [22,23]. Therefore, one interface was selected to simplify the ERD measurement process. Third, quantitative analysis by a single radiologist could be subject to bias, especially in the selection of measurement locations. To reduce selection bias, the same anatomical locations were used for the NPS and ERD measurements. Fourth, potential dose reduction using DLR could not be estimated because low-dose CT scans were not included in this study. Finally, the patients’ age, weight, and body size were heterogeneous. Because the radiation dose received by a patient depends on both the patient size and scanner output, the concept of WED was adopted to obtain accurate information for patients of varied sizes. This study revealed that DLR has the potential to improve spatial resolution while providing denoising performance similar to that of other commonly used algorithms, even in low-WED groups with a low radiation dose.
In conclusion, our study revealed that for contrast-enhanced pediatric abdominopelvic CT, DLR may provide improved noise characteristics and spatial resolution compared with hybrid IR. Additionally, DLR showed better overall quality and edge definition than the hybrid IR. Further studies are needed to investigate the performance of DLR in various clinical applications, particularly with respect to different dose levels, body parts, and acquisition techniques.
Acknowledgments
Special thanks to Jihwan Kim, Kun Hee Kim and Woo seok Choi for assistance in data curation.
Footnotes
Conflicts of Interest: The authors have no potential conflicts of interest to disclose.
- Conceptualization: Wookon Son, MinWoo Kim, Jae-Yeon Hwang.
- Data curation: Wookon Son, MinWoo Kim, Jae-Yeon Hwang, Yong-Woo Kim, Joo Yeon Jang.
- Formal analysis: Wookon Son, MinWoo Kim, Jae-Yeon Hwang.
- Investigation: Wookon Son, MinWoo Kim, Jae-Yeon Hwang, Chankue Park, Ki Seok Choo, Tae Un Kim, Joo Yeon Jang.
- Methodology: Wookon Son, MinWoo Kim, Jae-Yeon Hwang.
- Project administration: Jae-Yeon Hwang.
- Resources: Jae-Yeon Hwang.
- Software: MinWoo Kim.
- Supervision: Jae-Yeon Hwang.
- Validation: all authors.
- Visualization: Wookon Son, MinWoo Kim.
- Writing—original draft: Wookon Son, MinWoo Kim, Jae-Yeon Hwang.
- Writing—review & editing: all authors.
Funding Statement: None
Availability of Data and Material
All data generated or analyzed during the study are included in this published article (and its supplement).
Supplement
The Supplement is available with this article at https://doi.org/10.3348/kjr.2021.0466.
References
- 1.Brody AS, Frush DP, Huda W, Brent RL American Academy of Pediatrics Section on Radiology. Radiation risk to children from computed tomography. Pediatrics. 2007;120:677–682. doi: 10.1542/peds.2007-1910. [DOI] [PubMed] [Google Scholar]
- 2.Ehman EC, Yu L, Manduca A, Hara AK, Shiung MM, Jondal D, et al. Methods for clinical evaluation of noise reduction techniques in abdominopelvic CT. Radiographics. 2014;34:849–862. doi: 10.1148/rg.344135128. [DOI] [PubMed] [Google Scholar]
- 3.Geyer LL, Schoepf UJ, Meinel FG, Nance JW, Jr, Bastarrika G, Leipsic JA, et al. State of the art: iterative CT reconstruction techniques. Radiology. 2015;276:339–357. doi: 10.1148/radiol.2015132766. [DOI] [PubMed] [Google Scholar]
- 4.Singh S, Kalra MK, Hsieh J, Licato PE, Do S, Pien HH, et al. Abdominal CT: comparison of adaptive statistical iterative and filtered back projection reconstruction techniques. Radiology. 2010;257:373–383. doi: 10.1148/radiol.10092212. [DOI] [PubMed] [Google Scholar]
- 5.Smith EA, Dillman JR, Goodsitt MM, Christodoulou EG, Keshavarzi N, Strouse PJ. Model-based iterative reconstruction: effect on patient radiation dose and image quality in pediatric body CT. Radiology. 2014;270:526–534. doi: 10.1148/radiol.13130362. [DOI] [PMC free article] [PubMed] [Google Scholar]
- 6.Willemink MJ, Noel PB. The evolution of image reconstruction for CT-from filtered back projection to artificial intelligence. Eur Radiol. 2019;29:2185–2195. doi: 10.1007/s00330-018-5810-7. [DOI] [PMC free article] [PubMed] [Google Scholar]
- 7.Solomon J, Samei E. Quantum noise properties of CT images with anatomical textured backgrounds across reconstruction algorithms: FBP and SAFIRE. Med Phys. 2014;41:091908. doi: 10.1118/1.4893497. [DOI] [PubMed] [Google Scholar]
- 8.Hong JH, Park EA, Lee W, Ahn C, Kim JH. Incremental image noise reduction in coronary CT angiography using a deep learning-based technique with iterative reconstruction. Korean J Radiol. 2020;21:1165–1177. doi: 10.3348/kjr.2020.0020. [DOI] [PMC free article] [PubMed] [Google Scholar]
- 9.Kim JH, Yoon HJ, Lee E, Kim I, Cha YK, Bak SH. Validation of deep-learning image reconstruction for low-dose chest computed tomography scan: emphasis on image quality and noise. Korean J Radiol. 2021;22:131–138. doi: 10.3348/kjr.2020.0116. [DOI] [PMC free article] [PubMed] [Google Scholar]
- 10.Brady SL, Trout AT, Somasundaram E, Anton CG, Li Y, Dillman JR. Improving image quality and reducing radiation dose for pediatric CT by using deep learning reconstruction. Radiology. 2021;298:180–188. doi: 10.1148/radiol.2020202317. [DOI] [PubMed] [Google Scholar]
- 11.Park C, Choo KS, Jung Y, Jeong HS, Hwang JY, Yun MS. CT iterative vs deep learning reconstruction: comparison of noise and sharpness. Eur Radiol. 2021;31:3156–3164. doi: 10.1007/s00330-020-07358-8. [DOI] [PubMed] [Google Scholar]
- 12.Shin YJ, Chang W, Ye JC, Kang E, Oh DY, Lee YJ, et al. Low-dose abdominal CT using a deep learning-based denoising algorithm: a comparison with CT reconstructed with filtered back projection or iterative reconstruction algorithm. Korean J Radiol. 2020;21:356–364. doi: 10.3348/kjr.2019.0413. [DOI] [PMC free article] [PubMed] [Google Scholar]
- 13.Tatsugami F, Higaki T, Nakamura Y, Yu Z, Zhou J, Lu Y, et al. Deep learning-based image restoration algorithm for coronary CT angiography. Eur Radiol. 2019;29:5322–5329. doi: 10.1007/s00330-019-06183-y. [DOI] [PubMed] [Google Scholar]
- 14.Anam C, Haryanto F, Widita R, Arif I, Dougherty G. Automated calculation of water-equivalent diameter (DW) based on AAPM Task Group 220. J Appl Clin Med Phys. 2016;17:320–333. doi: 10.1120/jacmp.v17i4.6171. [DOI] [PMC free article] [PubMed] [Google Scholar]
- 15.Smith SW. The scientist and engineer’s guide to digital signal processing. San Diego: California Technical Pub; 1997. [Google Scholar]
- 16.Nam JG, Hong JH, Kim DS, Oh J, Goo JM. Deep learning reconstruction for contrast-enhanced CT of the upper abdomen: similar image quality with lower radiation dose in direct comparison with iterative reconstruction. Eur Radiol. 2021;31:5533–5543. doi: 10.1007/s00330-021-07712-4. [DOI] [PubMed] [Google Scholar]
- 17.Landis JR, Koch GG. The measurement of observer agreement for categorical data. Biometrics. 1977;33:159–174. [PubMed] [Google Scholar]
- 18.Gonzalez RC, Woods RE. Digital image processing. 4th ed. London: Pearson; 2018. pp. 272–295. [Google Scholar]
- 19.Tatsugami F, Higaki T, Sakane H, Fukumoto W, Kaichi Y, Iida M, et al. Coronary artery stent evaluation with model-based iterative reconstruction at coronary CT angiography. Acad Radiol. 2017;24:975–981. doi: 10.1016/j.acra.2016.12.020. [DOI] [PubMed] [Google Scholar]
- 20.Suzuki S, Machida H, Tanaka I, Ueno E. Vascular diameter measurement in CT angiography: comparison of model-based iterative reconstruction and standard filtered back projection algorithms in vitro. AJR Am J Roentgenol. 2013;200:652–657. doi: 10.2214/AJR.12.8689. [DOI] [PubMed] [Google Scholar]
- 21.Jensen CT, Liu X, Tamm EP, Chandler AG, Sun J, Morani AC, et al. Image quality assessment of abdominal CT by use of new deep learning image reconstruction: initial experience. AJR Am J Roentgenol. 2020;215:50–57. doi: 10.2214/AJR.19.22332. [DOI] [PubMed] [Google Scholar]
- 22.Solomon J, Lyu P, Marin D, Samei E. Noise and spatial resolution properties of a commercially available deep learning-based CT reconstruction algorithm. Med Phys. 2020;47:3961–3971. doi: 10.1002/mp.14319. [DOI] [PubMed] [Google Scholar]
- 23.Greffier J, Hamard A, Pereira F, Barrau C, Pasquier H, Beregi JP, et al. Image quality and dose reduction opportunity of deep learning image reconstruction algorithm for CT: a phantom study. Eur Radiol. 2020;30:3951–3959. doi: 10.1007/s00330-020-06724-w. [DOI] [PubMed] [Google Scholar]
- 24.Higaki T, Nakamura Y, Zhou J, Yu Z, Nemoto T, Tatsugami F, et al. Deep learning reconstruction at CT: phantom study of the image characteristics. Acad Radiol. 2020;27:82–87. doi: 10.1016/j.acra.2019.09.008. [DOI] [PubMed] [Google Scholar]
- 25.Yu L, Vrieze TJ, Leng S, Fletcher JG, McCollough CH. Technical note: measuring contrast- and noise-dependent spatial resolution of an iterative reconstruction method in CT using ensemble averaging. Med Phys. 2015;42:2261–2267. doi: 10.1118/1.4916802. [DOI] [PMC free article] [PubMed] [Google Scholar]
Associated Data
This section collects any data citations, data availability statements, or supplementary materials included in this article.
Supplementary Materials
Data Availability Statement
All data generated or analyzed during the study are included in this published article (and its supplement).


