Abstract
Introduction
A global reduction in influenza virus activity during the COVID-19 pandemic has been observed, including in the Eastern Mediterranean Region (EMR). However, these changes have not been thoroughly evaluated scientifically in the EMR.
Objective
We aim to present data on seasonal influenza activity during the pre-pandemic period (2016–2019) and compare it to the pandemic period (2020–2021) in EM countries.
Methods
Epidemiological and virological influenza surveillance data were retrieved from both WHO FluNet and EMFLU networks. Four pre-pandemic analytical periods were used in the comparative analysis. We compiled and calculated weekly aggregated epidemiological data on the number of enrolled patients, number of tested specimens and number of positive influenza specimens.
Results
19 out of the 22 countries of the EMR have functioning sentinel influenza surveillance systems, and these countries report the influenza data to WHO through FluNet and EMFLU. The number of enrolled patients and tested specimens increased gradually from 51 384 and 50 672, respectively, in 2016–2017 analytical period to 194 049 enrolled patients and 124 697 tested specimens in 2019–2020. A decrease has been witnessed in both enrolled patients and tested specimens in 2020–2021 ‘pandemic period’ (166 576 and 44 764, respectively). By comparing influenza activity of analytical period 2020–2021 with that of 2016–2019 analytical periods, we found that there has been a decrease in influenza positivity rate in the EMR by 89%.
Conclusion
The implementation of non-pharmaceutical interventions to control the COVID-19 pandemic may have also impacted the spread of influenza viruses. The low circulation of influenza viruses during 2020–2021 and the associated potential immunity gap may result in increased transmission and severity of post-pandemic influenza seasons. This necessitates high vigilance to continuous data and virus sharing to monitor circulating viruses in a timely fashion to reduce the intensity and severity of future influenza epidemics.
Keywords: COVID-19, respiratory infections
WHAT IS ALREADY KNOWN ON THIS TOPIC
A decline in influenza virus activity during COVID-19 pandemic has been observed globally including in the Eastern Mediterranean Region (EMR), however, it has not been well described and characterised in the latter.
In our study, we aim to present data on seasonal influenza activity during the pre-pandemic period (2016–2019) and compare it to the pandemic period (2020–2021) in countries of the EMR, through highlighting a number of factors that might be associated to this decline.
WHAT THIS STUDY ADDS
After analysing influenza data in the EMR countries, similar decrease in influenza activity was observed, matching the decrease witnessed globally.
Interventions aimed against SARS-CoV-2 transmission may be the reason for the low influenza activity witnessed globally as well as in EMR.
Despite that the observed reduction in influenza activity during the pandemic is likely due to the spill-over effect of non-pharmaceutical intervention as explained in literature, we cannot exclude the disruption that occurred to sentinel surveillance systems in EMR, deeming these systems are dysfunctional in many countries, in explaining the decrease in enrolled patients and tested specimens observed during the pandemic.
HOW THIS STUDY MIGHT AFFECT RESEARCH, PRACTICE AND/OR POLICY
COVID-19 has proven that pandemics can result from non-influenza viral origin, hence necessitating the call for resilient and more comprehensive surveillance systems to be able to detect any emerging pathogen X in the future.
Our study highlights the need to enhance, more than ever, the well-established infrastructure of sentinel influenza surveillance systems, promoting the integration of SARS-CoV-2 and other respiratory pathogens of epidemic and pandemic potential.
Good quality data emerging from these structured systems, not to mention the data being shared on timely manner, is key to steering policy measures by adopting robust preventive and response measures.
Introduction
The influenza season in the Eastern Mediterranean Region (EMR) spans on average from week 36 until week 18 (early September of current year until early May of following year), with minor differences in the timing of the onset and end of the season between countries as well as the number of influenza peak activity observed during the same year; the latter especially in tropical and equatorial countries.1–3 In the seasons preceding the coronavirus disease 2019 (COVID-19) pandemic, from seasons 2016/2017 until 2019/2020, countries of the EMR reported to the WHO a total of 381 756 specimens tested for influenza virus of which 83 940 (22%) tested positive.1 2 EMR comprises 22 countries spanning different influenza transmission zones (online supplemental map).
bmjgh-2022-008506supp001.pdf (57.8KB, pdf)
The severe acute respiratory syndrome coronavirus 2 (SARS-CoV-2) was first identified in China during the 2019–2020 northern hemisphere influenza season, following which an early decline in the influenza virus activity was observed globally.3 The decrease in influenza activity during COVID-19 pandemic varied among regions.3–5 In several countries, there was either no observed influenza seasonal activity or few reported cases from several countries.3 In Western Africa, however, influenza activity was detected during the second half of 2020.1 In addition to influenza virus, low activity of other respiratory viruses has been reported in several countries.6 For instance, in the USA, seasonal activity for influenza viruses, respiratory syncytial virus, seasonal human coronaviruses, parainfluenza viruses and human metapneumovirus have been suppressed during the pandemic period.7 The decline in influenza and other respiratory viruses’ circulation has been attributed mainly to infection prevention and control (IPC) measures as well as non-pharmaceutical interventions (NPIs) implemented to mitigate the spread and impact of SARS-CoV-2.8 9
A decline in influenza virus activity has also been observed in the WHO EMR, but it has not been well described and characterised. Therefore, in this study, we will present data on seasonal influenza activity during the pre-pandemic period (2016–2019) and compare it to the pandemic period (2020–2021) in countries of the EMR.
Methods
Epidemiological data
Functioning sentinel influenza surveillance systems were present in 19 out of the 22 countries of the EMR, and these countries report the influenza data to WHO through FluNet and EMFLU (global and regional influenza surveillance platforms, respectively). We analysed influenza data reported by EM countries to both FluNet and EMFLU from week 27 of year 2016 to week 33 of year 2021. We extracted data on the weekly aggregated number of enrolled patients, number of total tested specimens, number of positive influenza specimens and number of positive influenza A and influenza B specimens. Influenza activity from the pandemic period (2020/2021) is described and data from four previous seasons were used for comparison. On an yearly basis, Member States of each WHO region is assessed on their reporting status, consistency in reporting and timeliness (weekly reporting of both virological and epidemiological data).
Because peak activity of influenza virus in the EMR is in winter season, the results of the analysis were reported over a ‘6 months shifted year’ (ie, week 27 of the current year to week 26 of the following year which is from early July of the current year until late June of the following year). The selected analytical period includes the start and the end of the four pre-COVID-19 pandemic influenza seasons included in the study. The start and the end of the four pre-COVID-19 pandemic influenza seasons included in the study were assessed, using the Pandemic Influenza Severity Assessment (PISA) guideline, by first computing an epidemic threshold defined as the median value of the weekly influenza percentage positive for the four pre-COVID pandemic influenza seasons. For each of the four influenza seasons the first and last week with weekly percentage positive above the epidemic threshold were considered as the weeks in which the influenza season started and ended, respectively. In the EMR the influenza season started on average on week 36 (early September) (range across the four seasons: week 33 to week 40 which is from mid-August until early October) and ended on average on week 18 (early May) of the following year (range across the four seasons: week 10 to week 26 which is early March until the end of June).
In EMFLU, influenza data are collected from countries by using one of the following ways: case-based data entered online from sentinel sites or collected data by Ministry of Health teams from sentinel sites in Excel template and uploaded to the EMFLU by using the import function, or aggregated data by age and sex entered online or sent to the regional office to be uploaded to EMFLU. Standardised aggregated age groups are as follows: <2 years, 2 to <5 years, 5 to <15 years, 15 to <50 years, 50 to <65 years and 65 years and above.
Virological data
Countries of the EMR regularly report the virological data on FluNet and EMFLU networks. Capacity to perform molecular testing (RT-PCR) is available in 21 out of the 22 countries in the EMR, while genetic characterisation is done by countries of the EMR with varying laboratory capacities. There are 18 National Influenza Centres (NICs) and 3 National Influenza Laboratories in the EMR, and these laboratories are coordinating their work closely with EM WHO Laboratory team. The following data sets are reported on a weekly basis: total number of influenza types (A and B); total number of influenza A subtypes (A (H3)), H1N1 pdmo9, A (H5), (influenza A not subtyped)); total number of influenza B lineages (Victoria and Yamagata) and influenza B lineage not determined.
Results
In 2016, there were 15 countries in the EMR with functional sentinel influenza surveillance system reporting to EMFLU/FluNet. This number increased to 19 countries in 2019 and 2020. In 2021 (up to week 33), only 17 countries in the EMR had activated sentinel influenza systems. Fourteen countries in the EMR reported positive influenza cases in 2016. This number increased to 18 in 2017 and 2018 and to 19 in 2019, to decrease again to 18 in 2020 and then to only 11 countries in 2021 up to week 33 (table 1).
Table 1.
Number of countries with functional sentinel influenza surveillance system and number of countries reporting positive influenza cases by year, EM countries, 2016–2021 (up to week 33)
| No of EM countries with functional sentinel influenza surveillance system | No of EM countries reporting positive influenza cases | |
| 2016 | 15 | 14 |
| 2017 | 18 | 18 |
| 2018 | 18 | 18 |
| 2019 | 19 | 19 |
| 2020 | 19 | 18 |
| 2021 | 17 | 11 |
EM, Eastern Mediterranean.
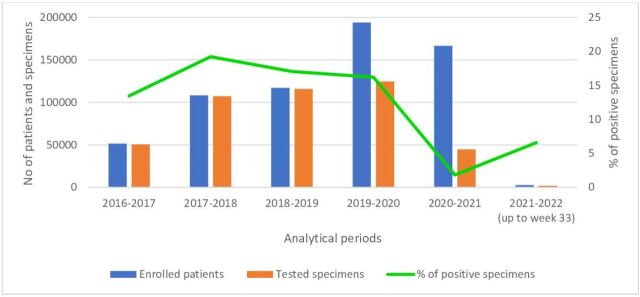
The number of enrolled patients and tested specimens increased gradually from 51 384 and 50 672, respectively, in 2016–2017 analytical period to 194 049 enrolled patients and 124 697 tested specimens in 2019–2020. A decrease has been witnessed in both enrolled patients and tested specimens in 2020–2021 ‘pandemic period’ (166 576 and 44 764, respectively). In 2021–2022 (up to week 33) analytical period, only 2740 patients enrolled and only 1980 specimens have been tested in the EMR (figure 1).
Figure 1.
Number of enrolled patients, tested specimens and per cent positive influenza specimens by analytical period, Eastern Mediterranean countries, from 2016–2017 until 2021–2022 (up to week 33).
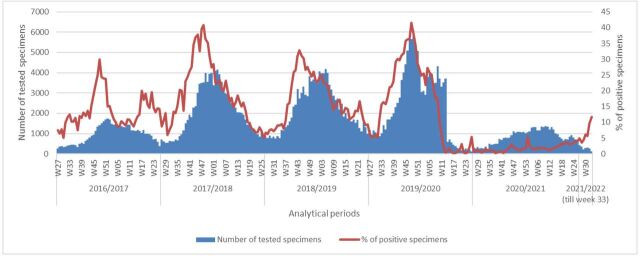
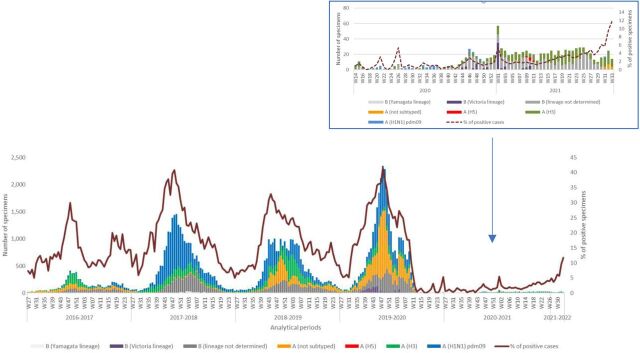
The total number of tested specimens increased gradually from 2016 to 2017 until 2019–2020 analytical periods, testing 6061 tested specimens in week 49 of that period, the highest number in the past four analytical periods. The total number of tested specimens started to decrease starting week 14 in the year 2020 and remained below 1000 tested specimens per week until week 46 in the year 2020. Finally, the total number of tested specimens in 2020–2021 analytical period exceeded 1000 specimen per week from week 47 in the year 2020 to decrease again to 119 tested specimens in week 33 of the year 2021. However, per cent specimen influenza positivity is showing an increasing trend since week 15 of 2020–2021 analytical period (figure 2).
Figure 2.
Number of specimens tested and percentage of positive tests for influenza, by analytical period, Eastern Mediterranean Region, from 2016–2017 until 2021–2022 (up to week 33). W, week.
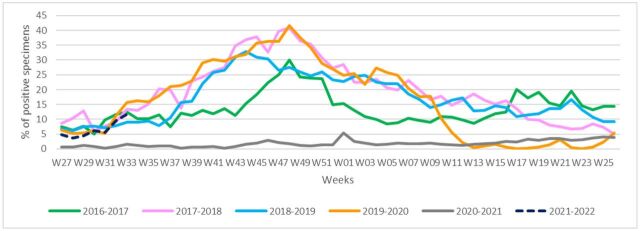
In 2016–2017 analytical period, a peak in per cent influenza positivity was observed in week 48 of the year 2016 (30%). Per cent influenza positivity for the next analytical periods was as follows: week 48 in the year 2017 (41%), week 44 in the year 2018 (33%) and week 48 in the year 2019 (41.5%) for 2017–2018, 2018–2019 and 2019–2020, respectively. In analytical period of 2020–2021, the peak was observed in week 01 of the year 2021 (5%). During 2020–2021 season, influenza activity was the lowest during any previous influenza season since 2016–2017. Increasing trend of per cent influenza positivity is detected in early 2021–2022 analytical period, up until week 33 of the year 2021 (figure 3).
Figure 3.
Percentage of specimens testing positive for influenza viruses, by week (W), Eastern Mediterranean Region, from 2016–2017 until 2021–2022 (up to week 33).
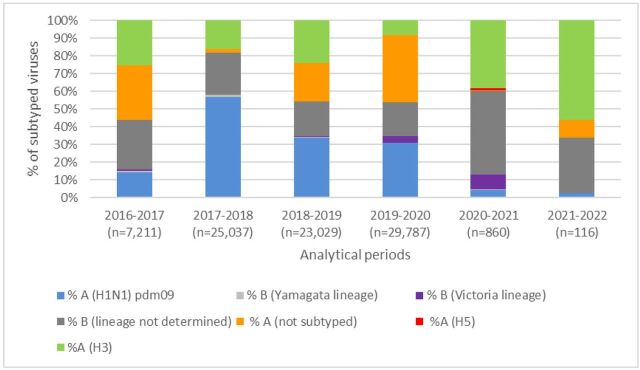
In analytical period 2016–2017, a total of 7211 specimens were tested with influenza A (not subtyped) being the most common virus (31%). In 2017–2018 analytical period, the number of tested specimens increased to 25 037 of which 55% of subtyped viruses were influenza A (H1N1) and pdm09 followed by influenza B lineage not determined (24%). In 2018–2019 analytical period, influenza A (H1N1) pdm09 remained the major circulating virus in the EMR (34%), with other detected viruses at similar rates: 24% influenza A (H3), 21% influenza A not subtyped and 20% influenza B lineage not determined. In 2019–2020 analytical period, the major circulating subtype was influenza A not subtyped (38%) with other circulating subtyped and lineages: influenza A (H1N1) pdm09, influenza B lineage not determined and influenza A (H3). Influenza B (Victoria lineage) constituted 4% of the total 29 787 tested specimens. In 2020–2021 analytical period, only 860 specimens were tested, of which the major circulating virus was influenza B lineage not determined (47%) followed by influenza A (H3) (38%). Influenza B (Victoria lineage) constituted 8% of total tested specimens. In analytical period 2021–2022 up to week 33, a total of 116 specimens were collected, with major detected virus being influenza A (H3) (56%) (figures 4 and 5). Additionally, eight influenza A (H5) specimens were detected in the region (Iraq) during 2020–2021 analytical period.
Figure 4.
Percentage of subtyped influenza viruses by analytical period, Eastern Mediterranean Region, from 2016–2017 until 2021–2022 (up to week 33).
Figure 5.
Number of specimens by subtyped influenza viruses and percentage of specimens testing positive for influenza viruses, by analytical periods, Eastern Mediterranean Region, from 2016–2017 until 2021–2022 (up to week 33). W, week.
The number of reported cases by age group increased from 1537 cases in 2016–2017 to 2656 cases in 2018–2019 analytical period. Reported cases by age group decreased to 2107 cases in 2019–2020 analytical period and 1465 cases in 2020–2021 analytical period. In the pre-pandemic analytical periods, two major age groups dominated the reported cases: <2 years and 15 to <50 years, with minor fluctuation throughout the analytical periods. In analytical periods 2020–2021 age group 15 to <50 years remained the dominant age group. The age group 65 years and above increased to 19% in 2020–2021 analytical period (online supplemental figure 1).
bmjgh-2022-008506supp002.pdf (264.6KB, pdf)
Discussion
Effective surveillance is a cornerstone of pandemic influenza preparedness that allows the early detection and response to influenza outbreaks that is essential to mitigate impact to inform response measures including vaccine composition and other public health measures. National and global systems for laboratory and epidemiological surveillance need to be robust in order to capture good quality data on a timely manner to be able to support risk and severity assessments at country, regional and global levels as well as to detect the emerging of novel respiratory viruses. Member States are encouraged to share their influenza data with WHO’s FluMart and/or EMFLU platforms on a regular basis. While it is not within the scope of the study to assess surveillance system sensitivity and data quality, yet the need to conduct such surveillance system evaluations to assess quality of data that feeds into these platforms as well assess timeliness of this data are crucial to validate the meaningfulness of the information generated from this data and its use, especially at times of stress and disruptions, as the case of a pandemic.
By comparing influenza activity of analytical period 2020–2021 with that of 2016–2019 analytical periods, we found that there has been a decrease in influenza positivity rate in the EMR by 89%. If not for the pandemic, influenza activity around the world would have likely remained consistent during the 2020–2021 analytical period.4 8 A similar decrease in influenza positivity has been seen in several WHO regions, with very few exceptions.3 4 8 Interventions aimed against SARS-CoV-2 transmission may be the reason for the low influenza activity witnessed globally.7 9 10 The IPCs and NPIs measures that are adopted to prevent the spread of COVID-19 in communities are similar to those recommended for other respiratory diseases, such as influenza.3 9 11–13 Nonetheless, countries worldwide adopted a different set of NPIs to mitigate the spread of SARS-CoV-2, including differences in timing of implementation, degree of stringency and extent/duration. Other differences may relate to the level of compliance of the public vis-à-vis NPIs.9 10 Further research is needed to improve understanding on the effectiveness of these NPIs, each implemented alone or combined, and their relationship in affecting transmission dynamics of SARS-CoV-2 and the subsequent impact on other respiratory viruses, such as influenza.3 10This potentially explains part of the decrease in influenza activity during the pandemic period.9 14
On average, the influenza activity in EMR starts to decline between weeks 16 and 18 of every season (mid-April to early May); however, declines in influenza activity started earlier for the analytical period 2019–2020, particularly in week 07 of the year 20201 2 (mid-February) (figure 2). Similarly in EMR, throughout the analytical period of 2020–2021, there was a recorded decline in influenza virus activity most likely due to a merging of similar mentioned factors such as the implementation of IPC measures and NPIs adopted by countries to control the spread of SARS-CoV-2, such as travel restrictions, lockdowns, closure of schools and workplaces, as well as preventing gatherings.7 8 14 15
During 2016–2018, around 18 countries in the region had functional sentinel influenza surveillance systems and were reporting data to both EMFLU and FluNet.1 2 However, in 2021 fewer countries routinely reported their data. This may be due to difficulties in maintaining influenza surveillance because of overwhelmed staff due to a diversion of influenza staff to respond to the COVID-19 pandemic. As for NICs, besides the overstretched laboratory teams, one cannot underestimate the impact of shortage in laboratory reagents and kits as well challenges in shipping specimens due to travel restrictions on the decreased number of tested and shared specimens globally and in the EMR.
In analytical period 2020–2021, there was an increase in enrolled patients at sentinel sites in EMR; however, we observed a decline in the number of specimens tested for influenza in the same analytical period (44 764 specimens out of 166 576 enrolled patients). This indicates that a high volume of patients with respiratory symptoms presented at healthcare facilities during the COVID-19 pandemic; nonetheless health professionals may have been prioritising COVID-19 diagnostics, overlooking influenza.6 7 16 17 As for the first part of 2020–2021 analytical period, impact of changes in the health seeking behaviour due to COVID-19 pandemic continue to be reflected in fewer enrolled patients (only 2740 patients up to week 33 in the year 2021).7 16 Despite the low number of enrolled patients in early 2021–2022 analytical period, the percentage of influenza positive cases in the EMR is showing increased trends similar to that of pre-pandemic analytical periods. As COVID-19 mitigation practices are eased, the circulation of influenza viruses may increase to levels similar to that of pre-pandemic analytical period.2 8 14 18 Hence, it is recommended that countries of the EMR remain vigilant for the start of a potentially forthcoming influenza season.
Whereas the implementation of NPIs has been identified as the main driver of the observed decline in influenza virus activity worldwide, the competition of SARS-CoV-2 with other viruses may also have played a role.3 Some studies have shown that the risk of coinfection with SARS-CoV-2 and influenza is low.3 This viral interaction and competition have been also observed between influenza viruses and other respiratory viruses such as respiratory syncytial virus, rhinoviruses, adenoviruses and parainfluenza viruses, where each virus’ activity can affect the other.3
On another note, influenza vaccination rollout in all countries is a crucial measure to prevent influenza cases and control potential upcoming epidemics. Public health officials fear that reduced circulation of influenza viruses in the previous season may have an impact on the severity of the upcoming influenza season due to a decrease in natural exposure to influenza viruses and hence prolonged absence of community immunity.3 12 14 18 Adding on that, influenza vaccination activities were reduced in pandemic period, where vaccination was focused mainly against SARSCoV-2.3 14 Now that the schools are re-opening, with less children being exposed naturally to influenza viruses, there is fear for a more widespread outbreaks and a more severe season.14 18
Whether we will have masked influenza season in 2021–2022 or there will be skyrocketing in cases that will overwhelm the healthcare system of countries is still unknown. The extent to which mitigation measures for COVID-19 will be implemented, the pandemic’s severity or fading away in the coming fall/winter season, and the compatibility of the circulating viruses with the vaccine are all driving factors that dictate which of the mentioned scenarios shall prevail.14
Our study has limitations that warrant discussion. First, we made use of weekly aggregated data reported to WHO by Member States. This does not allow us to describe the changes that occurred in the influenza surveillance systems or define objective indicators of the quality of the surveillance systems, beside the observation of reduced number of specimens collected and tested for influenza. Second, we used influenza per cent positive as an indicator to assess the variation in influenza virus activity during the pandemic. However, the robustness of this indicator in the context of the impact of the COVID-19 pandemic on sentinel surveillance cannot be evaluated. Third, while the observed reduction in influenza percentage positive during the pandemic period is likely due to the spill-over effect of NPI aiming at reducing SARS-CoV-2 transmission, we cannot exclude that intrinsic changes in case ascertainment or age distribution of enrolled cases may have affected the observed influenza percentage positivity during the pandemic period.
Conclusion
In conclusion, as the world is still in the middle of a respiratory pandemic, it is time to reflect and benefit from lessons learnt across regions and countries to highlight successes from the COVID-19 response and start planning to address challenges that will come in the years ahead. This brings us back to preparedness; our only way to remain a step ahead in our battle against viruses. Hence, countries are requested to maintain and sustain or heighten vigilance and commit to continuing data and virus sharing as well as maintaining good performance indicators at both epidemiological and virological surveillance levels that can be illustrated in good quality data shared on timely manners to WHO global or regional platforms.
By saying that, we acknowledge the fact that COVID-19 is here to stay, at least for the coming years, and that new respiratory viruses may emerge in the future, necessitating resilient and comprehensive surveillance systems where efforts to enhance and fine-tune these integrated approaches without one virus masking the other is crucial. Now, more than ever, the Global Influenza Surveillance and Response System is promoting a global roadmap to adopt an integrated surveillance approach to include SARS-CoV-2 and other respiratory pathogens of epidemic and pandemic potential, making use of the already established infrastructure of the influenza sentinel surveillance system in countries.19 This commitment will help the world to closely monitor circulating viruses and timely detect and respond to any unusual activity that can result into large-scale outbreaks (or epidemics) of seasonal influenza and/or other emerging and re-emerging respiratory viruses.
Acknowledgments
We are grateful to the Member States of Eastern Mediterranean countries for their influenza data sharing throughout the years.
Footnotes
Handling editor: Seye Abimbola
Contributors: HAEN, WK and AB conceived and designed the study. HAEN conducted the analysis. All coauthors reviewed and validated it. HAEN prepared the first draft, with further input from all authors. The corresponding author attests that all listed authors meet authorship criteria and that no others meeting the criteria have been omitted. AB is the guarantor.
Funding: The authors have not declared a specific grant for this research from any funding agency in the public, commercial or not-for-profit sectors.
Map disclaimer: The inclusion of any map (including the depiction of any boundaries therein), or of any geographical or locational reference, does not imply the expression of any opinion whatsoever on the part of BMJ concerning the legal status of any country, territory, jurisdiction or area or of its authorities. Any such expression remains solely that of the relevant source and is not endorsed by BMJ. Maps are provided without any warranty of any kind, either express or implied.
Competing interests: None declared.
Patient and public involvement: Patients and/or the public were not involved in the design, or conduct, or reporting, or dissemination plans of this research.
Provenance and peer review: Not commissioned; externally peer reviewed.
Supplemental material: This content has been supplied by the author(s). It has not been vetted by BMJ Publishing Group Limited (BMJ) and may not have been peer-reviewed. Any opinions or recommendations discussed are solely those of the author(s) and are not endorsed by BMJ. BMJ disclaims all liability and responsibility arising from any reliance placed on the content. Where the content includes any translated material, BMJ does not warrant the accuracy and reliability of the translations (including but not limited to local regulations, clinical guidelines, terminology, drug names and drug dosages), and is not responsible for any error and/or omissions arising from translation and adaptation or otherwise.
Data availability statement
All data relevant to the study are included in the article or uploaded as supplementary information.
Ethics statements
Patient consent for publication
Not applicable.
References
- 1. Flu. Available: https://emflu.emro.who.int/ [Accessed 14 Sep 2021].
- 2. WHO EMRO . Influenza updates. Available: http://www.emro.who.int/health-topics/influenza/influenza-updates.html [Accessed 9 Sep 2021].
- 3. Review of global influenza circulation, late 2019 to 2020, and the impact of the COVID-19 pandemic on influenza circulation. Available: https://www.who.int/publications-detail-redirect/who-wer-9625-241-264 [Accessed 15 Sep 2021].
- 4. Itaya T, Furuse Y, Jindai K. Does COVID-19 infection impact on the trend of seasonal influenza infection? 11 countries and regions, from 2014 to 2020. Int J Infect Dis 2020;97:78–80. 10.1016/j.ijid.2020.05.088 [DOI] [PMC free article] [PubMed] [Google Scholar]
- 5. Influenza (seasonal). Available: https://www.who.int/news-room/fact-sheets/detail/influenza-(seasonal) [Accessed 14 Sep 2021].
- 6. Uyeki TM, Wentworth DE, Jernigan DB. Influenza activity in the US during the 2020-2021 season. JAMA 2021;325:2247–8. 10.1001/jama.2021.6125 [DOI] [PubMed] [Google Scholar]
- 7. Olsen SJ, Winn AK, Budd AP, et al. Changes in influenza and other respiratory virus activity during the COVID-19 pandemic - United States, 2020-2021. MMWR Morb Mortal Wkly Rep 2021;70:1013–9. 10.15585/mmwr.mm7029a1 [DOI] [PMC free article] [PubMed] [Google Scholar]
- 8. Feng L, Zhang T, Wang Q, et al. Impact of COVID-19 outbreaks and interventions on influenza in China and the United States. Nat Commun 2021;12:3249. 10.1038/s41467-021-23440-1 [DOI] [PMC free article] [PubMed] [Google Scholar]
- 9. Sanz-Muñoz I, Tamames-Gómez S, Castrodeza-Sanz J, et al. Social distancing, lockdown and the wide use of mask; a magic solution or a double-edged sword for respiratory viruses epidemiology? Vaccines 2021;9:595. 10.3390/vaccines9060595 [DOI] [PMC free article] [PubMed] [Google Scholar]
- 10. Ranking the effectiveness of worldwide COVID-19 government interventions. Nature human behaviour. Available: https://www.nature.com/articles/s41562-020-01009-0 [Accessed 9 Sep 2021]. [DOI] [PubMed]
- 11. Coronavirus disease (COVID-19). Available: https://www.who.int/emergencies/diseases/novel-coronavirus-2019 [Accessed 14 Sep 2021].
- 12. Factsheet about seasonal influenza . European centre for disease prevention and control. Available: https://www.ecdc.europa.eu/en/seasonal-influenza/facts/factsheet [Accessed 14 Sep 2021].
- 13. de Souza Luna LK, Perosa DAH, Conte DD, et al. Different patterns of influenza A and B detected during early stages of COVID-19 in a university hospital in São Paulo, Brazil. J Infect 2020;81:e104–5. 10.1016/j.jinf.2020.05.036 [DOI] [PMC free article] [PubMed] [Google Scholar]
- 14. Rubin R. Influenza’s unprecedented low profile during COVID-19 pandemic leaves experts wondering what this flu season has in store. JAMA 2021. [DOI] [PubMed] [Google Scholar]
- 15. Bo Y, Guo C, Lin C, et al. Effectiveness of non-pharmaceutical interventions on COVID-19 transmission in 190 countries from 23 January to 13 April 2020. Int J Infect Dis 2021;102:247–53. 10.1016/j.ijid.2020.10.066 [DOI] [PMC free article] [PubMed] [Google Scholar]
- 16. Varela FH, Scotta MC, Polese-Bonatto M, et al. Absence of detection of RSV and influenza during the COVID-19 pandemic in a Brazilian cohort: likely role of lower transmission in the community. J Glob Health 2021;11:05007. 10.7189/jogh.11.05007 [DOI] [PMC free article] [PubMed] [Google Scholar]
- 17. Williams S, Fitzner J, Merianos A, et al. The challenges of global case reporting during pandemic A(H1N1) 2009. Bull World Health Organ 2014;92:60–7. 10.2471/BLT.12.116723 [DOI] [PMC free article] [PubMed] [Google Scholar]
- 18. Audi A, AlIbrahim M, Kaddoura M, et al. Seasonality of respiratory viral infections: will COVID-19 follow suit? Front Public Health 2020;8:576. 10.3389/fpubh.2020.567184 [DOI] [PMC free article] [PubMed] [Google Scholar]
- 19. WHO consultation on the composition of influenza virus vaccines for use in the 2022 southern hemisphere influenza season.
Associated Data
This section collects any data citations, data availability statements, or supplementary materials included in this article.
Supplementary Materials
bmjgh-2022-008506supp001.pdf (57.8KB, pdf)
bmjgh-2022-008506supp002.pdf (264.6KB, pdf)
Data Availability Statement
All data relevant to the study are included in the article or uploaded as supplementary information.


