

Summary
Allele‐specific expression (ASE) can lead to phenotypic diversity and evolution. However, the mechanisms regulating ASE are not well understood, particularly in woody perennial plants. In this study, we investigated ASE genes in the apple cultivar ‘Royal Gala’ (RG). A high quality chromosome‐level genome was assembled using a homozygous tetra‐haploid RG plant, derived from anther cultures. Using RNA‐sequencing (RNA‐seq) data from RG flower and fruit tissues, we identified 2091 ASE genes. Compared with the haploid genome of ‘Golden Delicious’ (GD), a parent of RG, we distinguished the genomic sequences between the two alleles of 817 ASE genes, and further identified allele‐specific presence of a transposable element (TE) in the upstream region of 354 ASE genes. These included MYB110a that encodes a transcription factor regulating anthocyanin biosynthesis. Interestingly, another ASE gene, MYB10 also showed an allele‐specific TE insertion and was identified using genome data of other apple cultivars. The presence of the TE insertion in both MYB genes was positively associated with ASE and anthocyanin accumulation in apple petals through analysis of 231 apple accessions, and thus underpins apple flower colour evolution. Our study demonstrated the importance of TEs in regulating ASE on a genome‐wide scale and presents a novel method for rapid identification of ASE genes and their regulatory elements in plants.
Keywords: allele‐specific expression, anthocyanin, genome sequencing, genome assembly, Hi‐C, proximity‐guided assembly, comparative genomics, Malus, transposable element
Introduction
Allele‐specific expression (ASE) refers to the preferential expression of a parental allele in the hybrid due to variations in regulatory sequences from the parental genomes (Gaur et al., 2013). ASE may cause phenotypic variation depending on the function of the genes. ASE has been studied in annual plants, including maize (Guo et al., 2004, 2006; Springer and Stupar, 2007; Waters et al., 2017), Arabidopsis (Shi et al., 2012; Todesco et al., 2010; Zhang and Borevitz, 2009), rice, and barley (von Korff et al., 2009). RNA‐seq technologies enable the detection of single‐nucleotide polymorphisms (SNPs) in the coding sequence (CDS), which can be used to distinguish parental alleles and identify genes showing ASE in heterozygotes (Guo et al., 2008). For this strategy to work, the reference genome has to be assembled from a homozygous line or assembled using long sequence reads for reliable phasing of the SNPs into the correct haplotypes. A recent study in rice has identified more than 3000 ASE genes by comparing RNA‐sequencing data of a rice hybrid to its parental reference genomes, assembled using homozygous lines (Shao et al., 2019). Such methodology has not yet been reported for woody perennial plants because most early reference genomes of these plants were assembled using heterozygous plant materials.
A high quality reference genome is an essential tool for advanced genomic and functional genomic studies in any species (Lin et al., 2014; Peace et al., 2019; Song et al., 2019; Wu et al., 2018). Achieving high quality reference genome assemblies has been challenging for species with a large genome size, substantial amounts of repetitive DNA sequences, and high heterozygosity. Several technologies are used to overcome these assembly challenges. Long‐read sequencing technology such as PacBio™ and Oxford Nanopore Technologies are used to overcome the problem of long repetitive DNA fragments (Raymond et al., 2018; Zhuang et al., 2019). Chromosome Conformation Capture (Hi‐C) technology, in combination with genetic maps (Daccord et al., 2017; Raymond et al., 2018; Zhang et al., 2018, 2019), can be used to assemble contigs to chromosome scale. Haploid plant materials have been used to overcome the problems caused by high rates of genetic heterozygosity of perennially woody plant species (Daccord et al., 2017; Linsmith et al., 2019; Raymond et al., 2018; Xu et al., 2013; Zhang et al., 2019).
Transposable element (TE) insertion in and around genes may cause ASE. The insertion may abolish or reduce gene expression by disrupting the gene’s normal structure. For example, in apple a TE insertion in the introns of MdPI gene abolishes gene expression and confers parthenocarpic fruit development (Yao et al., 2001), and TE insertion in the microRNA172p gene reduces gene expression and increases fruit size (Yao et al., 2015). TE insertion may also activate or enhance gene expression as TEs contain many different types of cis‐regulatory elements that may provide new regulatory units to activate gene expression in response to biotic and abiotic stimulus (Galindo‐Gonzalez et al., 2017). Similarly, TE insertion in the promoters of apple and orange MYB genes enhance gene expression to confer red fruit skin (Zhang et al., 2019) and red fruit flesh (Butelli et al., 2012), respectively.
Apple (Malus × domestica) is an important fruit crop worldwide. The first draft reference genome of apple was developed using the heterozygous apple cultivar ‘Golden Delicious’ (GD) (Velasco et al., 2010), and has made significant contributions to many apple genomics and functional genomics studies that could accelerate apple breeding programmes (Peace et al., 2019). Recently, two new reference genomes have been assembled to chromosome level for apple, using a homozygous double‐haploid plant derived from diploid ‘Golden Delicious’ (GDDH13; Daccord et al., 2017) and a homozygous triple‐haploid plant derived from the cultivar ‘Hanfu’ (HFTH1) (Zhang et al., 2019).
‘Royal Gala’ (RG) is a desirable apple cultivar that originated in New Zealand and is ranked second in the US Apple Association’s 2016 list of most popular apples. It is the breeding parent of many well‐liked and commercially successful novel cultivars such as ‘Scifresh’ (commercialised as Jazz™), Scilate (Envy™), Sweetie™, and Kanzi™. RG is a sport (bud mutation) of ‘Gala’ that is a hybrid of GD and ‘Kidd’s Orange Red’ (KOR). Although a descendent of GD, RG displays extraordinarily different phenotypic traits from its GD parent in fruit skin colour, fruit texture, and storage life. To facilitate an investigation of the molecular genetics contributing to these elite desirable fruit traits in RG, we constructed a reference genome to pseudo‐chromosome level using a tetra‐haploid plant derived from anther cultures of RG. Together with RNA‐seq data from diploid RG, we identified ASE genes. By taking advantage of GD being a parent of RG, the genomic sequences of the GD parental allele of the ASE genes were extracted from the GDDH13 reference genome. By comparing the sequences of the two alleles, we identified TEs that are potentially regulating ASE and driving phenotypic changes in apple.
Results
Assembly and annotation of ‘Royal Gala’ haploid genome
The plant used for genome sequence assembly, ‘Royal Gala’ tetra‐haploid 1 (RGTH1), was regenerated from anther cultures of M. × domestica ‘Royal Gala’. The plant displayed altered phenotypes with shorter internode length and smaller leaves than RG (Figure S1a,b). Flow‐cytometry analysis showed that the plant is a tetraploid (Figure S1c,d). By mapping RGTH1 and diploid RG genome sequencing data to the double haploid GDDH13 v1.0 genome, about 1.5 million SNPs were detected across the 17 chromosomes. The average homozygous SNP rate is >77% in RGTH1 but <16% in RG (Figure S1e). The extremely high level of homozygous SNPs confirmed RGTH1’s haploid status.
About 50 Giga base pairs (GB) of data from each of the paired‐end (PE) libraries (with insert size 180 bp, 400 bp, and 600 bp) and 23 GB from a PacBio library were generated from RGTH1 material, reaching a sequencing depth of 210× from Illumina short reads and 38× from PacBio long reads. About 212 million pairs of Illumina data were generated from the Hi‐C library. The final assembly contains 17 chromosomes (with length from 29.3 MB to 54.1 MB) and one Chr0 containing un‐anchored contigs (134.4 MB) (Table 1).
Table 1.
‘Royal Gala’ tetra‐haploid 1 (RGTH1) genome assembly
| De novo assembly | Scaffolded with Hi‐C data | |
|---|---|---|
| # of Sequences Assembled | 17 891 | 18 |
| Assembled size (MB) | 763 | 765 |
| Gap | 0.01% | 0.24% |
| N50 (Base) | 107 211 | 39 475 602 |
| The shortest sequence (Base) | 1026 | 29 264 432 |
| The longest sequence (Base) | 1 615 689 | 134 429 464 (Chr0) |
| BUSCO completeness | C:95.2%, F:1.5%, M:3.3%, n:1440 | C:96.7%, F:0.8%, M:2.5%, n:1440 |
BUSCO notations: C for completely assembled genes.
F, fragmentally assembled; M, missing; n, number of conserved genes for genome completeness checking.
De novo repeat detection discovered a library of 1773 repeat fragments that can be classified to 35 groups including 527 LTR/Gypsy, 253 LTR/Copia, 65 DNA/MULE‐MuDR, 19 LINE/RTE‐BovB, and others. Using this library, 59.18% of the genome bases were masked, including 295 MB (38.57%) of long‐terminal repeats (LTRs) and 64 MB (8.33%) of DNA transposons. The second round of repeat masking was based on known repeats in Viridiplantae, and a further 2.27% of the genome was masked.
With hints from RNA‐Seq mapping and RG EST alignments, a total of 55 201 protein coding genes were originally predicted. Among them, 72.2% annotated with potential function through blast against Uniprot and Pfam. Gene models lacking homologous counterpart in previous Malus/Pyrus reference genomes were discarded, consequently reducing the number of genes to 42 788.
Comparative genomics
Orthologue analysis of amino acid sequences in RGTH1 (‘Royal Gala’), GDDH13 (‘Golden Delicious’), (Daccord et al., 2017), Pyrus communis (European pear) (Chagne et al., 2014), and P. bretschneiderii (Asian pear) (Wu et al., 2013) revealed that the majority of protein‐encoding genes belong to 12 379 orthologue groups that can be found in all the four assemblies. There are 759, 1135, 1082, and 1888 groups having orthologue genes in the other three assemblies but absent from ‘Royal Gala’, ‘Golden Delicious’, European, or Asian pear, respectively (Figure 1). There is a good proportion of genes (2993 clusters with 3468 and 3061 genes in RG and GD) present in both apple cultivars while absent from both pear species, indicating a closer genetic relatedness between the two apples than with pear. However, the RG‐only orthologues group is large (1879 groups of 4618 genes) compared with the GD group (264 groups of 803 genes) and the European (561 groups of 1273 genes) and Asian (699 groups of 1668 genes) pears groups. RG showed the presence of a much higher proportion of singletons (12 241 singletons). Further validation of these RG paralogues and singletons using RNASeq data resulted in removal of 12 413 genes from the gene predictions, with the number of RGTH1 genes (42 788) becoming on a par with the number of the GDDH13 genes (42 140) (Daccord et al., 2017).
Figure 1.
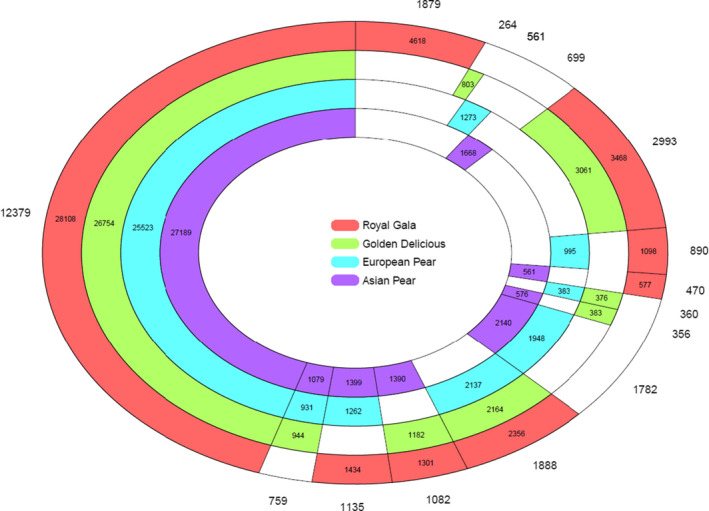
Orthologue analysis of protein coding genes predicted in two apple and two pear reference genomes. Protein coding genes predicted in a ‘Royal Gala’ tetra‐haploid (red, the outer ring) were compared with those in a ‘Golden Delicious’ double‐haploid (green), European Pear (Pyrus communis, blue), and Asian Pear (Pyrus bretschneideri, purple). The number outside the outer ring was the number of orthologue groups. The number in the coloured section illustrated the number of genes for that particular species in the orthologue groups. A white colour section indicated that there was no orthologue gene for that sample. There were 12 379 orthologue groups with homologous genes found in all the four samples, consisting of 28 108 genes in ‘Royal Gala’, 26 754 in ‘Golden Delicious’, 25 523 in European pear, and 27 189 genes in Asian pear. There were 1879 groups of 4618 paralogue genes that were present in ‘Royal Gala’ only. This portion was larger than 264, 561, and 699 paralogue groups in ‘Golden Delicious’, European, and Asian pears, respectively. There were 2993 and 1782 orthologue groups detected specifically in Malus or Pyrus alone, but missing from the other.
Genome‐wide identification of allele‐specific expression in apple
Diploid heterozygous RG genomic DNA was sequenced and a total of 109 million pairs of reads were obtained (sequencing depth ~30×). Variant calling, using the RGTH1 genome as reference, identified 2.7 million SNPs and 339,288 INDELs. In total, 28 474 of the 42 788 predicted RGTH1 genes contained SNPs and/or INDELs in their CDS.
RNA‐seq data were generated from diploid RG for four tissues: balloon stage flowers, open flowers, and flesh of bagged and non‐bagged mature fruit, with three replicates for each tissue type. Mapping them to the RGTH1 genome, between 19 371 and 25 639 genes reached an expression level >2 Fragments Per Kilobase of transcript per Million mapped reads (FPKM) in at least one tissue (Table S1). Genes containing SNPs and/or INDELs in CDS, having an expression level >2 FPKM, and with an allele‐differential expression rate (ADER) >0.75 or < 0.25, were considered as ASE genes. For each tissue type, 851 to 923 ASE genes were identified (Table S1). As ASE genes were commonly present in two, three, or four tissue types, a total of 2091 unique ASE genes were identified (Figure 2a, Table S2). The proportions of the common ASE genes when comparing two data sets were between 31% and 66% (Table S3). The highest proportion (66%) was between bagged and non‐bagged fruit flesh tissues, which was anticipated as they were the same type of tissues, but treated with different light conditions (dark, bagged vs light, non‐bagged), during the later stages of fruit development. Other pairwise comparisons had lower numbers of common ASE genes as they were different tissues at very different developmental stages, and hence a greater variation in gene expression pattern was expected.
Figure 2.
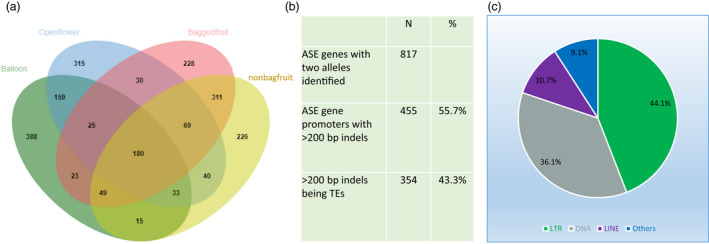
Numbers of Allele‐specific expression (ASE) genes identified in four different apple tissue types and affected by TE insertion. (a) Venn diagram showing the numbers of ASE genes identified in four different apple tissue libraries. (b) Comparing the 5 kb upstream sequences of two alleles of the 817 ASE genes identified 455 with INDELs >200 bp, of which 354 were TE sequences. (c) The 354 TE sequences were classified into four types.
Mapping DNA sequence reads to the RGTH1 reference illustrated consistency of heterozygous SNPs (Figure 3). However, mapping RNA reads showed two types of expression: absolute (Figure 3a, no SNPs or Figure 3b, homozygous SNPs), or preferential ASE (Figure 3c,d), where the majority of reads support one allele.
Figure 3.
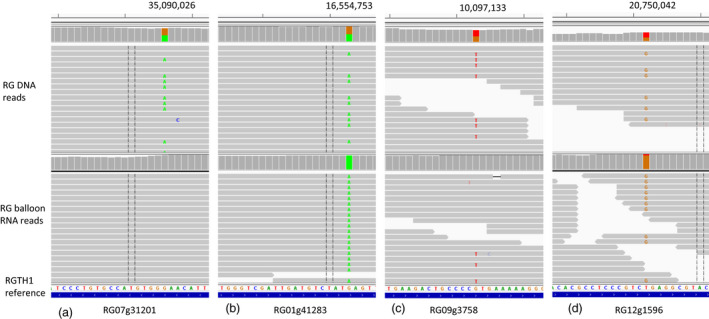
Snapshots of Integrated Genome Viewer (IGV) view of four genes with allele‐specific expression. ‘Royal Gala’ (RG) DNA and balloon flower RNA sequence reads were mapped to RGTH1 reference genome to generate bam files that were viewed using IGV (v2.3.88). Each view shows a SNP site of an allele‐specific expressed gene. The number on the top of the images shows the chromosomal location of the SNP in the RGTH reference genome. (a) RG07g31201 specifically expressed the reference allele. (b) RG01g41283 specifically expressed the alternate allele. (c) RG09g3758 preferentially expressed the reference allele. (d) RG12g1596 preferentially expressed the alternate allele.
Transposable elements play important roles in regulating allele‐specific expression
Transposable elements (TEs) are reported to affect gene expression (Dubin et al., 2018; Galindo‐Gonzalez et al., 2017; Sahebi et al., 2018). In total, 8614 genes were clearly identified with one allele from the GDDH13 haploid genome and the other allele from the RGTH1 genome. Among them, 817 were present in the 2091 ASE genes. Their corresponding gene IDs in both genomes are listed in Table S4. Comparing their 5 kb up‐stream sequences from GDDH13 and RGTH1, 455 of the 817 (55.7%) ASE genes had INDELs longer than 200 nucleotides in one of the haplotypes. Of these INDELs, 354 were TE sequences (Figure 2b), classified as long terminal repeats, (LTR 44.1%), long interspersed nuclear elements (LINE 10.7%), DNA type (36.1%), or other types (9.1%) (Figure 2c).
Examples of TE‐association with ASE are shown in Figures 4 and S2. MD11G1291200 and RG11g10167 are two alternative alleles of a gene encoding an E3 ligase. A GYPSY‐like TE insertion in the promoter of MD11G1291200 was positively associated with ASE in RG balloon flower tissues (Figure 4). MD05G1033800 and RG05g54774 are alternative alleles encoding a tryptophan aminotransferase. A rolling‐circle Helitron type TE (1230 bases long) insertion in the upstream of RG05g54774 was negatively associated with gene expression (Figure S2).
Figure 4.
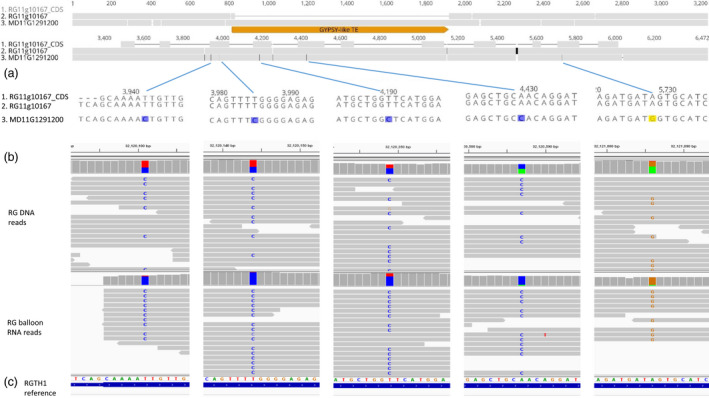
A transposable element identified in the upstream sequences of an allele may cause the allele‐specific expression. (a) an alignment of MD11G1291200 and RG11g10167 genomic DNA and RG11g10167 CDS sequences showed a GYPSY‐like TE insertion in the upstream sequences of MD11G1291200 and various SNPs and INDELs. (b) detailed sequence alignment around the five SNPs detected in the CDS region. (c) snapshots of IGV views cover the five SNP sites in the CDS region. ‘Royal Gala’ (RG) DNA and balloon flower RNA sequence reads were mapped to the RGTH1 reference genome. The five SNPs in (b) were identical to the five SNPs in c, indicating that MD11G1291200 was the alternate allele of RG11g10167 in diploid ‘Royal Gala’. The allele frequency was approximate 50% for DNA‐seq reads (upper part) but highly biased to the alternate allele for RNA‐seq reads (lower part), indicating preferential expression of the alternate allele. The number on the top of the images indicates the chromosomal position.
Transposable element insertions in MYB10 and MYB110a upstream regions underpin apple flower petal colour variations at balloon stage
The flower petal colours of cultivated apples [GD, RG, ‘Fuji’ (FJ), ‘Longfeng’ (LF)] are red and pink at balloon stage (Figure 5a,c–e) and become light pink or white at full bloom stage (Figure 5b). Petals of the wild apple species M. baccata, may be pink (Figure 5f) or white at balloon stage (Figure 5g–i). The balloon stage white petals are white at full bloom stage (Figure 5j). MYB10 and MYB110a are transcription factors that positively regulate the expression of anthocyanin biosynthesis genes in apple (Chagne et al., 2013; Espley et al., 2009). The expression levels of MYB10 and MYB110a, as quantified by RNA‐seq analysis, were high in red petals of GD and RG, but barely detectable in white petals of both M. baccata accessions SDZ16‐3 and SDZ (Figure 5k). In the pink petals of FJ and LF, and the M. baccata accession SDZ16‐10, only MYB10 was expressed at a high level (Figure 5k). It is likely that specific genetic variants in MYB10 and MYB110a gene underpin apple petal coloration.
Figure 5.
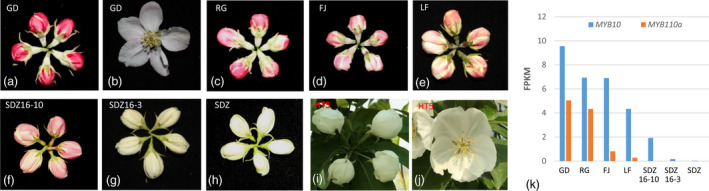
Apple petal colour is associated with MYB10 and MYB110a expression. (a–e) flowers of four Malus x domestica cultivars, ‘Golden Delicious’ (GD), ‘Royal Gala’ (RG), ‘Fuji’ (FJ), and ‘Longfeng’ (FL) were photographed at balloon (a, c–e) and full bloom (b) stages. (f–j) flowers of four accessions of M. baccata (SDZ16‐10, SDZ16‐3, SDZ, and HT5) were photographed at balloon (f–i) and full bloom (j) stage. (k) shows the mRNA expression levels (FPKM values) of MYB10 and MYB110a in petals at the balloon stage as determines using RNA‐seq analysis.
RG15g42342 (encoding MYB110a) was detected as ASE in balloon flowers (Table S2) and showed preferential expression of the alternative allele in balloon flowers of diploid RG (Figure 6a). Two of the three SNPs in the CDS region were homozygous in RNA mapping (the two blue bars in Figure 6a) and one is highly biased to the non‐reference allele (the green bar on the left in Figure 6a), indicating the alternative allele at this locus was specifically expressed in RG petals, while the expression of the reference allele was almost undetectable. MD17G1261000 (MYB110a in the GDDH13 reference genome) was identified as the alternative allele of RG15g42342 (Table S4). The alignment between CDS sequences of the two alleles also showed three SNPs (Figure S3a) that were same as the three SNPs detected above by mapping RG sequence reads to RGTH1 reference (Figure 6a). These SNPs changed two amino acids (Figure S3b). The same SNP pattern confirmed that MD17G1261000 is the alternative allele of RG15g42342. Most importantly, these two alleles differed by the specific presence of an LTR/Gypsy TE in the upstream region of the MD17G1261000 allele (Figure 6b), which made us postulate that the LTR/Gypsy TE is influencing MYB110a expression in apple petals to underpin apple flower colour variation.
Figure 6.
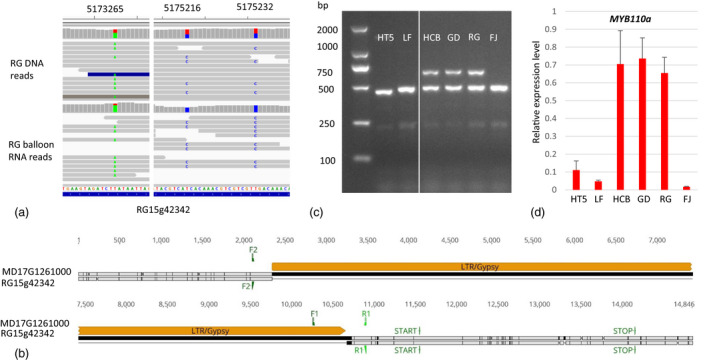
A LTR‐TE in MYB110a is associated with its allele‐specific expression in apple petals. (a) snapshots of IGV views show RG DNA and balloon flower RNA sequence reads mapped to the RGTH1 reference genome. Three SNPs in MYB110a (RG15g42342) CDS showed specific expression of the alternate allele. The numbers on the top of the image indicate the chromosomal position of the SNPs. (b) comparison of sequences between two MYB110a alleles from RGTH1 and GDDH13 identified a 8.5 kb LTR/Gypsy TE specifically present in the GD reference allele (MD17G1261000). F1, F2, F3, F4, R1, R2, and R3 indicate the location of PCR primers. (c) PCR result was generated using primers MYB110aF1/F2/R1 and DNA of six apple accessions. F1/R1 generated a 656 bp fragment from the allele containing the TE and F2/R1 generated a 485 bp fragment from the allele without the TE. (d) qRT‐PCR analysis showed relative expression level of MYB110a in the six different apple accessions.
To test the above hypothesis, we first determined the allele type and expression level of MYB110a in a wild apple (M. baccata HT5) with white flowers, and in five cultivars either with pink flowers (LF and FJ) or red flowers [‘Hongcuibao’ (HCB), GD, and RG]. Three primers were used in PCR analysis to amplify two DNA fragments of 656 bp and 485 bp, representing the TE‐containing allele and non‐TE allele, respectively. HT5, LF, and FJ were homozygous for the non‐TE allele, as only the 485 bp DNA fragment was amplified. HCB, GD, and RG contained both alleles, as both DNA fragments were amplified (Figure 6c). RT‐PCR analysis showed weak expression of MYB110a in the HT5, LF, and FJ, in contrast to the strong expression in HCB, GD, and RG (Figure 6d). This result indicated the TE‐containing allele of MYB110a is associated with high expression level of MYB110a, supporting the result of the ASE analysis.
We further analysed the allele type of 200 apple cultivars and 31 wild apple accessions using this marker (Table S5, Figure S4a). A variation of the non‐TE allele was identified as a smaller band (332 bp) (Figure S4a) that was fully sequenced. Comparing the DNA sequences of the large and small fragments indicated that this variation was probably a deletion due to homologous recombination between two inverted repeat DNA sequences in the region (Figure S4b). The frequencies for TE and non‐TE alleles were 25.5% and 74.5% in apple cultivars, respectively, and 22.6% and 77.4% in wild apple accessions, respectively (Table S6). None of the eight white flower accessions showed the presence of the TE allele (Table S5) and in addition, a number of red/pink accessions also showed the absence of the TE allele. The red/pink colour of these accessions is due to expression of MYB10 as described below.
MYB10 is encoded by the MD09G1278600 and RG09G4950 genes in the GDDH13 and RGTH1 reference genomes, respectively. ASE analysis could not be performed by using diploid RG plant material because there were no SNPs in the CDS between the two haplotypes. In GD, MYB10 was heterozygous and showed a key difference between the two alleles with the presence/absence of a 500 bp TE in their upstream region (Figure 7a). The two alleles were expressed at a similar level in petals based on two SNPs in the 5’ UTR (Figure 7b). Therefore, the 500 bp TE was unlikely to have affected MYB10 gene expression in flower petals. In LF, MYB10 was heterozygous and showed a key difference between the two alleles with presence/absence of a 674 bp TRIM‐type (terminal‐repeat retrotransposons in miniature) TE in their upstream sequence (Figure 7a). The absence of the 674 bp TRIM‐type TE was homologous in M. baccata HT5 (Figure 7a). In LF petals, the MYB10 expressed allele was identical to the GD reference allele (Figure 7c) containing the TRIM‐type TE, whereas the expression of the alternative allele without the TRIM‐type TE was not detected.
Figure 7.
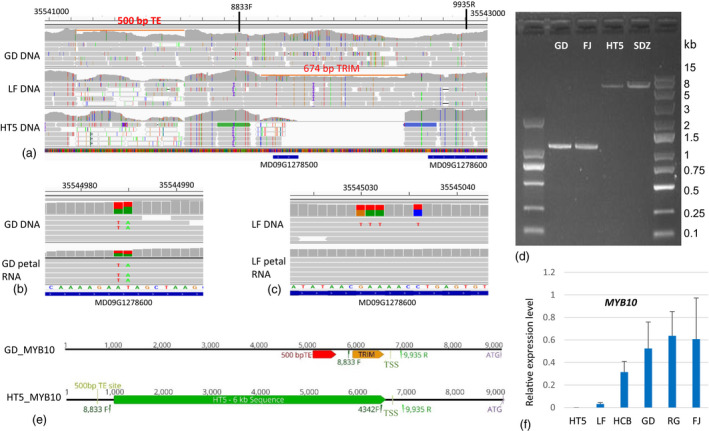
A TRIM TE insertion in MYB10 promoter was associated with MYB10 expression in apple petals. (a) A snapshot of IGV view, DNA sequence reads of two apple cultivars ‘Golden Delicious’ (GD) and ‘Longfeng’ (LF) and a wild accession Malus baccata Haitang 5 (HT5) were mapped to the GDDH13 reference genome. Upstream of MYB10 gene (MD09G1278600), a deletion of a 500 bp TE was detected as heterozygous in the GD diploid genome and homozygous in LF and HT5. A TRIM TE (674 bp) deletion was detected in LF and HT5 as heterozygous and homozygous, respectively, but not deleted in GD. 8833F and 9935R: location of two PCR primers used (b) DNA and petal RNA sequence reads of GD were mapped to the GDDH13 reference genome. No allele‐specific expression of MYB10 was detected. (c) DNA and petal RNA sequence reads of LF were mapped to the GDDH13 reference genome. Specific expression of the MYB10 reference allele (MD09G1278600) was detected. The numbers on the top of the images indicate the chromosomal positions. (d) PCR amplification using two primers flanking the TRIM‐TE insertion site detected a 1100 bp fragment for GD and LF, and a 6.5 kb fragment for HT5 and SDZ. (e) a diagram shows MYB10 gene structure for the GD reference allele and an alternative allele detected from HT5. A 6 kb DNA sequence in the HT5 allele was replaced by the TRIM TE in the GD reference allele. TSS: transcription start site, ATG: translation start codon, 8833F, 4342F, and 9935R: location of three PCR primers used. (f) qRT‐PCR analysis showed relative expression levels of MYB10 in six different apple accessions.
To confirm the presence/absence of the 674 bp‐TRIM‐type TE in different MYB10 alleles, PCR analysis was performed using primers flanking the position of the TRIM‐type TE insertion (8833F and 9935R, Figure 7a, Table S7). A DNA fragment of 1103 bp representing the allele containing the 674 bp‐TE was amplified from cultivars producing red petals, such as GD and FJ (Figure 7d). Although a 429 bp fragment was expected for the allele lacking the TRIM‐type TE, a 6.5 kb fragment was amplified from white petal wild apple accessions, such as HT5 and SDZ (Figure 7d). The 6.5 kb PCR DNA fragment was fully sequenced revealing the expected 429 bp sequence and an additional 6 kb of sequence that showed no homology to any sequence from the RGTH1 or GDDH13 reference genome. Alignment of the sequences showed a direct replacement between the TRIM‐type TE and the 6 kb DNA fragment (Figure 7e). This result indicates that the TE insertion caused a deletion, and is consistent with the previously reported result that TE insertion can mediate genome deletion (Han et al., 2005).
We further verified the allele types of MYB10 in 31 wild accessions and 200 cultivars using PCR analysis with primers 8833F, 4342F, and 9935R. The frequencies for TE and non‐TE alleles were 98.5% and 1.5% in apple cultivars, respectively, and 43.5% and 56.4% in wild apple accessions, respectively (Figure S5, Tables S5, S6). All eight white flower accessions showed the absence of the TE allele (Table S5). RT‐PCR analysis showed that the MYB10 expression level in flower petals was not detectable for HT5, low for LF, and high for the four red flower accessions (HCB, GD, GD, and FJ) (Fig. 7f). These expression patterns corresponded to the absence, heterozygosity, and homozygosity of the TRIM‐TE‐containing MYB10 allele. These analyses collectively showed that the presence of the TRIM TE in the MYB10 upstream region is positively associated with MYB10 expression in flower petals and red petal colour.
The results of both MYB10 and MYB110a allele type analyses showed that all 200 apple cultivars and 23 of 31 accessions showing pink/red petals contained a mix of MYB10 and MYB110a alleles with at least one allele containing the critical TE insertion to activate gene expression, whereas the white petal accessions contained no alleles with the TE insertion (Table S5). Of the 200 apple cultivars analysed (Table S5), 13 cultivars (including ‘Golden Delicious’, ‘Dorsett Golden’, ‘Grimes Golden’, and ‘Granny Smith’, and others) have pink/red petals but non‐red fruit skin, indicating these TEs are specifically responsible for red petal colour but not for red fruit skin colour.
TE‐activated gene expression was confirmed by Agrobacterium‐mediated transformation. Apple petal segments were transformed with a GUS reporter gene under the regulation of CaMV35S promoter (positive control), no promoter (negative control), or one of the four promoters to be tested, which were (i) GD MYB110a promoter with the LTR‐TE, (ii) RG MYB110a promoter without the LTR‐TE, (iii) GD MYB10 promoter with the TRIM TE, and (iv) HT5 MYB10 promoter without the TRIM TE (Figure 8a). At 6 days after transformation, GUS expression in petal segments was strong for the CaMV35S control promoter and the two promoters (GD MYB110a and GD MYB10) containing the TE sequences. In contrast, GUS expression was undetectable for the no‐promoter control and very weak for the two promoters (RG MYB110a and HT5 MYB10) without the TE sequences (Figure 8b). This result shows that the TEs identified in MYB110a and MYB10 promoters can greatly enhance gene expression in apple petal tissues.
Figure 8.
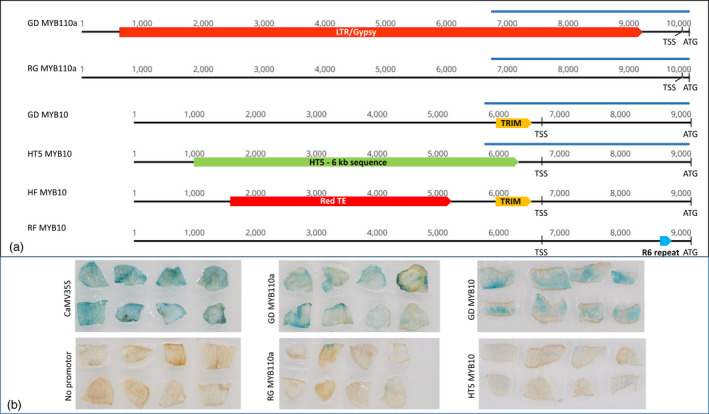
Important elements in MYB110a and MYB10 promoters and their effects on promoter activity. (a) Diagrams show the promoter region upstream the start codon ATG of MYB110a and MYB10 genes from apple cultivars ‘Golden Delicious’ (GD) and ‘Royal Gala’ (RG), ‘Hanfu’ (HF), ‘Red Field’ (RF), and a wild accession Malus baccata Haitang 5 (HT5). The transcription start sites (TSS) are shown. The LTR/Gypsy and TRIM transposable elements were identified in this study (Figures 6 and 7). The RedTE in HT5 MYB10 and R6 repeats in RF MYB10 were identified previously (Espley et al., 2009; Zhang et al., 2019). The four blue bars indicate the promoter fragments to be analysed in (b). (b) Apple petal segments were co‐cultivated with A. tumefaciens cells containing a GUS reporter gene under the control of CaMV 35S promoter, no promoter, or one of the four promoter fragments indicated in (a), and histochemically stained for GUS activity (blue colour) 6 days after the co‐cultivation.
Discussion
The RGTH1 reference genome assembled in this study is a valuable addition to the three published Malus genomes, M. × domestica ‘Golden Delicious’ (Velasco et al., 2010), GDDH13 (Daccord et al., 2017), and HFTH1 (Zhang et al., 2019), for apple genomics research. Here, we demonstrate its usefulness for variant detection and genome‐wide ASE gene identification. Given the parental relationship of GD to RG, both reference genomes can be used in combination to study the allelic variants associated with or directly affecting a wide range of traits. The efficient analysis methodology developed in this study could be applied to other perennial species with highly heterozygous genomes.
Although genome‐wide identification of ASE genes was reported in annual plant species (Shao et al., 2019), the method is currently not widely applicable to highly heterozygous tree species because tree reference genomes were mostly assembled with diploid plants and short DNA sequence reads, and would encounter problems in haplotype phasing. Haplotype‐phased reference genomes were recently assembled using long sequence reads from heterozygous materials (Colle et al., 2019; Usai et al., 2020). In this study, we have used a haploid reference genome RGTH1 to overcome haplotype phasing problems during ASE identification. We further used a parental haploid reference genome GDDH13 to identify the alternative allele of ASE genes. By comparing the sequences of both alleles, allele‐specific structural variants (SVs) were identified, in particular the presence of TEs in the upstream region of the CDS. These genetic variants potentially have impact on ASE. This approach can be utilized in other plant species, in particular those species that already have a reference genome developed from haploid plant material, such as citrus (Wang et al., 2017) or from diploid plant material but with completely phased two haploid genomes based on long sequence reads like grapevine (Minio et al., 2019).
ASE analysis has several advantages over differential gene expression (DGE) analysis. The latter has been widely used to identify genes differentially expressed between different tissues of the same genotype, between the same tissues of different genotypes, or the same tissue across time courses (Klumb et al., 2020; Nishitani et al., 2020; Wang et al., 2020; Zerpa‐Catanho et al., 2019). However, DGE does not address allele specificity. Furthermore, its analysis accuracy is adversely affected by factors such as environmental condition variations, RNA extraction and library preparation discrepancies, sequencing batch effects, and the uniformity of biological materials. In contrast, ASE analysis investigates allele expression specificity within the same sample from the same dataset under the identical genetic background and environmental conditions, thus leading to a more robust way of identifying potential causative variants.
TEs are known to regulate gene expression and contribute significantly to plant evolution (Dubin et al., 2018; Feschotte et al., 2002; Galindo‐Gonzalez et al., 2017). In perennial fruit species, several agriculturally important traits are shown to be regulated by TE insertion, such as seedless fruit (Yao et al., 2001), fruit size (Yao et al., 2015), red fruit skin in apple (Zhang et al., 2019), red fruit flesh (Butelli et al., 2012), somatic embryogenesis in citrus (Shimada et al., 2018), fruit flesh growth (Fernandez et al., 2013), and inflorescence structure in grape (Fernandez et al., 2010). Here, we identified 354 TE insertions (Figure 2b) that potentially regulate gene expression by using genome‐wide ASE analysis and comparing the sequences of two alleles extracted from two high quality reference genomes of related cultivars. This approach will accelerate our understanding the role of TEs in plant evolution, and crop domestication and improvement.
MYB10 and MYB110a are two key genes regulating anthocyanin biosynthesis in apple. Activation of the expression of either one of them using transgenic approaches can activate anthocyanin accumulation in plant tissues (Chagne et al., 2013; Espley et al., 2007). In apple germplasm, a minisatellite sequence (termed R6 repeat) upstream of the ORF of MYB10 (Figure 8a) is shown to activate MYB10 expression in most apple tissue types and enhance anthocyanin accumulation in leaves, flowers, and fruit (Espley et al., 2009). A MYB110a allele is expressed in fruit and associated with ‘type 2’ flesh colour, although the causative variant is unknown (Chagne et al., 2013). In many apple cultivars, the insertion of an LTR/Gypsy TE (termed Red‐TE) in the promoter region of MYB10 (Figure 8a) is known to be associated with MYB10 expression and anthocyanin accumulation in mature fruit skin (Zhang et al., 2019). However, the alleles of these two genes associated with apple flower petal colour development were unknown.
In this study, we identified the specific allele of MYB10 and MYB110a underpinning the variation of apple petal colour. All apple cultivars produce pink to red flowers, in particular at the balloon stage of flower development, owing to the accumulation of anthocyanins. A few accessions of wild apple species produce white flowers from the balloon stage (Figure 5g–i). Our research showed that the cultivated and wild apples may be divided into four classes based on the expression of MYB10 and MYB110a in flower petals: (i) both MYB10 and MYB110a are expressed; (ii) only MYB10 is expressed; (iii) only MYB110a is expressed; and (iv) neither MYB10 nor MYB110a is expressed (Table S5). The expression of both genes is associated with the presence of a TE in their upstream regions (Figure 8). The wild apple accessions producing white flowers do not express MYB10 or MYB110a because they do not have the allele containing the TE insertion. The frequency of MYB10 allele with the TE insertion was higher in the domesticated apples than in the wild accessions (Table S6), indicating that flower colour was a trait under selection during apple domestication and improvement.
The identification of these new TEs in MYB10 and MYB110a alleles has further demonstrated the importance of TEs in controlling gene expression and trait evolution in plants. Out of the four variants identified to control anthocyanin accumulation in apple (summarised in Figure 8a), three are TEs (Zhang et al., 2019) and one is a minisatellite (Espley et al., 2009). The minisatellite in MYB10 named the R6 repeat provides binding sites for MYB10 to auto‐regulate its own expression and it confers red colour of many plant organs include leaves, flowers, and fruit (flesh and skin) Two different TE‐insertional alleles of MYB10 are responsible for anthocyanin accumulation in fruit skin (Zhang et al., 2019) and flower petal (Figure 7), respectively. In addition, a TE‐insertional allele of MYB110a is responsible specifically for petal anthocyanin accumulation (Figure 6). The findings in this study and previous report (Zhang et al., 2019) show that anthocyanin accumulation in apple petals and fruit skins are regulated by different TE insertions in MYB gene promoters, which explains why yellow and green skin apples can produce red flowers.
This study established a high quality haploid apple reference genome and used it together with transcriptome data for genome‐wide identification of ASE genes. Allelic variants, in particular TEs potentially underpinning ASE, were identified by comparing two closely related haploid reference genomes. TEs in two MYB genes were detected and further associated with ASE underpinning apple flower colour variation. The reference genome assembled in this study will significantly contribute to future genomic studies and molecular breeding of apple. The novel method developed in this study for rapid identification of ASE genes and their regulatory elements is applicable to other perennial species with highly heterozygous genomes, and will accelerate our understanding the role of TEs in plant evolution, and crop domestication and improvement.
Experimental procedures
Plant materials
The plant material used in genome sequencing, RGTH1, was derived from anther cultures of Malus × domestica RG following previously described methods (Hofer, 2004, 2005). It was micro‐propagated in tissue culture then planted in a research orchard of the Pomology Research Institute, Liaoning Province, China.
DNA extraction and sequencing
Shoots were collected from the putative tetra‐haploid RG plant and were sent to Macrogen, South Korea, for library construction and sequencing. Total cellular DNA was extracted using the Ezna HP Plant DNA Mini kit (OMEGA Bio‐teK, Norcross, GA , USA). Three paired‐end (PE) Illumina libraries were constructed with insert sizes of 180 bp, 400 bp, and 600 bp, respectively and sequenced in multiples lanes on the HiSeq2000 platform. Twenty‐two SMRT Cells of long read genomic data were created from the same material at the same institute on a PacBio RSII machine. A genomic DNA sample was sent to PhaseGenomics, USA, for Hi‐C library construction and sequencing. Total cellular DNA was also extracted from leaves of diploid RG and sequenced on the Illumina platform in paired‐end mode with insert size 250 bp, read length 101 bp, and sequencing depth reached to 30×.
Haploid verification
Flow‐cytometry analysis of nuclei isolated from leaf tissues of RG to determine their DNA content was performed according to a previously described protocol (Dolezel et al., 2007).
To digitally verify the haplotype, two sequencing data sets (PE180 and PE400) from RGTH1 and one data set from a normal diploid ‘Royal Gala’ PE250 (read length 101 bp, fragment size 250 bp, sequencing depth ~30×) were mapped to the double‐haploid ‘Golden Delicious’ (GDDH13) genome (Daccord et al., 2017) using bowtie2 (version 2.2.5) (Langmead and Salzberg, 2012) with options ‘‐‐minins 450 ‐‐maxins 750 ‐‐sensitive mode’. SNPs were called using the samtools/BCFtools suite (Li et al., 2009). Detected SNPs were summarized with VCFtools (Danecek et al., 2011). Homozygous SNP rates were compared between RGTH1 and diploid RG samples.
Assembly and annotation of ‘Royal Gala’ haploid genome
A hybrid approach for the genome assembly was followed using the MaSuRCA (version 3.2.4) assembler (Zimin et al., 2013) where the PE Illumina short read data and PacBio data were used as input. Thereafter, the resulting assembly was run through the Proximo Hi‐C scaffolding pipeline for chromosome assignment and scaffold ordering and orientation on the contigs using the Hi‐C data (PhaseGenomics). The completeness of the genome was checked at each stage with BUSCO (version 3.02) where lineage was set to ‘embryophyta_odb9’ (Simao et al., 2015).
De novo repeats were detected from RGTH1 genome with RepeatModeler (version 1.0.11) (Smit and Hubley, 2008). The genome assembly was masked twice using RepeatMasker (version 4.0.5; Smit et al., 2013), first with the de novo repeat library constructed, followed by the Viridiplantae repeats option.
RNASeq reads from 15 libraries of 90 GB sequence data were mapped to the RGTH1 genome using STAR (version 2.5.3a) (Dobin et al., 2013) to build evidence for gene prediction. These libraries were derived from leaf, flower, and fruit tissues of RG. The resulting multiple alignment bam files were merged with bamtools (version 2.4.0). In addition, ‘Royal Gala’ expressed sequence tags (EST) (Newcomb et al., 2006) were aligned to RGTH1 using blatSuite (version 36) (Kent, 2002) to generate further evidence. ESTs with a minimum 90% identity and minimum intron length 30 were kept as additional hints using pslcdnafilter from KentUtils and blat2hints.pl from the augustus scripts. Thereafter, the merged bam alignment from RNASeq data and EST based evidence files were used for genome annotation using BRAKER2 (version 2.1.0) pipeline (Hoff et al., 2019). BUSCO (version 3.0.2) was then run to check gene space completeness using the ‘embryophyta_odb9’ lineage.
Predicted gene sequences were blasted to PFam and UniProt databases using Blast+ suite (version 2.6.0; Camacho et al., 2009). The results were used to functionally annotate genes using trinotate (version 3.0.2; Bryant et al., 2017). In addition, KEGG annotations were carried out using the KAAS pipeline (version sa2_140224; Moriya et al., 2007).
Comparative genomics
Orthologue analyses of protein coding genes were performed with orthomcl (version 2.0.9; Li et al., 2003), between RGTH1, GDDH13 (Daccord et al., 2017), PCPHybridGeneSet2 (Pyrus communis) (Chagne et al., 2014), and Asian pear (Pyrus bretschneiderii) (Wu et al., 2013). The RGTH1 singletons and paralogues identified from the analyses were further validated using RNASeq data support, and those lacking RNASeq support were removed from the predicted gene set.
RNA extraction and sequencing
For ASE analysis, whole flowers were collected at two developmental stages (unopened balloon and open flower), and flesh samples were collected from bagged and non‐bagged mature fruit of Malus × domestica ‘Royal Gala’. The fruit was bagged with light‐impenetrable double‐layer paper bags at 38 DAFB (days after full blown). In addition, flower petals were collected at the unopened balloon stage from four apple cultivars (‘Royal Gala’, ‘Golden Delicious’, ‘Fuji’, and ‘Longfeng’) and three accessions of M. baccata (SDZ, SDZ16‐3, and SDZ16‐10), to verify MYB10 and MYB110a expression. From these tissue samples, RNA was isolated using the Spectrum Plant Total RNA kit (Sigma‐Aldrich, Auckland, New Zealand) according to the manufacturer’s instructions. Five micrograms of total RNA were used to construct strand‐specific poly‐A RNA libraries as previously described (Haile et al., 2017). Libraries were sequenced using the HiSeq2000 sequencing system (Illumina) to produce paired‐end reads. Reads were aligned to apple reference genomes GDDH13 (Daccord et al., 2017) and RGTH1 using BWA (version 0.7.15; Li et al., 2009).
Small variants detection and allele‐specific expression test
To differentiate ASE, we carried out SNP and INDEL detection using genomic and transcriptomic sequence data. Diploid RG genomic sequences were mapped to RGTH1 reference genome using BWA. RNA‐Seq data from four types of tissues of diploid RG were mapped to RGTH1 using STAR (version 2.6.1d; Dobin et al., 2013). Afterwards, the same workflow was applied for detection of variants from genomic and transcriptomic alignments. PCR duplications were marked using Picard‐tools (version 2.10.1; Wysoker et al., 2013). SNPs and INDELs were called using GATK (version 3.8.0; Mushtaq and Al‐Ars, 2015). SNPs detected were filtered with VCFTools (version 0.1.14). The remaining SNPs were annotated with snpEff (Cingolani et al., 2012).
Genes with SNPs in their CDS and having an expression level higher than 2 FKPM in each tissue were considered a potential ASE. In addition, if their allele differential expression ratio (ADER), defined as read counts of the reference allele divided by total read counts, was >0.75 or <0.25, they were defined as ASEs in that RNA‐Seq library.
Identification of DNA elements potentially causing Allele‐specific expression
Taking advantage of GD being a parent of RG, we designed a protocol (Figure S6) to extract the GD alleles that are inherited by diploid RG but not present in the RGTH1, from the GDDH13 reference genome. We aligned coding sequences (CDS) from GDDH13 to the RGTH1 genome using minimap2 (version 2.2.17; Li, 2018). The alignments were further converted to bam format and variants were called using GATK (DePristo et al., 2011). Comparing SNPs called from diploid RG data and GDDH13 CDS, we could identify the GD alleles inherited by RG. The genomics and transcriptomics alignments, gene structures of ASE genes, SNPs, and repeats were visualized using IGV(version 2.3.88; Robinson et al., 2011).
Upstream sequences (5 kb from the start codon) of ASE genes were extracted from GDDH13 and RGTH1 genomes for each allele. The two alleles were aligned to each other to detect INDELs longer than 200 nucleotides. The INDELs were compared with RGTH1 de novo repeat library and the repeat type was classified accordingly.
PCR amplification of DNA upstream MYB110a and MYB10
Genomic DNA for use as PCR templates was extracted from young leaf tissues of apple cultivars and wild accessions using DNeasy Plant Mini Kit (Qiagen, Germantown, MD, USA) according to the manufacturer’s instructions. PCR reactions were carried out using a mix of three primers for each gene. For MYB110a, primers MYB110aF1 and MYB110aR1 are located in the sequences flanking the TE insertion site and primer MYB110aF2 is located in the TE sequences (Figure 6). Primers MYB110aF1 and MYB110aR1 can generate a 485 bp DNA fragment from the non‐TE allele while MYB110aF2 and MYB110aR1 can generate a 656 bp DNA fragment from the TE‐containing allele. Similarly, three primers (8833F, 4342F, and 9935R) were designed to distinguish the two alleles of MYB10, and their location are shown in Figure 7. Primers 4342F and 9935R can generate a 451 bp DNA fragment from the non‐TE allele while 8833F and 9935R can generate an 1103 bp DNA fragment from the allele containing the 674 bp TE. The primer sequences are listed in Table S7.
RT‐PCR analysis of MYB10 and MYB110a expression
Total RNA was extracted from apple flowers at balloon stage using the Spectrum™ Plant Total RNA Kit (Sigma‐Aldrich) according to the manufacturer’s instructions. Reverse transcription and DNase I treatment was conducted using the Quantitect® Reverse Transcription Kit (Qiagen, Germantown, MD, USA). Relative expression of MYB10 and MYB110a was measured using the Roche LightCycler® 480 system (version 1.5) (Roche, Auckland, New Zealand) and analysed using the LightCycler software according to the methods previously reported (Lin‐Wang et al., 2010). Apple genes encoding actin and elongation factor 1α (EF1α) were used as references. Primer sequences are listed in Table S7. The results are shown as relative expression level to the reference genes as an average value from nine PCR reactions of three biological replicates and three technical replicates.
Transient transformation of apple petal tissues
To analyse promoter activity, four promoter fragments were amplified using PCR primers listed in Table S7 and fused to the GUS reporter gene in pBI101 vector (Jefferson et al., 1987) using the MonClone™ Hi‐Fusion Cloning Mix V2 kit (Monad, China, Shanghai) after the vector was linearized with HindIII and BamHI. The promoter fragments of MdMYB110a were amplified with primers MYB110aF3/R3 from GD (3030 bp) and with primers MYB110aF4/R3 from RG (3183 bp). Promoter fragments of MYB10 were amplified with primers MYB10‐8833F/8246R from GD (3111 bp) and with primers MYB10‐5011F/8246R from HT5 (2996 bp). These four promoter‐GUS constructs, as well as pBI101 containing a promoterless‐GUS and pBI121 containing CaMV35S‐GUS (Jefferson et al., 1987) were transferred separately in to A. tumefaciens GV3101 cells (http://www.weidibio.com) for use in plant transformation. For transformation, whole flowers of Malus baccata HT5 were collected at the balloon stage and sterilized with 0.5% NaClO for 12 min followed by three washes with sterilized distilled water. After sterilization, petal segments generated by cutting each petal into 3 pieces were co‐cultivated with the GV3101 cells harbouring each of the promoter constructs for two days on a medium (MS medium supplemented with 5 mg/L 6‐BA, 1 mg/L of NAA, and 1 mg/L of TDZ) as previously described (Yao et al., 2015). Thirty two petal segments were used for each construct in an experiment which was repeated three times. After the co‐cultivation, petal segments were transferred to a selection medium (the co‐cultivation medium supplemented with 100 mg/L of Kanamycin and 250 mg/L of cefotaxime) for four days before they were histochemically stained with 5‐bromo‐4‐chloro‐3‐indolyl b‐D‐glucuronide (X‐Gluc) for 24 h at 37°C, The stained petal segments were photographed after a treatment with 75% ethanol to remove any underlying pigment in the petal tissues and allowing easier visualization of the GUS expression.
Conflict of interest
The authors declare no conflict of interests.
Author contributions
J‐LY, YT, PC, and CHD conceived and designed the study. AT, JG, CHD, and J‐LY performed bioinformatics analyses. TD, MW, and XA performed the molecular biology experiments. YT, CA‐D, HIS, RJS, and LL contributed to the RNA‐seq data. YT, DW, YG, KW, HZ, RZ, ZZ, ZY, LZ, CZ, and PC contributed plant samples and phenotyping data. J‐LY and CHD wrote the manuscript. AG and DC revised the manuscript. All authors read and approved the final manuscript.
Supporting information
Figure S1 Characters of RGTH1 plant used for full genome sequence and assembly.
Figure S2 A TE identified in the promoter of a tryptophan aminotransferase gene was negatively associated with the allele‐specific expression.
Figure S3 Alignments of DNA and amino acid sequences of the two alleles of MYB110a.
Figure S4 PCR and DNA sequence analysis of apple accessions to show the allele types of MYB110a upstream region.
Figure S5 PCR analysis of apple cultivars and accessions to show the allele types of MYB10 promoter.
Figure S6 Procedures for identifying GDDH13 gene models representing the 2nd alleles corresponding to the alleles of RGTH1 reference genome.
Table S1 Number of ASE genes identified in four different apple tissues.
Table S2 List of ASE genes identified from four apple tissue types.
Table S3 Common ASE genes between two different tissue types.
Table S4 Two different alleles for the same gene identified from the RGTH1 and GDDH13 reference genomes.
Table S5 PCR analysis of MYB10 and MYB110a promoter.
Table S6 Summary of MYB10 and MYB110a promoter PCR analyses.
Table S7 Primers used for PCR and qRT‐PCR.
Acknowledgements
The study was funded by the National Key Research and Development Program of China (2018YFD1000200, 2018YFD1000100) and The New Zealand Institute for Plant and Food Research Limited’s China Fund. The authors acknowledge Plant & Food Research colleagues Marion Wood and Andrew Dare for commenting on the manuscript, and Joanna Bowen for sharing leaf RNA‐seq data.
Tian, Y. , Thrimawithana, A. , Ding, T. , Guo, J. , Gleave, A. , Chagné, D. , Ampomah‐Dwamena, C. , Ireland, H. S. , Schaffer, R. J. , Luo, Z. , Wang, M. , An, X. , Wang, D. , Gao, Y. , Wang, K. , Zhang, H. , Zhang, R. , Zhou, Z. , Yan, Z. , Zhang, L. , Zhang, C. , Cong, P. , Deng, C. H. and Yao, J.‐L. (2022) Transposon insertions regulate genome‐wide allele‐specific expression and underpin flower colour variations in apple (Malus spp.). Plant Biotechnol. J., 10.1111/pbi.13806
Contributor Information
Peihua Cong, Email: congpeihua@caas.cn.
Cecilia H. Deng, Email: cecilia.deng@plantandfood.co.nz.
Jia‐Long Yao, Email: jia-long.yao@plantandfood.co.nz.
Data availability statement
The RGTH1 reference genome sequence has been deposited in the NCBI database under BioProject accession PRJNA666203.
References
- Bryant, D.M. , Johnson, K. , DiTommaso, T. , Tickle, T. , Couger, M.B. , Payzin‐Dogru, D. , Lee, T.J. et al. (2017) A tissue‐mapped axolotl de novo transcriptome enables identification of limb regeneration factors. Cell Rep., 18, 762–776. [DOI] [PMC free article] [PubMed] [Google Scholar]
- Butelli, E. , Licciardello, C. , Zhang, Y. , Liu, J.J. , Mackay, S. , Bailey, P. , Reforgiato‐Recupero, G. et al. (2012) Retrotransposons control fruit‐specific, cold‐dependent accumulation of anthocyanins in blood oranges. Plant Cell, 24, 1242–1255. [DOI] [PMC free article] [PubMed] [Google Scholar]
- Camacho, C. , Coulouris, G. , Avagyan, V. , Ma, N. , Papadopoulos, J. , Bealer, K. and Madden, T.L. (2009) BLAST+: architecture and applications. BMC Bioinformatics, 10, 421. [DOI] [PMC free article] [PubMed] [Google Scholar]
- Chagne, D. , Crowhurst, R.N. , Pindo, M. , Thrimawithana, A. , Deng, C. , Ireland, H. and Fiers, M. et al. (2014) The draft genome sequence of European pear (Pyrus communis L. 'Bartlett'). PLoS One 9, e92644. [DOI] [PMC free article] [PubMed] [Google Scholar]
- Chagne, D. , Kui, L.W. , Espley, R.V. , Volz, R.K. , How, N.M. , Rouse, S. , Brendolise, C. et al. (2013) An ancient duplication of apple MYB transcription factors is responsible for novel red fruit‐flesh phenotypes. Plant Physiol., 161, 225–239. [DOI] [PMC free article] [PubMed] [Google Scholar]
- Cingolani, P. , Platts, A. , Wang, L.L. , Coon, M. , Nguyen, T. , Wang, L. , Land, S.J. et al. (2012) A program for annotating and predicting the effects of single nucleotide polymorphisms, SnpEff: SNPs in the genome of Drosophila melanogaster strain w(1118); iso‐2; iso‐3. Fly, 6, 80–92. [DOI] [PMC free article] [PubMed] [Google Scholar]
- Colle, M. , Leisner, C.P. , Wai, C.M. , Ou, S. , Bird, K.A. , Wang, J. , Wisecaver, J.H. et al. (2019) Haplotype‐phased genome and evolution of phytonutrient pathways of tetraploid blueberry. Gigascience, 8, giz012. [DOI] [PMC free article] [PubMed] [Google Scholar]
- Daccord, N. , Celton, J.M. , Linsmith, G. , Becker, C. , Choisne, N. , Schijlen, E. , van de Geest, H. et al. (2017) High‐quality de novo assembly of the apple genome and methylome dynamics of early fruit development. Nat. Genet., 49, 1099–1106. [DOI] [PubMed] [Google Scholar]
- Danecek, P. , Auton, A. , Abecasis, G. , Albers, C.A. , Banks, E. , DePristo, M.A. , Handsaker, R.E. et al. (2011) The variant call format and VCFtools. Bioinformatics, 27, 2156–2158. [DOI] [PMC free article] [PubMed] [Google Scholar]
- DePristo, M.A. , Banks, E. , Poplin, R. , Garimella, K.V. , Maguire, J.R. , Hartl, C. , Philippakis, A.A. et al. (2011) A framework for variation discovery and genotyping using next‐generation DNA sequencing data. Nat. Genet., 43, 491–498. [DOI] [PMC free article] [PubMed] [Google Scholar]
- Dobin, A. , Davis, C.A. , Schlesinger, F. , Drenkow, J. , Zaleski, C. , Jha, S. , Batut, P. et al. (2013) STAR: ultrafast universal RNA‐seq aligner. Bioinformatics, 29, 15–21. [DOI] [PMC free article] [PubMed] [Google Scholar]
- Dolezel, J. , Greilhuber, J. and Suda, J. (2007) Estimation of nuclear DNA content in plants using flow cytometry. Nat. Protoc., 2, 2233–2244. [DOI] [PubMed] [Google Scholar]
- Dubin, M.J. , Scheid, O.M. and Becker, C. (2018) Transposons: a blessing curse. Curr. Opin. Plant Biol., 42, 23–29. [DOI] [PubMed] [Google Scholar]
- Espley, R.V. , Brendolise, C. , Chagne, D. , Kutty‐Amma, S. , Green, S. , Volz, R. , Putterill, J. et al. (2009) Multiple repeats of a promoter segment causes transcription factor autoregulation in red apples. Plant Cell, 21, 168–183. [DOI] [PMC free article] [PubMed] [Google Scholar]
- Espley, R.V. , Hellens, R.P. , Putterill, J. , Stevenson, D.E. , Kutty‐Amma, S. and Allan, A.C. (2007) Red colouration in apple fruit is due to the activity of the MYB transcription factor, MdMYB10. Plant Journal, 49, 414–427. [DOI] [PMC free article] [PubMed] [Google Scholar]
- Fernandez, L. , Chaib, J. , Martinez‐Zapater, J.M. , Thomas, M.R. and Torregrosa, L. (2013) Mis‐expression of a PISTILLATA‐like MADS box gene prevents fruit development in grapevine. Plant J., 73, 918–928. [DOI] [PubMed] [Google Scholar]
- Fernandez, L. , Torregrosa, L. , Segura, V. , Bouquet, A. and Martinez‐Zapater, J.M. (2010) Transposon‐induced gene activation as a mechanism generating cluster shape somatic variation in grapevine. Plant J., 61, 545–557. [DOI] [PubMed] [Google Scholar]
- Feschotte, C. , Jiang, N. and Wessler, S.R. (2002) Plant transposable elements: where genetics meets genomics. Nat. Rev. Genet., 3, 329–341. [DOI] [PubMed] [Google Scholar]
- Galindo‐Gonzalez, L. , Mhiri, C. , Deyholos, M.K. and Grandbastien, M.A. (2017) LTR‐retrotransposons in plants: engines of evolution. Gene, 626, 14–25. [DOI] [PubMed] [Google Scholar]
- Gaur, U. , Li, K. , Mei, S.Q. and Liu, G.S. (2013) Research progress in allele‐specific expression and its regulatory mechanisms. J. Appl. Genet., 54, 271–283. [DOI] [PubMed] [Google Scholar]
- Guo, M. , Rupe, M.A. , Zinselmeier, C. , Habben, J. , Bowen, B.A. and Smith, O.S. (2004) Allelic variation of gene expression in maize hybrids. Plant Cell, 16, 1707–1716. [DOI] [PMC free article] [PubMed] [Google Scholar]
- Guo, M. , Rupe, M.A. , Yang, X.F. , Crasta, O. , Zinselmeier, C. , Smith, O.S. and Bowen, B. (2006) Genome‐wide transcript analysis of maize hybrids: allelic additive gene expression and yield heterosis. Theor. Appl. Genet., 113, 831–845. [DOI] [PubMed] [Google Scholar]
- Guo, M. , Yang, S. , Rupe, M. , Hu, B. , Bickel, D.R. , Arthur, L. and Smith, O. (2008) Genome‐wide allele‐specific expression analysis using Massively Parallel Signature Sequencing (MPSS (TM)) Reveals cis‐ and trans‐effects on gene expression in maize hybrid meristem tissue. Plant Mol. Biol. 66, 551–563. [DOI] [PubMed] [Google Scholar]
- Haile, S. , Corbett, R.D. , MacLeod, T. , Bilobram, S. , Smailus, D. , Tsao, P. , Kirk, H. et al. (2017) Increasing quality, throughput and speed of sample preparation for strand‐specific messenger RNA sequencing. BMC Genom. 18. [DOI] [PMC free article] [PubMed] [Google Scholar]
- Han, K.D. , Sen, S.K. , Wang, J.X. , Callinan, P.A. , Lee, J.N. , Cordaux, R. , Liang, P. et al. (2005) Genomic rearrangements by LINE‐1 insertion‐mediated deletion in the human and chimpanzee lineages. Nucleic Acids Res. 33, 4040–4052. [DOI] [PMC free article] [PubMed] [Google Scholar]
- Hofer, M. (2004) In vitro androgenesis in apple – improvement of the induction phase. Plant Cell Rep. 22, 365–370. [DOI] [PubMed] [Google Scholar]
- Hofer, M. (2005) Regeneration of androgenic embryos in apple (Malus x domestica Borkh.) via anther and microspore culture. Acta Physiol. Plant. 27, 709–716. [Google Scholar]
- Hoff, K.J. , Lomsadze, A. , Borodovsky, M. and Stanke, M. (2019) Whole‐genome annotation with BRAKER. Meth. Mol. Biol. 1962, 65–95. [DOI] [PMC free article] [PubMed] [Google Scholar]
- Jefferson, R.A. , Kavanagh, T.A. and Bevan, M.W. (1987) GUS fusions: beta‐glucuronidase as a sensitive and versatile gene fusion marker in higher plants. EMBO J. 6, 3901–3907. [DOI] [PMC free article] [PubMed] [Google Scholar]
- Kent, W.J. (2002) BLAT–the BLAST‐like alignment tool. Genome Res., 12, 656–664. [DOI] [PMC free article] [PubMed] [Google Scholar]
- Klumb, E.K. , Braga, E.J.B. and Bianchi, V.J. (2020) Differential expression of genes involved in the response of Prunus spp. rootstocks under soil flooding. Sci. Horticult. 261. [Google Scholar]
- von Korff, M. , Radovic, S. , Choumane, W. , Stamati, K. , Udupa, S.M. , Grando, S. , Ceccarelli, S. et al. (2009) Asymmetric allele‐specific expression in relation to developmental variation and drought stress in barley hybrids. Plant J., 59, 14–26. [DOI] [PubMed] [Google Scholar]
- Langmead, B. and Salzberg, S.L. (2012) Fast gapped‐read alignment with Bowtie 2. Nat. Methods, 9, 357–359. [DOI] [PMC free article] [PubMed] [Google Scholar]
- Li, H. (2018) Minimap2: pairwise alignment for nucleotide sequences. Bioinformatics, 34, 3094–3100. [DOI] [PMC free article] [PubMed] [Google Scholar]
- Li, H. , Handsaker, B. , Wysoker, A. , Fennell, T. , Ruan, J. , Homer, N. , Marth, G. et al. (2009) The sequence alignment/map format and SAMtools. Bioinformatics, 25, 2078–2079. [DOI] [PMC free article] [PubMed] [Google Scholar]
- Li, L. , Stoeckert, C.J. Jr and Roos, D.S. (2003) OrthoMCL: identification of ortholog groups for eukaryotic genomes. Genome Res. 13, 2178–2189. [DOI] [PMC free article] [PubMed] [Google Scholar]
- Lin, T. , Zhu, G.T. , Zhang, J.H. , Xu, X.Y. , Yu, Q.H. , Zheng, Z. , Zhang, Z.H. et al. (2014) Genomic analyses provide insights into the history of tomato breeding. Nat. Genet. 46, 1220–1226. [DOI] [PubMed] [Google Scholar]
- Linsmith, G. , Rombauts, S. , Montanari, S. , Deng, C.H. , Celton, J.‐M. , Guérif, P. , Liu, C. et al. (2019) Pseudo‐chromosome‐length genome assembly of a double haploid "Bartlett" pear (Pyrus communis L.). Gigascience, 8, giz138. [DOI] [PMC free article] [PubMed] [Google Scholar]
- Lin‐Wang, K. , Bolitho, K. , Grafton, K. , Kortstee, A. , Karunairetnam, S. , McGhie, T.K. , Espley, R.V. et al. (2010) An R2R3 MYB transcription factor associated with regulation of the anthocyanin biosynthetic pathway in Rosaceae. BMC Plant Biol. 10. [DOI] [PMC free article] [PubMed] [Google Scholar]
- Minio, A. , Massonnet, M. , Figueroa‐Balderas, R. , Castro, A. and Cantu, D. (2019) Diploid genome assembly of the wine grape carmenere. G3: Genes ‐ Genomes ‐ Genetics, 9, 1331–1337. [DOI] [PMC free article] [PubMed] [Google Scholar]
- Moriya, Y. , Itoh, M. , Okuda, S. , Yoshizawa, A.C. and Kanehisa, M. (2007) KAAS: an automatic genome annotation and pathway reconstruction server. Nucleic Acids Res. 35, W182–W185. [DOI] [PMC free article] [PubMed] [Google Scholar]
- Mushtaq, H. and Al‐Ars, Z. (2015) Cluster‐based apache spark implementation of the GATK DNA analysis pipeline. In Proceedings 2015 Ieee International Conference on Bioinformatics and Biomedicine ( Huan, J. , Miyano, S. , Shehu, A. , Hu, X. , Ma, B. , Rajasekaran, S. , Gombar, V.K. , Schapranow, I.M. , Yoo, I.H. , Zhou, J.Y. , Chen, B. , Pai, V. and Pierce, B. , eds), pp. 1471–1477. [Google Scholar]
- Newcomb, R.D. , Crowhurst, R.N. , Gleave, A.P. , Rikkerink, E.H.A. , Allan, A.C. , Beuning, L.L. , Bowen, J.H. et al. (2006) Analyses of expressed sequence tags from apple. Plant Physiol. 141, 147–166. [DOI] [PMC free article] [PubMed] [Google Scholar]
- Nishitani, C. , Inoue, E. , Saito, T. , Ogata, N. , Kita, K. , Gonai, T. , Kasumi, M. et al. (2020) Transcriptome analysis of watercore in Pyrus pyrifolia by comparing pairs of susceptible and resistant F1 sibs. Sci. Hortic. 264, 109136. [Google Scholar]
- Peace, C.P. , Bianco, L. , Troggio, M. , van de Weg, E. , Howard, N.P. , Cornille, A. , Durel, C.E. et al. (2019) Apple whole genome sequences: recent advances and new prospects. Horticult. Res. 6. [DOI] [PMC free article] [PubMed] [Google Scholar]
- Raymond, O. , Gouzy, J. , Just, J. , Badouin, H. , Verdenaud, M. , Lemainque, A. , Vergne, P. et al. (2018) The Rosa genome provides new insights into the domestication of modern roses. Nat. Genet., 50, 772–777. [DOI] [PMC free article] [PubMed] [Google Scholar]
- Robinson, J.T. , Thorvaldsdottir, H. , Winckler, W. , Guttman, M. , Lander, E.S. , Getz, G. and Mesirov, J.P. (2011) Integrative genomics viewer. Nat. Biotechnol. 29, 24–26. [DOI] [PMC free article] [PubMed] [Google Scholar]
- Sahebi, M. , Hanafi, M.M. , van Wijnen, A.J. , Rice, D. , Raffi, M.Y. , Azizi, P. , Osman, M. et al. (2018) Contribution of transposable elements in the plant's genome. Gene, 665, 155–166. [DOI] [PubMed] [Google Scholar]
- Shao, L. , Xing, F. , Xu, C.H. , Zhang, Q.H. , Che, J. , Wang, X.M. , Song, J.M. et al. (2019) Patterns of genome‐wide allele‐specific expression in hybrid rice and the implications on the genetic basis of heterosis. Proc. Natl Acad. Sci. USA, 116, 5653–5658. [DOI] [PMC free article] [PubMed] [Google Scholar]
- Shi, X.L. , Ng, D.W.K. , Zhang, C.Q. , Comai, L. , Ye, W.X. and Chen, Z.J.A. (2012) Cis‐ and trans‐regulatory divergence between progenitor species determines gene‐expression novelty in Arabidopsis allopolyploids . Nat. Commun. 3. [DOI] [PubMed] [Google Scholar]
- Shimada, T. , Endo, T. , Fujii, H. , Nakano, M. , Sugiyama, A. , Daido, G. , Ohta, S. et al. (2018) MITE insertion‐dependent expression of CitRKD1 with a RWP‐RK domain regulates somatic embryogenesis in citrus nucellar tissues. BMC Plant Biol. 18, 166. [DOI] [PMC free article] [PubMed] [Google Scholar]
- Simao, F.A. , Waterhouse, R.M. , Ioannidis, P. , Kriventseva, E.V. and Zdobnov, E.M. (2015) BUSCO: assessing genome assembly and annotation completeness with single‐copy orthologs. Bioinformatics, 31, 3210–3212. [DOI] [PubMed] [Google Scholar]
- Smit, A.F.A. and Hubley, R. (2008) RepeatModeler. Available Online at: http://www.repeatmasker.org
- Smit, A.F.A. , Hubley, R. and Green, P. (2013) RepeatMasker. Available Online at: http://www.repeatmasker.org
- Song, S.H. , Tian, D.M. , Zhang, Z. , Hu, S.N. and Yu, J. (2019) Rice genomics: over the past two decades and into the future. Genom. Prot. Bioinform. 16, 397–404. [DOI] [PMC free article] [PubMed] [Google Scholar]
- Springer, N.M. and Stupar, R.M. (2007) Allele‐specific expression patterns reveal biases and embryo‐specific parent‐of‐origin effects in hybrid maize. Plant Cell, 19, 2391–2402. [DOI] [PMC free article] [PubMed] [Google Scholar]
- Todesco, M. , Balasubramanian, S. , Hu, T.T. , Traw, M.B. , Horton, M. , Epple, P. , Kuhns, C. et al. (2010) Natural allelic variation underlying a major fitness trade‐off in Arabidopsis thaliana . Nature, 465, 632–636. [DOI] [PMC free article] [PubMed] [Google Scholar]
- Usai, G. , Mascagni, F. , Giordani, T. , Vangelisti, A. , Bosi, E. , Zuccolo, A. , Ceccarelli, M. et al. (2020) Epigenetic patterns within the haplotype phased fig (Ficus carica L.) genome. Plant J. 102, 600–614. [DOI] [PubMed] [Google Scholar]
- Velasco, R. , Zharkikh, A. , Affourtit, J. , Dhingra, A. , Cestaro, A. , Kalyanaraman, A. , Fontana, P. et al. (2010) The genome of the domesticated apple (Malus × domestica Borkh.). Nat. Genet. 42, 833–839. [DOI] [PubMed] [Google Scholar]
- Wang, F. , Chen, S. , Liang, D.Y. , Qu, G.Z. , Chen, S. and Zhao, X.Y. (2020) Transcriptomic analyses of Pinus koraiensis under different cold stresses. BMC Genom. 21. [DOI] [PMC free article] [PubMed] [Google Scholar]
- Wang, X. , Xu, Y.T. , Zhang, S.Q. , Cao, L. , Huang, Y. , Cheng, J.F. , Wu, G.Z. et al. (2017) Genomic analyses of primitive, wild and cultivated citrus provide insights into asexual reproduction. Nat. Genet. 49, 765–772. [DOI] [PubMed] [Google Scholar]
- Waters, A.J. , Makarevitch, I. , Noshay, J. , Burghardt, L.T. , Hirsch, C.N. , Hirsch, C.D. and Springer, N.M. (2017) Natural variation for gene expression responses to abiotic stress in maize. Plant J. 89, 706–717. [DOI] [PubMed] [Google Scholar]
- Wu, G.A. , Terol, J. , Ibanez, V. , Lopez‐Garcia, A. , Perez‐Roman, E. , Borreda, C. , Domingo, C. et al. (2018) Genomics of the origin and evolution of Citrus. Nature, 554, 311–316. [DOI] [PubMed] [Google Scholar]
- Wu, J. , Wang, Z.W. , Shi, Z.B. , Zhang, S. , Ming, R. , Zhu, S.L. , Khan, M.A. et al. (2013) The genome of the pear (Pyrus bretschneideri Rehd.). Genome Res. 23, 396–408. [DOI] [PMC free article] [PubMed] [Google Scholar]
- Wysoker, A. , Tibbetts, K. and Fennell, T. (2013) Picard tools version 1.90. 107, 308. http://picard.sourceforge.net [Google Scholar]
- Xu, Q. , Chen, L.L. , Ruan, X.A. , Chen, D.J. , Zhu, A.D. , Chen, C.L. , Bertrand, D. et al. (2013) The draft genome of sweet orange (Citrus sinensis). Nat. Genet. 45, 59–66. [DOI] [PubMed] [Google Scholar]
- Yao, J.‐L. , Dong, Y.‐H. and Morris, B.A. (2001) Parthenocarpic apple fruit production conferred by transposon insertion mutations in a MADS‐box transcription factor. Proc. Natl Acad. Sci. 98, 1306–1311. [DOI] [PMC free article] [PubMed] [Google Scholar]
- Yao, J.‐L. , Xu, J. , Cornille, A. , Tomes, S. , Karunairetnam, S. , Luo, Z. , Bassett, H. et al. (2015) A microRNA allele that emerged prior to apple domestication may underlie fruit size evolution. Plant J. 84, 417–427. [DOI] [PubMed] [Google Scholar]
- Zerpa‐Catanho, D. , Wai, J. , Wang, M.L. , Yu, L. , Nguyen, J. and Ming, R. (2019) Differential gene expression among three sex types reveals a MALE STERILITY 1 (CpMS1) for sex differentiation in papaya. BMC Plant Biol. 19. [DOI] [PMC free article] [PubMed] [Google Scholar]
- Zhang, J.S. , Zhang, X.T. , Tang, H.B. , Zhang, Q. , Hua, X.T. , Ma, X.K. , Zhu, F. et al. (2018) Allele‐defined genome of the autopolyploid sugarcane Saccharum spontaneum L. Nat. Genet. 50, 1565–1573. [DOI] [PubMed] [Google Scholar]
- Zhang, L.Y. , Hu, J. , Han, X.L. , Li, J.J. , Gao, Y. , Richards, C.M. , Zhang, C.X. et al. (2019) A high‐quality apple genome assembly reveals the association of a retrotransposon and red fruit colour. Nat. Commun. 10. [DOI] [PMC free article] [PubMed] [Google Scholar]
- Zhang, X. and Borevitz, J.O. (2009) Global analysis of allele‐specific expression in Arabidopsis thaliana . Genetics, 182, 943–954. [DOI] [PMC free article] [PubMed] [Google Scholar]
- Zhuang, W.J. , Chen, H. , Yang, M. , Wang, J.P. , Pandey, M.K. , Zhang, C. , Chang, W.C. et al. (2019) The genome of cultivated peanut provides insight into legume karyotypes, polyploid evolution and crop domestication. Nat. Genet. 51, 865–876. [DOI] [PMC free article] [PubMed] [Google Scholar]
- Zimin, A.V. , Marcais, G. , Puiu, D. , Roberts, M. , Salzberg, S.L. and Yorke, J.A. (2013) The MaSuRCA genome assembler. Bioinformatics, 29, 2669–2677. [DOI] [PMC free article] [PubMed] [Google Scholar]
Associated Data
This section collects any data citations, data availability statements, or supplementary materials included in this article.
Supplementary Materials
Figure S1 Characters of RGTH1 plant used for full genome sequence and assembly.
Figure S2 A TE identified in the promoter of a tryptophan aminotransferase gene was negatively associated with the allele‐specific expression.
Figure S3 Alignments of DNA and amino acid sequences of the two alleles of MYB110a.
Figure S4 PCR and DNA sequence analysis of apple accessions to show the allele types of MYB110a upstream region.
Figure S5 PCR analysis of apple cultivars and accessions to show the allele types of MYB10 promoter.
Figure S6 Procedures for identifying GDDH13 gene models representing the 2nd alleles corresponding to the alleles of RGTH1 reference genome.
Table S1 Number of ASE genes identified in four different apple tissues.
Table S2 List of ASE genes identified from four apple tissue types.
Table S3 Common ASE genes between two different tissue types.
Table S4 Two different alleles for the same gene identified from the RGTH1 and GDDH13 reference genomes.
Table S5 PCR analysis of MYB10 and MYB110a promoter.
Table S6 Summary of MYB10 and MYB110a promoter PCR analyses.
Table S7 Primers used for PCR and qRT‐PCR.
Data Availability Statement
The RGTH1 reference genome sequence has been deposited in the NCBI database under BioProject accession PRJNA666203.