

Keywords: brainstem hemorrhage, diffuse tensor imaging, diffusion-weighted imaging, Fluoro-Jade C staining, hematoxylin-eosin staining, interleukin-1β, luxol fast blue, rat model, T2-weighted imaging, tumor necrosis factor-α
Abstract
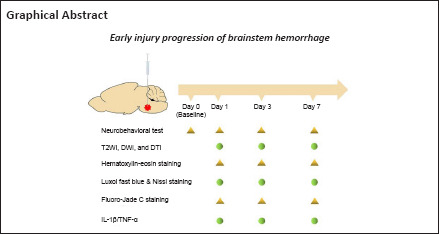
According to clinical statistics, the mortality of patients with early brainstem hemorrhage is high. In this study, we established rat models of brainstem hemorrhage by injecting type VII collagenase into the right basotegmental pontine and investigated the pathological changes of early brainstem hemorrhage using multi-sequence magnetic resonance imaging and histopathological methods. We found that brainstem hematoma gradually formed in the injured rats over the first 3 days and then reduced after 7 days. The edema that occurred was mainly of the vasogenic type. No complete myelin sheath structure was found around the focus of the brainstem hemorrhage. The integrity and continuity of nerve fibers gradually deteriorated over the first 7 days. Neuronal degeneration was mild in the first 3 days and then obviously aggravated on the 7th day. Inflammatory cytokines, interleukin-1β, and tumor necrosis factor α appeared on the 1st day after intracerebral hemorrhage, reached peak levels on the 3rd day, and decreased from the 7th day. Our findings show the characteristics of the progression of early brainstem hemorrhage.
Introduction
Brainstem hemorrhage (BSH) is a particularly deadly subtype of intracerebral hemorrhage (ICH), with an annual incidence of 2–4 cases per 100,000 persons worldwide. This life-threatening cerebrovascular event has a mortality of up to 61.2% because effective therapies involving conventional surgery, intravascular therapy, and medicine have not been developed (Balci et al., 2005; Mendelow et al., 2013; Matsukawa et al., 2015; Tao et al., 2016a). Unlike supratentorial hemorrhage, few clinical studies on BSH have been reported because of the difficulties in collecting complete case information and the patients’ critical condition. Furthermore, the brainstem has a unique structure fed by the posterior circulation that makes it possible that BSH has a different developmental process or pathological evolution to other cerebral hemorrhage types (such as cortical intracerebral hemorrhage or striatal intracerebral hemorrhage). Therefore, it is crucial to study injury progression in BSH, to provide not only knowledge on the injury mechanisms but also potential therapeutic targets for clinical therapy. Animal models mimicking the clinical conditions are useful tools to understand BSH-related pathophysiological changes; they can be applied not only to investigations of the molecular mechanisms underlying BSH development and recovery but also to evaluations of therapeutic interventions (Hemorrhagic Stroke Academia Industry (HEADS) Roundtable Participants, 2018; Zhao et al., 2020; Xu et al., 2022). Furthermore, approaches using clinically relevant magnetic resonance imaging (MRI) sequences to assess BSH progression in animal models have been attracting increasing attention (Seo and Jang, 2015; Yang et al., 2017; Tang et al., 2021; Wang et al., 2021). For example, T2-weighted imaging (T2WI), diffusion-weighted imaging (DWI), and diffuse tensor imaging (DTI) have been used to assess hematoma, edema, and white matter injury, respectively. However, little has been reported on the use of MRI to study BSH models (Tao et al., 2016b). Therefore, we established a rat model of autologous blood-induced BSH and used 7.0-T MRI to study white matter injury following intracerebral hemorrhage. Our results showed that the MRI data were consistent with the histological findings, which indicated that MRI is useful for studying rat models of BSH (Guo et al., 2020). In general, autologous blood and collagenase models are complementary for simulating the clinical conditions; models of autologous blood-induced BSH are beneficial for investigating the mechanisms underlying the toxicity of blood components, while models of collagenase-induced BSH can mimic the cerebral vessel rupture, blood-brain barrier breakdown, and hematoma expansion seen in patients (Guo et al., 2020). Therefore, it is important to study collagenase-induced BSH models with the aid of MRI.
In this study, we investigated the progression of early brainstem injury in a rat model of collagenase-induced BSH because BSH has a higher mortality in the early stage than other types of intracerebral hemorrhage (Wijdicks and St Louis, 1997; Balci et al., 2005; Meguro et al., 2015). To address this purpose, this study focused on neurobehavior, hematoma and perihematomal edema formation, white matter injury, neuron degeneration, and inflammatory cytokines. In particular, we used 7.0-T MRI to assess hematoma lesions, brain edema, and white matter injury.
Methods
Animals
The incidence of BSH is reported to be higher in men than in women (Chen et al., 2021), probably because of personal living habits and health conditions prior to illness. Therefore, we selected male rats to simulate the clinical situation. This study was approved by the Animal Care and Use Committee of West China Hospital, Sichuan University, in 2018 (approval No. 2018123A). Adult male Sprague-Dawley rats (body weight 235–270 g, age 6–7 weeks, specific pathogen-free level; Dashuo Laboratory Animal Co., Ltd., Chengdu, China, license No. SCXK 2015-030) were used in this study. They were housed in the animal center of West China Hospital at a temperature of 24°C, humidity of 55 ± 5%, a 12-hour light/dark cycle, and with free access to food and water. All efforts were made to minimize the animals’ suffering. All experiments were designed and reported according to the Animal Research: Reporting of In Vivo Experiments (ARRIVE) guidelines (Percie du Sert et al., 2020).
BSH models
Seventy rats were included in this study, from which 58 were randomly selected for the BSH group and the remaining 12 were used as the sham group. Animals were anesthetized with isoflurane inhalation (RWD, Shenzhen, China; 2.5–3.5% for induction and 1.5–2.5% for anesthesia maintenance) throughout the model induction procedure. As shown in Additional Figure 1 (71.7KB, tif) , the heads of the rats were fixed on a standard stereotactic instrument (RWD) and BSH was induced by infusing type VII collagenase (0.2 IU in 0.75 μL normal saline; Sigma-Aldrich, St. Louis, MO, USA) with a 1-μL Hamilton microlitre syringe to the location of the right basotegmental pontine (10.2 mm posterior to and 1.4 mm lateral from the bregma, 9.15 mm below the skull) (Guo et al., 2020). A minipump (RWD) was used to attain a constant infusion rate of 0.2 μL/minute and the needle was left for 10 minutes to avoid back-leakage of collagenase before slow extraction at a speed of 1 mm/minute. The burr holes were then sealed up with bone wax and operation incisions were sutured. The sham group was infused with normal saline to the same volume as the type VII collagenase. The core temperature of the rats was maintained at 36–37°C using an animal thermostat system (Shanghai Alcott Biotech, Shanghai, China). On days 1, 3, and 7, four and five rats were sacrificed for histopathology in the sham and BSH groups, respectively. Because of a high death rate in the BSH group, all remaining rats underwent repeated MRI at the indicated times after surgery.
MRI scanning
All MRI was acquired on a 7.0-T magnetic resonance scanner for small animals (Bruker BioSpec 70/30, Ettlingen, Germany). During the MRI scans, the rats were anesthetized with isoflurane (2.5–3.5% for induction and 1.5–2.5% for maintenance of anesthesia) through spontaneous respiration. Their body temperature was maintained at approximately 37°C. The narcotized rats were scanned on days 1, 3, and 7 after BSH modeling, with a vital condition monitor also being used. The quantitative multi-sequence MRI protocol included T2WI, DWI, and DTI. The T2WI was performed using a rapid acquisition with a relaxation enhancement sequence (repetition time/echo time = 2500/33 ms). The DWI and DTI scans used a diffusion-weighted echo-planar imaging sequence with the following parameters: repetition time/echo time = 1500 ms/21 ms; b = 1000 s/mm2; 30 diffusion gradient directions for DTI. The field of view was 35 × 35 mm2 and the matrix size 256 × 256. Ten 1-mm-thick coronal slices were obtained from each rat.
MRI analysis and quantification of hematoma lesion, edema, and white matter injury
In the rats that underwent BSH modeling, the hematoma lesion areas were manually defined and delimited on T2WI 1, 3, and 7 days after modeling, and the lesion volume was calculated using ITK-SNAP (www.itksnap.org) (Yushkevich et al., 2006). Edema volumes were calculated by defining the area of the surrounding ring of hematoma with different MRI signals on T2WI and DWI images acquired on days 1, 3, and 7, and then by multiplying the areas by their thickness. The T2 signal ratio (ipsilateral/contralateral) of the central core and the surrounding ring of hematoma were also calculated. The apparent diffusion coefficient (ADC) ratio was defined as the ratio of the ipsilateral ADC value to that of a similar contralateral region. Fractional anisotropy (FA) values for DTI were calculated using ParaVision Acquisition 6.0.1 (Bruker) (Additional Figure 2 (436.6KB, tif) ). The maximum possible FA value of 1 represents the best integrity and continuity, whereas the minimum value of 0 represents the worst.
Neurobehavioral testing
The modified Voetsch score for posterior circulation stroke was used to access neurologic behavior abnormalities on days 1, 3, and 7 after BSH modeling. Baseline neurobehavior was also recorded before the operation. The modified Voetsch score (Additional Table 1) consists of 14 individual test scores, including spontaneous head movement, activity, exploration in a light-dark box, hearing, pain reflex, corneal reflex, proprioception, neck sensation, torso sensation, circling, four limb movement, forelimb movement, climbing and beam walking (Shrestha et al., 2018). Each test score ranges from 0 to 3 points (0 for worst to 3 for normal). The modified Voetsch score ranged from 0 to 42 points in total.
Additional Table 1.
Modified Voetsch score
| 3 | 2 | 1 | 0 | |
|---|---|---|---|---|
| Spontaneous Head movement | Moves in all direction | Prefers 1 side | Only to 1 side | Flexed to 1 side |
| Activity | Fully responsive | Moderately responsive | Minimally responsive | Coma |
| Exploration in light dark box | Reaches Light and dark space actively | Prefers only one space (light space/dark space) and move within it | Moves slowly only after stimulus. | No movement |
| Hearing (Auditory startle) | Finger rub | Snap to fingers | Loud clap | No startle |
| Pain reflex (ear pinch) | Cry out loud and moves away from stimulus | Moves away from stimulus only | Show some movement to pain | No reaction |
| Corneal reflex | Present | Diminished in one side | Diminished in both side | Absent |
| Proprioception (Vibrissae) | React on touch | Diminished in one side | Diminished in both side | Absent |
| Neck Sensation | React on touch actively | Slow reaction to touch | Greatly Diminished reaction | No reaction |
| Torso Sensation | Brisk and symmetrical reaction | Slightly diminished or asymmetrical reaction | Greatly diminished and asymmetrical | No reaction |
| Circling | Bilateral turns | Prefers one side | Only to one side | No circling |
| Four limb movement | Equal bilateral | Slight asymmetry | Great asymmetry | Paresis |
| Forelimb movement | Equal bilateral | Slight asymmetry | Great asymmetry | Paresis |
| Climbing the inclined plain | Climbs to top | Impaired climbing | Stationary grip | Falls immediately |
| Beam walk | Explore both ends | Explore one end only | Some movement and fall | No movement |
Histopathological observations
After the neurobehavioral test and MRI scanning on days 1, 3, and 7, the rats selected for sacrifice were anesthetized by intraperitoneal injection of 5% pentobarbital sodium (5 mg/100 g; Sigma-Aldrich, Merck KGaA, Darmstadt, Germany) and perfused by cardiac injection of 0.1 M phosphate buffered saline (pH 7.4). The brains, including the brainstem, were harvested immediately and immersed in 4% paraformaldehyde solution overnight. The brain tissue except for the brainstem was then removed, trimmed to an appropriate size (anterior and posterior to the hematoma in the brainstem), and re-immersed in 4% paraformaldehyde solution for 24 hours before paraffin embedding. Six-μm-thick sections were sliced and placed into a water bath with forceps. The tissue sections were retrieved with slides after complete unfolding and placed on a 50°C spreader to dry. Finally, all paraffin sections were placed into a sectioning box, put into an oven at 40–45°C for overnight drying, and then stored in a cool place away from light. Before any staining, the previously prepared paraffin sections were heated in a drying oven at 60°C for 30 minutes, treated with xylene I for 20 minutes, xylene II for 20 minutes, anhydrous ethanol I for 10 minutes, anhydrous ethanol II for 15 minutes, 95% ethanol solution for 5 minutes, 90% ethanol solution for 5 minutes, 70% ethanol solution for 5 minutes, and finally rinsed with tap water for 30 seconds.
Hematoxylin-eosin staining was performed in a standard manner to observe the general cellular morphology and tissue changes around the hematoma. Luxol fast blue (LFB) co-staining with Nissl and Fluoro-Jade C (FJC) immunofluorescence were performed to observe hematoma and perihematomal edema, myelin integrity (white matter injury), and neuron degeneration. After deparaffinization as described above, sections were immersed into hematoxylin and eosin stains (Biyuntian Biotechnology Co., Ltd., Shanghai, China), then dehydrated with graded ethanol and fixed with neutral balsam (Beijing Suolaibao Science and Technology Co., Ltd., Beijing, China). For Luxol fast blue-Nissl staining (Beijing Suolaibao Science and Technology Co., Ltd.), after being deparaffinized as described above, the sections were rehydrated in 95% alcohol and incubated in LFB solution at 60°C overnight, then washed with one or two cycles of 0.05% lithium carbonate with ethanol/distilled water. Thereafter, the same sections were incubated in Nissl staining solution for 10 minutes, washed with distilled water for 1 minute, then mounted with neutral balsam. FJC staining (Merk Milipore, Burlington, MA, USA) was performed by deparaffinizing prepared sections, immersing them in 0.06% potassium permanganate solution for 10 minutes, then a 0.0001% solution of FJC for 20 minutes, followed by mounting with neutral balsam.
For immunofluorescence staining, the deparaffinized sections were boiled in antigen retrieval buffer containing ethylenediaminetetraacetic acid in a microwave at high power for 10 minutes and then incubated in a 3% H2O2 solution for 15 minutes at room temperature. After being washed in 0.1 M phosphate buffered saline, the sections were incubated with the primary antibodies rabbit anti-interleukin 1 beta (anti-IL-1β, 1:200, Proteintech, Chicago, IL, USA, Cat# 16765-1-AP, RRID: AB_10641044) and rabbit anti-tumor necrosis factor alpha (anti-TNF-α, 1:200, Cat# 60291-1-Ig, Proteintech, RRID: 60291-1-Ig) overnight at 4°C, and with the secondary antibody biotin-tagged goat anti-rabbit IgG (1:200, Zhongshan Golden Bridge, Beijing, China, ZSGB-Bio Cat# ZB-2301, RRID: AB_2747412) for 30 minutes at 37°C. The color was visualized with 3,3′-diaminobenzidine and counterstaining was performed with hematoxylin.
Representative images were acquired by light microscopy (BX43, Olympus, Tokyo, Japan), except for the FJC staining images, which were acquired by fluorescence microscopy (AX10 imager A2 cam HRC; Carl Zeiss, Oberkochen, Germany). Three microscopic fields around the hematoma were randomly selected from each of two sections per rat and used for the quantitative analysis performed with the open-source software Fiji (National Institutes of Health, Bethesda, MD, USA) (Schindelin et al., 2012). The numbers of FJC-positive cells in the immunofluorescence slices of the brainstem were counted by two investigators. The FJC-positive cell density was expressed as the ratio of the number of FJC positive cells to the area of the microscopic field (/mm2). The expression levels of IL-1β and TNF-α were assessed as the percentage area of positive signals.
Statistical analysis
No statistical methods were used to predetermine sample sizes, but our sample sizes were similar to those reported in previous publications (Tao et al., 2016b; Guo et al., 2020). Neurobehavioral and histopathological tests were performed by an examiner who was blinded to the experiments. Data are presented as the mean ± standard deviation (SD). The Kruskal-Wallis test was used for comparisons of neurobehavioral scores. Other data were analyzed with one-way analysis of variance and Tukey’s post hoc test. A P-value less than 0.05 was considered statistically significant. Statistical analysis was performed with SPSS Statistics 19 (IBM, Armonk, NY, USA).
Results
Successful establishment of rat models of BSH
In the BSH group, the rat mortality rates were 21%, 33%, and 55% on days 1, 3, and 7, respectively, values that are similar to the high mortality rates reported in human studies, which range from 58% to 61% (Wijdicks and St Louis, 1997; Balci et al., 2005; Matsukawa et al., 2015; Meguro et al., 2015; Tao et al., 2016a). Approximately 84% of the rats in the BSH group exhibited evident neurobehavioral deficits. In addition, in the gross samples (Figure 1A) and coronal brain section tissue (Figure 1B) acquired on day 3, a hematoma was observed in the right pontine in the animals in the BSH group (white arrow), but not in those in the sham group. Consistent with this, typical hemorrhagic lesions were also noticed in the right pontine in the coronal hematoxylin-eosin stained images (Figure 1C and D).
Figure 1.

Successful establishment of a BSH model.
(A, B) Fresh brain samples harvested from rats on day 3 are displayed (A). These were then cut into slices and fixed in paraformaldehyde solution (B). Hematomas are indicated by white arrows. (C, D) The hematoxylin and eosin-stained slice shows a typical hematoma in the right pontine. Scale bars: 1 mm in C, 200 μm in D. BSH: Brainstem hemorrhage.
Neurobehavioral functions in a rat model of BSH
The modified Voetsch score results are shown in Figure 2. At each time point, the rats in the BSH group had a significantly lower modified Voetsch score than those in the sham group (P < 0.05). In the BSH group, the modified Voetsch score increased from day 1 to day 3 (P < 0.03, the Kruskal-Wallis test), then was relatively stable from day 3 to day 7 (P > 0.05). In contrast, the rats in the sham group behaved normally and their modified Voetsch scores were constant.
Figure 2.

BSH decreases neurobehavioral functioning in rats.
All rats behaved normally before surgery and their modified Voetsch scores are out of 42. Data are expressed as mean ± SD (n = 6), and were analyzed by Kruskal-Wallis test. The BSH group rats had a significantly lower modified Voetsch score than the sham group rats (P < 0.05). The modified Voetsch score in the BSH group increased from day 1 to day 3 (P < 0.05). BSH: Brainstem hemorrhage.
Hematoma lesion volume and edema in a rat model of BSH
On T2WI, the hematoma core was hyperintense on days 1 and 3, then changed to nearly isointense on day 7 (Figure 3A–F). Quantitative analysis showed that lesion volume on T2WI decreased from day 1 to day 7 (Figure 3G). The T2 signal ratio of the central core, which partially reflects the change in water content and hematoma elements, increased from day 1 to reach the highest value on day 3, and had then reduced by day 7; the values on days 1 and 3 were significantly higher than those in the sham experiment (P < 0.05; Figure 3H).
Figure 3.

BSH induces hematoma lesions.
(A–G) Hematoma lesion volume in the brainstem measured on coronal T2WI (A–C) and sagittal T2WI (D–F) decreased from day 1 to day 7. Scale bars: 2.5 mm in A–C; 5 mm in D–F. (H) The T2 signal ratio increased over the first 3 days and then decreased from day 3 to day 7. Data are expressed as mean (n = 4). *P < 0.05, vs. day 1 (one-way analysis of variance followed by Tukey’s post hoc test). BSH: Brainstem hemorrhage; T2WI: T2-weighted imaging.
To determine the type and volume of the perihematomal edema, DWI and T2WI values were calculated from the ring-like regions adjacent to the hematoma. These areas surrounding the hematoma, which were manually circumscribed and defined as edema regions (Figure 4A; areas circled by white curve), exhibited different MRI signals from the hematoma on DWI and T2 images. We found an obvious change in T2 signal in perihematomal regions within 7 days; that is, a hyperintense region around the hematoma on both DWI and T2WI images on day 1, which had turned to hypointense signal on T2WI on day 7, suggesting that vasogenic edema instead of cytotoxic edema occurred during this period.
Figure 4.
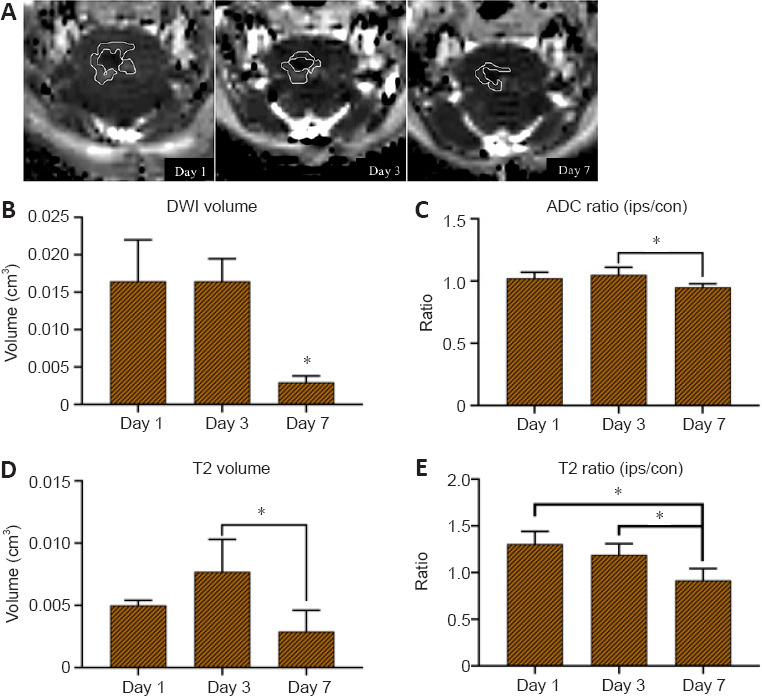
Surrounding edema of brainstem hemorrhage hematoma.
(A) Vasogenic edema occurred rather than cytotoxic edema, with the edema increasing from day 1 to day 3, and then having decreased on day 7. Perihematomal edema volume from day 1 to 7 is circumscribed by white curves on DWI. (B–E) The features of the edema region were analyzed using DWI and T2-weighted imaging. (B) Volume of edema on DWI, (C) apparent diffusion coefficient (ADC) ratio, (D) volume of edema on T2-weighted imaging, (E) T2 ratio (ips/con). Data are expressed as mean (n = 4). *P < 0.05 (one-way analysis of variance followed by Tukey’s post hoc test). con: Contralateral; DWI: diffusion-weighted imaging; ips: ipsilateral.
A previous report (Yang et al., 2017) suggested that the edema peak observable on MRI occurred around day 3 after ICH induction, while we found maximum edema volume on DWI on both days 1 and 3 (Figure 4B), and maximum edema volume on T2WI on day 3 (Figure 4D). Finally, the same tendency as previously reported was found on both DWI and T2WI on day 7, with edema volume decreasing to a minimum. The ratios of the ADC and T2 values in the edema region to those in the corresponding contralateral region were used to show the signal changes, as the ADC ratio elevated at the beginning then decreased to baseline on day 7 (Figure 4C). The maximum T2 ratio appeared on day 1 then gradually reduced until day 7, reaching a low signal intensity compared with that of the sham group (Figure 4E).
Histology of the hematoma region in the brainstem of a rat model of BSH
On the hematoxylin-eosin-stained sections (Figure 5), a slightly-stained region around the border of the hematoma (the yellow dashed line) consisting of pericellular vacuolization, demyelinated axons, swelling neurons, and mass-activated microglia was observed around the hematoma region. From the time of modeling to day 7, a growing number of inflammatory cells, such as microglial cells, gathered and migrated from the border to the center of the hematoma, and erythrocytes were gradually cleared up until they had totally disappeared. On days 3 and 7, when the tissue around the hematoma changed to a loose nature and edema was largely seen around the necrosis area, the hematoma region was replaced with activated microglia that were revealed to be gitter cells because of their phagocytosis of cell debris such as erythrocytes in the necrotic region. In the sham group, the morphology of the neurons and other glial cells was normal, and no infiltration of inflammatory cells was observed within 7 days.
Figure 5.

Hematoxylin and eosin staining of brainstem hemorrhage from day 1 to day 7.
In the hematoma lesion (dark stars), red blood cells decreased while activated microglia increased from day 1 to day 7. There were no infiltrated inflammatory cells within 7 days in the sham group. The yellow dotted lines indicate the lesion border. Scale bar: 50 μm. BSH: Brainstem hemorrhage.
White matter injury in the brainstem of a rat model of BSH
The temporal patterns of LFB and Nissl staining on brainstem slices are shown in Figure 6A. The normal myelin sheath of the axon was easily stained by LFB, whereas the injured myelin sheath was little stained. The structure of the normal nerve fiber bundle on LFB-stained images is a round or oval blue disk within which there are several vacuoles formed by a little-stained axon. In the BSH group, the myelin sheath was almost destroyed within or around the hematoma area, and no complete myelin sheath structure was observed from days 1 to 7. Under the Nissl staining, the neurons in the sham group showed a clear and intact structure, while those in the BSH group showed severe structural damage around the hematoma.
Figure 6.

Luxol fast blue-Nissl staining and fractional anisotropy analysis in BSH.
(A) Luxol fast blue staining of the brainstem was co-stained with Nissl. The myelin sheath around the hematoma area was almost destroyed as no complete myelin sheath structure was observed from day 1 to day 7. The hemorrhagic area and hematoma border are marked with a black star and a yellow dashed line. Scale bar: 50 μm. (B) Fractional anisotropy values of the upper pons (up) and cerebral peduncle (cp) from the ipsilateral (ips) hematoma. Data are expressed as mean (n = 4). *P < 0.05 (one-way analysis of variance followed by Tukey’s post hoc test). BSH: Brainstem hemorrhage.
In addition to the LFB staining, the integrity and continuity of the brainstem nerve fibers were observed by DTI. The DTI data were acquired from image sections of the upper pons and cerebral peduncle near to the hematoma. Lowered FA values were found in the ipsilateral hematoma on the brainstem on days 3 and 7 (P < 0.05, vs. day 1) in the BSH group (Figure 6B). In the upper pons and cerebral peduncles, the decreased FA values represented injury of nerve fibers in the brainstem, which is in line with the results of the LFB staining.
Neuron degeneration in the brainstem of a rat model of BSH
FJC staining was used to investigate neuron degeneration. As shown in Figure 7, the induced hematoma of the pontine not only damaged white matter and the surrounding region but also caused neuron injury and degeneration (Gutiérrez et al., 2018; Jiang et al., 2019). Typical and scattered FJC-positive cells were visualized around the hematoma under fluorescence microscopy. As expected, no specific labeled neurons were encountered in the sham group or contralateral hematoma (Figure 7A). On days 1 and 3, the numbers of FJC-positive cells were considerably lower than the sharply increased number present on day 7. Generally, the number of specific labeled neurons in the BSH group was higher than that in the sham group from day 1 to day 7 (Figure 7B).
Figure 7.

Fluoro-Jade C staining and analysis in BSH.
(A) Fluoro-Jade C (FJC) immunofluorescence images of the pontine from day 1 to day 7. The number of FJC positive cells was low on days 1 and 3 and then showed a sharp increase on day 7. White arrows indicate FJC positive cells. Sporadic FJC positive cells were observed in the BSH group, whereas no fluorescence-labeled cells were observed in the corresponding sham group. Scale bar: 25 μm. (B) Number of FJC positive cells in brainstem tissue. Data are expressed as mean (n = 4). *P < 0.05, vs. sham group (one-way analysis of variance followed by Tukey’s post hoc test). BSH: Brainstem hemorrhage.
Inflammatory factors in the brainstem of a rat model of BSH
The expression of inflammatory cytokines such as IL-1β and TNF-α around the hematoma was detected by immunohistochemical staining. The immunopositivities of two inflammatory cytokines, IL-1β and TNF-α, are shown in Figure 8. Both of these were produced on the first day after BSH, peaked on day 3, and had then decreased on day 7. However, the expression levels of IL-1β and TNF-α at the beginning were slightly different from those on day 7; in other words, IL-1β was more highly expressed on day 1 than on day 7, while the expression of TNF-α showed the opposite pattern.
Figure 8.

IL-1β and TNF-α in the brainstem after BSH.
(A) IL-1β and TNF-α immunohistochemical staining of the brainstem from day 1 to day 7. The expression of IL-1β and TNF-α reached peaks on day 3. (B) The IL-1β and TNF-α positive areas were calculated and are presented in the histogram. Scale bars: 50 μm. Data are expressed as mean (n = 4). *P < 0.05 (one-way analysis of variance followed by Tukey’s post hoc test). BSH: Brainstem hemorrhage; IL-1β: interleukin 1 beta; TNF-α: tumor necrosis factor alpha.
Discussion
More than two-thirds of ICH events are supratentorial and/or infratentorial ICH, and BSH cases are seldom reported in clinical studies (Morotti et al., 2016). The high mortality of BSH in humans, the lack of clinical studies, and the unstable condition of the patients make BSH research and treatment challenging. As we develop a deeper understanding of ICH, hematoma formation and development have been considered as targets for clinical therapy (Shoamanesh et al., 2018; Hemorrhagic Stroke Academia Industry [HEADS] Roundtable Participants; Second HEADS Roundtable Participants, 2020; Li et al., 2020). Clinically, the number of patients who undergo hematoma expansion within the 1st day after symptom onset is higher than the number of patients who just experience a single bleed (Yogendrakumar et al., 2021). Hence, a proper model that can imitate hematoma expansion would be very useful. Both autologous blood and collagenase infusion models, two conventional ICH models, have advantages and disadvantages. Collagenase infusion causes gradual hematoma formation by injuring the vascular wall, whereas blood infusion creates an instantaneous mass occupying effect. The ischemic injury following collagenase-induced vasculature destruction is similar to that occurring in clinical conditions (MacLellan et al., 2008), and we therefore chose collagenase-induced rat models of BSH to investigate the pathophysiological process occurring.
MRI techniques such as T2WI have been confirmed to have high accuracy and sensitivity for assessing hematoma lesions (Kidwell and Wintermark, 2008). Thus, we first used multi-sequence MRI to quantitatively assess hematoma lesions, perihematomal edema, and white matter in a collagenase-induced BSH model that shows typical neurobehavioral deficits and high mortality (Tao et al., 2016b). The modified Voetsch score demonstrated sensorimotor deficits and impaired neurobehavior within 3 days after BSH induction, with the worst deficits appearing on day 1.
In this study, we did not confirm a consistent relationship between hematoma lesion volume and white matter injury, with the volume of the hematoma lesions being highest on day 1, and the most severe white matter injury being found on days 3 and 7. Thus, we infer that compression from the hematoma was not the dominating factor contributing to white matter injury. In addition to the primary injury mass-like effect and vessel rupture, secondary injury after ICH influences the extent of tissue damage, with edema being an important and reliable prognostic factor that can also predict the severity of ICH (Sprügel et al., 2019). Hematoxylin-eosin staining results showed that the progressive inflammation of injured tissue, reflected indirectly by altered brain cell morphology and an evident gathering of activated microglia in the hematoma lesion, might partially explain the progressive white matter impairment (Shao et al., 2019; Deng et al., 2021; Zhu et al., 2022). Microglial cells play a leading role in the development of inflammation of brain tissue, with the activated microglia producing pro-inflammatory factors that both participate in inflammation and recruit neutrophils into brain tissue from peripheral blood through the damaged blood-brain barrier and blood vessel walls (Bai et al., 2020). After BSH, inflammatory cytokines are elevated for various reasons that are closely related to secondary tissue injury (Jiang et al., 2018; Zhao et al., 2019). In our study, we observed that IL-1β and TNF-α, which are representative markers of inflammatory cytokines, were present on day 1 after BSH, peaked on day 3, and decreased by day 7. This is similar to the trend of inflammation in existing mouse models of basal ganglia hemorrhage. The MRI analysis, which was consistent with the histopathology, showed high T2 and ADC values in the initial hematoma generation, indicating a perihematomal region with high water content, namely tissue edema. In addition, MRI also revealed a vasogenic edema peak on day 3 after BSH modeling, which is in line with reports of basal ganglia ICH models in rats (Knight et al., 2008; Yang et al., 2017). This suggests that injury to adjacent nerve fiber or in situ nerve fiber occurred after 3 days, partly due to perihematomal edema. From the above, we can infer that the inflammation and cytotoxicity induced by the lysis of erythrocytes and degradation of hemoglobin may influence nerve fiber integrity.
Neurofiber tracts composed of axons, myelin, and oligodendrocytes, especially the corticospinal tract and corticobulbar tract, dominate the sensory, motor, and sensorimotor pathways, as well as cognitive functions (Jang, 2011). However, we found that the modified Voetsch scores were not strongly associated with the white matter injury state revealed by DTI, with the neurobehavioral deficits reaching their maximum on day 1 and then slightly recovering and plateauing from day 3 to day 7. This suggests that the operation itself is an important factor affecting performance in the behavioral assessment. The animals are in a high-stress state with body fluid loss and peak energy consumption on the 1st day after surgery. Another explanation could be that the perilesional pathway regenerated and reorganized. A previous study reported that fibers arising from the contralateral corticospinal tract crossed over to the ipsilateral side and down the edge of the infarct lesion during the recovery of motor function in some pontine infarct patients (Zhang et al., 2015). Similarly, the corticospinal tract fibers of rats can also regenerate to support the damaged side and improve motor behavior performance. Nonetheless, whether perilesional regeneration of nerve fibers occurs such a short time after BSH needs to be confirmed.
Neuron degeneration of the brainstem in collagenase-induced BSH was previously explored using FJC staining (Chidlow et al., 2009; Wang et al., 2011). Neurons and other cells in the hematoma region in spontaneous ICH, such as in basal ganglia and lobar hemorrhage, first encounter hypoxia, then iron-overload oxidative stress after a few days when hemoglobin is degraded (Zou et al., 2017; Ren et al., 2020). In this study, neurons in the brainstem were subjected to a sharp increase in FJC-positive cells on day 7 after surgery. However, Yang et al. (2015) reported a rapidly growing number of FJC positive cells within 72 hours of infusing arterial blood into the basal ganglia, with the timing of neuron degeneration being different to that in our study. This difference from other types of ICH may become a key point in BSH treatment.
Our study had limitations: (i) MRI assessment was not performed at the same time as histopathological and neurobehavioral tests, and the time intervals between these tests were unavoidable; and (ii) rats that died after BSH induction did not undergo MRI or neurobehavioral and histopathological tests. Although we provided standard housing conditions and made all efforts to minimize the animals’ suffering, the high mortality of the BSH model resulted in missing data, potentially leading to bias in the results.
In conclusion, progression of early brainstem injury involved hematoma, edema, white matter, neurons, and inflammatory cytokines, all of which were confirmed by results from a combined MRI and histopathological examination. Our findings on the pathophysiological process following BSH may help in investigations of the mechanisms of brainstem injury after hemorrhage and in explorations of the ideal therapies for clinical BSH.
Additional files:
Additional Figure 1 (71.7KB, tif) : Schematic diagram of modeling.
Schematic diagram of modeling.
Additional Figure 2 (436.6KB, tif) : Fractional anisotropy value measured in the cerebral peduncle and upper pons.
Fraction anisotropy value measured in the cerebral peduncle and upper pons.
ROI1 and ROI2 are automatically generated using software ParaVision Acquisition 6.0.1 (Bruker Biospin GmbH, Ettlingen, Germany).
Additional Table 1: Modified Voetsch score.
Additional file 1: Open peer review reports 1 (89.1KB, pdf) and 2 (87KB, pdf) .
Acknowledgments:
The authors were grateful to Lei Wang, Sheng-Lan You, and Xi-Jing Yang from the West China Hospital, Sichuan University, for MRI implementation and animal experiments.
Footnotes
Funding: This study was supported by the Natural Science Foundation of Xinjiang Uygur Autonomous Region, No. 2020D01A13 (to CWW); Chengdu Science and Technology Bureau, No. 2019-YF05-00511-SN (to MT); and 1.3.5 Project for Disciplines of Excellence, West China Hospital, Sichuan University, Nos. ZY2016102 (to MT), and ZY2016203 (to CY).
Conflicts of interest: The authors report no conflict of interest concerning the materials or methods used in this study or the findings specified in this paper.
Availability of data and materials: All data generated or analyzed during this study are included in this published article and its supplementary information files
Open peer reviewers: Nadia Alejandra Rivero-Segura, Instituto Nacional de Geriatria, Mexico; Alvin S. Das, Beth Israel Deaconess Medical Center, USA.
P-Reviewers: Rivero-Segura NA, Das AS; C-Editor: Zhao M; S-Editors: Yu J, Li CH; L-Editors: Embleton K, Song LP; T-Editor: Jia Y
References
- 1.Bai Q, Xue M, Yong VW. Microglia and macrophage phenotypes in intracerebral haemorrhage injury:therapeutic opportunities. Brain. 2020;143:1297–1314. doi: 10.1093/brain/awz393. [DOI] [PubMed] [Google Scholar]
- 2.Balci K, Asil T, Kerimoglu M, Celik Y, Utku U. Clinical and neuroradiological predictors of mortality in patients with primary pontine hemorrhage. Clin Neurol Neurosurg. 2005;108:36–39. doi: 10.1016/j.clineuro.2005.02.007. [DOI] [PubMed] [Google Scholar]
- 3.Chen D, Tang Y, Nie H, Zhang P, Wang W, Dong Q, Wu G, Xue M, Tang Y, Liu W, Pan C, Tang Z. Primary Brainstem hemorrhage:a review of prognostic factors and surgical management. Front Neurol. 2021;12:727962. doi: 10.3389/fneur.2021.727962. [DOI] [PMC free article] [PubMed] [Google Scholar]
- 4.Chidlow G, Wood JP, Sarvestani G, Manavis J, Casson RJ. Evaluation of Fluoro-Jade C as a marker of degenerating neurons in the rat retina and optic nerve. Exp Eye Res. 2009;88:426–437. doi: 10.1016/j.exer.2008.10.015. [DOI] [PubMed] [Google Scholar]
- 5.Deng H, Zhang Y, Li GG, Yu HH, Bai S, Guo GY, Guo WL, Ma Y, Wang JH, Liu N, Pan C, Tang ZP. P2X7 receptor activation aggravates NADPH oxidase 2-induced oxidative stress after intracerebral hemorrhage. Neural Regen Res. 2021;16:1582–1591. doi: 10.4103/1673-5374.303036. [DOI] [PMC free article] [PubMed] [Google Scholar]
- 6.Guo X, Ma L, Li H, Qi X, Wei Y, Duan Z, Xu J, Wang C, You C, Tian M. Brainstem iron overload and injury in a rat model of brainstem hemorrhage. J Stroke Cerebrovasc Dis. 2020;29:104956. doi: 10.1016/j.jstrokecerebrovasdis.2020.104956. [DOI] [PubMed] [Google Scholar]
- 7.Gutiérrez IL, González-Prieto M, García-Bueno B, Caso JR, Leza JC, Madrigal JLM. Alternative method to detect neuronal degeneration and amyloid βaccumulation in free-floating brain sections With Fluoro-Jade. ASN Neuro. 2018;10:1759091418784357. doi: 10.1177/1759091418784357. [DOI] [PMC free article] [PubMed] [Google Scholar]
- 8.Hemorrhagic Stroke Academia Industry (HEADS) Roundtable Participants. Basic and translational research in intracerebral hemorrhage:limitations, priorities, and recommendations. Stroke. 2018;49:1308–1314. doi: 10.1161/STROKEAHA.117.019539. [DOI] [PMC free article] [PubMed] [Google Scholar]
- 9.Hemorrhagic Stroke Academia Industry (HEADS) Roundtable Participants;Second HEADS Roundtable Participants. Recommendations for Clinical Trials in ICH:The Second Hemorrhagic Stroke Academia Industry Roundtable. Stroke. 2020;51:1333–1338. doi: 10.1161/STROKEAHA.119.027882. [DOI] [PMC free article] [PubMed] [Google Scholar]
- 10.Jang SH. A review of diffusion tensor imaging studies on motor recovery mechanisms in stroke patients. NeuroRehabilitation. 2011;28:345–352. doi: 10.3233/NRE-2011-0662. [DOI] [PubMed] [Google Scholar]
- 11.Jiang C, Zou X, Zhu R, Shi Y, Wu Z, Zhao F, Chen L. The correlation between accumulation of amyloid beta with enhanced neuroinflammation and cognitive impairment after intraventricular hemorrhage. J Neurosurg. 2018;131:54–63. doi: 10.3171/2018.1.JNS172938. [DOI] [PubMed] [Google Scholar]
- 12.Jiang YB, Wei KY, Zhang XY, Feng H, Hu R. White matter repair and treatment strategy after intracerebral hemorrhage. CNS Neurosci Ther. 2019;25:1113–1125. doi: 10.1111/cns.13226. [DOI] [PMC free article] [PubMed] [Google Scholar]
- 13.Kidwell CS, Wintermark M. Imaging of intracranial haemorrhage. Lancet Neurol. 2008;7:256–267. doi: 10.1016/S1474-4422(08)70041-3. [DOI] [PubMed] [Google Scholar]
- 14.Knight RA, Han Y, Nagaraja TN, Whitton P, Ding J, Chopp M, Seyfried DM. Temporal MRI assessment of intracerebral hemorrhage in rats. Stroke. 2008;39:2596–2602. doi: 10.1161/STROKEAHA.107.506683. [DOI] [PMC free article] [PubMed] [Google Scholar]
- 15.Li Z, You M, Long C, Bi R, Xu H, He Q, Hu B. Hematoma expansion in intracerebral hemorrhage:an update on prediction and treatment. Front Neurol. 2020;11:702. doi: 10.3389/fneur.2020.00702. [DOI] [PMC free article] [PubMed] [Google Scholar]
- 16.MacLellan CL, Silasi G, Poon CC, Edmundson CL, Buist R, Peeling J, Colbourne F. Intracerebral hemorrhage models in rat:comparing collagenase to blood infusion. J Cereb Blood Flow Metab. 2008;28:516–525. doi: 10.1038/sj.jcbfm.9600548. [DOI] [PubMed] [Google Scholar]
- 17.Matsukawa H, Shinoda M, Fujii M, Takahashi O, Murakata A. Risk factors for mortality in patients with non-traumatic pontine hemorrhage. Acta Neurol Scand. 2015;131:240–245. doi: 10.1111/ane.12312. [DOI] [PubMed] [Google Scholar]
- 18.Meguro T, Kuwahara K, Tomita Y, Okuma Y, Tanabe T, Muraoka K, Terada K, Hirotsune N, Nishino S. Primary pontine hemorrhage in the acute stage:clinical features and a proposed new simple scoring system. J Stroke Cerebrovasc Dis. 2015;24:860–865. doi: 10.1016/j.jstrokecerebrovasdis.2014.12.006. [DOI] [PubMed] [Google Scholar]
- 19.Mendelow AD, Gregson BA, Rowan EN, Murray GD, Gholkar A, Mitchell PM. Early surgery versus initial conservative treatment in patients with spontaneous supratentorial lobar intracerebral haematomas (STICH II):a randomised trial. Lancet. 2013;382:397–408. doi: 10.1016/S0140-6736(13)60986-1. [DOI] [PMC free article] [PubMed] [Google Scholar]
- 20.Morotti A, Jessel MJ, Brouwers HB, Falcone GJ, Schwab K, Ayres AM, Vashkevich A, Anderson CD, Viswanathan A, Greenberg SM, Gurol ME, Romero JM, Rosand J, Goldstein JN. CT angiography spot sign, hematoma expansion, and outcome in primary pontine intracerebral hemorrhage. Neurocrit Care. 2016;25:79–85. doi: 10.1007/s12028-016-0241-2. [DOI] [PMC free article] [PubMed] [Google Scholar]
- 21.Percie du Sert N, Hurst V, Ahluwalia A, Alam S, Avey MT, Baker M, Browne WJ, Clark A, Cuthill IC, Dirnagl U, Emerson M, Garner P, Holgate ST, Howells DW, Karp NA, Lazic SE, Lidster K, MacCallum CJ, Macleod M, Pearl EJ, et al. The ARRIVE guidelines 2.0:Updated guidelines for reporting animal research. PLoS Biol. 2020;18:e30004101. doi: 10.1371/journal.pbio.3000410. [DOI] [PMC free article] [PubMed] [Google Scholar]
- 22.Ren H, Han R, Chen X, Liu X, Wan J, Wang L, Yang X, Wang J. Potential therapeutic targets for intracerebral hemorrhage-associated inflammation:An update. J Cereb Blood Flow Metab. 2020;40:1752–1768. doi: 10.1177/0271678X20923551. [DOI] [PMC free article] [PubMed] [Google Scholar]
- 23.Schindelin J, Arganda-Carreras I, Frise E, Kaynig V, Longair M, Pietzsch T, Preibisch S, Rueden C, Saalfeld S, Schmid B, Tinevez JY, White DJ, Hartenstein V, Eliceiri K, Tomancak P, Cardona A. Fiji:an open-source platform for biological-image analysis. Nat Methods. 2012;9:676–682. doi: 10.1038/nmeth.2019. [DOI] [PMC free article] [PubMed] [Google Scholar]
- 24.Seo YS, Jang SH. Recovery of a degenerated corticospinal tract after injury in a patient with intracerebral hemorrhage:confirmed by diffusion tensor tractography imaging. Neural Regen Res. 2015;10:829–831. doi: 10.4103/1673-5374.156990. [DOI] [PMC free article] [PubMed] [Google Scholar]
- 25.Shao A, Zhu Z, Li L, Zhang S, Zhang J. Emerging therapeutic targets associated with the immune system in patients with intracerebral haemorrhage (ICH):From mechanisms to translation. EBioMedicine. 2019;45:615–623. doi: 10.1016/j.ebiom.2019.06.012. [DOI] [PMC free article] [PubMed] [Google Scholar]
- 26.Shoamanesh A, Morotti A, Romero JM, Oliveira-Filho J, Schlunk F, Jessel MJ, Ayres AM, Vashkevich A, Schwab K, Afzal MR, Cassarly C, Martin RH, Qureshi AI, Greenberg SM, Rosand J, Goldstein JN Antihypertensive Treatment of Acute Cerebral Hemorrhage 2 (ATACH-2) and the Neurological Emergencies Treatment Trials (NETT) Network Investigators. Cerebral microbleeds and the effect of intensive blood pressure reduction on hematoma expansion and functional outcomes:a secondary analysis of the ATACH-2 randomized clinical trial. JAMA Neurol. 2018;75:850–859. doi: 10.1001/jamaneurol.2018.0454. [DOI] [PMC free article] [PubMed] [Google Scholar]
- 27.Shrestha BK, Guo X, Ma L, Qi X, Sun T, Li H, Gan Q, Zheng J, You C, Tian M. Rat brainstem hemorrhage model:key points to success in modeling. World Neurosurg. 2018;117:e106–e116. doi: 10.1016/j.wneu.2018.05.195. [DOI] [PubMed] [Google Scholar]
- 28.Sprügel MI, Kuramatsu JB, Volbers B, Gerner ST, Sembill JA, Madžar D, Bobinger T, Kölbl K, Hoelter P, Lücking H, Dörfler A, Schwab S, Huttner HB. Perihemorrhagic edema:revisiting hematoma volume, location, and surface. Neurology. 2019;93:e1159–1170. doi: 10.1212/WNL.0000000000008129. [DOI] [PubMed] [Google Scholar]
- 29.Tang X, Wu L, Luo M, Qiu Z, Jiang Y. Massive pontine hemorrhage by dual injection of autologous blood. J Vis Exp. 2021:e62089. doi: 10.3791/62089. [DOI] [PubMed] [Google Scholar]
- 30.Tao C, Li H, Wang J, You C. Predictors of surgical results in patients with primary pontine hemorrhage. Turk Neurosurg. 2016a;26:77–83. doi: 10.5137/1019-5149.JTN.12634-14.1. [DOI] [PubMed] [Google Scholar]
- 31.Tao C, Zhang R, Hu X, Song L, Wang C, Gao F, You C A novel brainstem hemorrhage model by autologous blood infusion in rat:white matter injury, magnetic resonance imaging, and neurobehavioral features. J Stroke Cerebrovasc Dis. 2016b;25:1102–1109. doi: 10.1016/j.jstrokecerebrovasdis.2016.01.025. [DOI] [PubMed] [Google Scholar]
- 32.Wang H, Baker EW, Mandal A, Pidaparti RM, West FD, Kinder HA. Identification of predictive MRI and functional biomarkers in a pediatric piglet traumatic brain injury model. Neural Regen Res. 2021;16:338–344. doi: 10.4103/1673-5374.290915. [DOI] [PMC free article] [PubMed] [Google Scholar]
- 33.Wang R, Ma WG, Gao GD, Mao QX, Zheng J, Sun LZ, Liu YL. Fluoro jade-C staining in the assessment of brain injury after deep hypothermia circulatory arrest. Brain Res. 2011;1372:127–132. doi: 10.1016/j.brainres.2010.11.059. [DOI] [PubMed] [Google Scholar]
- 34.Wijdicks EF, St Louis E. Clinical profiles predictive of outcome in pontine hemorrhage. Neurology. 1997;49:1342–1346. doi: 10.1212/wnl.49.5.1342. [DOI] [PubMed] [Google Scholar]
- 35.Xu L, Qi HS, Ge RC, Li PP, Zhen LX, Feng XY. Effects of minimally invasive surgery combined with metformin on inflammatory responses in rabbits with intracerebral hemorrhage. Zhongguo Zuzhi Gongcheng Yanjiu. 2022;26:1741–1746. [Google Scholar]
- 36.Yang J, Li Q, Wang Z, Qi C, Han X, Lan X, Wan J, Wang W, Zhao X, Hou Z, Gao C, Carhuapoma JR, Mori S, Zhang J, Wang J. Multimodality MRI assessment of grey and white matter injury and blood-brain barrier disruption after intracerebral haemorrhage in mice. Sci Rep. 2017;7:40358. doi: 10.1038/srep40358. [DOI] [PMC free article] [PubMed] [Google Scholar]
- 37.Yang L, Tang J, Chen Q, Jiang B, Zhang B, Tao Y, Li L, Chen Z, Zhu G. Hyperbaric oxygen preconditioning attenuates neuroinflammation after intracerebral hemorrhage in rats by regulating microglia characteristics. Brain Res. 2015;1627:21–30. doi: 10.1016/j.brainres.2015.08.011. [DOI] [PubMed] [Google Scholar]
- 38.Yogendrakumar V, Ramsay T, Menon BK, Qureshi AI, Saver JL, Dowlatshahi D. Hematoma expansion shift analysis to assess acute intracerebral hemorrhage treatments. Neurology. 2021;97:e755–764. doi: 10.1212/WNL.0000000000012393. [DOI] [PubMed] [Google Scholar]
- 39.Yushkevich PA, Piven J, Hazlett HC, Smith RG, Ho S, Gee JC, Gerig G. User-guided 3D active contour segmentation of anatomical structures:significantly improved efficiency and reliability. Neuroimage. 2006;31:1116–1128. doi: 10.1016/j.neuroimage.2006.01.015. [DOI] [PubMed] [Google Scholar]
- 40.Zhang M, Lin Q, Lu J, Rong D, Zhao Z, Ma Q, Liu H, Shu N, He Y, Li K. Pontine infarction:diffusion-tensor imaging of motor pathways-a longitudinal study. Radiology. 2015;274:841–850. doi: 10.1148/radiol.14140373. [DOI] [PMC free article] [PubMed] [Google Scholar]
- 41.Zhao S, Liu Z, Yu Z, Wu X, Li R, Tang X. BIO alleviates inflammation through inhibition of GSK-3βin a rat model of intracerebral hemorrhage. J Neurosurg. 2019;133:383–391. doi: 10.3171/2019.4.JNS183501. [DOI] [PubMed] [Google Scholar]
- 42.Zhao W, Wu C, Stone C, Ding Y, Ji X. Treatment of intracerebral hemorrhage:current approaches and future directions. J Neurol Sci. 2020;416:117020. doi: 10.1016/j.jns.2020.117020. [DOI] [PubMed] [Google Scholar]
- 43.Zhu Y, Huang Y, Yang J, Tu R, Zhang X, He WW, Hou CY, Wang XM, Yu JM, Jiang GH. Intranasal insulin ameliorates neurological impairment after intracerebral hemorrhage in mice. Neural Regen Res. 2022;17:210–216. doi: 10.4103/1673-5374.314320. [DOI] [PMC free article] [PubMed] [Google Scholar]
- 44.Zou X, Wu Z, Zhu W, Chen L, Mao Y, Zhao F. Effectiveness of minocycline in acute white matter injury after intracerebral hemorrhage. J Neurosurg. 2017;126:1855–1862. doi: 10.3171/2016.5.JNS152670. [DOI] [PubMed] [Google Scholar]
Associated Data
This section collects any data citations, data availability statements, or supplementary materials included in this article.
Supplementary Materials
Schematic diagram of modeling.
Fraction anisotropy value measured in the cerebral peduncle and upper pons.
ROI1 and ROI2 are automatically generated using software ParaVision Acquisition 6.0.1 (Bruker Biospin GmbH, Ettlingen, Germany).