Keywords: spinal cord injury, diffusion tensor imaging, canines, pathophysiology, cerebrospinal structures, corticospinal tract, magnetic resonance imaging, anisotropic fraction, apparent dispersion coefficient
Abstract
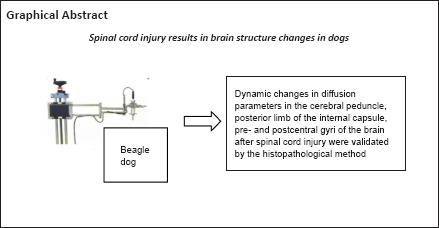
Based on the Wallerian degeneration in the spinal cord pathways, the changes in synaptic connections, and the spinal cord-related cellular responses that alter the cellular structure of the brain, we presumed that brain diffusion tensor imaging (DTI) parameters may change after spinal cord injury. However, the dynamic changes in DTI parameters remain unclear. We established a Beagle dog model of T10 spinal cord contusion and performed DTI of the injured spinal cord. We found dynamic changes in DTI parameters in the cerebral peduncle, posterior limb of the internal capsule, pre- and postcentral gyri of the brain within 12 weeks after spinal cord injury. We then performed immunohistochemistry to detect the expression of neurofilament heavy polypeptide (axonal marker), glial fibrillary acidic protein (glial cell marker), and NeuN (neuronal marker). We found that these pathological changes were consistent with DTI parameter changes. These findings suggest that DTI can display brain structure changes after spinal cord injury.
Introduction
Spinal cord injury (SCI) might cause catastrophic damage to the central nervous system, leading to high levels of disability (Chang et al., 2010; Jirjis et al., 2013). One of the difficulties in treating SCI is that primary trauma not only causes nerve damage in the form of the original lesion, but also results in the anterograde and retrograde degeneration of the spinal cord, even extending into the brain (Freund et al., 2012; Delarue et al., 2021; Shen et al., 2021). As the axonal transmission information is blocked, the motor neurons below the epicenter of the injury are often deprived of supraspinal input (Dietz and Curt, 2006). The persistent absence of this neuronal input may affect the recovery from SCI. Yamamoto et al. (1989) reported that the degradation of spinal cord may extend cranially and even reaches the brain, resulting in corresponding structural and functional changes over time after SCI. Observing the cerebral structural changes after SCI can provide a basis for brain remodeling and even provide novel strategies for exploring the treatment of SCI. At present, the changes in brain structure are mainly probed through imaging and pathological methods.
Although traditional magnetic resonance imaging (MRI) has long been used in scientific research and clinical practice (Sadeghi et al., 2013), this technique cannot detect nerve fiber bundles at the molecular level from a microstructural perspective. Compared with MRI, diffusion tensor imaging (DTI) is a more advanced imaging technology that measures the diffusion of water molecules into the tissues (David et al., 2017). DTI can be used to analyze and detect the white matter fibers, which cannot be achieved by MRI. Thus, DTI provides useful information regarding anatomy and microstructure of the brain regions, and evaluates brain damage both in vivo and ex vivo (Preti et al., 2011; Jacqmot et al., 2013). To a certain extent, diffusion tensor tractography (DTT) technology can three-dimensionally reconstruct fiber bundles and display them in different colors. Based on Wallerian degeneration in the spinal cord pathways, changes in synaptic connections, and spinal cord-related cellular responses that can alter the cellular structure of the brain (Jirjis et al., 2016), we presumed that DTI parameters of the brain change after SCI. Many studies have been conducted on the use of DTI to observe the brain tissue changes after SCI in both rodents and humans (Ramu et al., 2008; Wrigley et al., 2009; Gustin et al., 2010; Freund et al., 2012). These studies revealed a statistically significant increase or decrease in the DTI parameters of the thalamus, corticospinal tract, primary somatosensory cortex, corona radiate, and internal capsule. Although SCI can cause changes in DTI parameters of the brain, the dynamic changes of DTI parameters in specific cerebral areas remain unclear (Freund et al., 2013).
Kim et al. (2012) reported that DTI parameters of the SCI site was related to behavioral functions, and can predict the motor function recovery after SCI in rats. DTI parameters of brain regions related to SCI can be used as a reference for functional scoring (Koskinen et al., 2014). However, this finding is novel. To the best of our knowledge, there are no studies reporting consistent results on this correlation. There is a lack of evidence on behavioral recovery tracking. In this study, we hypothesized that DTI parameters of cerebral peduncle (CP), posterior limb of the internal capsule (PLIC), postcentral gyrus (POG), and precentral gyrus (PRG) in the corticospinal tract change greatly after SCI, which will help validate whether there is a correlation between DTI parameters of these brain regions and behavioral recovery after SCI. The aim of this study was to determine the DTI changes of these cerebrospinal structures over time and the underlying pathology of these changes.
Methods
Animals
Based on anatomy of the urinary system, female animals are easier to catheterize, and the risk of urinary system infections can be reduced (Liu et al., 2018b). Therefore, 15 healthy female Beagle dogs (10 ± 0.5 kg; 2 ± 0.5 years old; Beijing Marshall Biotechnology Co., Ltd., Beijing, China; license No. SCXK (Jing) 2016-0001) were used in this study, and the dogs were allowed free access to food and water ad libitum (temperature 19–23°C, humidity 40–70%, illumination 10–14 hours/day). Five animals that underwent laminotomy were randomly selected as controls, and the remaining ten animals were used to establish SCI models. None of the dogs had any clinical signs of central nervous system-related disorders, and all dogs had normal central nervous system morphology under anesthesia based on standard MRI protocols (Catani and Thiebaut de Schotten, 2008). The Experimental Animal Center of Capital Medical University approved all animal procedures (approval No. AEEI-2015-055) on April 30, 2015. The study was conducted according to the ethical rules of the Animal Experiments and Experimental Animal Welfare Committee. In this study, the dogs were anesthetized via intraperitoneal administration of 2.5% pentobarbital sodium (Cat# P11011; Merck, Darmstadt, Germany) at a dose of 125 mg/kg, followed by intramuscular administration of 0.1 mL/kg xylazine hydrochloride (Dunhua Shengda Animal Pharmaceutical Co., Ltd., Dunhua, Jilin Province, China).
SCI model
Intraoperative antimicrobials (cefoxitin sodium) were administered via intravenous injection during the surgical decompression of the spinal cord (Webb et al., 2010). The animals were held on the operating table in the prone position. Retention catheterization was managed using a sterile urethral catheter (8Fr, Zhanjiang Star Enterprise Co., Ltd., Zhenjiang, Zhejiang Province, China). The T9, T10 and T11 spinous processes and the interspinous ligaments were cut. The vertebral laminae of T10 and parts of T9 and T11 were uncovered to expose 1 cm of the spinal cord and the dura mater was not opened during the procedure as described previously (Liu et al., 2018b).A spinal cord contusion impactor was used (Patent No. ZL201620915673.4) to produce injury, which was suitable for large animals based on the principle of the MASCIS impactor method (Young, 2002). The spine of each animal was clamped using a spinous process clip in the center of the T10 spinal cord under the head of a falling hammer weighing 20 g. The contusion process was described previously (Liu et al., 2018a). The standards (displacement 25 cm, and dwell time 1 second) remained the same for all animals. Immediately after the injury, the wounds were washed with saline to ensure adequate hemostasis, and the injured spinal cord was covered with a piece of gelatin sponge. The muscle layers were stitched together with a 3-0 absorbable surgical suture. The skin was stitched with a 1-0 surgical suture. The SCI induction process is shown in Additional Figure 1 (620.2KB, tif) .
Postoperative nursing
All dogs were fed with an enteral nutritional suspension (100 mL/10 kg, twice a day, Nutricia Pharmaceutical (Wuxi) Co., Ltd., Wuxi, China) for 1 week post-injury, and then had access to food and water ad libitum every day. All dogs continued to receive intravenous injections of sodium chloride (25 mL/kg) for 3 days post-injury. The antibiotic agent cefoxitin sodium (50 mg/kg; Zhanjiang Star Enterprise Co., Ltd.) was daily administered via intramuscular injection for 7 days. Betadine (Zhanjiang Star Enterprise Co., Ltd.) was smeared on the animals’ hips, and the waterproof mats in the cages were changed every day to prevent pressure ulcers. The catheter was extricated after restoring the bladder emptying reflex, typically within 2 to 3 weeks post-injury.
Functional score
The Texas SCI Score (TSCIS) for dogs was used to individually evaluate gait, postural reaction and nociception in each limb (Additional Figure 2 (763.7KB, tif) ) pre-surgery, 3 hours, 24 hours, 7 days and then weekly until 12 weeks after surgery. The behavioral score of each dog was taken from the double-blind average of the lower limbs. In addition, the scoring process was recorded using a high-speed camera (Canon (China) Co., Ltd. Beijing, China) to determine the accuracy of scoring (Levine et al., 2009).
Magnetic resonance imaging
The magnetic resonance imaging (MRI) protocol was carried out for all dogs using the Prisma Fit 3 Tesla MRI scanner (Siemens Healthineers, Erlangen, Germany) equipped with a homemade 4-channel Tx/Rx RF coil (Beijing MRI Center for Brain Research, Institute of Biophysics, Chinese Academy of Sciences, Beijing, China) (Liu et al., 2020). The animals were placed in the prone position and maintained under anesthesia during the entire MRI scan. DTI was performed on each animal (single-shot echo planar imaging, repetition time = 4200 ms, echo time = 70 ms, matrix = 72 × 68, field of view = 120 × 120 mm2, slice thickness = 1.5 mm, slice gap = 0 and extra 2 b0 images). Diffusion gradients were used in 30 nonparallel directions (b = 1000 s/mm2) for a duration of 16 minutes. Moreover, T1-weighted images were acquired through the three-dimensional fast field echo MRI to obtain a high-resolution anatomical reference (repetition time = 2200 ms, echo time = 3.68 ms, matrix = 220 × 218, field of view = 128 × 128 mm2, and slice thickness = 0.5 mm) (Anaya García et al., 2015). MRI examinations were performed pre-contusion and 3, 24 hours, 3, 6 and 12 weeks post-injury.
DTI processing
DTI processing was performed using the commercially available software Neuro3D (Siemens NUMARIS/4, Syngo MR D13) embedded in the Siemens post-processing workstation. All diffusion-weighted images were first realigned to the averaged b0 image to correct the artifacts caused by eddy currents and head motion before tensor calculation. Then, DTI parameters, including fractional anisotropy (FA) and apparent diffusion coefficient (ADC) (equal to mean diffusivity in this work) maps, were automatically calculated using Neuro3D. Finally, FA and ADC map images were co-registered and fused with the high-resolution T1-weighted images. Based on the T1-weighted images, circular regions of interest (ROIs), each with an area of 5 mm2, were placed along the corticospinal tract at the locations of CP, PLIC, POG and PRG, and the corresponding FA and ADC values were measured. The ROIs were placed carefully to avoid border areas, such as areas overlapping with cerebrospinal fluid spaces and neighboring tracts. The ROIs were placed bilaterally on three slices covering each of the selected structures, and the value of each DTI parameter from the same structure was averaged (Koskinen et al., 2014). The localized area was jointly evaluated by a neurosurgical specialist and an MRI expert to eliminate the errors caused by subjective human factors. The same ROI protocol was used to determine the DTI values for each animal. The representations of ROIs are shown in Figure 1A–C.
Figure 1.
Representation of DTI processing of the ROIs.
(A–C) DTI processing was performed with the commercially available software Neuro3D (Siemens NUMARIS/4, Syngo MR D13) embedded in a Siemens post-processing workstation. Based on the T1-weighted images, the circular ROIs (5 mm2) were placed at CP (A), PLIC (B), POG and PRG (C), and the corresponding FA and ADC values were then measured. The ROIs were placed bilaterally on three slices that covered each of the selected structures. The final values were calculated using the average of the three slices. Control group: n = 5; SCI group: n = 10. ADC: Apparent diffusion coefficient; CP: cerebral peduncle; DTI: diffusion tensor imaging; FA: fractional anisotropy; PLIC: posterior limb of internal capsule; POG: postcentral gyrus; PRG: precentral gyrus; ROI: region of interest.
Immunohistochemistry
After 12 weeks post-SCI, the skull of each animal was gradually gnawed from the occipital foramen with a rongeur, exposing the whole brain. The whole brain was then removed, fixed in 4% paraformaldehyde immediately, and maintained at 4°C for 1 week in a refrigerator. Under the guidance of a neurosurgeon, the whole brain was fixed and cut into left and right halves. According to the canine anatomy map (Liu et al., 2020), the target tissues of the two cerebral hemispheres containing four ROIs were extracted using a surgical blade. The brain tissues were then embedded in paraffin and cut into 4 µm-thick sections with a microtome (DL Naturegene life Sciences Company limited, Beijing, China) for immunohistochemical staining. The four selected ROIs within the tissue were stained with mouse monoclonal to neurofilament heavy polypeptide (NF; 1:75, Abcam, Cat# ab8972, RRID: AB_650102) for axons, rabbit polyclonal to glial fibrillary acidic protein (GFAP; 1:2000, Abcam, Cat# ab7260, RRID: AB_880202) for glial cells and rabbit polyclonal to NeuN (a neuronal marker; 1:2000, Abcam, Cat# ab128886, RRID: AB_2744676) for neurons at 4°C for 12 hours. The corresponding secondary antibody was horseradish peroxidase (HRP) conjugated goat anti-mouse IgG (H+L) (1:200, Servicebio, Cat# GB23301) for NF, HRP conjugated goat anti-rabbit IgG (H+L) (1:200, Servicebio, Cat#GB23303) for GFAP, HRP conjugated goat anti-rabbit IgG (H+L) (1:200, Servicebio, Cat# GB23303) for NeuN at room temperature for 50 minutes. Finally, all sections were imaged using the HistoFAXS software (Tissue Gnostics, Vienna, Austria) at a magnification of 20×. For quantitative analysis of all ROIs, five ROIs on each slice were selected and a score was obtained using the ImageJ software (version 1.48; National Institutes of Health, Bethesda, MD, USA) (Schneider et al., 2012). The score was equivalent to the tissue content of the axons, glial cells, and neurons quantified by staining intensity, and highly positive and positive staining were taken for the score calculation (Varghese et al., 2014).
Fiber tractography
To verify whether the selected ROIs were indeed the areas that the corticospinal tract passed through, fiber tractography was performed based on the dog’s anatomical brain atlasusing Neuro3D software (Catani and Thiebaut de Schotten, 2008; Jacqmot et al., 2013; Anaya García et al., 2015). Using color maps, different tracts were then identified and delineated at different points along their trajectories in the sagittal, coronal, and transverse planes. The images were reconstructed using an embedded fiber-tracking algorithm (Anaya García et al., 2015).
Statistical analysis
The estimated power was 80% in our study. The sample size was seven dogs in one group. The size of animals in this study was larger than that in the study by Liu et al. (2018a). The evaluator was blind to the grouping. Statistical analysis was performed using SPSS 21.0 software (IBM, Armonk, NY, USA). The Shapiro-Wilk normality test was used to analyze the data with normal distribution. The DTI parameters of each structure in the control group were analyzed at all time points using one-way analysis of variance followed by Tukey’s post hoc tests. The comparison of DTI parameters between the SCI and control groups was performed using repeated measures analysis of variance, followed by Tukey’s multiple comparison test. The dynamic correlation between the DTI parameters and TSCIS at corresponding time points was tested using Spearman correlation analysis. The immunohistochemistry data of the SCI and control groups were analyzed using Student’s t-test. The mean value and standard deviation (SD) for FA and ADC parameters were calculated, and the data are expressed as the mean ± SD. An error probability of less than 0.05 (P < 0.05) was used as the significance level for all statistical tests.
Results
Successful establishment of spinal cord contusion models
Following the impact, the dogs’ tails showed rapid convulsions. The bilateral hind limbs appeared flaccid and paralyzed due to dissipation of anesthesia. The gait and postural reactions remained unscored, and the nociception in each limb remained at one point for over 2 days, suggesting successful establishment of the model (Dong et al., 2016).
Fiber tractography validating the ROIs
Fiber tractography allowed rapid display and identification of the most representative cerebral white matter fiber tracts in the ROIs of all dogs. Three-dimensional reconstructions of the CP, PLIC, POG and PRG were generated. As shown in Figure 2, the fiber bundles passing through the four ROIs were displayed in blue, green, and red colors, and the corticospinal tract extended in the direction of the spinal cord. At the selected level, the fiber bundle predominantly appeared in green, indicating that the fiber bundles at this level were in the dorsal-ventral direction.
Figure 2.
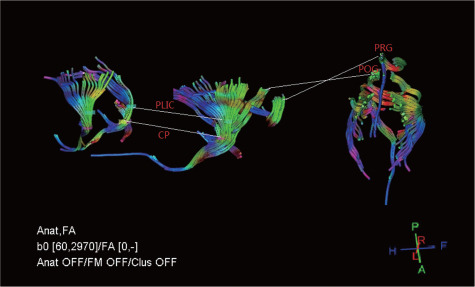
Diffusion tensor tractography images displaying corticospinal tract in related brain regions.
The fiber bundles through the four ROIs are displayed in blue (rostro-caudal direction), green (dorsal-ventral direction) and red (right-left direction) colors. The corticospinal tract extended in the direction of the spinal cord. The fiber bundles are mostly green in the selected ROIs. CP: Cerebral peduncle; FA: fractional anisotropy; PLIC: posterior limb of internal capsule; POG: postcentral gyrus; PRG: precentral gyrus; ROI: region of interest.
DTI illustrating dynamic changes in cerebrospinal structures in a SCI Beagle dog model
In the four anatomical structures, the FA and ADC values of all animal brains at six time points were calculated. The mean FA value in the four normal ROIs was 0.260 ± 0.016 (CP), 0.585 ± 0.007 (PLIC), 0.372 ± 0.024 (POG) and 0.190 ± 0.017 (PRG), respectively. In the control group, laminotomy showed no significant effect on the FA values of the brain regions during over 12-week study period (P > 0.05). The detailed statistical results are shown in Additional Table 1. As shown in Figure 3A, for CP, the FA value was increased over time, and the trend of the FA curve rose first and then fell after SCI. For PLIC, the FA value was decreased first and then increased over time, and the overall trend of the FA curve dropped after SCI. For POG, the trend of overall curve of the FA value declined first and then went up after SCI. For PRG, the trend of FA value remained the same as that of CP after SCI. Compared with the control group at each time point (Figure 3A), the SCI group exhibited significant changes in the four selected ROIs. The detailed statistical results are shown in Additional Table 2.
Additional Table 1.
The detailed results of all regions of interest in control group by one-way analysis of variance followed by Tukey's post hoc tests
| Region of interest | df | F-value | n | P-value |
|---|---|---|---|---|
| FA | ||||
| CP | 5 | 0.264 | 5 | 0.928 |
| PLIC | 5 | 2.510 | 5 | 0.058 |
| POG | 5 | 0.045 | 5 | 0.999 |
| PRG | 5 | 0.027 | 5 | 1.000 |
| ADC | ||||
| CP | 5 | 0.639 | 5 | 0.672 |
| PLIC | 5 | 2.059 | 5 | 0.106 |
| POG | 5 | 0.199 | 5 | 0.960 |
| PRG | 5 | 0.011 | 5 | 1.000 |
ADC: apparent diffusion coefficient; CP: cerebral peduncle; FA: fractional anisotropy; PLIC: posterior limb of internal capsule; POG: postcentral gyrus; PRG: precentral gyrus.
Figure 3.
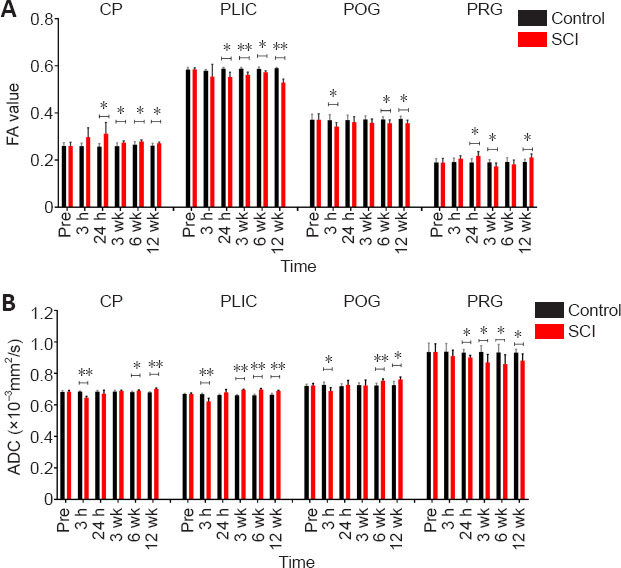
DTI dynamic changes over time after spinal cord injury and comparison between SCI and control groups.
(A) FA values of four ROIs and dynamic changes at all time points studied. (B) ADC values of four ROIs and dynamic changes at all time points studied. The horizontal capped line indicates comparison between the two groups at each time point. All the parameters are expressed as the mean ± SD (control group: n = 5, SCI group: n = 10). *P < 0.05, **P < 0.001 (Student’s t-test). CP: Cerebral peduncle; DTI: diffusion tensor imaging; PLIC: posterior limb of internal capsule; POG: postcentral gyrus; PRG: precentral gyrus; ROI: region of interest; SCI: spinal cord injury.
Additional Table 2.
The detailed Student's t-test results of all regions of interest in the SCI and control groups
| Region of interest | Time point | t | df | n | P-value |
|---|---|---|---|---|---|
| FA | |||||
| CP | Pre-contusion | 0.035 | 13 | 15 | 0.973 |
| 3 h | 2.093 | 13 | 15 | 0.057 | |
| 24 h | 2.59 | 13 | 15 | 0.023 | |
| 3 wk | 2.778 | 13 | 15 | 0.016 | |
| 6 wk | 2.810 | 13 | 15 | 0.015 | |
| 12 wk | 2.796 | 13 | 15 | 0.015 | |
| PLIC | Pre-contusion | 0.105 | 13 | 15 | 0.918 |
| 3 h | 1.028 | 13 | 15 | 0.323 | |
| 24 h | 3.899 | 13 | 15 | 0.002 | |
| 3 wk | 5.038 | 13 | 15 | <0.001 | |
| 6 wk | 4.166 | 13 | 15 | 0.001 | |
| 12 wk | 9.431 | 13 | 15 | < 0.001 | |
| POG | Pre-contusion | 0.030 | 13 | 15 | 0.976 |
| 3 h | 2.683 | 13 | 15 | 0.019 | |
| 24 h | 0.759 | 13 | 15 | 0.461 | |
| 3 wk | 1.773 | 13 | 15 | 0.099 | |
| 6 wk | 1.218 | 13 | 15 | 0.039 | |
| 12 wk | 1.113 | 13 | 15 | 0.020 | |
| PRG | Pre-contusion | 0.022 | 13 | 15 | 0.983 |
| 3 h | 1.828 | 13 | 15 | 0.091 | |
| 24 h | 3.039 | 13 | 15 | 0.009 | |
| 3 wk | 2.366 | 13 | 15 | 0.034 | |
| 6 wk | 1.099 | 13 | 15 | 0.291 | |
| 12 wk | 0.333 | 13 | 15 | 0.021 | |
| ADC | |||||
| CP | Pre-contusion | 0.109 | 13 | 15 | 0.915 |
| 3 h | 9.427 | 13 | 15 | < 0.001 | |
| 24 h | 1.209 | 13 | 15 | 0.248 | |
| 3 wk | 0.826 | 13 | 15 | 0.424 | |
| 6 wk | 3.185 | 13 | 15 | 0.007 | |
| 12 wk | 7.691 | 13 | 15 | < 0.001 | |
| PLIC | Pre-contusion | 0.132 | 13 | 15 | 0.897 |
| 3 h | 4.989 | 13 | 15 | <0.001 | |
| 24 h | 1.934 | 13 | 15 | 0.075 | |
| 3 wk | 21.813 | 13 | 15 | < 0.001 | |
| 6 wk | 9.336 | 13 | 15 | < 0.001 | |
| 12 wk | 7.621 | 13 | 15 | < 0.001 | |
| POG | Pre-contusion | 0.287 | 13 | 15 | 0.778 |
| 3 h | 3.523 | 13 | 15 | 0.004 | |
| 24 h | 0.672 | 13 | 15 | 0.513 | |
| 3 wk | 0.081 | 13 | 15 | 0.937 | |
| 6 wk | 4.386 | 13 | 15 | <0.001 | |
| 12 wk | 3.588 | 13 | 15 | 0.003 | |
| PRG | Pre-contusion | 0.034 | 13 | 15 | 0.973 |
| 3 h | 1.074 | 13 | 15 | 0.261 | |
| 24 h | 1.208 | 13 | 15 | 0.004 | |
| 3 wk | 1.477 | 13 | 15 | 0.024 | |
| 6 wk | 1.693 | 13 | 15 | 0.034 | |
| 12 wk | 1.752 | 13 | 15 | 0.026 |
ADC: apparent diffusion coefficient; CP: cerebral peduncle; FA: fractional anisotropy; PLIC: posterior limb of internal capsule; POG: postcentral gyrus; PRG: precentral gyrus.
The mean ADC value in the four normal ROIs was 0.684 ± 0.009 (CP), 0.670 ± 0.006 (PLIC), 0.723 ± 0.014 (POG) and 0.937 ± 0.052 (PRG) pre-SCI, respectively. In the control group, laminotomy did not cause significant changes in the ADC values of the brain during over 12-week study period (P > 0.05). The detailed results are shown in Additional Table 1. As shown in Figure 3B, for CP, the ADC value was first decreased and then increased over time after SCI. For PLIC, the overall trend of the ADC curve remained similar to that of the CP after SCI. For POG, the trend of the ADC curve first fell and then rose after SCI. For PRG, the overall trend of the ADC curve went down after SCI. Compared with the control group, at each time point (Figure 3B), the SCI group exhibited significant changes in the four selected ROIs. Detailed statistical results are shown in Additional Table 2.
By comparing the DTI parameters of selected structures between the SCI and control groups, both FA and ADC values were found to have significant changes from about 3 weeks after SCI, indicating that the selected structures had obvious pathophysiological variations approximately starting from 3 weeks after SCI in the canines (Additional Table 3).
Additional Table 3.
Summary analysis of the P-value of the selected structures at each time point in the SCI and control groups using one-way analysis of variance followed by Tukey's post hoc test
| Time | CP | PLIC | POG | PRG | ||||
|---|---|---|---|---|---|---|---|---|
|
|
|
|
|
|||||
| FA | ADC | FA | ADC | FA | ADC | FA | ADC | |
| Pre-contusion | >0.05 | >0.05 | >0.05 | >0.05 | >0.05 | >0.05 | >0.05 | >0.05 |
| 3 h | >0.05 | <0.001 | >0.05 | <0.001 | 0.019 | 0.004 | >0.05 | >0.05 |
| 24 h | 0.023 | >0.05 | 0.002 | >0.05 | 0.461 | >0.05 | 0.009 | 0.004 |
| 3 wk | 0.016 | >0.05 | <0.001 | <0.001 | 0.099 | >0.05 | 0.034 | 0.024 |
| 6 wk | 0.015 | 0.007 | 0.001 | <0.001 | 0.039 | <0.001 | >0.05 | 0.034 |
| 12 wk | 0.015 | <0.001 | <0.001 | <0.001 | 0.020 | 0.003 | 0.021 | 0.026 |
ADC: Apparent diffusion coefficient; CP: cerebral peduncle; FA: fractional anisotropy; PLIC: posterior limb of internal capsule; POG: postcentral gyrus; PRG: precentral gyrus.
Relationship between the DTI metrics of the cerebrospinal structure and TSCISs in a SCI Beagle dog model
The behavioral changes of dogs after SCI are depicted in Figure 4. The TSCIS scores of both lower limbs were reduced after SCI. The loss of gait, proprioception, and nociception were gradually restored over time, and the TSCIS scores reached a steady state after approximately 4 weeks. According to Pearson correlation analysis (Figure 5), the FA value of CP showed strong correlation (R2 = 0.917, P = 0.002), while that of POG (R2 = 0.378, P = 0.194) and PRG (R2 = 0.316, P = 0.243) showed weak correlation with the TSCIS scores of the lower extremities. The ADC value of CP showed strong correlation (R2 = 0.620, P = 0.063), while that of PLIC (R2 = 0.294, P = 0.266) and POG (R2 = 0.313, P = 0.248) showed weak correlation with the TSCIS score of the lower extremities (Figure 6).
Figure 4.
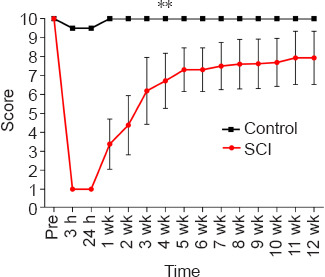
The behavioral changes after SCI in a Beagle dog model.
The Texas Spinal Cord Injury Scores of both the lower limbs were minimized after SCI, and the loss of gait, proprioception and nociception were gradually restored over time. Data are expressed as the mean ± SD (control group: n = 5, SCI group: n = 10). **P < 0.001 (one-way analysis of variance followed by Tukey’s post hoc test). SCI: Spinal cord injury.
Figure 5.
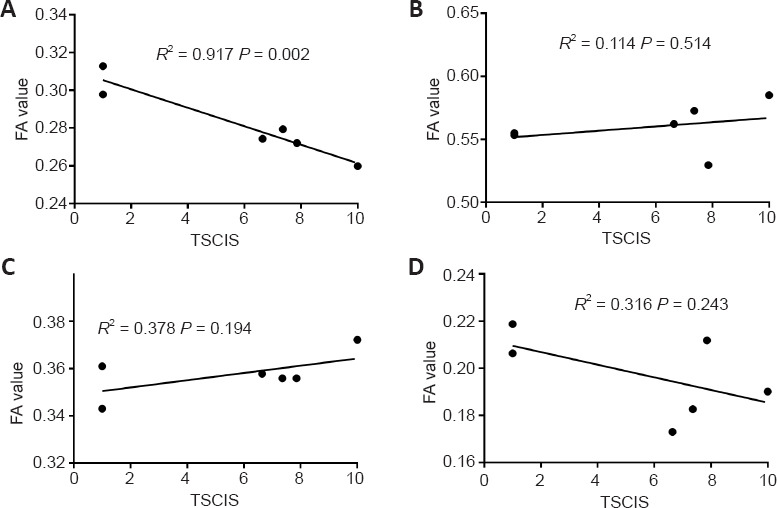
Correlations between FA values of four selected brain structures and TSCIS in a Beagle dog model of spinal cord injury in the Spearman correlation analysis.
(A–D) Correlations between FA values of CP (A), PLIC (B), POG (C) and PRG (D) and TSCIS. CP: Cerebral peduncle; FA: fractional anisotropy; PLIC: posterior limb of internal capsule; POG: postcentral gyrus; PRG: precentral gyrus; TSCIS: Texas Spinal Cord Injury Scores.
Figure 6.
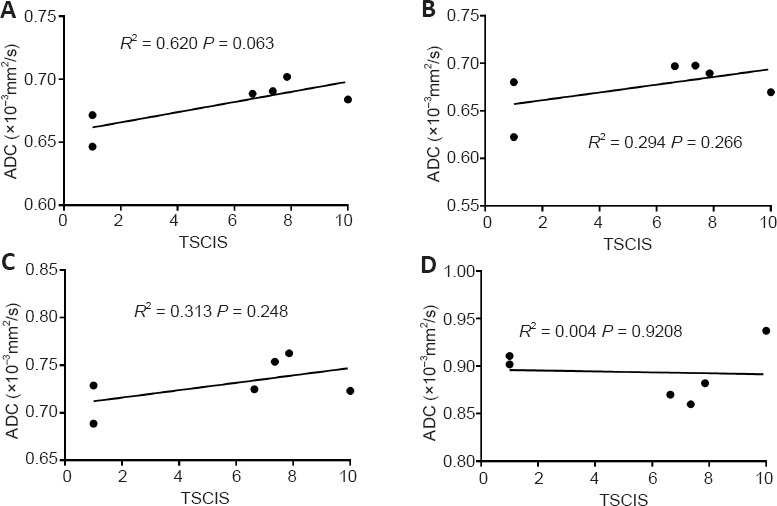
Correlations between ADC values of four selected brain structures and TSCIS in the Pearson correlation analysis.
(A–D) Correlations between FA values of CP (A), PLIC (B), POG (C) and PRG (C) and TSCIS. ADC: Apparent diffusion coefficient; CP: cerebral peduncle; PLIC: posterior limb of internal capsule; POG: postcentral gyrus; PRG: precentral gyrus; TSCIS: Texas Spinal Cord Injury Scores.
Immunohistochemistry validating the pathological changes in a SCI Beagle dog model
To explore the possible mechanisms underlying the DTI alterations in the ROIs, immunohistochemical staining was performed on the four regions to observe whether the axons, glial cells, or neurons changed after SCI. The NF staining intensity for CP remained low, and the percentage of positive staining was significantly decreased at 12 weeks after injury compared with that pre-SCI (P = 0.002), as measured by quantitative analysis (Figure 7). The GFAP staining intensity was more prevalent, and the percentage of positive staining was increased significantly compared with that pre-SCI (P = 0.010). The NeuN staining intensity showed no significant changes compared with that pre-SCI (P = 0.798). The NF staining for PLIC intensity remained low, and the percentage of positive staining was decreased significantly at 12 weeks after injury compared with that pre-SCI (P = 0.014), as measured by quantitative analysis (Figure 8). The GFAP staining intensity was more prevalent, and the percentage of positive staining was increased significantly compared with those pre-SCI (P < 0.001). The NeuN staining intensity showed no significant change compared with that pre-SCI (P = 0.520). For POG (Figure 9), the staining intensities of both NF (P = 0.001) and GFAP (P = 0.045) were more prevalent, and the percentages of positive staining were increased significantly compared with those pre-SCI, whereas the percentage of NeuN positive staining was increased but did not reach a significant difference compared with that pre-SCI (P = 0.496). For PRG (Figure 10), the staining intensities of NF (P = 0.034), GFAP (P = 0.015) and NeuN (P = 0.036) were all more prevalent, and the percentages of positive staining were significantly increased compared with those pre-SCI. The detailed Student’s t-test results of immunohistochemical analyses comparing the SCI group with the control group are listed in Additional Table 4.
Figure 7.
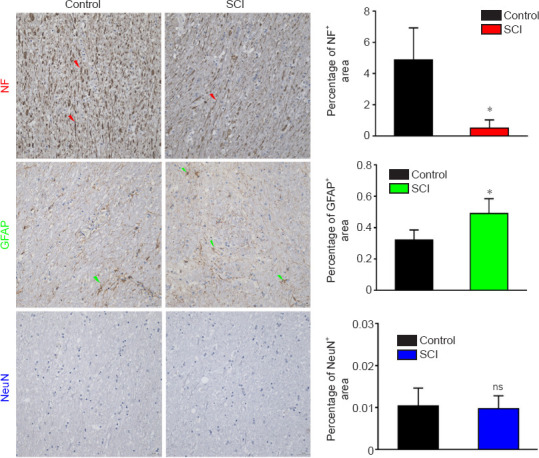
Immunohistochemical staining of the CP in a dog model of SCI at 12 weeks after injury.
The NF staining intensity was weakened and the percentage of NF positively stained area was decreased in the SCI group compared with those in the control group. The GFAP staining intensity was stronger and the percentage of positively stained area was increased compared with those in the control group. There was no significant difference in NeuN staining intensity between SCI and control groups. Arrows represent typical positive expression. Data are expressed as the mean ± SD (n = 5). *P < 0.05, vs. control group (Student’s t-test). CP: Cerebral peduncle; GFAP: glial fibrillary acidic protein; NF: neurofilament heavy polypeptide; ns: not significant; SCI: spinal cord injury.
Figure 8.
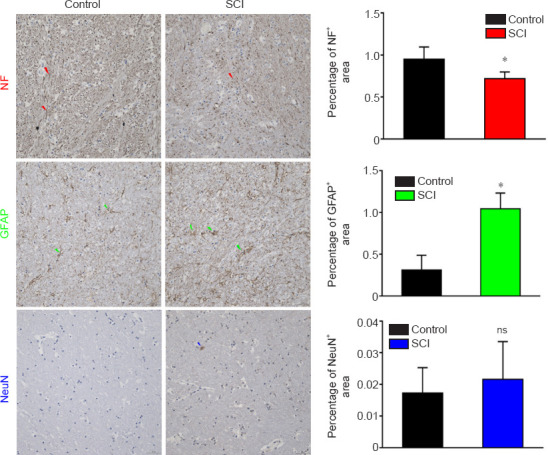
Immunohistochemical staining of the PLIC in a dog model of SCI at 12 weeks after injury.
The NF staining intensity was weakened and the percentage of NF positively stained area was decreased in the SCI group compared with those in the control group. The GFAP staining intensity was stronger and the percentage of positively stained area was increased compared with those in the control group. The NeuN staining intensity did not change significantly in the SCI group compared with that in the control group. Arrows represent typical positive expression. Data are expressed as the mean ± SD (n = 5). *P < 0.05, vs. control group (Student’s t-test). GFAP: Glial fibrillary acidic protein; NF: neurofilament heavy polypeptide; ns: not significant; PLIC: posterior limb of internal capsule; SCI: spinal cord injury.
Figure 9.
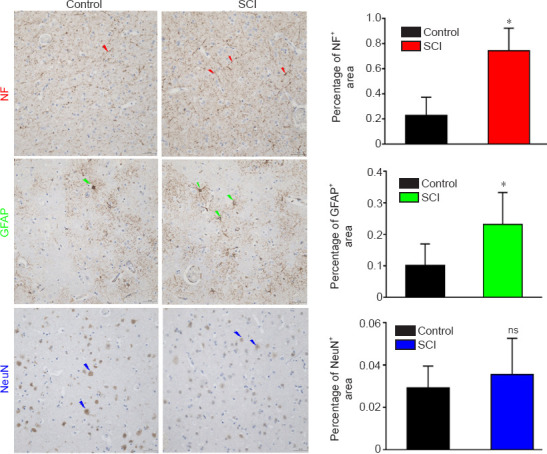
Immunohistochemical staining of the POG in a dog model of SCI at 12 weeks after injury.
The staining intensities of both NF and GFAP were stronger, and the percentages of positively stained area were increased significantly in the SCI group compared with those in the control group. The percentage of NeuN positively stained area was slightly, but not significantly increased, in the SCI group compared with that in the control group. Arrows represent typical positive expression. Data are expressed as mean ± SD (n = 5). *P < 0.05, vs. control group (Student's t-test). GFAP: Glial fibrillary acidic protein; NF: neurofilament heavy polypeptide; ns: not significant; POG: postcentral gyrus; SCI: spinal cord injury.
Figure 10.
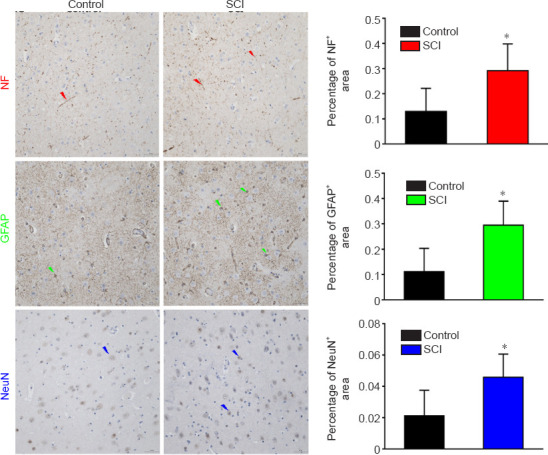
Immunohistochemical staining of the PRG in a dog model of SCI at 12 weeks after injury.
The staining intensities of NF, GFAP and NeuN were all stronger, and the percentages of positively stained areas were increased significantly in the SCI group compared with those in the control group. Arrows represent typical positive expression. Arrows represent typical positive expression. Data are expressed as mean ± SD (n = 5). *P < 0.05, vs. control group (Student&s t-test). GFAP: Glial fibrillary acidic protein; NF: neurofilament heavy polypeptide; PRG: precentral gyrus; SCI: spinal cord injury.
Additional Table 4.
Student's t-test results of immunohistochemical findings from the SCI and control groups
| Region of interest | t-value | df | n | P-value |
|---|---|---|---|---|
| CP | ||||
| NF | 4.638 | 8 | 15 | 0.002 |
| GFAP | 3.337 | 8 | 15 | 0.010 |
| NeuN | 0.265 | 8 | 15 | 0.798 |
| PLIC | ||||
| NF | 2.824 | 8 | 15 | 0.022 |
| GFAP | 6.388 | 8 | 15 | <0.001 |
| NeuN | 0.673 | 8 | 15 | 0.520 |
| POG | ||||
| NF | 5.001 | 8 | 15 | 0.001 |
| GFAP | 2.378 | 8 | 15 | 0.045 |
| NeuN | 0.713 | 8 | 15 | 0.496 |
| PRG | ||||
| NF | 2.558 | 8 | 15 | 0.034 |
| GFAP | 3.097 | 8 | 15 | 0.015 |
| NeuN | 2.510 | 8 | 15 | 0.036 |
CP: Cerebral peduncle; GFAP: glial fibrillary acidic protein; NF: neurofilament; PLIC: posterior limb of internal capsule; POG: postcentral gyrus; PRG: precentral gyrus.
Discussion
Reports have suggested that a dog model of clinical SCI can be compared with SCI in humans in terms of mechanisms of injury, pathology, outcome, classification, and functional monitoring. This model is considered an ideal translational model between rodent experiments and human clinical trials, and our team has also made some progress in making canine SCI models (Boekhoff et al., 2012). In this study, the dynamic changes in FA and ADC values of cerebrospinal structures after SCI in the canines were investigated. The correlations between DTI parameter values and functional recovery scores, and the possible pathology affecting DTI in the ROIs were explored.
DTT
A previous study (Anaya García et al., 2015) has shown that DTT can assist in quickly tracking and identifying the white matter fibers in a selected region among dogs of different healthy breeds and different sexes. The 3D reconstruction technique can depict the anatomical structure of the canine brain and the spatial distribution of fiber bundles (Anaya García et al., 2015). This technique can also be used in dog models of SCI to explore the degradation of fiber bundles and the effect of fiber bundles on cerebrospinal structures over time. The direction and proportion of fiber bundles can be illustrated qualitatively through distinctive colors in DTT. Studies have reported that the number of somatosensory and motor cortex-associated fiber bundles changes after SCI, and some new fiber connections are regenerated, as observed by functional MRI detection in rats (Ramu et al., 2008). These findings are of great significance for the study of the fiber bundle changes in cerebrospinal structures after SCI. As there is no standard template for canine brain fiber bundles, three-layer images containing the ROIs were selected to calculate the average value to improve the accuracy. CP and PLIC are the sites through which the corticospinal tract passes, as well as the sites where retrograde degeneration occurs along the corticospinal tract after injury. PRG and POG are involved in dominant motor function and sensory function, which decline after SCI. Therefore, the anatomical locations directly related to these four ROIs were selected for the study.
DTI of the CP after SCI
Our results showed that the FA values of CP were increased and the degree of this increase varied at different time points after SCI. Jirjis et al. (2016) reported that the FA values were increased after SCI, and that the degree of change was associated with the severity of SCI in the related areas of the brainstem and corticospinal tract. Small animal studies indicated that glial reactivity was related to SCI severity, with changes occurring after moderate to severe SCI. Some clinical studies revealed that the FA value of CP in the SCI group was lower than that in the control group, but this difference reached no statistical significance (Koskinen et al., 2014). The Pearson correlation results showed that the FA value of the CP was highly correlated with the behavioral recovery, including the gradual restoring of nerve function and nerve conduction pathway processing over time. These findings also indicated that the diffusion changes in the CP and the nerve conduction pathways of the spinal cord were related, accompanied by improvement in SCI when compared with a previous study (Koskinen et al., 2014). Our results showed that the ADC values of the CP region were decreased first and then increased after SCI. Similarly, Koskinen et al. (2014) reported that the mean ADC values were increased in the CP region after SCI in humans. Moreover, Sun et al. (2017) studied cervical and thoracic SCI in humans and found that the ADC values in the relevant areas of different SCI segments were increased. In general, the ADC values were found to be decreased during the acute phase and increased during the subacute or chronic phase. Based on these results, SCI was shown to affect the CP in the acute phase. In addition, it was observed that nerve conduction was obstructed, resulting in the decrease of water molecule diffusion in the CP, which gradually recovered over time.
The immunohistochemical staining results provide strong evidence to explain the DTI parameter changes in the selected ROIs. A statistically significant reduction in the expression of NF of the CP was observed when compared with that in the control group, suggesting that axonal degeneration had occurred in the CP 12 weeks after SCI. Ramu et al. (2008) investigated the fiber bundles in the CP after 6 weeks of SCI in rats. They found that the number of fiber bundles increased significantly, and the FA values of the CP were increased significantly. In our study, there was a significant increase in FA values at 6 and 12 weeks. Perhaps, the regeneration of axons and the remodeling of fiber connections after SCI were important explanations for this finding. Our results showed that the expression of GFAP, which was also thought to affect the DTI measurement, was significantly increased (Harsan et al., 2007). Reactive glial cell proliferation might have an effect on ADC values because glial cells could affect the diffusion of water molecules. In addition, astrocytes might also play a major role as regulators of water homeostasis via the expression of aquaporins (Amiry-Moghaddam et al., 2004; Hu et al., 2015). Our findings were consistent with those of previous reports.
DTI of the PLIC after SCI
Our results showed that the FA values of the PLIC were decreased and then increased over time, and the final trend of the curve was found to be dropped after SCI, which showed a significant difference after 24 hours. Freund et al. (2011) reported that the FA values of the PLIC and vertebral pyramids in humans were decreased, which were consistent with our results. They also showed a progressive increase in the FA values of the PLIC and corona radiata for 12 months after SCI. Our results showed that the ADC values of the PLIC were first decreased and then increased after SCI, with a statistically significant difference at 3 hours, 3, 6 and 12 weeks after injury. Some experts have reported that the ADC values of the PLIC after SCI in humans were mainly decreased when compared to those of controls. However, this difference did not reach a statistical significance (Koskinen et al., 2014). The immunohistochemical staining results revealed that the expression of NF was decreased significantly in the SCI group when compared with that in the control group, suggesting that axonal degeneration occurred in the PLIC 12 weeks after SCI. Our results were similar to the findings of the study by Ramu et al. (2008), which reported that the expression of NF was decreased. The expression of GFAP was increased, and the NeuN level showed no significant changes 6 weeks after injury compared with control group.
DTI of the POG and PRG after SCI
In the POG, which is the main somatosensory center, the FA value was first decreased and then increased to varying degrees over time. Significant difference in FA value was observed among 3 hours, 6 weeks and 12 weeks after SCI. The sensory function of the animals declined after SCI. The reduction in FA values also indicated that the fiber bundles that transmitted sensations were degraded, which reached the most serious stage at 3 hours post-SCI. Moreover, there were varying degrees of recovery of function over time after SCI. In the PRG, which is the main somatic motor center, the FA value was first increased and then decreased over time, while the final trend of the FA curve was found to be increased. Significant difference in FA value was observed among 24 hours, 3 and 12 weeks after injury. The most obvious symptom of SCI was dyskinesia, and motor function gradually recovered with time. Functional assessment was weakly correlated with the FA value of the PRG, suggesting that the changes in FA value might reflect the recovery of nerve function to certain extent. Our results showed that the ADC values were first decreased and then increased in the POG, and the differences were significant at 3 hours, 6 and 12 weeks after injury. With regard to the PRG, the ADC values were mainly increased and only decreased at the last time point in the SCI group, but the magnitude of these changes was smaller in the SCI group than that in the control group. Studies have reported that SCI can lead to extensive brain reorganization in the sensorimotor cortex due to cortical circuit deafferentation (Nardone et al., 2013). With the remodeling of the cerebral cortex, SCI causes not only degradation of the spinal cord (Lundell et al., 2011), but also degeneration of the corticospinal tract and the sensorimotor cortex (Jurkiewicz et al., 2006; Wrigley et al., 2009). In addition, studies have revealed that the gray matter volume in the primary somatosensory (S1) and motor (M1) cortices decreases in response to chronic SCI (Young, 2002; Jurkiewicz et al., 2006; Wrigley et al., 2009; Freund et al., 2013). Histological results indicated the mechanisms underlying DTI changes after chronic SCI. Specifically, our results showed a significant increase in the expression levels of both NF and GFAP in the POG. In the somatosensory cortex, the negative feedback of sensory function loss after SCI, the reactive glial cell hypertrophy and axonal hyperplasia were observed. Additionally, the number of sensory neurons was slightly, but not significantly, increased. These factors were likely to result in the decrease of FA values and the increase of ADC values. With regard to PRG, our results showed that the expression levels of NF, GFAP and NeuN were increased significantly. Similarly, the negative feedback involving motor function loss, reactive glial cells hypertrophy and axonal hyperplasia after SCI were observed in the somatic motor cortex. The number or volume of motor neurons was increased significantly. These findings might reveal that the self-regulation in the brain also plays a role in the recovery of motor function after SCI. The elevation in FA values and the reduction in ADC values were obtained by DTI detection.
Our findings also suggest that SCI might also lead to cerebrospinal structural changes in the early stages, such as at 3 or 24 hours post-injury. It could be possible that the neural pathway was blocked, and then gradually became abnormally active over time. Consequently, the abnormal activation of neural pathway might cause the activation of microglia during the chronic stage, which in turn led to fiber remodeling. Buss et al. (2005) reported that neuroinflammation occurred during both acute and chronic stages preceding neurodegeneration, but appeared only at later time points, suggesting that inflammation may also lead to SCI-induced brain neurodegeneration. The changes in macro- and microstructure of the spinal cord after injury, manifested as changes in the aspects such as axonal degeneration diameter, progressive demyelination, glial cell apoptosis and regeneration, and cavity formation in the spinal gray matter, might lead to retrograde degradation of the fiber bundles possibly extending to relevant areas of the brain over time (Buss et al., 2005; DeBoy et al., 2007).
It is clear that SCI does cause changes in the brain, and there is no consensus as to whether spinal cord degeneration extends into the CP and PLIC of the brain or whether the stress response of the neural pathway in the POG and PRG leads to brain remodeling. The factors affecting DTI might not only be pathological abnormalities but also include other causes such as water imbalance related to immune system disorders and intestinal dysbacteriosis after SCI. In addition, according to our findings and related literature, the four selected ROIs in this study might provide new research directions in the treatment of SCI. SCI was difficult to treat probably because the treatments generally only focused on the spinal cord area and neglected other associated brain regions. Therefore, both the brain and the spinal cord should be focused in the treatment strategies (Poo et al., 2016).
Study limitation
This study has several limitations. First, the animals are living entities. During anesthesia, the respiratory and heart rates might affect the acquisition of MRI signals, which are prevalent in each study. Second, because of the sacrifice of too many animals, pathological tests were not performed at each time point, and only conducted at the end of the study. Third, there might be many pathological factors affecting DTI, but only a few were considered in this study, and other pathological characteristics should be further needed in future studies.
Conclusion
In this study, the dynamic changes of the diffusion parameters in the CP, PLIC, POG, and PRG of the brain after SCI were investigated and further validated by histopathology. The selected structures demonstrated significant pathophysiological changes staring from about 3 weeks after SCI in the canine. The dynamic DTI parameter changes were correlated with neurological assessment results. The results of this study provide advanced insights into the reorganization of cerebrospinal structures after SCI. Further studies are needed to investigate innovative strategies for the treatment of SCI.
Additional files:
Additional Figure 1 (620.2KB, tif) : Process of establishing a dog model of spinal cord injury.
Process of establishing a dog model of spinal cord injury.
(A) The impactor used. (B) The normal spinal cord after laminectomy. (C) Adjusting the impactor and being ready to cause an impact. (D) Arrow indicates impact site. Reprinted from Liu et al. (2018b).
Additional Figure 2 (763.7KB, tif) : Behavioral assessment by Texas Spinal Cord Injury Score of dogs.
Behavioral assessment by Texas Spinal Cord Injury Score of dogs.
Reprinted from Liu et al. (2018b).
Additional Table 1: The detailed results of all regions of interest in the control group by one-way analysis of variance followed by Tukey’s post hoc tests.
Additional Table 2: The detailed Student’s t-test results of all regions of interest in the SCI and control groups.
Additional Table 3: Summary analysis of the P-value of the selected structures at each time point in the SCI and control groups using one-way analysis of variance followed by Tukey’s post hoc test.
Additional Table 4: Student’s t-test results of immunohistochemical findings from the SCI and control groups.
Additional file 1: Open peer review report 1 (89.7KB, pdf) .
Acknowledgments:
We thank all the other members of Department of Rehabilitation Medicine, Beijing Tiantan Hospital; China Rehabilitation Science Institute; Department of Spinal and Neural Function Reconstruction, Beijing Bo’ai Hospital; Zhen-Tao Zuo from State Key Laboratory of Brain and Cognitive Science, Institute of Biophysics, Chinese Academy of Sciences, China; Da-Wei Zang, Yu-Mei Zhang and Zhi-Zheng Zhuo from Beijing Tiantan Hospital for their assistance in this study.
Footnotes
Funding: This work was supported by the National Natural Science Foundation of China, No. 82102676 (to CBL), a grant from Beijing Municipal Science & Technology Commission, No. Z171100001017076 (to JJL), National Key Research and Development Program, No. 2018YFF0301104 (to JJL) and Research on Medical Protection Technology and Application of Induced Neural Stem Cells in the Treatment of Military Spinal Cord Injury, No. Z181100004118004 (to JL).
Conflicts of interest: No competing financial interests exist.
Availability of data and materials: All data generated or analyzed during this study are included in this published article and its supplementary information files.
P-Reviewers: Wanner BI, Gaudin XP; C-Editor: Zhao M; S-Editors: Yu J, Li CH; L-Editor: Song LP; T-Editor: Jia Y
References
- 1.Amiry-Moghaddam M, Frydenlund DS, Ottersen OP. Anchoring of aquaporin-4 in brain:molecular mechanisms and implications for the physiology and pathophysiology of water transport. Neuroscience. 2004;129:999–1010. doi: 10.1016/j.neuroscience.2004.08.049. [DOI] [PubMed] [Google Scholar]
- 2.Anaya García MS, Hernández Anaya JS, Marrufo Meléndez O, Velázquez Ramírez JL, Palacios Aguiar R. In vivo study of cerebral white matter in the dog using diffusion tensor tractography. Vet Radiol Ultrasound. 2015;56:188–195. doi: 10.1111/vru.12211. [DOI] [PMC free article] [PubMed] [Google Scholar]
- 3.Boekhoff TM, Flieshardt C, Ensinger EM, Fork M, Kramer S, Tipold A. Quantitative magnetic resonance imaging characteristics:evaluation of prognostic value in the dog as a translational model for spinal cord injury. J Spinal Disord Tech. 2012;25:E81–87. doi: 10.1097/BSD.0b013e31823f2f55. [DOI] [PubMed] [Google Scholar]
- 4.Buss A, Pech K, Merkler D, Kakulas BA, Martin D, Schoenen J, Noth J, Schwab ME, Brook GA. Sequential loss of myelin proteins during Wallerian degeneration in the human spinal cord. Brain. 2005;128:356–364. doi: 10.1093/brain/awh355. [DOI] [PubMed] [Google Scholar]
- 5.Catani M, Thiebaut de Schotten M. A diffusion tensor imaging tractography atlas for virtual in vivo dissections. Cortex. 2008;44:1105–1132. doi: 10.1016/j.cortex.2008.05.004. [DOI] [PubMed] [Google Scholar]
- 6.Chang Y, Jung TD, Yoo DS, Hyun JK. Diffusion tensor imaging and fiber tractography of patients with cervical spinal cord injury. J Neurotrauma. 2010;27:2033–2040. doi: 10.1089/neu.2009.1265. [DOI] [PubMed] [Google Scholar]
- 7.David G, Freund P, Mohammadi S. The efficiency of retrospective artifact correction methods in improving the statistical power of between-group differences in spinal cord DTI. Neuroimage. 2017;158:296–307. doi: 10.1016/j.neuroimage.2017.06.051. [DOI] [PMC free article] [PubMed] [Google Scholar]
- 8.DeBoy CA, Zhang J, Dike S, Shats I, Jones M, Reich DS, Mori S, Nguyen T, Rothstein B, Miller RH, Griffin JT, Kerr DA, Calabresi PA. High resolution diffusion tensor imaging of axonal damage in focal inflammatory and demyelinating lesions in rat spinal cord. Brain. 2007;130:2199–2210. doi: 10.1093/brain/awm122. [DOI] [PubMed] [Google Scholar]
- 9.Delarue Q, Chalfouh C, Guérout N. Spinal cord injury:can we repair spinal cord non-invasively by using magnetic stimulation? Neural Regen Res. 2021;16:2429–2430. doi: 10.4103/1673-5374.313033. [DOI] [PMC free article] [PubMed] [Google Scholar]
- 10.Dietz V, Curt A. Neurological aspects of spinal-cord repair:promises and challenges. Lancet Neurol. 2006;5:688–694. doi: 10.1016/S1474-4422(06)70522-1. [DOI] [PubMed] [Google Scholar]
- 11.Dong X, Yang D, Li J, Liu C, Yang M, Du L, Gu R, Hu A, Zhang H. Intramedullary pressure changes in rats after spinal cord injury. Spinal Cord. 2016;54:947–950. doi: 10.1038/sc.2016.35. [DOI] [PubMed] [Google Scholar]
- 12.Freund P, Curt A, Friston K, Thompson A. Tracking changes following spinal cord injury:insights from neuroimaging. Neuroscientist. 2013;19:116–128. doi: 10.1177/1073858412449192. [DOI] [PMC free article] [PubMed] [Google Scholar]
- 13.Freund P, Schneider T, Nagy Z, Hutton C, Weiskopf N, Friston K, Wheeler-Kingshott CA, Thompson AJ. Degeneration of the injured cervical cord is associated with remote changes in corticospinal tract integrity and upper limb impairment. PLoS One. 2012;7:e51729. doi: 10.1371/journal.pone.0051729. [DOI] [PMC free article] [PubMed] [Google Scholar]
- 14.Freund P, Weiskopf N, Ward NS, Hutton C, Gall A, Ciccarelli O, Craggs M, Friston K, Thompson AJ. Disability, atrophy and cortical reorganization following spinal cord injury. Brain. 2011;134:1610–1622. doi: 10.1093/brain/awr093. [DOI] [PMC free article] [PubMed] [Google Scholar]
- 15.Gustin SM, Wrigley PJ, Siddall PJ, Henderson LA. Brain anatomy changes associated with persistent neuropathic pain following spinal cord injury. Cereb Cortex. 2010;20:1409–1419. doi: 10.1093/cercor/bhp205. [DOI] [PubMed] [Google Scholar]
- 16.Harsan LA, Poulet P, Guignard B, Parizel N, Skoff RP, Ghandour MS. Astrocytic hypertrophy in dysmyelination influences the diffusion anisotropy of white matter. J Neurosci Res. 2007;85:935–944. doi: 10.1002/jnr.21201. [DOI] [PubMed] [Google Scholar]
- 17.Hu AM, Li JJ, Sun W, Yang DG, Yang ML, Du LJ, Gu R, Gao F, Li J, Chu HY, Zhang X, Gao LJ. Myelotomy reduces spinal cord edema and inhibits aquaporin-4 and aquaporin-9 expression in rats with spinal cord injury. Spinal Cord. 2015;53:98–102. doi: 10.1038/sc.2014.209. [DOI] [PubMed] [Google Scholar]
- 18.Jacqmot O, Van Thielen B, Fierens Y, Hammond M, Willekens I, Van Schuerbeek P, Verhelle F, Goossens P, De Ridder F, Clarys JP, Vanbinst A, De Mey J. Diffusion tensor imaging of white matter tracts in the dog brain. Anat Rec (Hoboken) 2013;296:340–349. doi: 10.1002/ar.22638. [DOI] [PubMed] [Google Scholar]
- 19.Jirjis MB, Kurpad SN, Schmit BD. Ex vivo diffusion tensor imaging of spinal cord injury in rats of varying degrees of severity. J Neurotrauma. 2013;30:1577–1586. doi: 10.1089/neu.2013.2897. [DOI] [PMC free article] [PubMed] [Google Scholar]
- 20.Jirjis MB, Vedantam A, Budde MD, Kalinosky B, Kurpad SN, Schmit BD. Severity of spinal cord injury influences diffusion tensor imaging of the brain. J Magn Reson Imaging. 2016;43:63–74. doi: 10.1002/jmri.24964. [DOI] [PubMed] [Google Scholar]
- 21.Jurkiewicz MT, Crawley AP, Verrier MC, Fehlings MG, Mikulis DJ. Somatosensory cortical atrophy after spinal cord injury:a voxel-based morphometry study. Neurology. 2006;66:762–764. doi: 10.1212/01.wnl.0000201276.28141.40. [DOI] [PubMed] [Google Scholar]
- 22.Kim JH, Song SK, Burke DA, Magnuson DS. Comprehensive locomotor outcomes correlate to hyperacute diffusion tensor measures after spinal cord injury in the adult rat. Exp Neurol. 2012;235:188–196. doi: 10.1016/j.expneurol.2011.11.015. [DOI] [PMC free article] [PubMed] [Google Scholar]
- 23.Koskinen EA, Hakulinen U, Brander AE, Luoto TM, Ylinen A, Ohman JE. Clinical correlates of cerebral diffusion tensor imaging findings in chronic traumatic spinal cord injury. Spinal Cord. 2014;52:202–208. doi: 10.1038/sc.2013.163. [DOI] [PubMed] [Google Scholar]
- 24.Levine GJ, Levine JM, Budke CM, Kerwin SC, Au J, Vinayak A, Hettlich BF, Slater MR. Description and repeatability of a newly developed spinal cord injury scale for dogs. Prev Vet Med. 2009;89:121–127. doi: 10.1016/j.prevetmed.2009.02.016. [DOI] [PubMed] [Google Scholar]
- 25.Liu C, Yang D, Li J, Li D, Yang M, Sun W, Meng Q, Zhang W, Cai C, Du L, Li J, Gao F, Gu R, Feng Y, Dong X, Miao Q, Yang X, Zuo Z. Dynamic diffusion tensor imaging of spinal cord contusion:a canine model. J Neurosci Res. 2018a;96:1093–1103. doi: 10.1002/jnr.24222. [DOI] [PubMed] [Google Scholar]
- 26.Liu CB, Yang DG, Meng QR, Li DP, Yang ML, Sun W, Zhang WH, Cai C, Du LJ, Li J, Gao F, Yu Y, Zhang X, Zuo ZT, Li JJ. Dynamic correlation of diffusion tensor imaging and neurological function scores in beagles with spinal cord injury. Neural Regen Res. 2018b;13:877–886. doi: 10.4103/1673-5374.232485. [DOI] [PMC free article] [PubMed] [Google Scholar]
- 27.Liu X, Tian R, Zuo Z, Zhao H, Wu L, Zhuo Y, Zhang YQ, Chen L. A high-resolution MRI brain template for adult Beagle. Magn Reson Imaging. 2020;68:148–157. doi: 10.1016/j.mri.2020.01.003. [DOI] [PubMed] [Google Scholar]
- 28.Lundell H, Christensen MS, Barthélemy D, Willerslev-Olsen M, Biering-Sørensen F, Nielsen JB. Cerebral activation is correlated to regional atrophy of the spinal cord and functional motor disability in spinal cord injured individuals. Neuroimage. 2011;54:1254–1261. doi: 10.1016/j.neuroimage.2010.09.009. [DOI] [PubMed] [Google Scholar]
- 29.Nardone R, Höller Y, Brigo F, Seidl M, Christova M, Bergmann J, Golaszewski S, Trinka E. Functional brain reorganization after spinal cord injury:systematic review of animal and human studies. Brain Res. 2013;1504:58–73. doi: 10.1016/j.brainres.2012.12.034. [DOI] [PubMed] [Google Scholar]
- 30.Poo MM, Du JL, Ip NY, Xiong ZQ, Xu B, Tan T. China brain project:basic neuroscience, brain diseases, and brain-inspired computing. Neuron. 2016;92:591–596. doi: 10.1016/j.neuron.2016.10.050. [DOI] [PubMed] [Google Scholar]
- 31.Preti MG, Di Marzio A, Mastropietro A, Aquino D, Baselli G, Laganà MM, Zucca I, Frassoni C, Spreafico R. Tractographic reconstruction protocol optimization in the rat brain in-vivo:towards a normal atlas. Annu Int Conf IEEE Eng Med Biol Soc. 2011;2011:8467–8470. doi: 10.1109/IEMBS.2011.6092089. [DOI] [PubMed] [Google Scholar]
- 32.Ramu J, Herrera J, Grill R, Bockhorst T, Narayana P. Brain fiber tract plasticity in experimental spinal cord injury:diffusion tensor imaging. Exp Neurol. 2008;212:100–107. doi: 10.1016/j.expneurol.2008.03.018. [DOI] [PMC free article] [PubMed] [Google Scholar]
- 33.Sadeghi N, Prastawa M, Fletcher PT, Wolff J, Gilmore JH, Gerig G. Regional characterization of longitudinal DT-MRI to study white matter maturation of the early developing brain. Neuroimage. 2013;68:236–247. doi: 10.1016/j.neuroimage.2012.11.040. [DOI] [PMC free article] [PubMed] [Google Scholar]
- 34.Schneider CA, Rasband WS, Eliceiri KW. NIH Image to ImageJ:25 years of image analysis. Nat Methods. 2012;9:671–675. doi: 10.1038/nmeth.2089. [DOI] [PMC free article] [PubMed] [Google Scholar]
- 35.Shen XY, Tao CL, Ma L, Shen JH, Li ZL, Wang ZG, LüXY Influence of spinal cord injury on core regions of motor function. Neural Regen Res. 2021;16:567–572. doi: 10.4103/1673-5374.293158. [DOI] [PMC free article] [PubMed] [Google Scholar]
- 36.Sun P, Murphy RK, Gamble P, George A, Song SK, Ray WZ. Diffusion assessment of cortical changes, induced by traumatic spinal cord injury. Brain Sci. 2017;7:21. doi: 10.3390/brainsci7020021. [DOI] [PMC free article] [PubMed] [Google Scholar]
- 37.Varghese F, Bukhari AB, Malhotra R, De A. IHC Profiler:an open source plugin for the quantitative evaluation and automated scoring of immunohistochemistry images of human tissue samples. PLoS One. 2014;9:e96801. doi: 10.1371/journal.pone.0096801. [DOI] [PMC free article] [PubMed] [Google Scholar]
- 38.Webb AA, Ngan S, Fowler D. Spinal cord injury II:prognostic indicators, standards of care, and clinical trials. Can Vet J. 2010;51:598–604. [PMC free article] [PubMed] [Google Scholar]
- 39.Wrigley PJ, Gustin SM, Macey PM, Nash PG, Gandevia SC, Macefield VG, Siddall PJ, Henderson LA. Anatomical changes in human motor cortex and motor pathways following complete thoracic spinal cord injury. Cereb Cortex. 2009;19:224–232. doi: 10.1093/cercor/bhn072. [DOI] [PubMed] [Google Scholar]
- 40.Yamamoto T, Yamasaki M, Imai T. Retrograde pyramidal tract degeneration in a patient with cervical haematomyelia. J Neurol Neurosurg Psychiatry. 1989;52:382–386. doi: 10.1136/jnnp.52.3.382. [DOI] [PMC free article] [PubMed] [Google Scholar]
- 41.Young W. Spinal cord contusion models. Prog Brain Res. 2002;137:231–255. doi: 10.1016/s0079-6123(02)37019-5. [DOI] [PubMed] [Google Scholar]
Associated Data
This section collects any data citations, data availability statements, or supplementary materials included in this article.
Supplementary Materials
Process of establishing a dog model of spinal cord injury.
(A) The impactor used. (B) The normal spinal cord after laminectomy. (C) Adjusting the impactor and being ready to cause an impact. (D) Arrow indicates impact site. Reprinted from Liu et al. (2018b).
Behavioral assessment by Texas Spinal Cord Injury Score of dogs.
Reprinted from Liu et al. (2018b).


