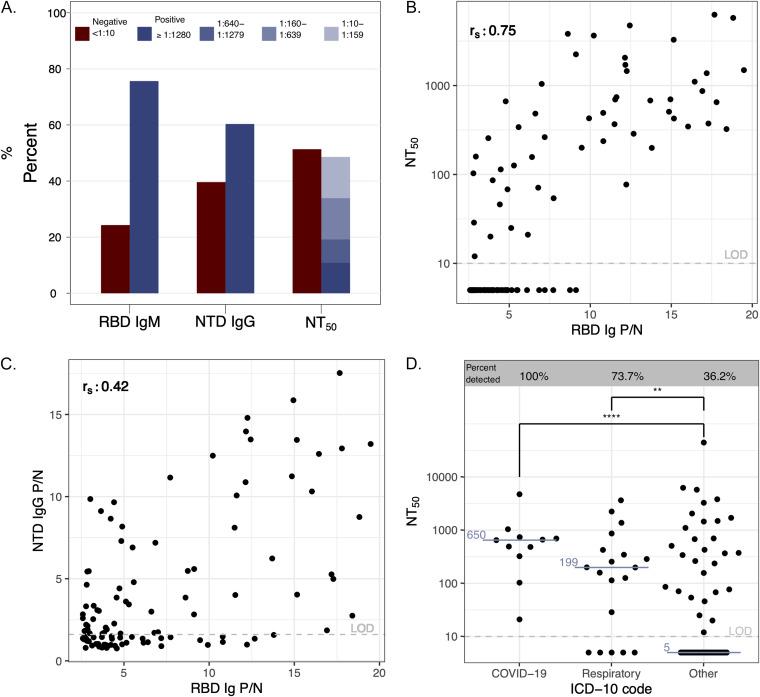
FIG 2.
Antibody repertoires in an RBD Ig-positive subset; 110 RBD Ig-positive samples were chosen at random to undergo SARS-2 antibody repertoire analysis. (A) Percentage of individuals with RBD IgM, NTD IgG, and functionally neutralizing antibodies (NT50). (B) Correlation plot of NT50 and RBD Ig. (C) Correlation plot of NTD IgG and RBD Ig; rs = Spearman correlation coefficient displayed in the top left of panels B and C. (D) NT50 values for each diagnosis binning category based on ICD-10 codes. Medians are shown in blue. Two-tailed Mann-Whitney test; ****, P < 0.0001; **, P = 0.0078.

