

Abstract
To understand neural circuit mechanisms underlying behavior, it is crucial to observe the dynamics of neuronal structure and function in different regions of the brain. Since current noninvasive imaging technologies allow cellular-resolution imaging of neurons only within ~1 millimeter below the cortical surface, the majority of mouse brain tissue remains inaccessible. While miniature optical imaging probes allow access to deep brain regions, cellular-resolution imaging is typically restricted to a small tissue volume. To increase the tissue access volume, we developed a clear optically matched panoramic access channel technique (COMPACT). With probe dimensions comparable to those of common GRIN lenses, COMPACT enables a two to three orders of magnitude greater tissue access volume. We demonstrated the capabilities of COMPACT by multiregional calcium imaging in mice during sleep. We believe that large-volume in vivo imaging with COMPACT will be valuable to a variety of deep tissue imaging applications.
Introduction
High-resolution optical imaging in the living brain has become a powerful tool for investigating the plasticity and function of neural circuits underlying animals’ behaviors.1–8 Genetically encoded fluorescent indicators and optical imaging have enabled selective labeling and observation of neuronal structure and function in live animals, which has transformed the study of neural circuits. Such technologies require delivering focused light inside brain tissue. Due to random light scattering induced by refractive index inhomogeneities, functional imaging at single-cell resolution is typically limited to ~1 millimeter (mm) depth.9–11 Even for the centimeter-scale mouse brain, such penetration depth limits optical access to superficial brain regions, and therefore the majority of the brain remains inaccessible to high-resolution optical imaging, unless invasive methods are employed. Although macroscale and mesoscope imaging modalities such as fMRI and ultrasound-based methods allow the imaging of deep brain structures, they lack single-cell resolution and sensitivity which is crucial to the understanding of neural circuitry.12 The current method of choice for cellular-resolution deep brain imaging therefore requires inserting miniature optical probes.13–21 However, a drawback of miniature optical probes is the small tissue access volume, which limits both the throughput and the success rate of their practical implementation. For instance, if the neurons of interest were not located within the probe’s imaging volume, additional animals and surgeries would be needed. Techniques that can provide larger tissue access volume for high-resolution imaging and thus improve the throughput, flexibility, and success rate are desirable.
Several invasive approaches have been developed for optical recording of deep brain structures, such as the excision of overlying brain tissue, miniature prism implantation, miniature gradient-index (GRIN) lens probes, and their combinations.13, 15–20 For viewing very deep brain regions, miniature lens probes are typically employed because they result in less tissue damage. Such miniature lens probes typically utilize a GRIN lens for its slim cylindrical body to form a focus deep inside brain tissue and relay the optical signal to the outside for detection. The high-resolution field of view (FOV) of GRIN lenses used for deep brain two-photon imaging is typically ~1/5 of the lens diameter. Greater lens diameter can provide greater FOV at the cost of more tissue damage. However, the ratio of imaging volume to insertion volume barely changes.
Here we report the development of a clear optically matched panoramic access channel technique (COMPACT), which overcomes the tissue access volume constraint. With the same insertion volume as GRIN lenses, COMPACT can provide a two to three orders of magnitude increase in tissue access volume. The key idea of COMPACT is to abandon the convention of directly inserting the lens into the brain. Instead, we insert a clear optically matched channel into the tissue. To acquire images, we then lower an imaging probe with side-viewing capability into the channel, similar to side-viewing endoscopes used in medical applications.22, 23 With the channel isolating the imaging probe from the tissue and providing refractive index matching with the tissue, we could freely rotate and translate the imaging probe inside the channel to image different brain regions. Rotation of the imaging probe enables a 360 degree panoramic view around the channel. Translation of the probe along the channel allows us to image throughout the entire insertion length. Compared to the small access volume at the tip of conventional imaging probes, COMPACT allows large volume imaging all around the inserted device.
Results
System design for COMPACT based two-photon imaging
The design of the COMPACT system for in vivo two-photon imaging of head-fixed mice (Fig. 1a) is similar to that of a conventional two-photon microscope equipped with a spatial light modulator (SLM) (Supplementary Video 1). We imaged a two-axis galvo scanner onto an SLM, which provided aberration correction and focal depth adjustment. The SLM was subsequently imaged onto the back focal plane of an objective lens whose focus was relayed to the brain tissue by a GRIN lens mounted on a precision rotary stage. For side-viewing capabilities, we attached a high refractive index right-angle micro prism onto the facet of the GRIN lens.
Figure 1 |. System design of COMPACT.
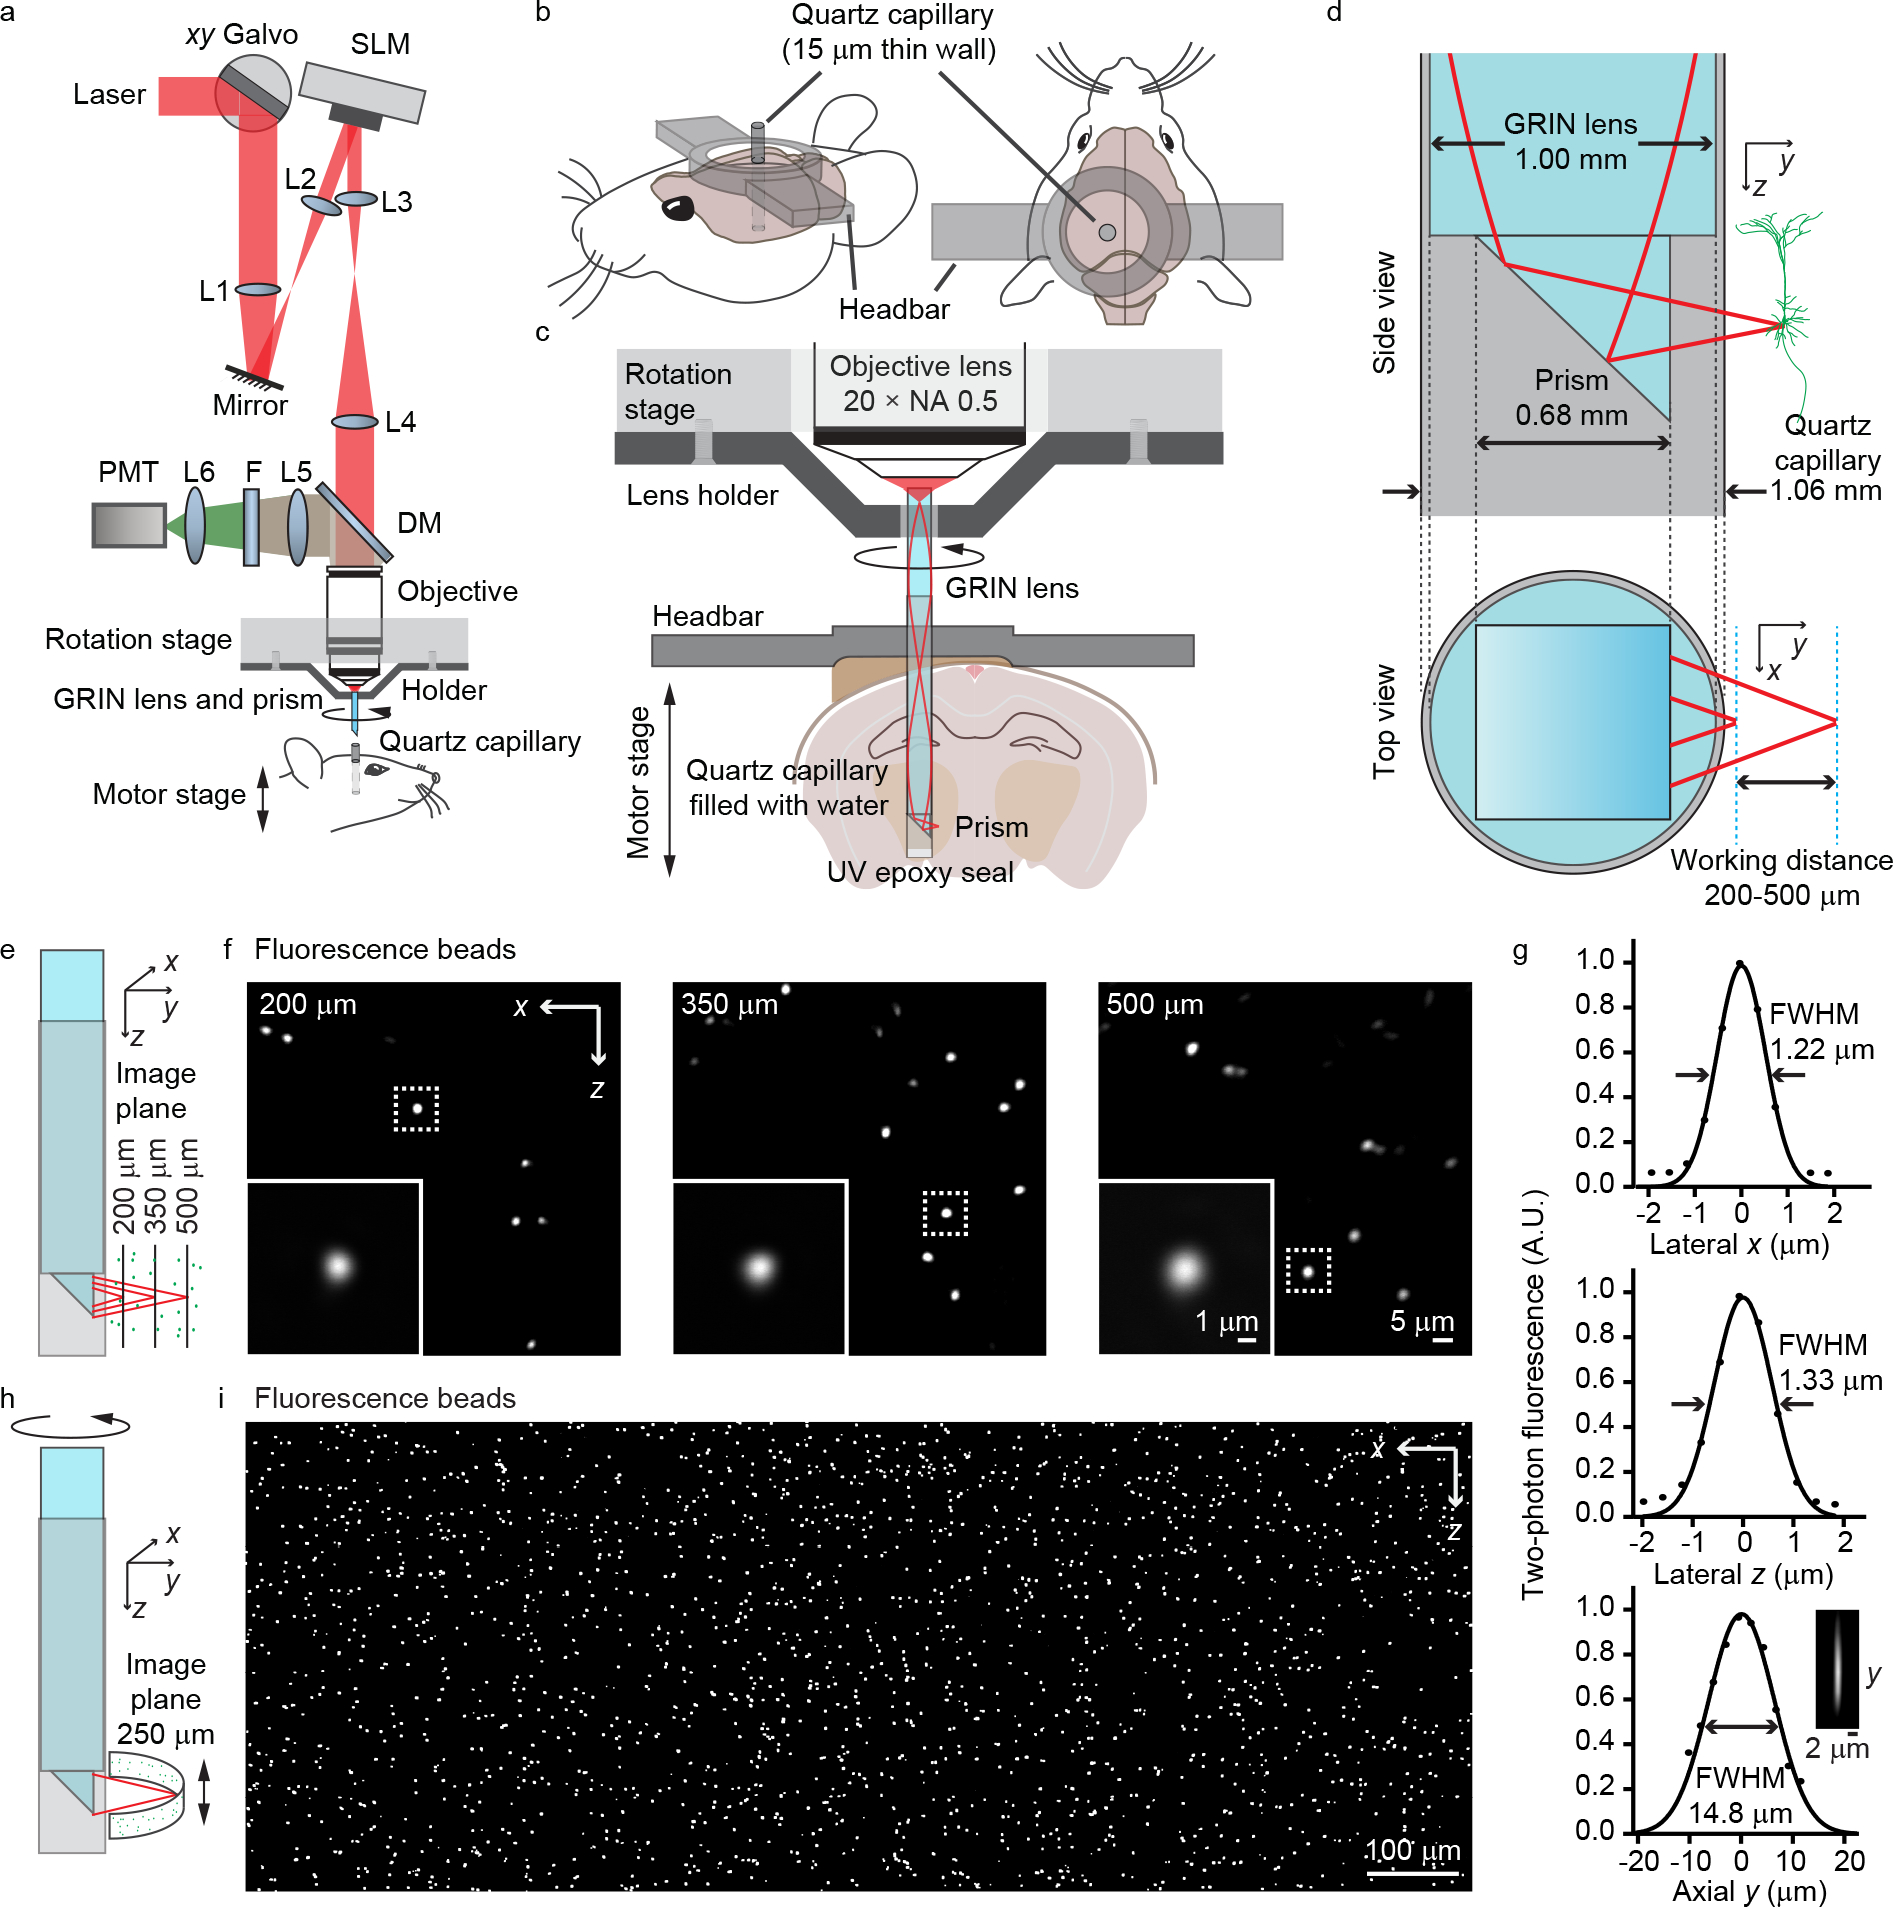
(a) The optical design for the COMPACT based two-photon imaging system. L1–4, telecentric relay lenses; L5–6, high etendue fluorescence collection lenses; F, bandpass filter; DM, dichroic mirror. (b) The configuration of the head-bar and the surgically implanted quartz capillary. (c) The rotation and translation control for whole-depth panoramic imaging. The rotary stage spins the imaging probe for a panoramic view and the motorized stage moves the capillary along the rotation axis for viewing different depths in the brain. (d) Dimension of the capillary, imaging probe, and the working distance. (e) Illustration of how the SLM allows moving the laser focus to image beads at different distances from the capillary. (f) Images of 0.5 μm fluorescence beads at the indicated distance from the capillary. (g) The cross-section plot of the PSF at 200 μm outside the prism surface in x, z and y directions. (h), Rotation and translation of the imaging probe with respect to the sample for panoramic large FOV imaging. (i) Example of large FOV panoramic imaging of 0.5 μm fluorescence beads in agar. The range of angle rotation is 120 degree and the range of axial translation is 510 μm. The image shown is a composite.
To form the clear optically matched channel, we surgically inserted an ultrathin quartz capillary with a wall thickness of 15 μm into the mouse brain (Fig. 1b). We filled the capillary with water to match the refractive index of brain tissue and then inserted the imaging probe into the capillary for imaging (Fig. 1c). Aberrations introduced by the 15 μm thin quartz are negligible for two-photon excitation with NA ≤ 0.5. Moreover, we used the SLM to compensate for the overall system aberration in the imaging path, which was dominated by the GRIN lens induced spherical aberration.
For panoramic imaging around the capillary, we need to precisely spin the imaging probe around the rotation axis of the rotary stage. Thus, both the probe and the capillary need to be well aligned with respect to the rotation axis. Utilizing three machine vision cameras, we implemented an automatic alignment procedure (Extended Data Fig. 1). These cameras also guided the process of inserting the imaging probe into the channel. After insertion, we could freely rotate the imaging probe for panoramic imaging by controlling the rotary stage. Moving the motorized stage that held the mouse head-bar along the rotation axis allowed us to image through the entire length of the capillary.
With SLM-controlled defocusing, we could typically image ~500 μm outside the prism facet, i.e. ~ 300 μm into the brain tissue (Fig. 1d). To assess imaging performance, we embedded 0.5 μm beads in agar, inserted the quartz capillary into the agar, and then performed volumetric imaging (Fig. 1e–i). With a simple probe design that only utilized a GRIN lens and a high index right-angle prism, the achieved spatial resolution (Fig. 1g) was theoretically sufficient for resolving dendrites and somata of neurons. The excitation numerical aperture (NA) for imaging 200–500 μm outside the prism facet was 0.38–0.32 while the signal collection NA was ~0.5, limited by the objective lens. To further improve the spatial resolution, we also designed a compound lens with excitation NA ~0.42 (Extended Data Fig. 2). With COMPACT in either iteration, just small rotations (120 degrees) can yield a wide FOV (Fig. 1h and 1i). Rotating the 1 mm diameter probe over 360 degrees while imaging ~300 μm outside the channel can yield a ~5 mm wide panoramic view. Such a FOV is unattainable with conventional GRIN lens methods.
COMPACT-enabled structural imaging
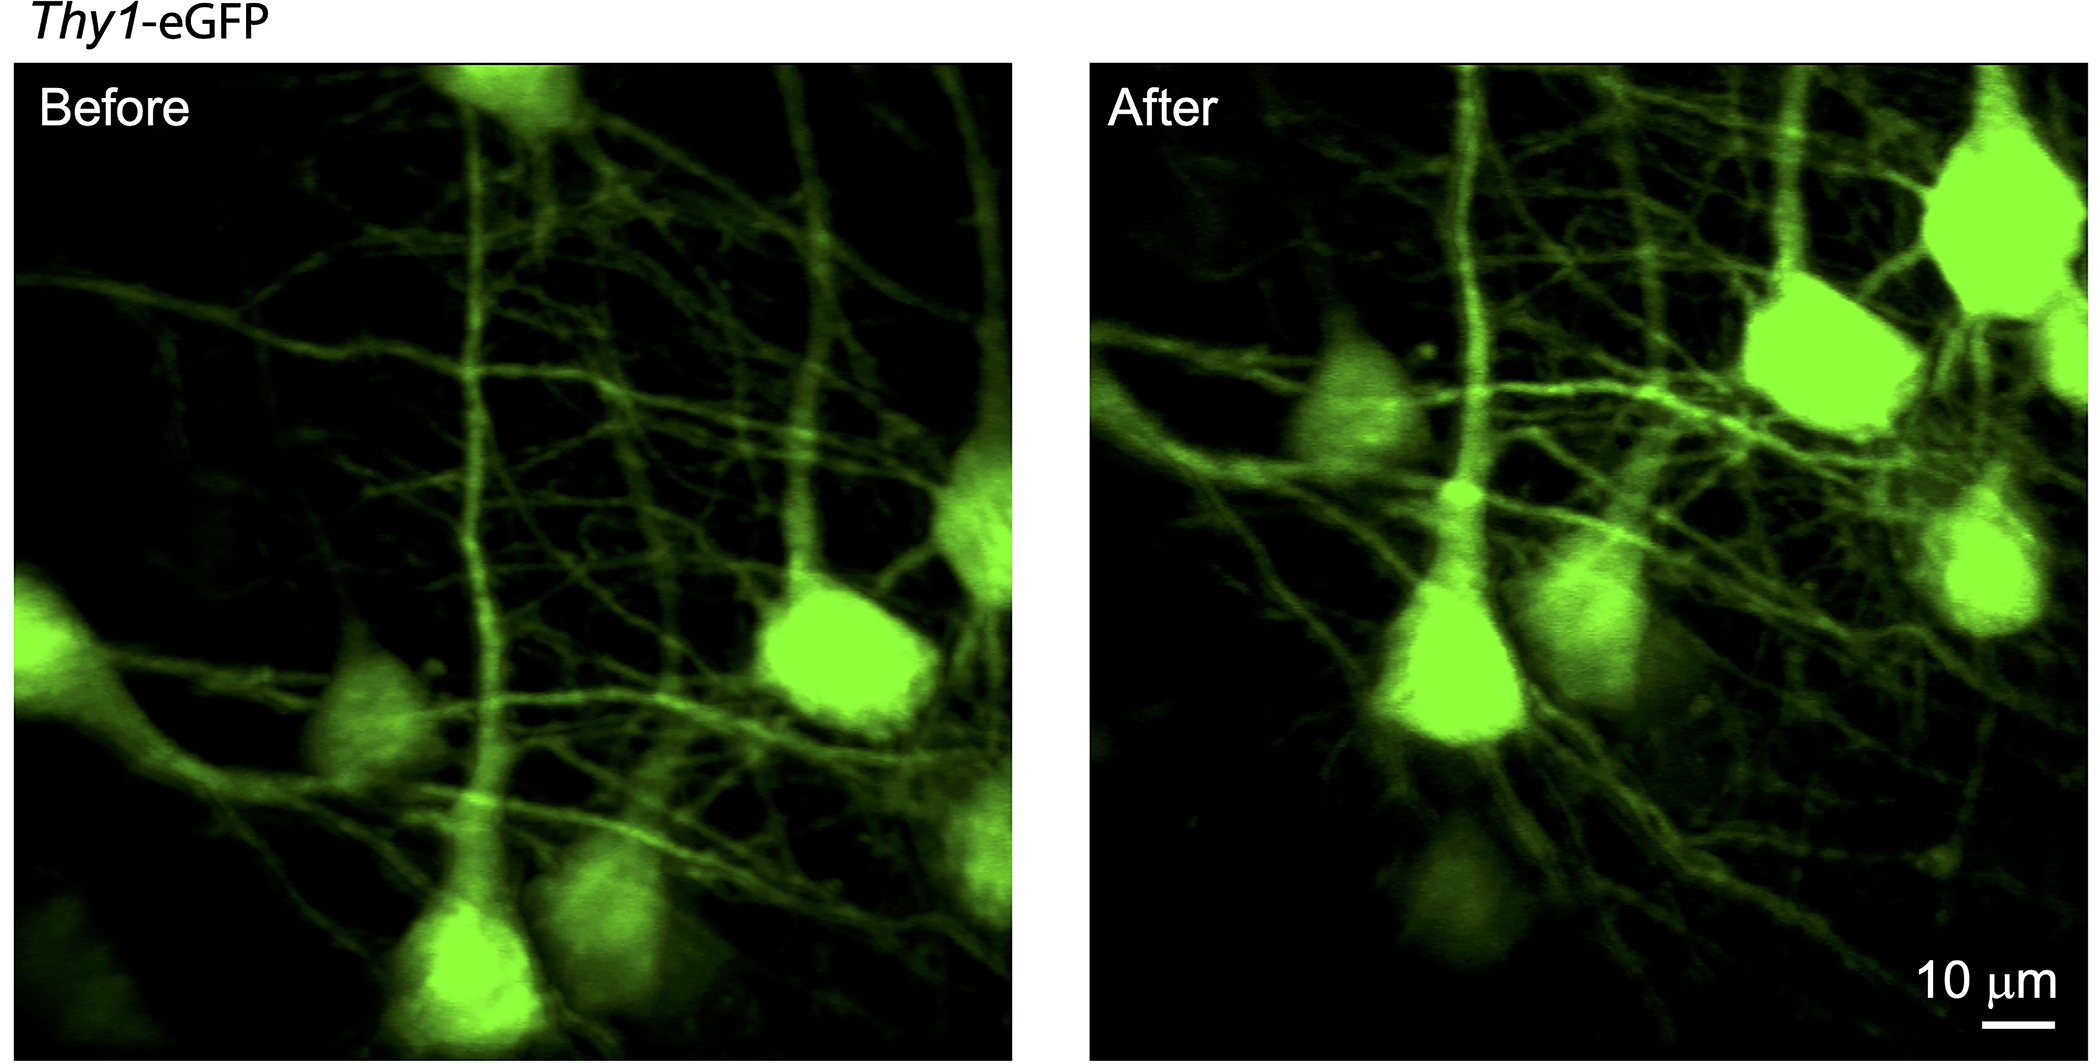
To evaluate COMPACT’s performance for in vivo structural imaging, we imaged in the brain of Thy1-eGFP mice at various depths and regions (Fig. 2, Supplementary Fig. 1 and Video 2). We defined the imaging probe’s insertion range and rotation range of interest in the custom control program, which automatically positioned the imaging probe to visit user-defined locations in sequence. At each location, the SLM-controlled defocusing was synchronously coordinated with the galvo scanning to record 3D image stacks. As an example, we show millimeter-scale images acquired from the neocortex and the hippocampus (Fig. 2b–d, Supplementary Fig. 1). Even with the moderate NA employed in this study, we could observe fine neuronal structures. To validate the acquired structural information, we dissected the brain tissue after COMPACT imaging and compared the COMPACT images with the dissected tissue images acquired with a benchtop two-photon microscope (Extended Data Fig. 3 and Supplementary Video 3). The comparison shows that both somas and dendritic structures match well between the images acquired with COMPACT imaging and after dissection.
Figure 2 |. In vivo imaging of neuronal structure at different depths in the Thy1-eGFP mouse brain.
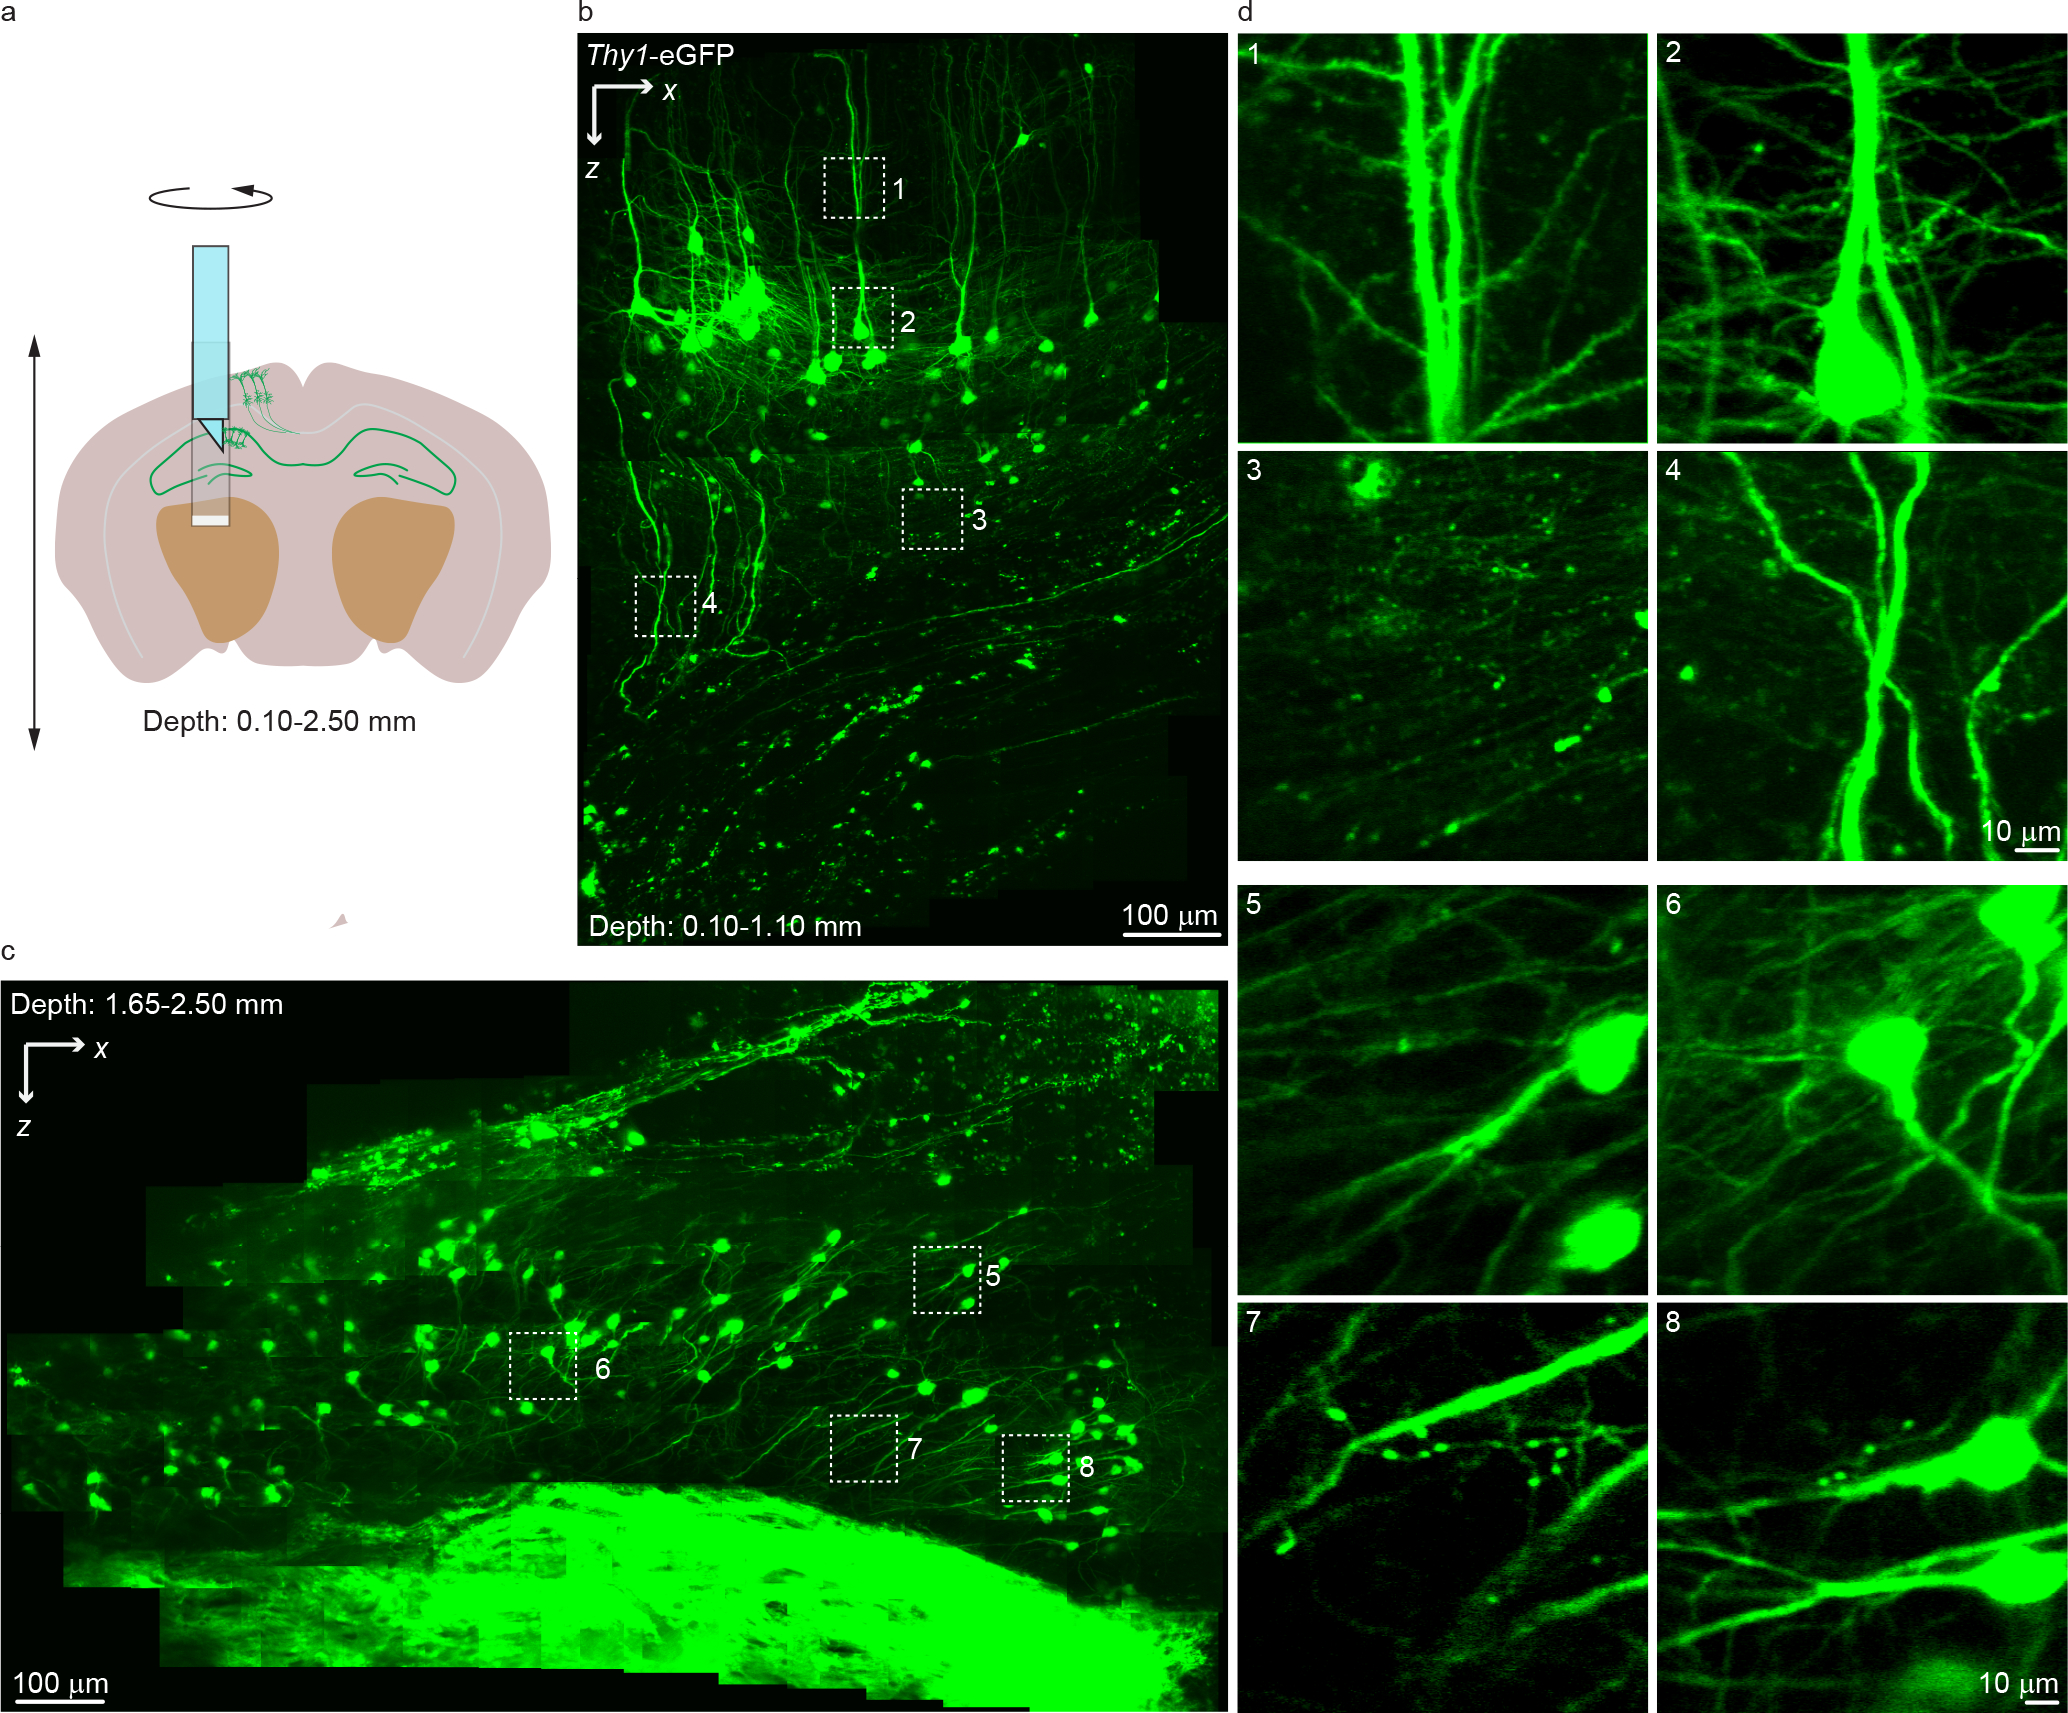
(a) The spatial configuration for the panoramic imaging from the mouse cortex to hippocampus. (b) In vivo imaging of neurons at depths from 0.10 to 1.10 mm in the mouse brain. The image shown is a composite. (c) In vivo imaging of neurons at depths from 1.65 to 2.50 mm in the mouse brain. The image shown is a composite. (d) Zoomed-in views of the indicated areas in b and c. The data were recorded at 1.7 Hz frame rate with ~20 mW laser power. The images shown are the average of five frames. The experiments were repeated on ~20 mice.
COMPACT-enabled calcium imaging
To illustrate COMPACT’s performance during in vivo calcium imaging, we imaged GCaMP6s-expressing neurons in the brain of awake mice (Fig. 3, Supplementary Video 4). After viral transduction with AAV-Syn-GCaMP6s, we surgically inserted the quartz capillary (Extended Data Fig. 4). Four weeks after the surgery, we carried out in vivo imaging in head-fixed awake mice and recorded spontaneous calcium transients deep in the hippocampus (Fig. 3b–f). With two-photon-based imaging, we captured calcium signals with high signal-to-noise ratio (SNR) from both the somata (noise ~6% ΔF/F0) and the dendrites (noise ~10% ΔF/F0) within a ~0.6 mm FOV. These imaging results from awake mice indicate that the COMPACT system is compatible with in vivo calcium signal recording. For broad dissemination, we have also devised a simpler version of COMPACT. Instead of using motorized actuators to set the imaging locations, we employed an alternative method for docking the imaging probe (Extended Data Fig. 5), which is compatible with awake animal studies (Supplementary Video 5).
Figure 3 |. In vivo calcium imaging in the brain of a head-fixed awake mouse.
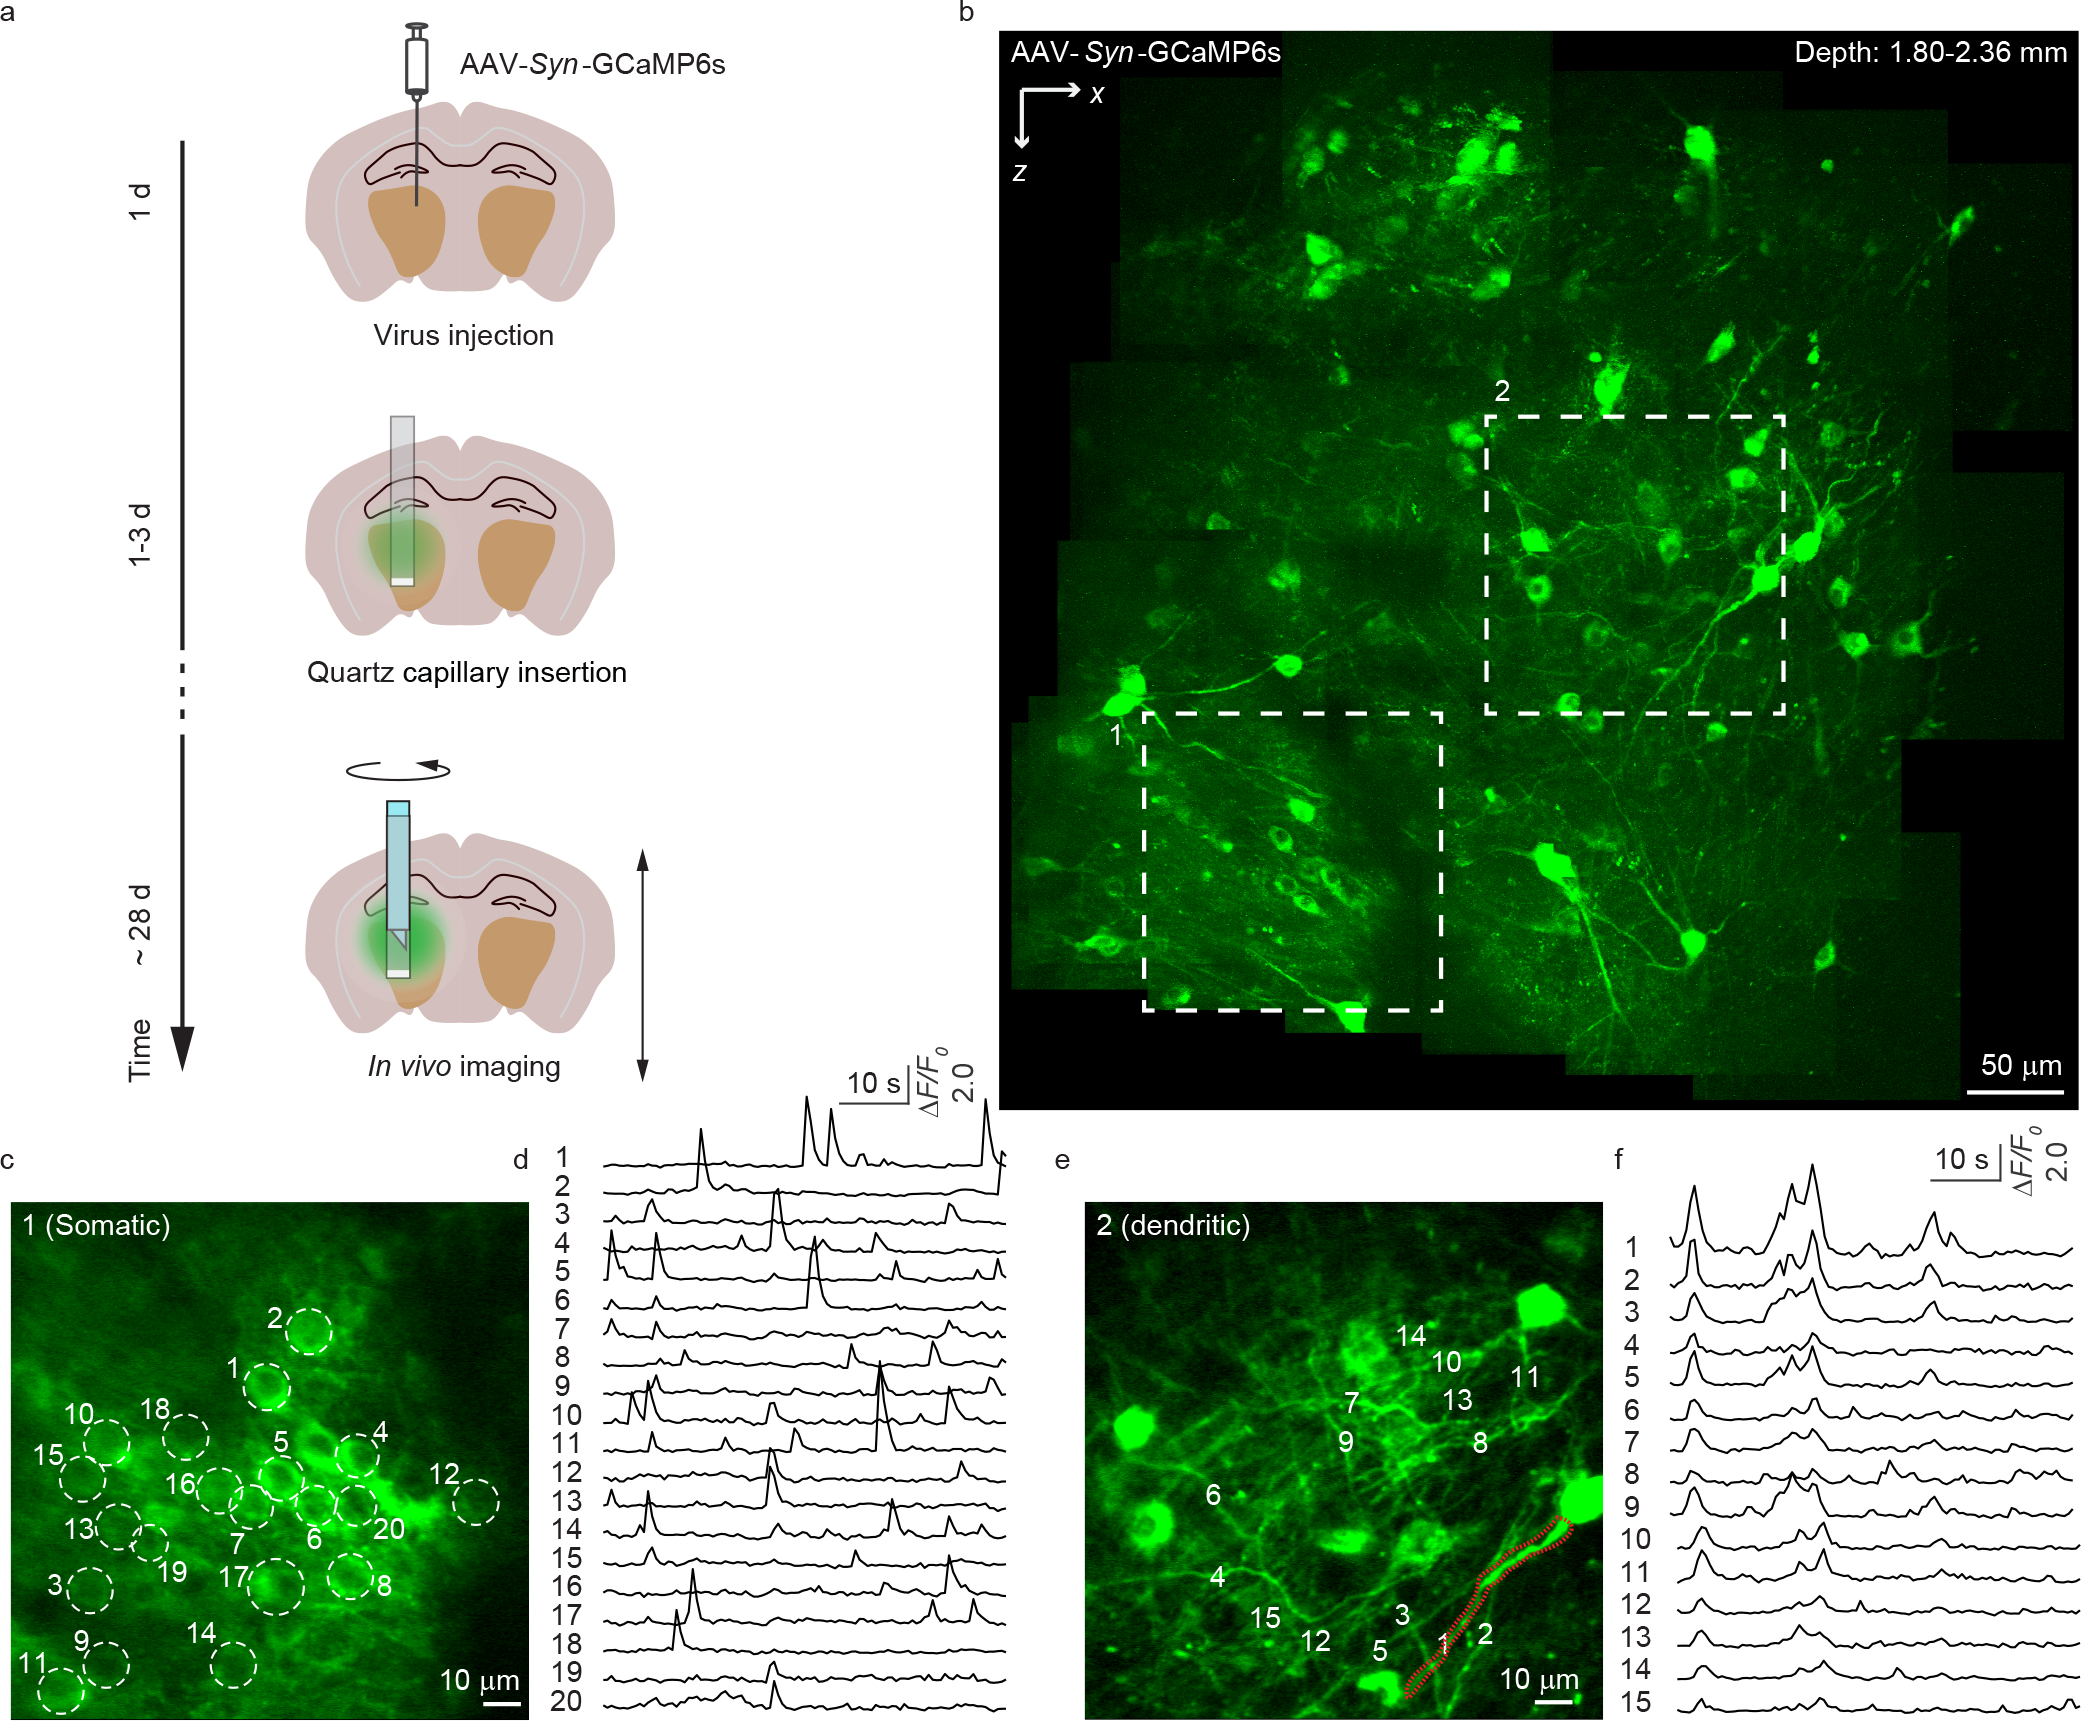
(a) The timeline for virus injection, capillary implantation and in vivo imaging. (b) Structural imaging of GCaMP6s expressing neurons at depths from 1.80 to 2.36 mm in the mouse brain. The image shown is a composite. (c, d) Representative calcium transients from somas of 12 mice. (e, f) Representative calcium transients from dendrites of 12 mice. The images were recorded at 1.7 Hz frame rate with ~28 mW laser power.
As mammalian behaviors often involve neuronal populations from multiple function regions, it is important to survey neuronal activity over large brain volume. Leveraging COMPACT, we performed calcium imaging across multiple regions associated with sleep24 (Fig. 4, Supplementary Video 6). We injected the AAV-Syn-GCaMP6s virus (2 mm posterior and 2 mm lateral from Bregma) and implanted a quartz capillary. After 4 weeks of recovery, we habituated the mice for 5–7 days to sleep under head-restrained conditions. We then employed the two-photon COMPACT system to record neuronal calcium activity while monitoring pupil size to assess the sleep stage25. Each recording session lasted for 20 minutes. When looking for correlations between pupil area and calcium transient (Fig. 4f and h), we found that neurons in the posterior thalamic nuclear (ROI 1 in Fig. 4) were active when the pupil was closed (pupil smaller than 0.15 mm2) and were quiet while the pupil was open (pupil greater than 0.4 mm2). A statistical analysis showed that neuronal activity and pupil area exhibited a negative correlation (Fig. 4j and k). For comparison, we translated the imaging probe upward by ~ 1 mm and recorded calcium transients from neurons in dentate gyrus (ROI 2 in Fig. 4). We observed slight calcium activity when pupils were closed or open. However, during the transition from closed to open pupils, the neuronal populations showed synchronized calcium activity (Fig. 4g and i). A statistical analysis (Fig. 4l and 4m) did not reveal any correlations similar to those we observed in neurons of ROI1. As the COMPACT system allows imaging repeatedly (Extended Data Fig. 6), we observed calcium activity of ROI 1 and 2 neurons for two consecutive days during four imaging sessions per day, and we performed similar imaging experiments in the thalamic region with six mice. Furthermore, we combined electromyography (EMG) and electroencephalography (EEG) with COMPACT to assess the sleep state during calcium imaging, which also revealed distinct neuronal responses in different brain regions (Extended Data Fig. 7, Supplementary Fig. 2).
Figure 4 |. Neurons in different regions showed distinct activity associated with sleep.
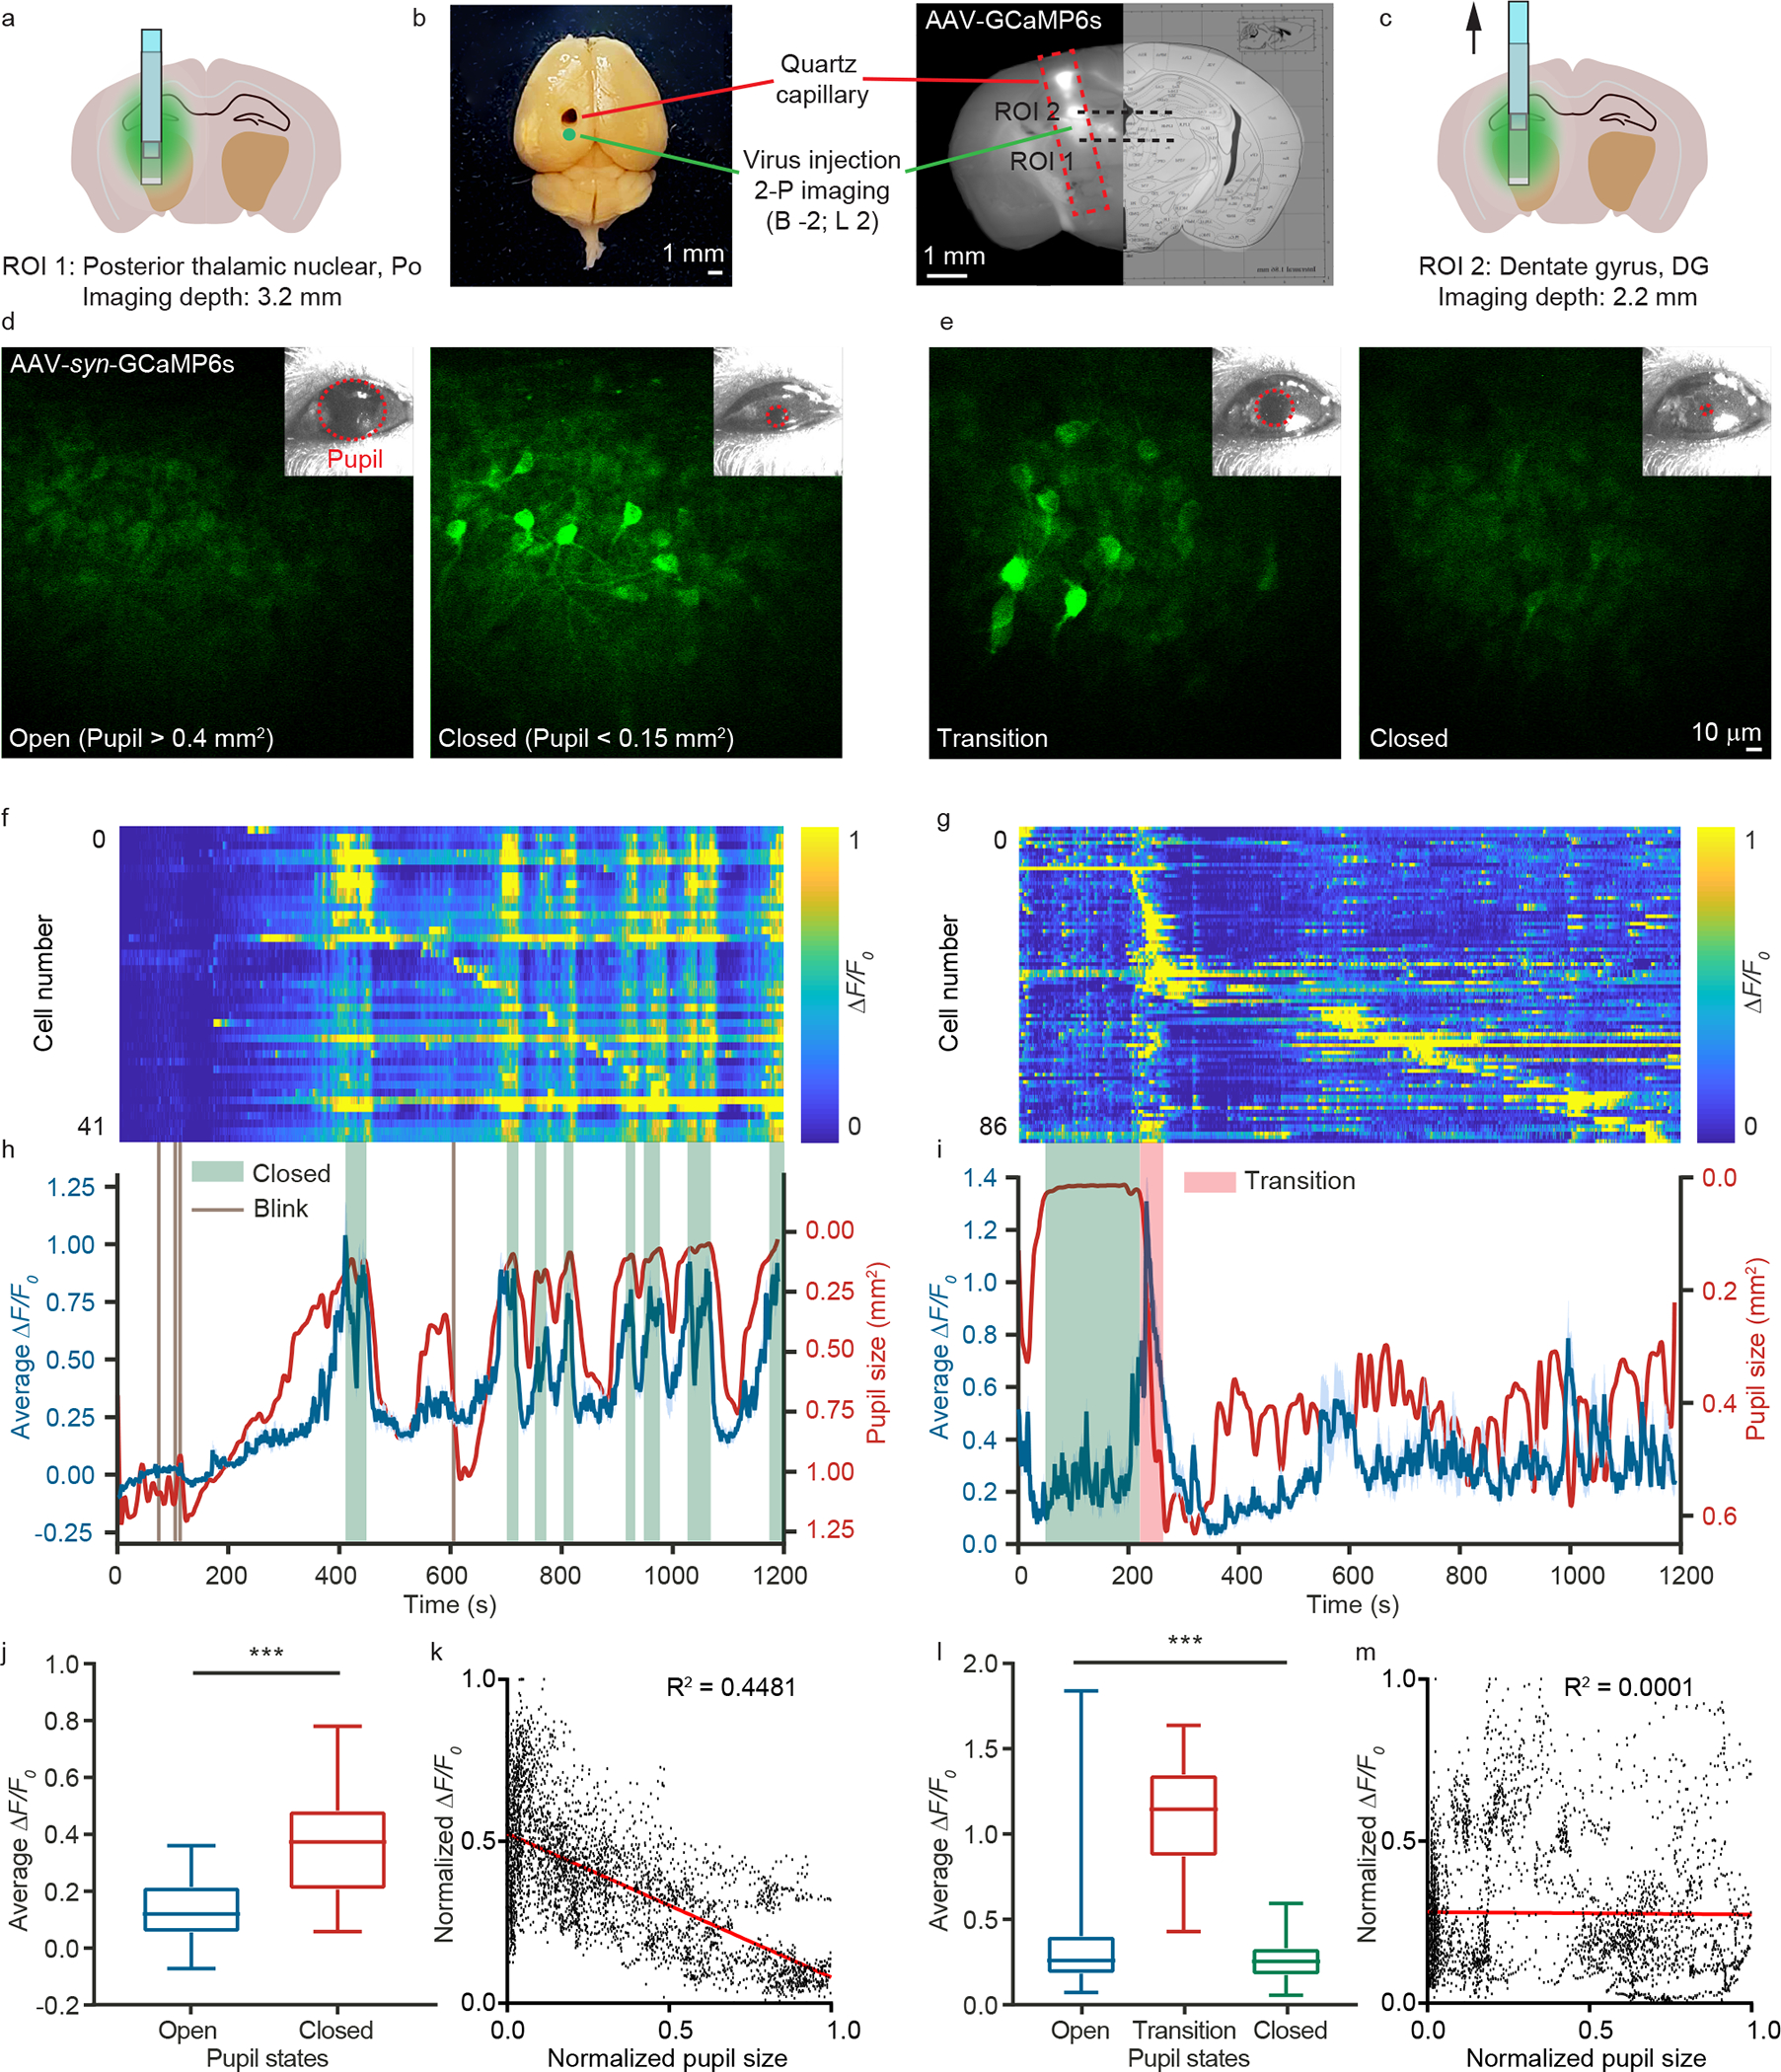
(a) Position of ROI 1 (posterior thalamic nuclear). The depth is 3.2 mm. (b) Images of a whole brain and a brain slice after dissection. Scale bar: 1 mm. (c) Position of ROI 2 (dentate gyrus). The depth is 2.2 mm. (d, e) Representative images showing the calcium activity of neurons in ROI 1 and 2, respectively, while pupils were open or closed. The images were recorded at 0.84 Hz frame rate with ~28 mW laser power. The insets show the images of the pupil recorded simultaneously with calcium imaging. (f, g) The calcium transients of individual neurons over 20 minutes sorted by firing time in ROI 1 and 2, respectively. (h, i) The average ΔF/F0 (blue) and the pupil area (red) in ROI 1 and 2, respectively. The green boxes indicate the time windows when the pupil area was smaller than 0.15 mm2, and the red box indicates the time window of transitioning from closed to open pupils. (j) The average calcium transients of neurons in ROI 1 for closed and open pupils (n = 159, 138, unpaired t test, P = 2.1 × 10−139). (k) Correlation analysis between calcium transient in ROI 1 and pupil area (n = 4000; total recording time, 80 mins). (l) The average calcium transients of neurons in ROI 2 for open pupil, transition, and closed pupil (n = 191, 155, 256, one-way ANOVA Tukey’s multiple comparison test, P = 8.1 × 10−103 ). (m) Correlation analysis between calcium transients in ROI 2 and pupil area (n = 4000; total recording time, 80 mins). Data are mean ± SEM in j and l, and *** denotes P < 0.001. The experiments were repeated on ~18 mice.
Discussion
Compared to common miniature imaging probe-based calcium recording, the key advantage of COMPACT is its tissue access volume and adaptability. With a 1 mm diameter GRIN lens probe, the conventional method can typically deliver a ~0.2 mm diameter high-quality two-photon FOV and image up to ~0.3 mm below the device, yielding a tissue access volume of 0.009 mm3. In comparison, with the same insertion diameter, COMPACT allows a circular FOV of ~5 mm. Assuming that the translation path along the capillary is 3 mm, COMPACT offers a tissue access volume of ~4 mm3, which is near three orders of magnitude greater than that of conventional methods. Such an increase in access volume provides flexibility to explore the neurons of interest and therefore increases the success rate of finding relevant neurons and the overall experimental throughput. In addition, the capillary allows to easily switch out the imaging probe while visiting the same population of neurons. For example, we could switch between probes of different NA and trade off between imaging throughput and spatial resolution, similar to switching objective lenses under a conventional microscope. Alternatively, we could switch between one-photon wide-field recording and two-photon imaging to trade off between imaging throughput and imaging depth. An additional benefit of COMPACT is that imaging probes can be re-used and moved from one animal to another animal as only quartz capillaries are directly inserted into the brain tissue. A limitation of the present implementation of COMPACT is that the calcium imaging was recorded in one area at a time. For near-simultaneous imaging over multiple areas, faster probe rotation and translation will be required. We expect that further miniaturization and increases in imaging speed will make COMPACT suitable for different animal models.
Methods
The research work complied with all relevant ethical regulations and all procedures involving mice were approved by the Animal Care and Use Committees of Purdue University.
Animals
Wild-type (WT) C57BL/6 mice (for virus injection), transgenic Thy1-eGFP mice (M line), Thy1-YFP mice (H line), and Cx3cr1-eGFP mice were purchased from the Jackson Laboratories. AAV.Syn.GCaMP6s.WPRE.SV40 was purchased from Addgene. Mice were housed at the Bindley Bioscience Center Animal Facility at Purdue University. The surgical procedures were performed on two to three month old male and female mice. See Supplementary Table 1 for the strain, age, number, and sex of the mice used in each experiment.
Motorized capillary insertion
To make COMPACT-based imaging robust and reproducible, we developed a motorized capillary insertion procedure (Extended Data Fig. 4). With the goal of imaging head-fixed animals, we first attached the head-bar to the skull. Using a dental drill, we carefully removed the skull near the middle of the head-bar above the insertion spot. Next, we used a computer-controlled motorized actuator (Z825, Thorlabs) to gradually insert an open-end 15 μm thin quartz capillary into the brain tissue at 10 μm/sec insertion speed. The 15 μm thin quartz wall is thinner than a common razor edge, which allows it to easily glide inside the tissue. After the capillary reached the desired depth, we employed a 3-axis precision linear stage (461-XYZ-M, Newport) to position a thin needle (24G, BD) connected to a vacuum pump to remove the tissue inside the capillary. Then, we reversed the motion of the motorized actuator that held the capillary and moved it out of the brain at 10 μm/sec speed. Next, we loaded a new 15 μm thin quartz capillary whose bottom was sealed with a tiny amount of epoxy inside the injection guiding chamber. The chamber was formed by the glass capillary and piston rod utilized inside transfer pipettes (BR701932, BRAND). Again, we utilized a motorized actuator to push the piston down at 10 μm/sec speed. During the whole insertion process, we constantly flushed the area with artificial cerebrospinal fluid (ACSF) to avoid bleeding. After the quartz capillary reached the desired depth, we applied silicone adhesive (KWIK-SIL, WPI) to seal the skull opening and fixed the quartz capillary position using dental cement (Contemporary Ortho-Jet™ Powder and Liquid, Lang Dental). Typically, the imaging experiment was performed ~4 weeks after this insertion process. To protect the capillary from dust, we put a plastic cap on the top of the head-bar, which was designed to match the cap diameter. The 15 μm thin quartz capillary was strong enough to handle brain motion. During the ~4 weeks of recovery, the mice were free to move and engage in routine activity. None of the implanted capillaries was affected by these activities.
In the common GRIN lens implementations26, a needle was first inserted into the brain tissue to create an opening, which was followed by the insertion of the imaging GRIN lens. Due to the tear and compression, the boundary between the brain tissue and the GRIN lens bottom is often not well controlled, which may lead to substantial tissue damage near the boundary. In comparison (Supplementary Fig. 3a–f), COMPACT achieved a clean tissue boundary through the insertion of the 15 μm thin open-end capillary. The microglia morphology recorded by the two-photon imaging of Cx3cr1-eGFP mouse brain (Supplementary Fig. 3g–i) also revealed such differences.
Imaging probe bonding
The imaging probe is the combination of a high refractive index (N-LASF31) right-angle micro prism and a 1 mm diameter GRIN lens (0.98 pitch, Gofoton). To mount the probe onto the rotary stage, we fabricated a round holder (Supplementary Fig. 4a). To attach the probe onto the holder, we utilized a 2-axis translation stage to support the probe. We adjusted the position of the probe under a stereoscope such that its center was well aligned with the round opening on the holder. Then we pushed the translation stage along the cage rods so that the entrance facet of the GRIN lens went through the round opening (Supplementary Fig. 4b). We applied a tiny amount of UV epoxy to the gap between the GRIN lens and the round opening and cured the epoxy.
Imaging probe alignment
To form a 360-degree panoramic view around the optical channel, we need to spin the imaging probe, which requires precision alignment of the probe such that its axis is aligned with the rotary stage axis. Using two orthogonal machine vision cameras (DMK 23UX249, The Imaging Source), we recorded 12 images of the probe on each camera during a 360-degree rotation controlled by the rotary stage (DT-80, PI). Using computation edge detection, we numerically determined the two edges of the probe. The average of the 24 edges from the 12 images revealed the true rotation axis of the rotary stage. With the assistance of these two cameras, we used micrometers (KL02, Thorlabs) to move the probe holder slightly such that the probe’s axis was right on the rotation axis, and then tightened the machine screws that attached the probe holder onto the rotary stage.
The capillary inside the mouse brain also needs to be aligned with the rotation axis. As the capillary is buried inside brain tissue, we utilized a downward imaging camera (camera 3 in Extended Data Fig. 1) equipped with a telecentric lens for the capillary alignment. An important step is that we need to transfer the previously measured rotation axis onto the imaging axis of camera 3. We first positioned a glass capillary within the view of cameras 1 and 2. We oriented the capillary such that its axis overlapped with the rotation axis. Next, we translated the capillary along an optical stainless steel rail (x26–512, Newport) to be under camera 3. We adjusted the orientation of camera 3 such that its imaging axis was aligned with the capillary axis. Through this process, we mapped the rotation axis recorded by cameras 1 and 2 onto the imaging axis of camera 3. For daily in vivo imaging experiments, we just need to position the mouse under camera 3 and align the capillary to the imaging axis (Extended Data Fig. 1c, 1d). To insert the imaging probe inside the capillary, we utilized cameras 1 and 2 to center the opening of the capillary with respect to the rotation axis and moved the capillary upward along the axis using a motorized stage (VP-25XL-XYZR, Newport) that held the mouse head-bar.
Alternative probe holding method
For broad dissemination, we developed an alternative method for holding the imaging probe (Extended Data Fig. 5). Instead of firmly holding the probe using motorized actuators, we utilized a docking mechanism. We attached an O-ring onto the probe at the desired location and dropped the probe inside the capillary. The friction of the O-ring was sufficient to hold the probe and allowed it to move with the capillary. To assist the releasing of the probe, we utilized a finite element analysis tool (Autodesk Inventor) to design and utilized wire electrical discharge machining to fabricate a flexure structure based probe holder (Extended Data Fig. 5c), which allowed holding and releasing the probe with a compact frame.
Optical system calibration
The propagation of light through the ~1 pitch GRIN lens and the high refractive index prism all introduced spherical aberration. We utilized the SLM (X10468, Hamamatsu) in the imaging system to compensate for it. The most straightforward wavefront measurement is interferometry, especially off-axis holography27, which demands a long coherence length. We used an optical grating to couple the output of the femtosecond laser (Coherent Discovery) into a single-mode fiber (Supplementary Fig. 5a). This step reduced the spectral bandwidth and thus led to longer coherence length needed for the off-axis holography. First, we utilized off-axis holography to record the phase profile at the pupil plane (Supplementary Fig. 5b). Next, we commanded the SLM pixels to change phase. Through this process, we determined the relationship between the SLM’s pixel and the hologram recording camera’s pixel. We then displayed the reversed phase on the SLM to compensate for the aberration. The aberration of the reference beam is not negligible. To fully eliminate the residual aberrations, we utilized a self-reference measurement method (Supplementary Fig. 5c), named IMPACT28, for wavefront measurement (Supplementary Fig. 5d). Finally, the combined wavefront (Supplementary Fig. 5e) was applied to the SLM to compensate for the system aberration.
Data availability
The imaging datasets generated during and/or analyzed during the current study are available at https://doi.org/10.5281/zenodo.4792757 and https://doi.org/10.5281/zenodo.481433029. Source data for Figures 3 and 4 and Extended Data Figure 7 are available with this paper.
Code availability
The codes employed in the measurement and data analysis are available at https://10.5281/zenodo.5047100
Statistics
All the data in this study are represented as mean ± standard error. The one-way ANOVA Tukey’s multiple comparisons test was selected for comparing multiple groups. P < 0.05 is recognized as statistically significant. All statistical analyses were performed using GraphPad Prism (8.0.2). No results of the successful acquisition from images and measurements were excluded and filtered. The experiment did not include randomized and blinding experiments. P values, n, and the statistical tests were shown in the figure legends.
Extended Data
Extended Data Fig. 1. Procedure for imaging probe alignment.
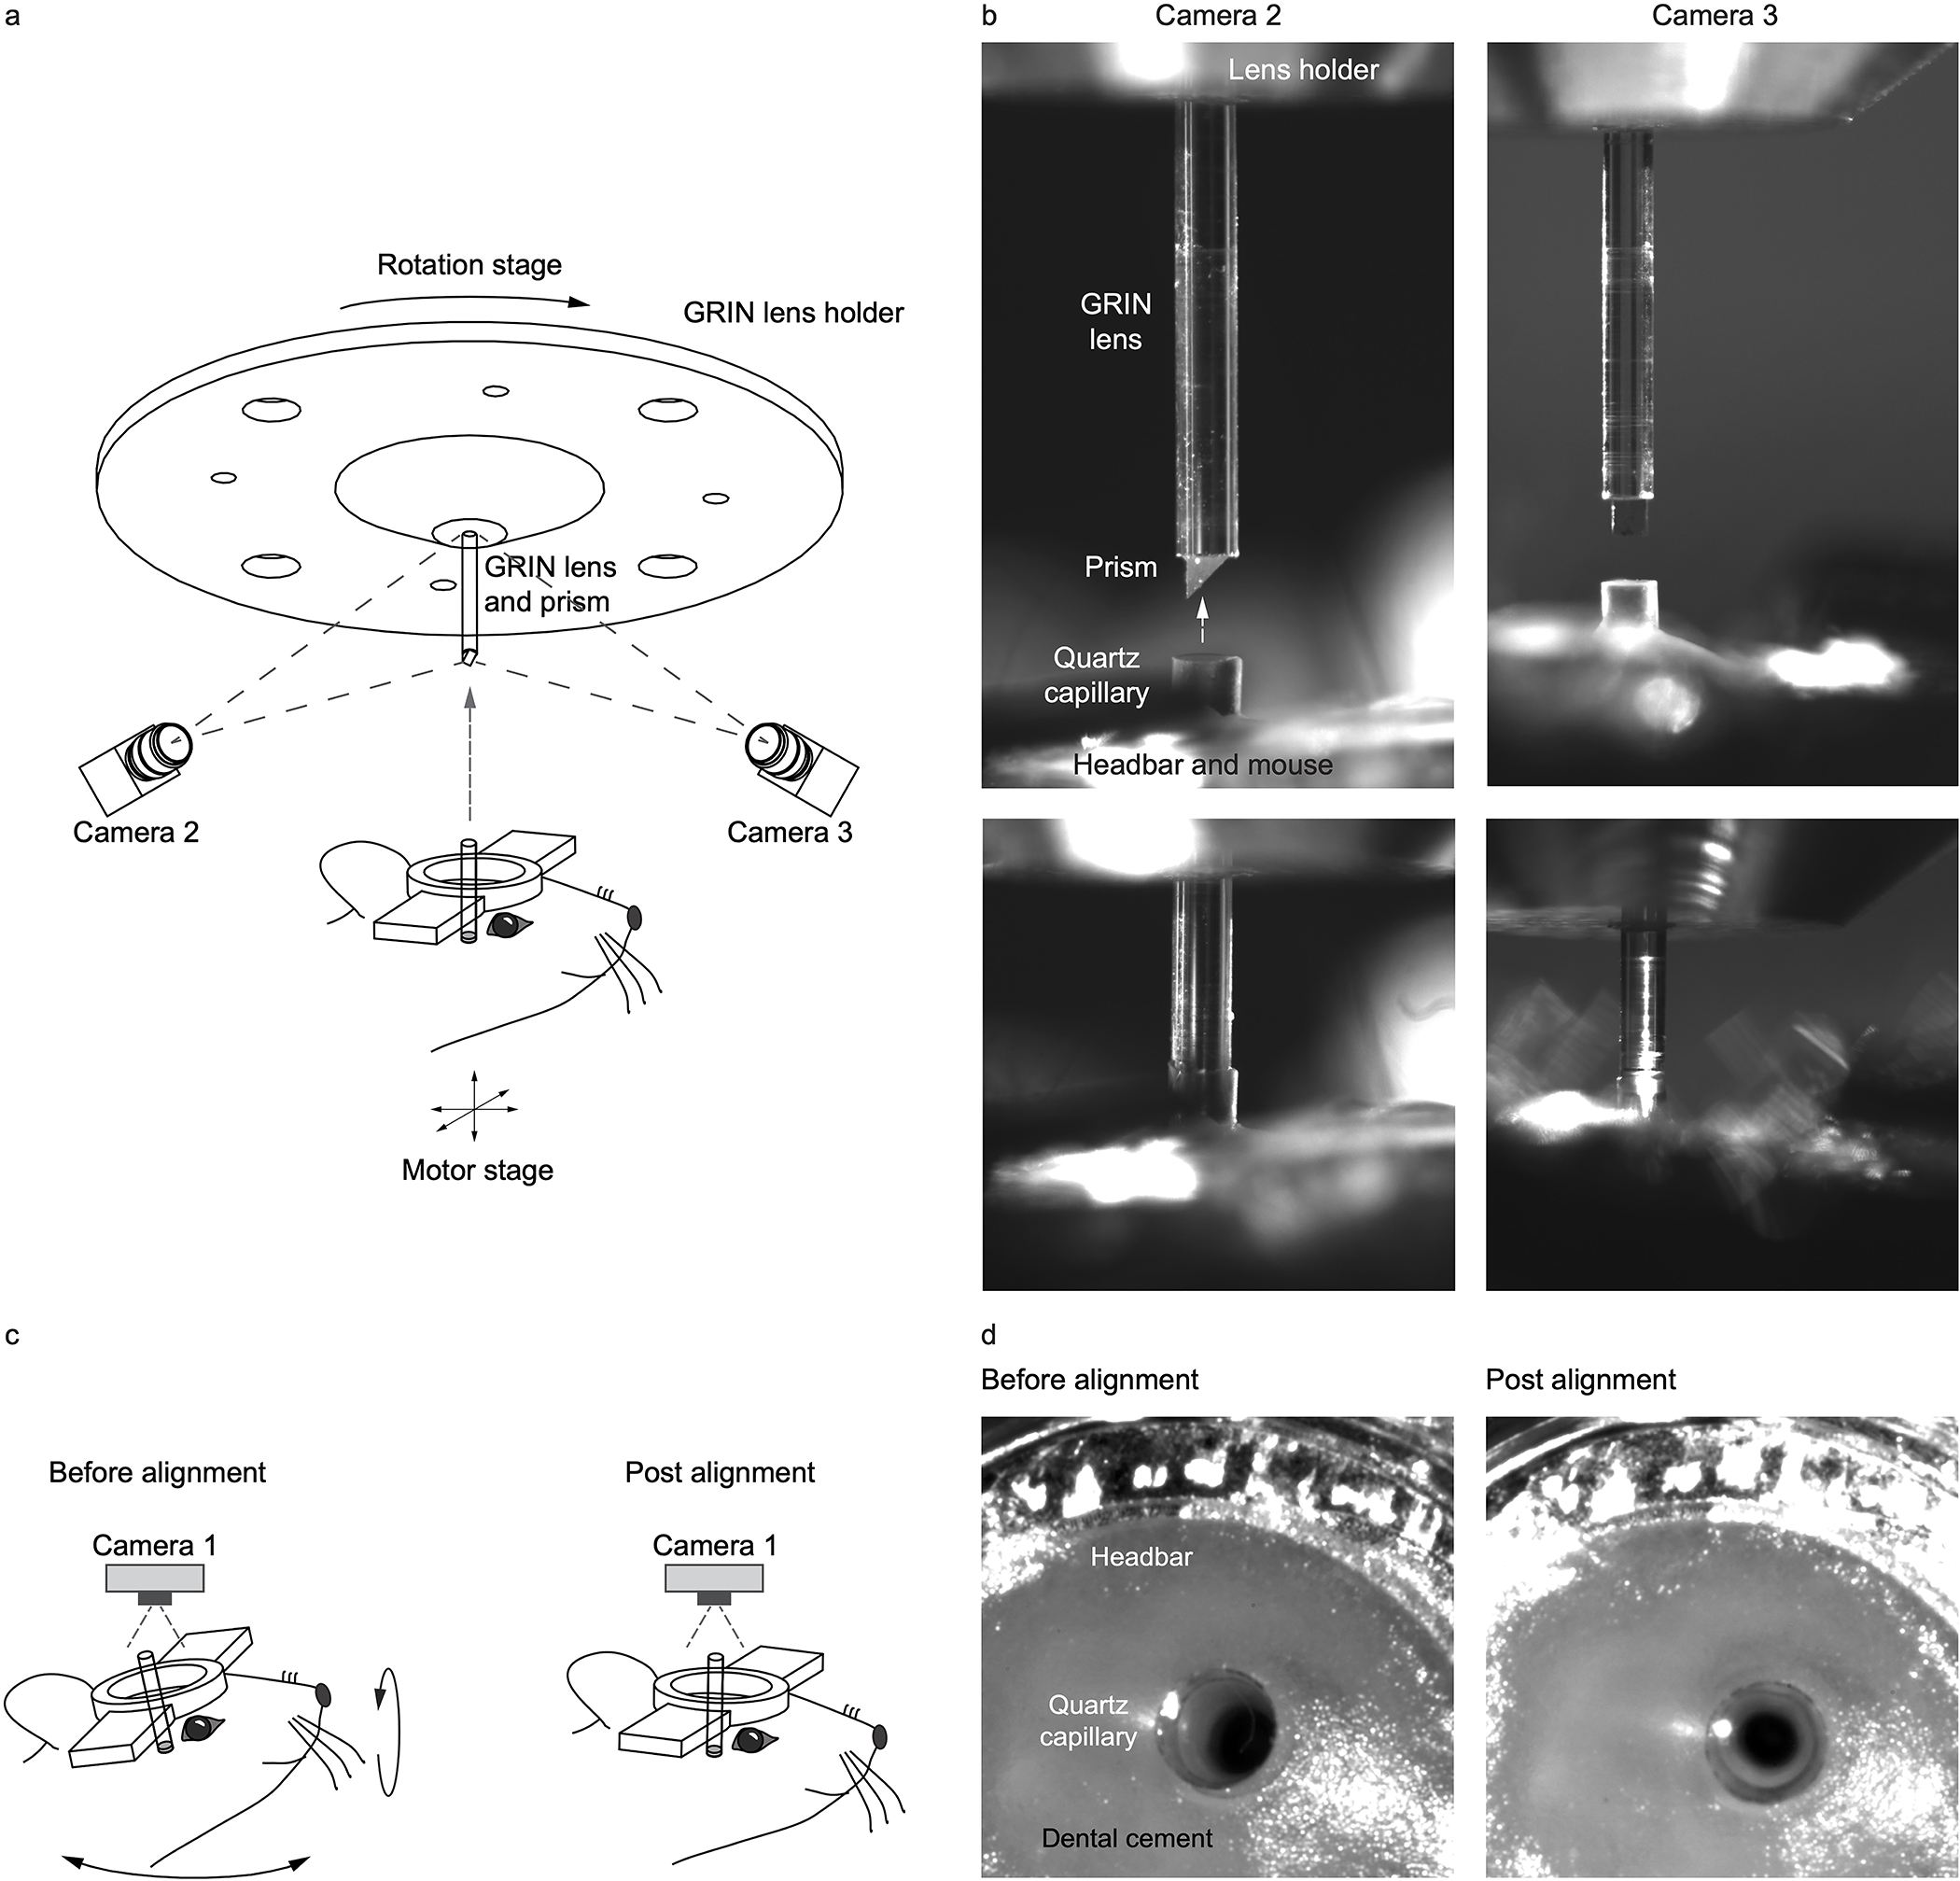
(a) Optical setup for probe alignment. (b) Images from camera 1 and 2. (c) Capillary alignment. (d) Top view of the capillary.
Extended Data Fig. 2. High-resolution compound probe for two-photon COMPACT imaging.
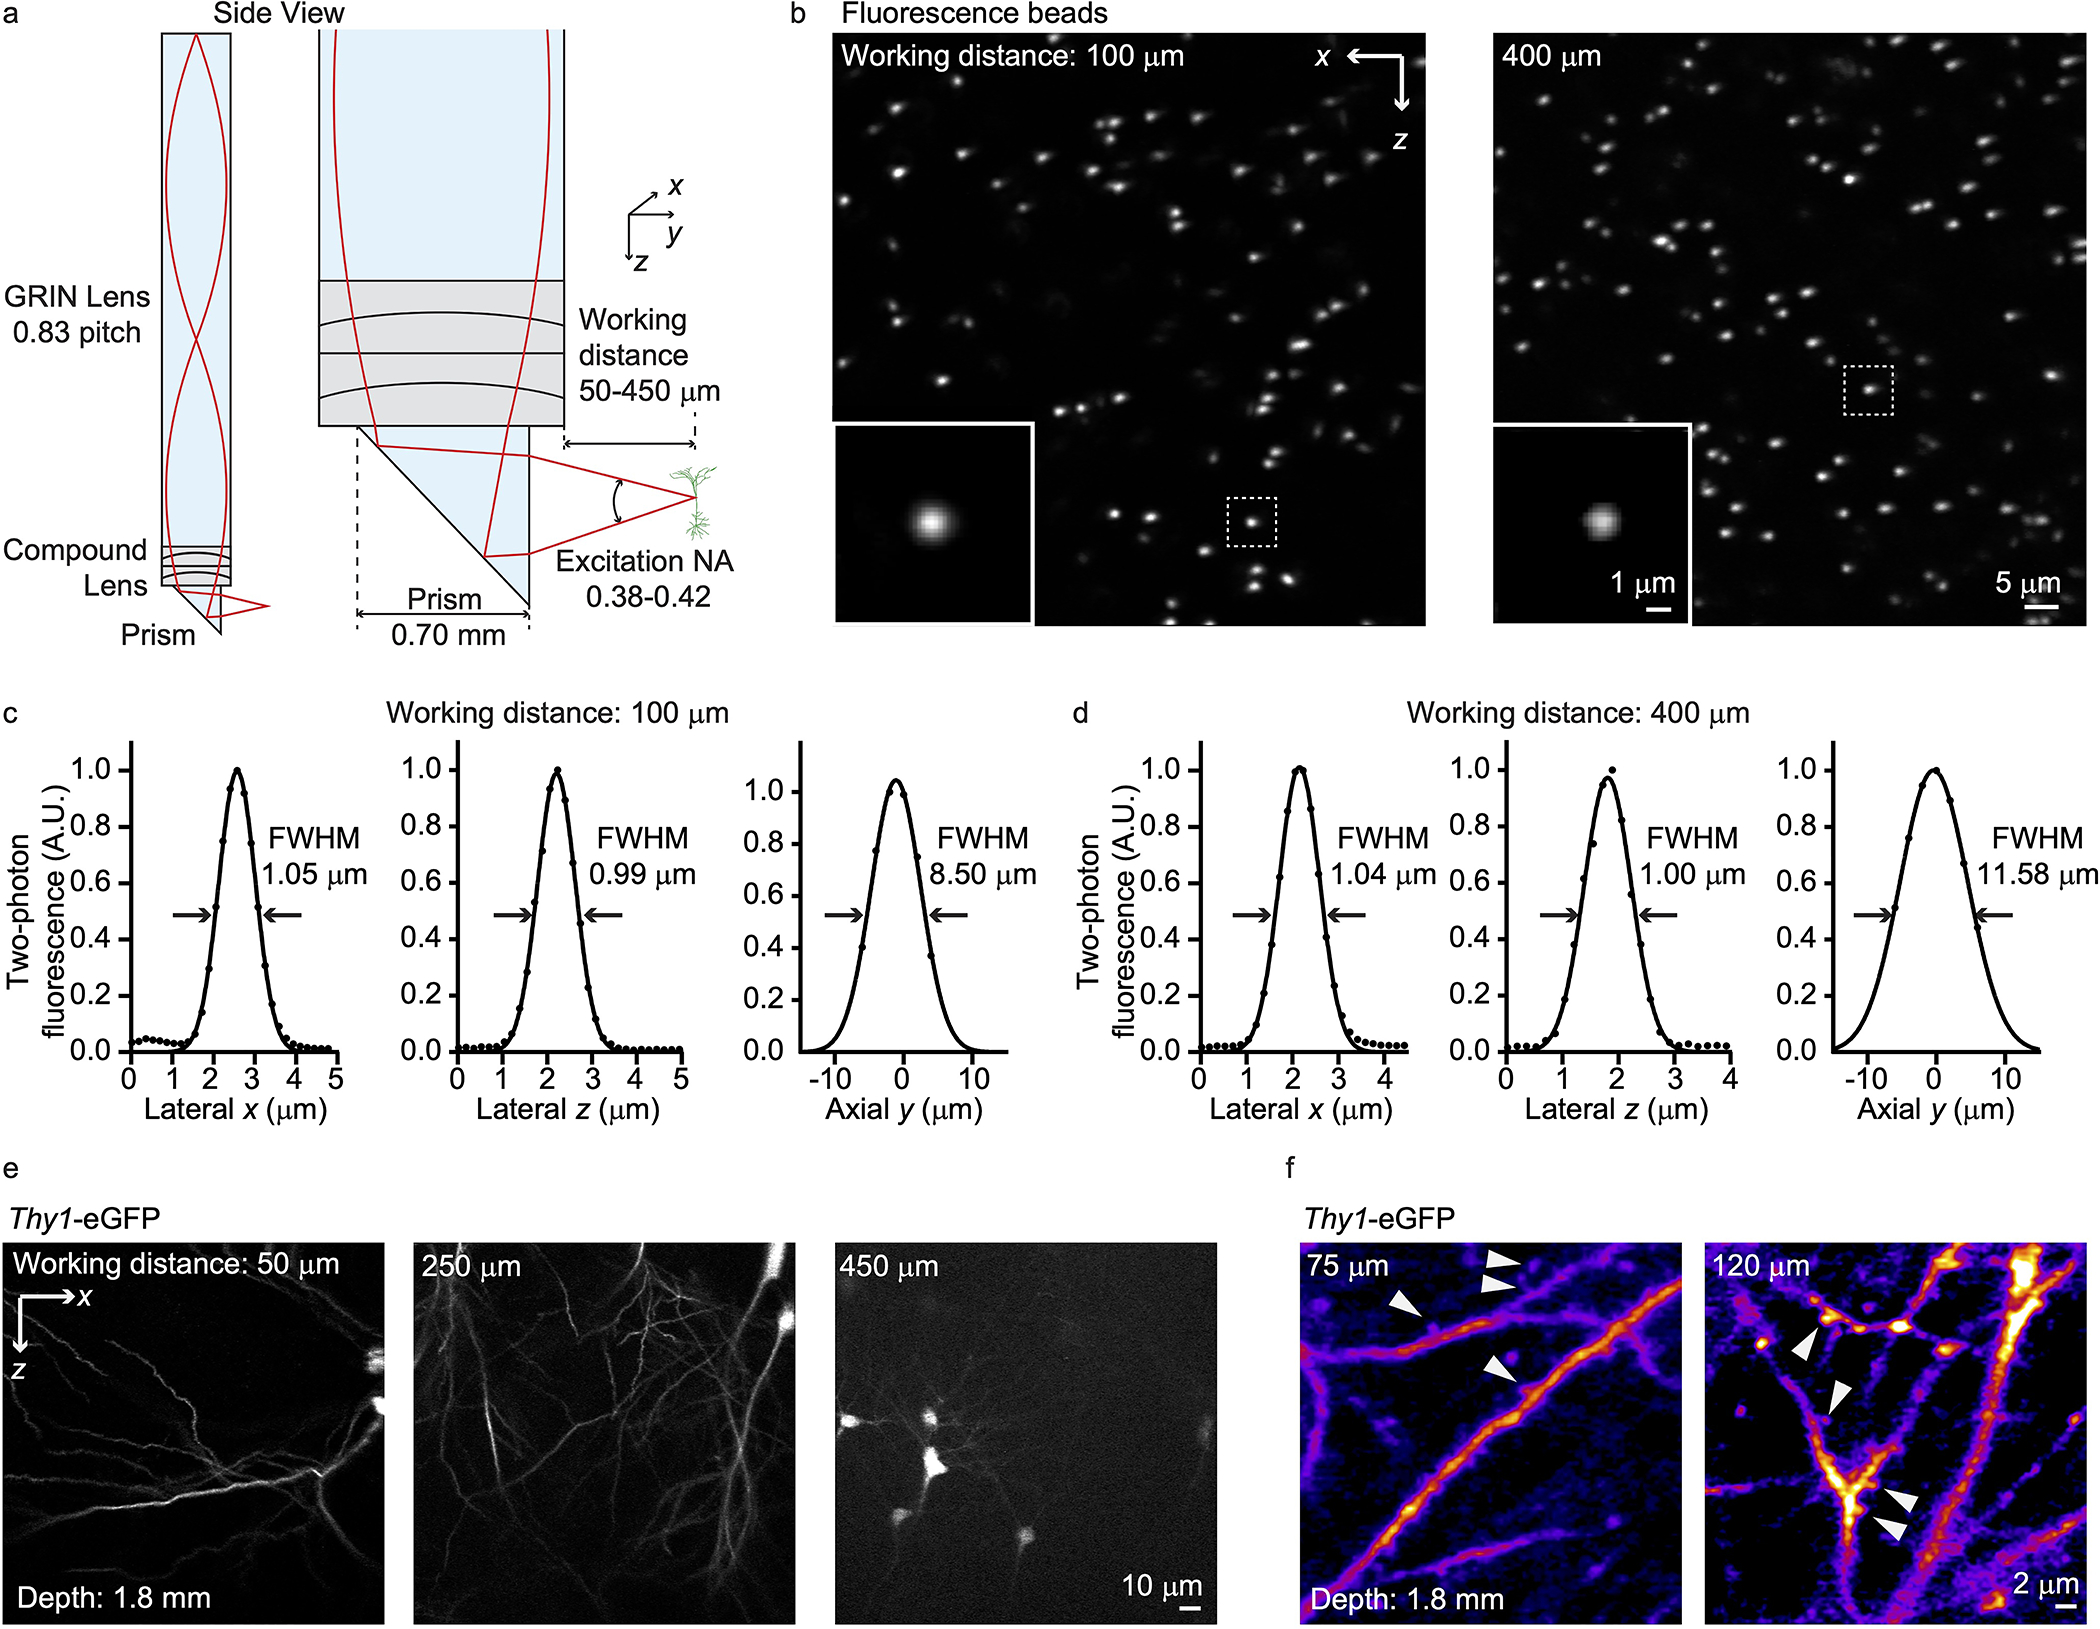
(a) Compound lens configuration. (b) Two-photon imaging of 0.5 μm fluorescence beads. (c, d) The imaging point spread function for imaging 100 and 400 μm outside the capillary, respectively. (e) Two-photon imaging of Thy1-eGFP mouse brain with an imaging depth of 1.8 mm. The maximum working distance reached 450 μm. (f) Neuronal structures at the indicated working distances.
Extended Data Fig. 3. Comparison of COMPACT imaging and dissected tissue imaging in Thy1-eGFP mouse brain.
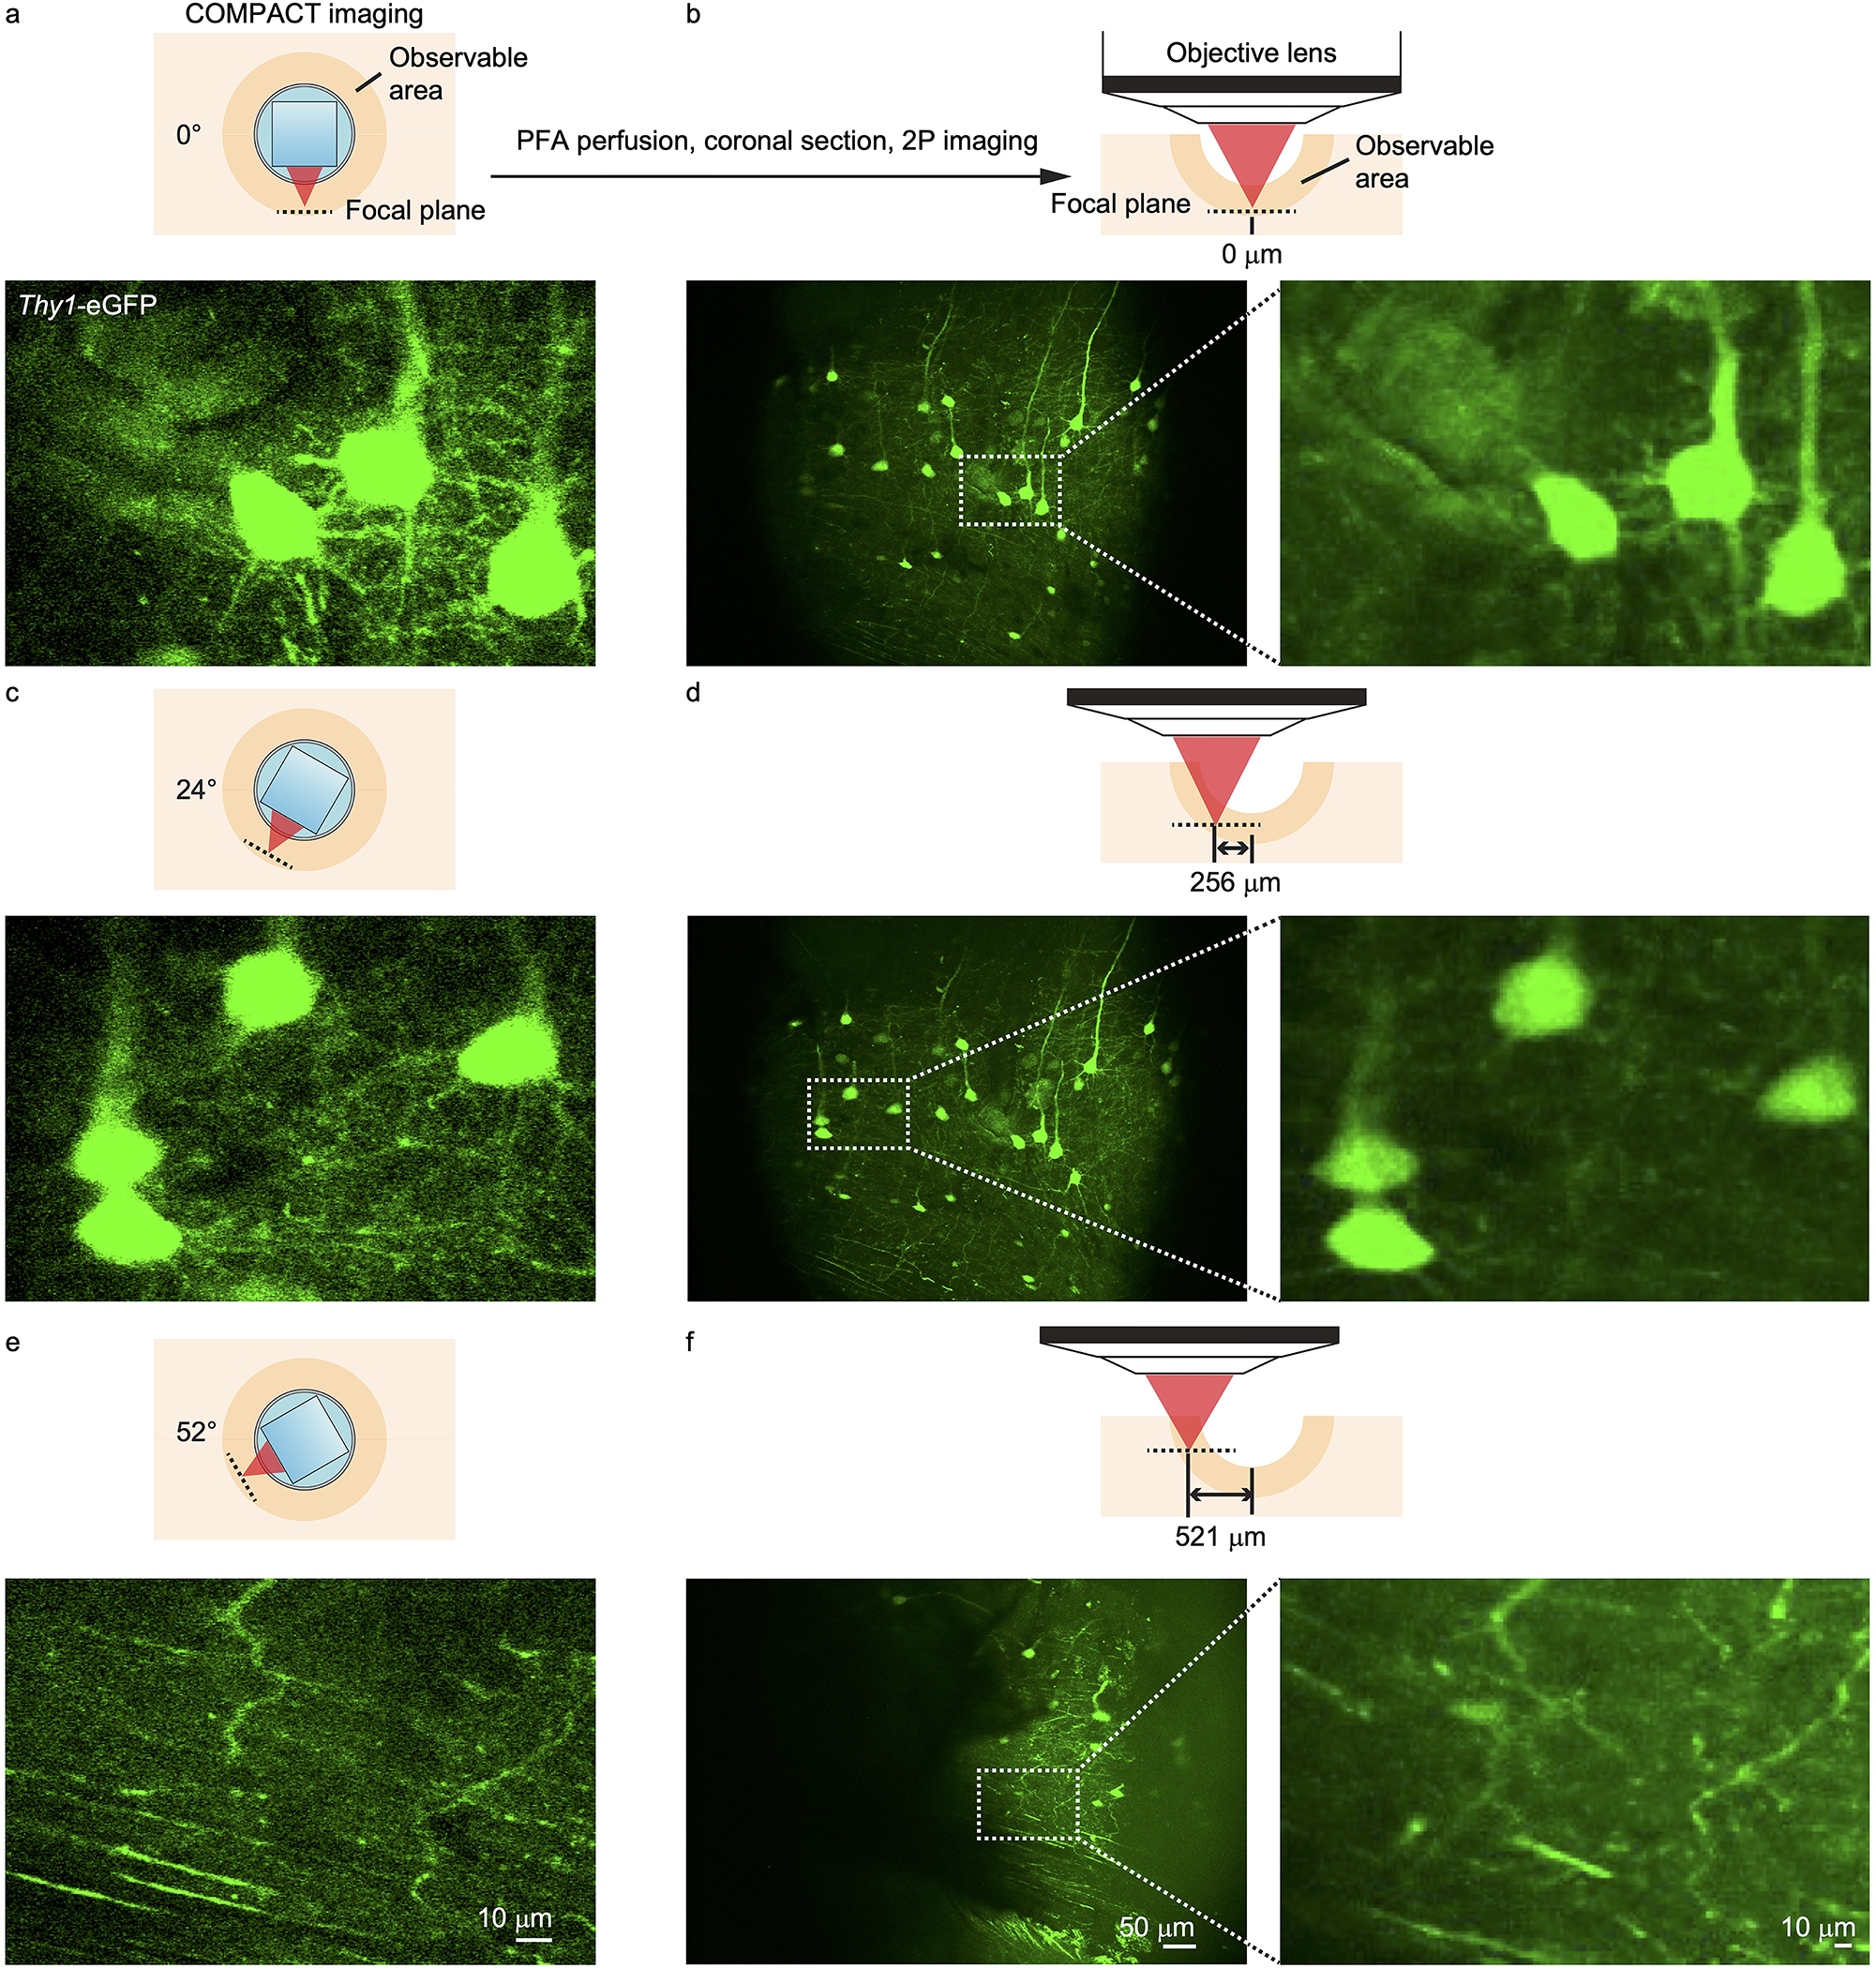
(a, b) Image comparison for the bottom of the imaging volume (COMPACT probe at 0 degree). (c, d) Comparison for the region at which the COMPACT probe was at 24 degree. (e, f) Comparison for the region at which the COMPACT probe was at 52 degree.
Extended Data Fig. 4. Surgical procedure for capillary implantation.
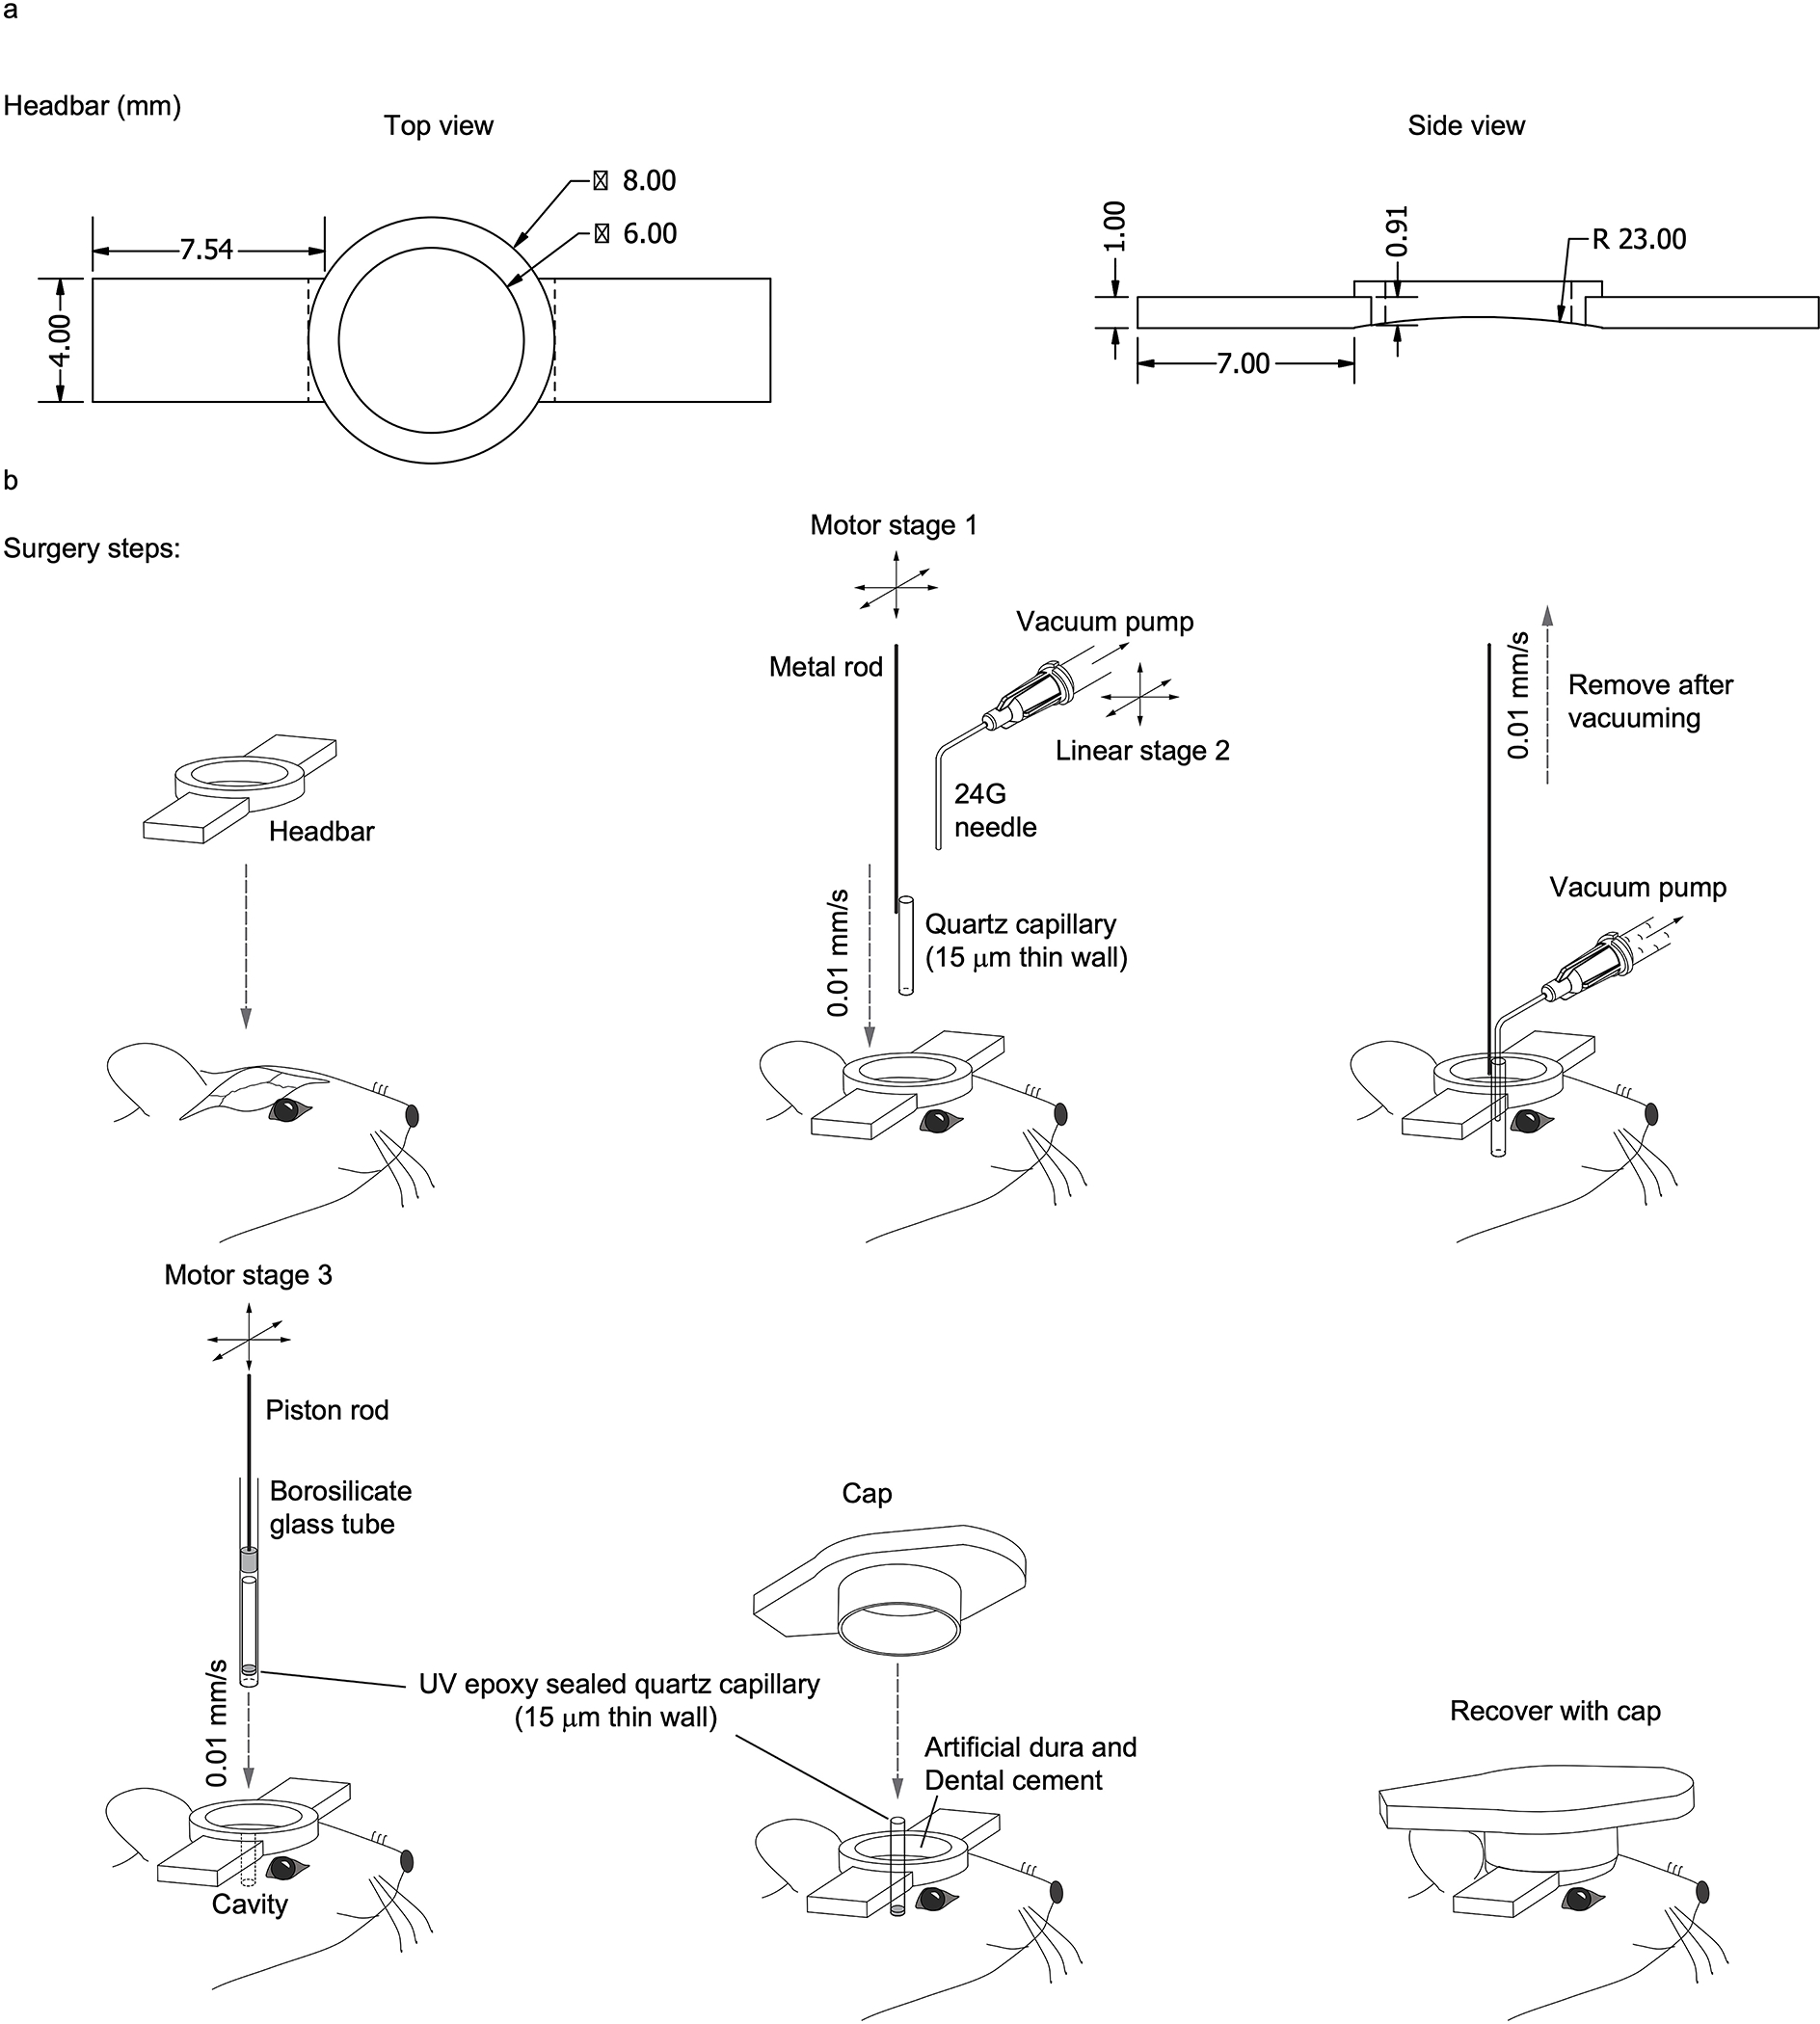
(a) Design of the head-bar for head fixed animal imaging. (b) Illustration of the surgical procedures during capillary implantation.
Extended Data Fig. 5. Docking method for the imaging probe.
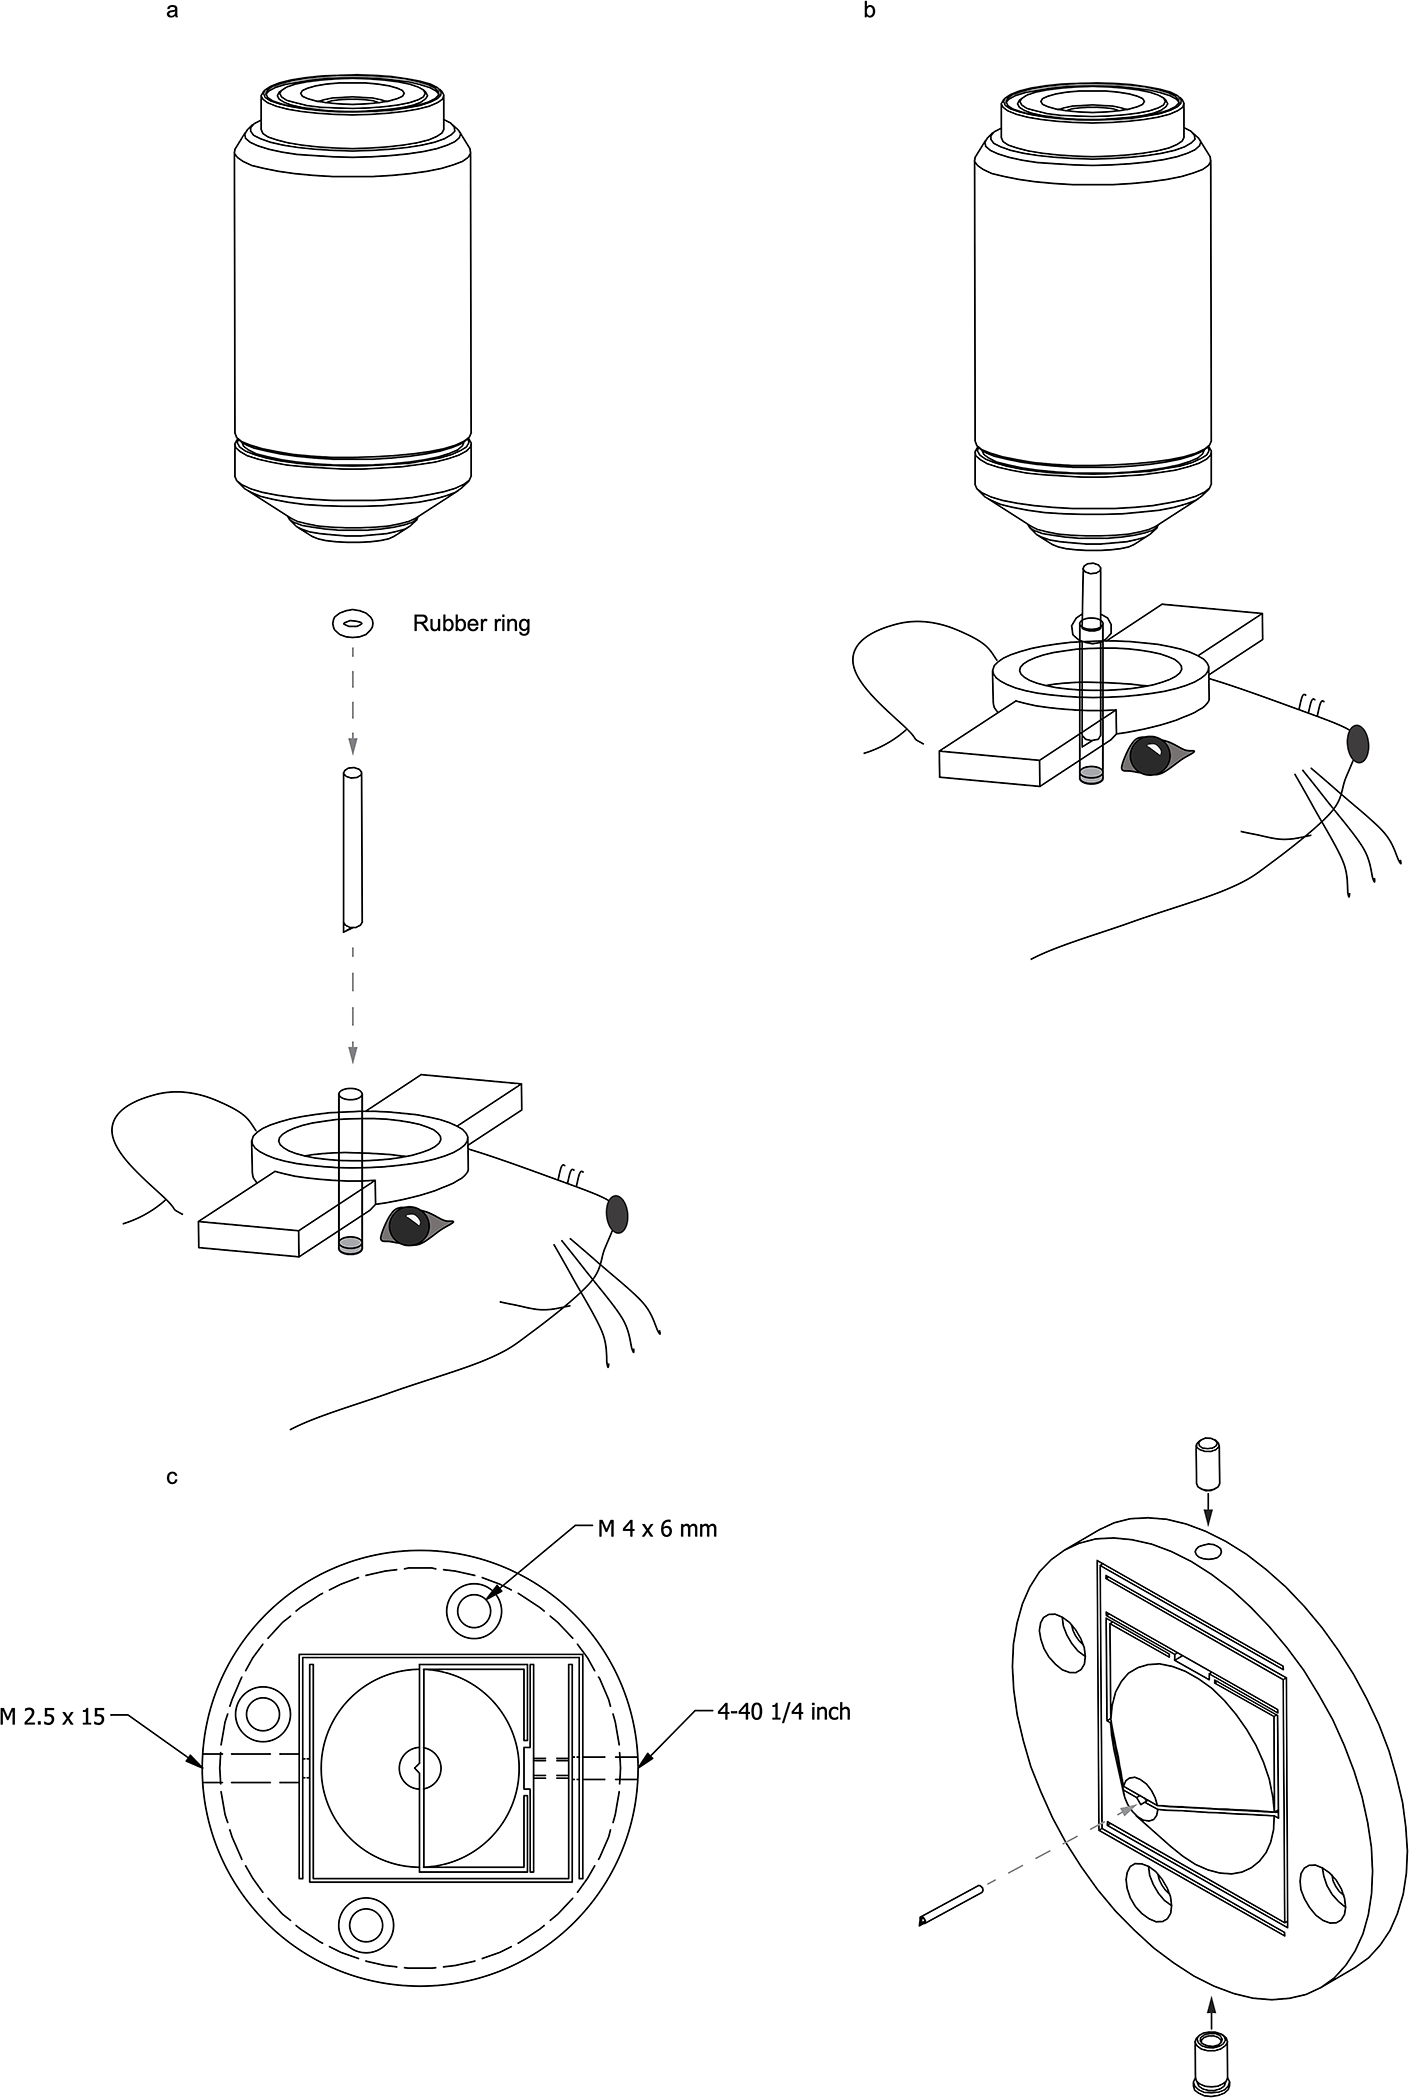
(a, b) Illustration of the docking approach for holding the imaging probe in place. (c) A quick-release probe holder for fine adjustment of probe orientation and depth. We employed this probe docking method for the calcium imaging of awake mice, which is shown in Supplementary Video 5.
Extended Data Fig. 6. Repeated probe insertion and imaging.
Cell locations before and after reloading the animal to the imaging system. The probe insertion repeatability can be reproduced in all experiments.
Extended Data Fig. 7. COMPACT-based calcium imaging with simultaneous electromyography (EMG) and electroencephalography (EEG) recording.
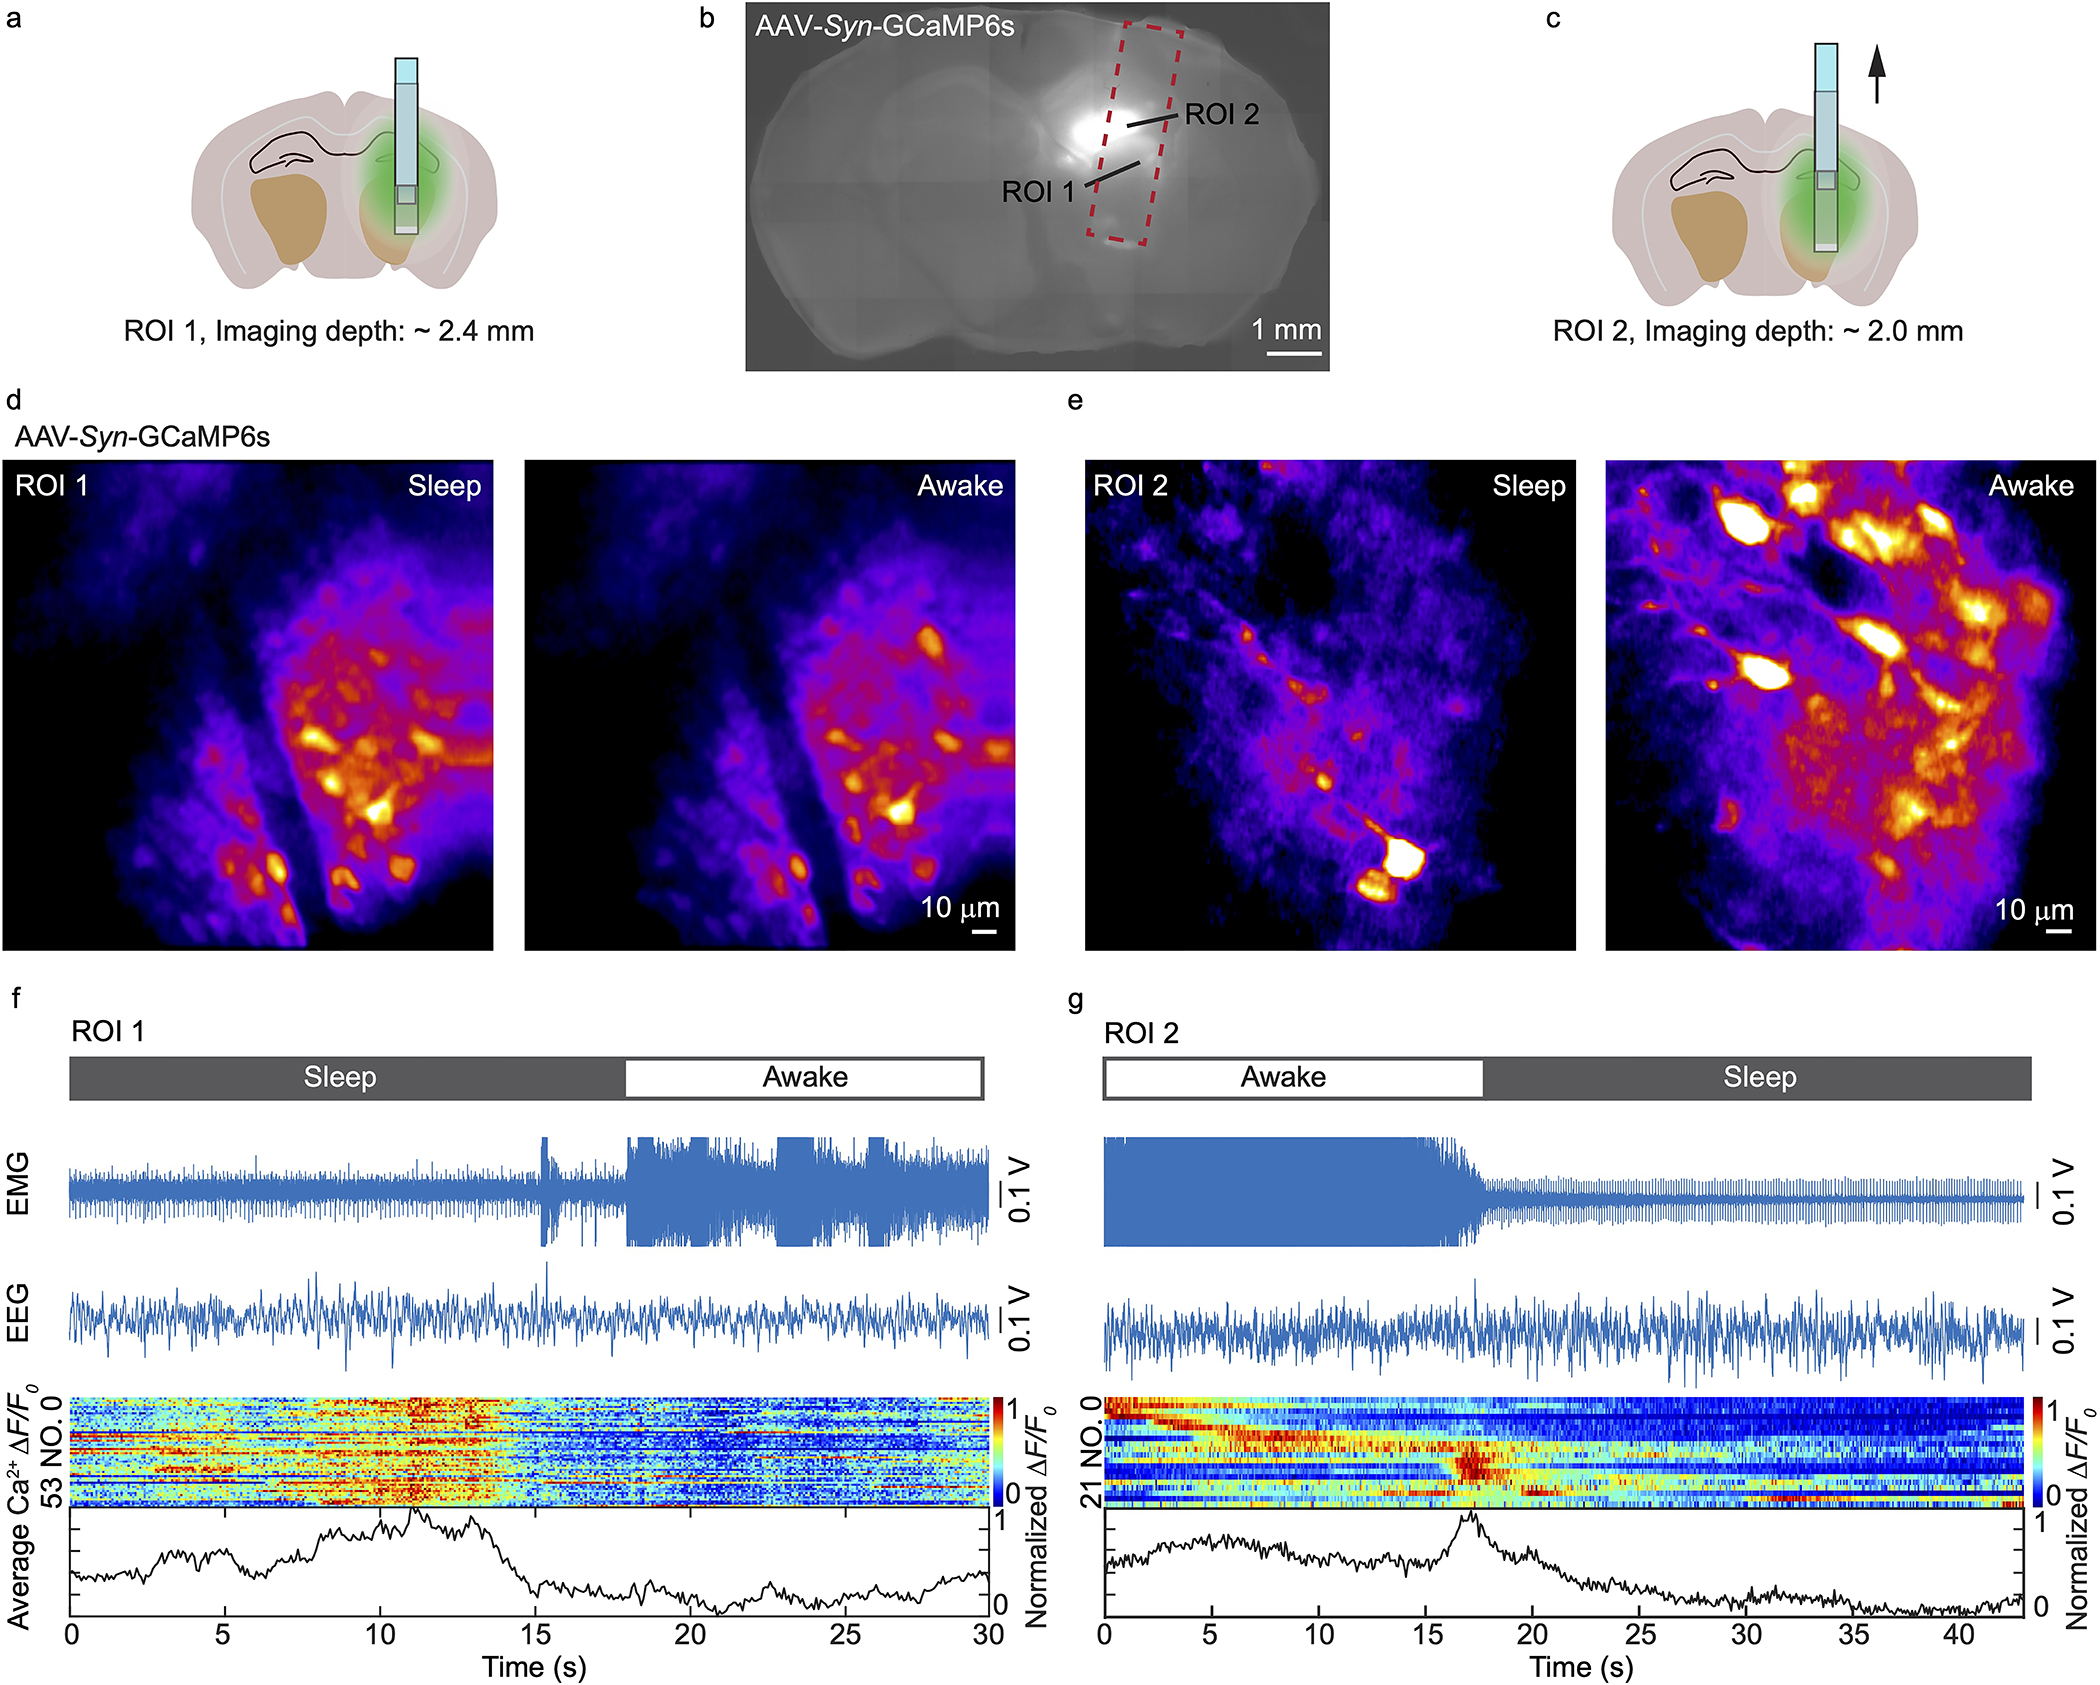
(a-c) Imaging locations for ROI 1 and 2. (d, e) Representative images showing calcium activity of neurons during awake and asleep states in ROI 1 and 2, respectively. The imaging experiments were repeated independently on 5 mice with similar results. (f, g) The EMG, EEG, ΔF/F0 of each cell and their average in ROI 1 and 2, respectively. The awake and asleep states are labeled on top, which was based on the EMG signal levels.
Supplementary Material
The optical configuration of the two-photon imaging system and the operation of whole-depth panoramic two-photon imaging.
Calcium Activity Source Data
Calcium Activity Source Data, Pupil Size Source Data, Statistical Source Data
EMG/EEG, Calcium Activity Source Data
The acquisition of the image volume shown in Supplementary Fig. 1b.
The acquisition of the images shown in Extended Data Fig. 2.
The acquisition of the image volume shown in Fig. 3.
Acknowledgment
This work was funded by NIH (U01NS094341, U01NS107689, U01NS118302 to M.C.) and Purdue University. The funders had no role in study design, data collection and analysis, decision to publish or preparation of the manuscript. M.C. thanks Dr. Scott Sternson (HHMI Janelia research campus) and Prof. Jeffry Isaacson (UCSD) for valuable comments and discussion, and thanks the Howard Hughes Medical Institute for scientific instruments.
Footnotes
Competing financial interests
In March 2020, Purdue University filed a utility patent for the COMPACT-based deep brain neurophotonic interface (Inventor: Meng Cui; U.S. Application No: 16/833,550), which covered the concept, design, and implementation of COMPACT.
References:
- 1.Chen T-W et al. Ultrasensitive fluorescent proteins for imaging neuronal activity. Nature 499, 295–300 (2013). [DOI] [PMC free article] [PubMed] [Google Scholar]
- 2.Denk W & Svoboda K Photon upmanship: Why multiphoton imaging is more than a gimmick. Neuron 18, 351–357 (1997). [DOI] [PubMed] [Google Scholar]
- 3.Betley JN et al. Neurons for hunger and thirst transmit a negative-valence teaching signal. Nature 521, 180 (2015). [DOI] [PMC free article] [PubMed] [Google Scholar]
- 4.Cox J, Pinto L & Dan Y Calcium imaging of sleep–wake related neuronal activity in the dorsal pons. Nature communications 7, 10763 (2016). [DOI] [PMC free article] [PubMed] [Google Scholar]
- 5.da Silva JA, Tecuapetla F, Paixão V & Costa RM Dopamine neuron activity before action initiation gates and invigorates future movements. Nature 554, 244 (2018). [DOI] [PubMed] [Google Scholar]
- 6.Attardo A, Fitzgerald JE & Schnitzer MJ Impermanence of dendritic spines in live adult CA1 hippocampus. Nature 523, 592 (2015). [DOI] [PMC free article] [PubMed] [Google Scholar]
- 7.Hunnicutt BJ et al. A comprehensive excitatory input map of the striatum reveals novel functional organization. Elife 5, e19103 (2016). [DOI] [PMC free article] [PubMed] [Google Scholar]
- 8.Howe MW & Dombeck DA Rapid signalling in distinct dopaminergic axons during locomotion and reward. Nature 535, 505 (2016). [DOI] [PMC free article] [PubMed] [Google Scholar]
- 9.Mittmann W et al. Two-photon calcium imaging of evoked activity from L5 somatosensory neurons in vivo. Nature Neuroscience 14, 1089–U1195 (2011). [DOI] [PubMed] [Google Scholar]
- 10.Ouzounov DG et al. In vivo three-photon imaging of activity of GCaMP6-labeled neurons deep in intact mouse brain. Nature Methods 14, 388–390 (2017). [DOI] [PMC free article] [PubMed] [Google Scholar]
- 11.Kondo M, Kobayashi K, Ohkura M, Nakai J & Matsuzaki M Two-photon calcium imaging of the medial prefrontal cortex and hippocampus without cortical invasion. Elife 6, e26839 (2017). [DOI] [PMC free article] [PubMed] [Google Scholar]
- 12.Yacoub E, Harel N & Uğurbil K High-field fMRI unveils orientation columns in humans. Proceedings of the National Academy of Sciences 105, 10607–10612 (2008). [DOI] [PMC free article] [PubMed] [Google Scholar]
- 13.Levene MJ, Dombeck DA, Kasischke KA, Molloy RP & Webb WW In vivo multiphoton microscopy of deep brain tissue. Journal of neurophysiology 91, 1908–1912 (2004). [DOI] [PubMed] [Google Scholar]
- 14.Göbel W, Kerr JN, Nimmerjahn A & Helmchen F Miniaturized two-photon microscope based on a flexible coherent fiber bundle and a gradient-index lens objective. Optics letters 29, 2521–2523 (2004). [DOI] [PubMed] [Google Scholar]
- 15.Jung JC, Mehta AD, Aksay E, Stepnoski R & Schnitzer MJ In vivo mammalian brain imaging using one-and two-photon fluorescence microendoscopy. Journal of neurophysiology 92, 3121–3133 (2004). [DOI] [PMC free article] [PubMed] [Google Scholar]
- 16.Fu L, Gan X & Gu M Characterization of gradient-index lens-fiber spacing toward applications in two-photon fluorescence endoscopy. Applied optics 44, 7270–7274 (2005). [DOI] [PubMed] [Google Scholar]
- 17.Flusberg BA et al. High-speed, miniaturized fluorescence microscopy in freely moving mice. Nature methods 5, 935 (2008). [DOI] [PMC free article] [PubMed] [Google Scholar]
- 18.Chia TH & Levene MJ Microprisms for in vivo multilayer cortical imaging. Journal of neurophysiology 102, 1310–1314 (2009). [DOI] [PubMed] [Google Scholar]
- 19.Bocarsly ME et al. Minimally invasive microendoscopy system for in vivo functional imaging of deep nuclei in the mouse brain. Biomedical optics express 6, 4546–4556 (2015). [DOI] [PMC free article] [PubMed] [Google Scholar]
- 20.Barretto RP et al. Time-lapse imaging of disease progression in deep brain areas using fluorescence microendoscopy. Nature medicine 17, 223 (2011). [DOI] [PMC free article] [PubMed] [Google Scholar]
- 21.Yang W & Yuste R In vivo imaging of neural activity. Nature methods 14, 349 (2017). [DOI] [PMC free article] [PubMed] [Google Scholar]
- 22.Tearney GJ et al. In vivo endoscopic optical biopsy with optical coherence tomography. Science 276, 2037–2039 (1997). [DOI] [PubMed] [Google Scholar]
- 23.Kim P et al. In vivo wide-area cellular imaging by side-view endomicroscopy. Nature methods 7, 303 (2010). [DOI] [PMC free article] [PubMed] [Google Scholar]
- 24.Gent TC, Bandarabadi M, Herrera CG & Adamantidis AR Thalamic dual control of sleep and wakefulness. Nature neuroscience 21, 974–984 (2018). [DOI] [PMC free article] [PubMed] [Google Scholar]
- 25.Yüzgeç Ö, Prsa M, Zimmermann R & Huber D Pupil size coupling to cortical states protects the stability of deep sleep via parasympathetic modulation. Current Biology 28, 392–400. e393 (2018). [DOI] [PMC free article] [PubMed] [Google Scholar]
- 26.Resendez SL, Jennings Josh H., Ung Randall L., Namboodiri Vijay Mohan K., Zhou Zhe Charles, Otis James M., Nomura Hiroshi, McHenry Jenna A., Kosyk Oksana, and Stuber Garret D.. Visualization of cortical, subcortical and deep brain neural circuit dynamics during naturalistic mammalian behavior with head-mounted microscopes and chronically implanted lenses. Nature protocols 11, 566 (2016). [DOI] [PMC free article] [PubMed] [Google Scholar]
- 27.Leith EN & Upatnieks J Reconstructed wavefronts and communication theory. JOSA 52, 1123–1130 (1962). [Google Scholar]
- 28.Tang J, Germain RN & Cui M Superpenetration optical microscopy by iterative multiphoton adaptive compensation technique. Proceedings of the National Academy of Sciences of the United States of America 109, 8434–8439 (2012). [DOI] [PMC free article] [PubMed] [Google Scholar]
- 29.Wei BW, Wang CW, Cheng ZW, Lai BL, Gan WB & Cui M Clear optically matched panoramic access channel technique (COMPACT) for large-volume deep brain imaging. Zenodo 10.5281/zenodo.4814330 & (2021). [DOI] [PMC free article] [PubMed] [Google Scholar]
Associated Data
This section collects any data citations, data availability statements, or supplementary materials included in this article.
Supplementary Materials
The optical configuration of the two-photon imaging system and the operation of whole-depth panoramic two-photon imaging.
Calcium Activity Source Data
Calcium Activity Source Data, Pupil Size Source Data, Statistical Source Data
EMG/EEG, Calcium Activity Source Data
The acquisition of the image volume shown in Supplementary Fig. 1b.
The acquisition of the images shown in Extended Data Fig. 2.
The acquisition of the image volume shown in Fig. 3.
Data Availability Statement
The imaging datasets generated during and/or analyzed during the current study are available at https://doi.org/10.5281/zenodo.4792757 and https://doi.org/10.5281/zenodo.481433029. Source data for Figures 3 and 4 and Extended Data Figure 7 are available with this paper.