Abstract
Purpose
Nocturnal sounds contain numerous information and are easily obtainable by a non-contact manner. Sleep staging using nocturnal sounds recorded from common mobile devices may allow daily at-home sleep tracking. The objective of this study is to introduce an end-to-end (sound-to-sleep stages) deep learning model for sound-based sleep staging designed to work with audio from microphone chips, which are essential in mobile devices such as modern smartphones.
Patients and Methods
Two different audio datasets were used: audio data routinely recorded by a solitary microphone chip during polysomnography (PSG dataset, N=1154) and audio data recorded by a smartphone (smartphone dataset, N=327). The audio was converted into Mel spectrogram to detect latent temporal frequency patterns of breathing and body movement from ambient noise. The proposed neural network model learns to first extract features from each 30-second epoch and then analyze inter-epoch relationships of extracted features to finally classify the epochs into sleep stages.
Results
Our model achieved 70% epoch-by-epoch agreement for 4-class (wake, light, deep, REM) sleep stage classification and robust performance across various signal-to-noise conditions. The model performance was not considerably affected by sleep apnea or periodic limb movement. External validation with smartphone dataset also showed 68% epoch-by-epoch agreement.
Conclusion
The proposed end-to-end deep learning model shows potential of low-quality sounds recorded from microphone chips to be utilized for sleep staging. Future study using nocturnal sounds recorded from mobile devices at home environment may further confirm the use of mobile device recording as an at-home sleep tracker.
Keywords: respiratory sounds, sleep stages, deep learning, smartphone, polysomnography
Plain Language Summary
Sound-based sleep staging can be a potential candidate for non-contact home sleep trackers. However, existing works were limited to audio measured with a contact manner (ie, tracheal sounds), with a limited distance (ie, 25 cm), or by a professional microphone. For convenience, a more practical way is to utilize easily obtainable audio, such as sounds recorded from commercial mobile devices. To the best of our knowledge, this is the first paper to propose an end-to-end deep learning-based sleep staging (without manual feature extraction) designed to work with sounds recorded from smartphone microphone (low signal-to-noise). The proposed model shows good performance for 4-class sleep staging on smartphone audio dataset, which is better than that of previous works using high-quality audio.
Introduction
There are long-dreamed needs to track sleep in an easy and convenient way. As beyond-polysomnography (PSG) measurements, various commercial sleep trackers including wearable devices such as accelerometers, smartwatches, and piezoelectric devices are available on the market.1–3 Some non-contact methods, especially radar-based devices, were also developed rapidly (eg, Somnofy,4 S+5 and Circadia6 for sleep staging, and BodyCompass7 and SleepPoseNet8 for sleep position detection). However, none of them was suitable for daily use for general population because of inconvenience, expensiveness, or placement sensitiveness. Nocturnal sounds, easily obtained by recording audio throughout the nighttime, contain rich information of sleep (eg, respiratory patterns, sleep-activity patterns, and variable breathing sound corresponding to muscle tone change in upper airway9). Sound-based sleep staging utilizing nocturnal sounds measured from mobile devices may open new doors to at-home sleep tracking.
Few attempts have been made to classify sleep stages solely depending on nocturnal sound. Prior works have extracted useful signals (respiratory and sleep-activity patterns) exceeding a simple energy threshold or a rule-based sound event detection, which require a very good quality of audio with high signal-to-noise ratio (SNR). Either tracheal sound measured in a contact way or sound measured in a limited distance with a high-performance directional microphone was used in previous studies.10–12 With a machine learning algorithm, the performance reached 67% in accuracy, presenting a potential of sound-based sleep stage prediction. However, extensive research on non-contact sound measured in practical conditions such as measuring with a smartphone nearby while sleeping is limited.
The performance of sound-based sleep staging would always depend on the quality of the audio. Micro-electromechanical systems (MEMS) microphone, referred to as microphone chip or silicon microphone, is commonly inserted in mobile devices (eg, smartphones) with the advantage of small size and minimal power consumption. When nocturnal sounds are measured with microphone chips at a distance, breathing and body movement sounds during night are so weak that the energy of such signals is sometimes smaller than that of ambient noise. Thus, previous methods such as screening audio energy plot were not applicable in such scenarios. Mel spectrogram is a method to visualize sound energy when frequency spectrum changes over time. The energy of an audio is decomposed into multiple frequency bins for better interpretation. Sounds of breathing and body movements have specific temporal frequency patterns, which give a unique pattern of frequency spectrum changes over time on Mel spectrogram. Therefore, unlike random ambient noise, respiratory and sleep-activity patterns can easily be seen in Mel spectrogram. Although it still requires extensive signal processing and a non-trivial algorithm to recognize and detect various types of breathing and body movement sound, it may help overcome the low SNR in a practical setting.
The objective of this study was to develop an end (sound)-to-end (sleep stages) deep learning-based sleep stage classifier applicable to nocturnal sounds from microphone chips in smartphones. We proposed a novel neural network architecture to analyze Mel spectrogram (a converted form of audio data) to extract respiratory and sleep-activity features and predict sleep stages considering preceding and subsequent epochs. It was trained and evaluated with a large clinical dataset from two different audio sources: PSG-embedded and smartphone-recorded audios.
Methods
Datasets
Two different audio datasets and their mixed form were used in this study. All audio recordings were conducted at the sleep center in Seoul National University Bundang Hospital (SNUBH) during PSG. Every 30-second epoch of PSG was manually annotated as one of five sleep stages: wake, rapid eye movement (REM) sleep (R), non-REM (NREM) stage 1 (N1), NREM stage 2 (N2), and NREM stage 3 (N3).13 Detailed baseline subject characteristics of the two datasets are presented in Table 1.
Table 1.
Baseline Characteristics of the Study Population in the PSG Audio Dataset and Smartphone Audio Dataset
| Variables | PSG Audio Dataset (n = 1154) | Smartphone Dataset (n = 327) |
|---|---|---|
| Demographics | ||
| Age (year), mean (SD) | 52.7 (13.7) | 47.7 (12.2) |
| Male, n (%) | 801 (69.4) | 276 (84.4) |
| Body mass index (kg/m2), mean (SD) | 25.8 (13.7) | 27.3 (4.3) |
| Sleep-disordered breathing | ||
| Mean AHI, mean (SD) | 22.8 (22.4) | 33.9 (24.5) |
| AHI < 5, n (%) | 279 (24.2) | 27 (8.3) |
| 5 ≤ AHI < 15, n (%) | 268 (23.2) | 58 (17.7) |
| 15 ≤ AHI < 30, n (%) | 277 (24.0) | 88 (26.9) |
| 30 ≤ AHI, n (%) | 330 (28.6) | 154 (47.1) |
| Periodic limb movement | ||
| Mean PLMI, mean (SD) | 9.8 (20.4) | 3.9 (10.8) |
| PLMI < 5, n (%) | 794 (68.8) | 272 (83.2) |
| 5 ≤ PLMI < 25, n (%) | 201 (17.4) | 38 (11.6) |
| 25 ≤ PLMI < 50, n (%) | 96 (8.3) | 14 (4.3) |
| 50 ≤ PLMI, n (%) | 63 (5.5) | 3 (0.9) |
Abbreviations: AHI, apnea-hypopnea index; PLMI, periodic limb movement index; SD, standard deviation; n, number of patients.
PSG Audio Dataset
We included 1154 audios accompanying PSGs performed between January 2019 and December 2020. In the SNUBH, audio recording has been included as part of the PSG to detect breathing and snoring sounds for all examinees. Microphone chips (SUPR-102, ShenZhen YIANDA Electronics Co. Ltd., Shenzhen, China) were installed on the ceiling which should be 1.7 meters above the subject’s head. Since the dataset was retrospectively collected from PSGs previously conducted, additional informed consents were not available. However, the data were all anonymized. The use of this dataset in this study was approved by the Institutional Review Board (IRB) of SNUBH (IRB No. B-2011/648-102).
Smartphone Audio Dataset
The other audio dataset was achieved by prospective collection. To examinees who agreed to participate, sound recording through a smartphone was added during their scheduled in-lab PSGs. A smartphone (LG G3, LG Electronics, Inc, Seoul, Republic of Korea) equipped with a microphone chip was placed on a bed table one meter away from the head of the subject during PSG, and a pre-installed sound recording application was used. In total, 327 audio data with matching PSGs were available for analysis. Written informed consents were obtained according to the Declaration of Helsinki and the study protocol was approved by the Institutional Review Board of Seoul National University Bundang Hospital (IRB No. B-1912-580-305).
The audio recorded via the two different modalities had different characters: the microphone chip used for PSG audio dataset (SUPR-102) had lower signal-to-noise rate and sensitivity compared to the microphone chips equipped in smartphones. In this study, we not only studied the individual audio datasets respectively but also combined the two datasets as one mixed audio dataset and conducted experiments at the mixed audio dataset as well.
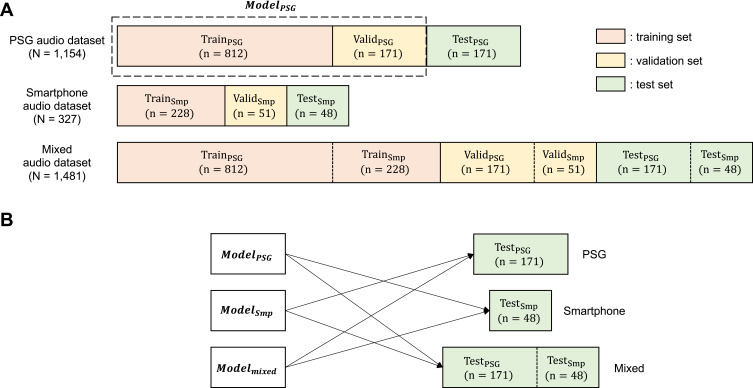
Each dataset was divided into training, validation, and test sets at a ratio of 70:15:15 in a subject-independent manner. There were some overlaps between patients in PSG audio dataset and smartphone audio dataset. We arranged training and test sets of each dataset to be mutually exclusive for fair comparison. Detailed description on dataset is illustrated in Figure 1.
Figure 1.
(A) Three types of audio datasets (PSG, Smartphone, Mixed), each divided into training, validation, and test sets. For example, the PSG audio dataset was divided into TrainPSG, ValidPSG, TestPSG. ModelPSG was trained using TrainPSG, ValidPSG until performance saturation, and was then evaluated with TestPSG. The same process was independently conducted for the Smartphone audio dataset and the mixed audio datasets (PSG+Smartphone), respectively. The numbers of subjects in each dataset were presented. (B) Pairs between trained models and test sets for cross-domain validation. Each trained model was evaluated on test sets from datasets not used for training the model.
Preprocessing
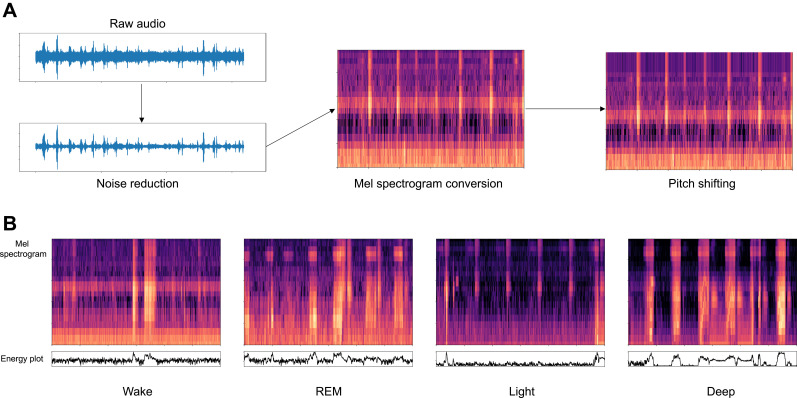
Data preprocessing was conducted in order to reduce noise and facilitate neural network learning to distinguish meaningful signals from noise with a focus on biological signals. The data preprocessing procedure included noise suppression, Mel spectrogram conversion, and pitch shifting for data augmentation14 (Figure 2A). Mel spectrogram conversion could help unveil sounds of breathing and body movements which showed specific temporal frequency patterns (Figure 2B). In addition, the dimension of the input data could be significantly reduced from the raw audio which had a sampling rate of 16 kHz after Mel spectrogram conversion, which led to a more efficient learning curve and reduced computational cost of the deep learning model. The entire night recording of each patient was divided into 30-second fragments which were Mel spectrograms with 20 frequency bins and 1201 timesteps. Each 30-second Mel spectrogram was temporally synchronized with manually scored sleep stages for 30-second epochs from matched PSGs.
Figure 2.
(A) Entire preprocessing procedure. For noise suppression, adaptive spectral gating was applied to each 30-second window to suppress stationary noise profile. Pitch shifting simulated different types of respiratory events, different individual’s characteristics of respiratory sound, and different frequency responses of the microphone. (B) Mel spectrograms and corresponding audio energy plots in dB scale for each sleep stage. Mel spectrograms emphasize the pattern which is more stable and independent from overall energy level (sound amplitude).
Deep Neural Network Architecture
Our proposed deep neural network model, SoundSleepNet, is designed to be trained through two-step process. Since end-to-end sleep stage classification requires complex and hierarchical algorithm, we broke down the algorithm into two steps: (1) the pretraining step to train the model to detect respiratory and sleep-activity patterns from a single Mel spectrogram, (2) the final step to train the model to learn the sequential relationship and predict sleep stages at a sequence level.
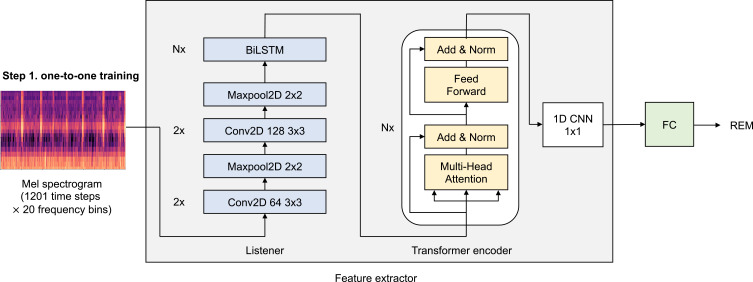
The first step focuses on training the model to extract meaningful features, one by one epoch (one-to-one training). The model trained in this step consists of feature extractor and fully connected layers. The feature extractor includes Listener and Transformer Encoder network, which are specialized for pattern recognition and temporal correlation analysis, respectively15,16 (Figure 3). Then, the fully connected layers classify sleep stages based on the extracted features. Through this first step, feature extractor is trained to detect temporal frequency patterns of breathing and body movement and to extract significant sleep-related features from a single Mel spectrogram.
Figure 3.
The details of first step of SoundSleepNet—pretraining (one-to-one training). The first step of SoundSleepNet focuses on training the feature extractor to detect the meaningful features related to sleep staging from a single Mel spectrogram. Feature extractor is composed of Listener and Transformer encoder. Listener network is a stack of multiple CNNs commonly used to deal with image data (Mel Spectrograms in our case), followed by N layers of bidirectional Long Short-Term Memory (LSTM) to capture the temporal correlation of CNN outputs. Transformer encoder network composed of N layers of an encoder block, which has one multi-head attention and one feed forward network. The attention and feedforward network are each followed by an addition and normalization layer. In our experiments, N was set to be 2 for all Listener and Transformer encoder blocks. At the end, the fully connected layers (FC) classify sleep stages for each input epoch, which feedbacks the training of feature extractor.
Abbreviation: CNN, convolutional neural networks.
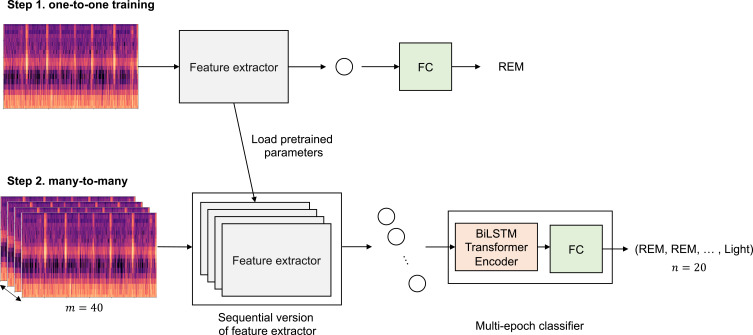
The second step is the main step of SoundSleepNet, many-to-many training for dealing with a sequence of data (40 Mel spectrograms in our proposed model). The two core elements are sequential version of feature extractor and multi-epoch classifier. For feature extractor, the pretrained feature extractor from the first step is loaded and duplicated to deal with a sequence of data (Figure 4). The second core element is multi-epoch classifier, which classifies sleep stages regarding slowly changing respiratory patterns, taking into consideration of preceding and following epochs. The major building blocks of multi-epoch classifier are Bi-directional Long Short-Term Memory (Bi-LSTM) Transformer Encoder and fully connected layers. Bi-LSTM analyzes sequential relationship of features extracted from 40 consecutive Mel spectrograms. At the end, the fully connected layers output the classification (ie, sleep stages) based on the sequential relationship of features. Here, both feature extractor and classifier were trained simultaneously.
Figure 4.
The two-step training flow of SoundSleepNet. Along with the simplified first step (one-to-one), the second step (many-to-many training) was shown with m being the number of input epochs and n being the number of output predictions. The two core elements in the second step were sequential version of feature extractor and multi-epoch classifier. The parameters pretrained in the first step were transferred for feature extractor, which were duplicated for many-to-many network. Multi-epoch classifier includes Bi-directional Long Short-Term Memory (Bi-LSTM) Transformer Encoder and fully connected layers (FC). While the first Transformer Encoder within the feature extractor (not shown in figure) aims to extract intra-epoch features, the second Transformer Encoder, BiLSTM Transformer Encoder within the multi-epoch classifier, extracts inter-epoch features. The head and tail of the transformer encoder’s output were removed before the last fully connected layer. Thus, only 20 predictions at the middle of the sequence were finally outputted, ensuring all predictions were made with consideration of both past and future epochs.
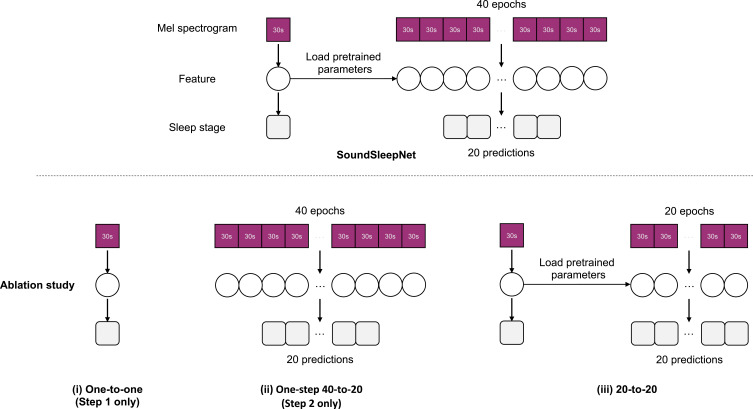
In our proposed model, only the classification for middle 20 epochs are outputted for every 40-epoch sequence input. In order to output only the sleep stage predictions in which sufficient preceding and following epochs were considered, we discarded the head and tail 10 epochs from each 40-epoch sequence (Figure 5). To note, therefore, the first and the last ten epochs of entire night sleep cannot be processed by SoundSleepNet.
Figure 5.
Ablation study design. The simplified flow of SoundSleepNet in comparison to its three variants: (i) the first step only (one-to-one), (ii) the second step only (one-step 40-to-20), (iii) two-step process but without head and tail removal (20-to-20).
Training and Validation
Three types of audio datasets (PSG, smartphone, and mixed) were used for training, validation, and test separately. More specifically, for the training setting, we used the stochastic gradient descent (SGD) optimizer and fixed the number of training epochs to be 10 in all experiments. In the one-to-one training, we used an initial learning rate of 0.01. During the one-to-one pretraining task, the learning rate was decreased 10 times whenever the macro F1 score on the validation set did not increase for three consecutive epochs. As for the many-to-many training, the Slanted Triangular Learning Rate (STLR) scheduler, Discriminative Fine-tuning, and Gradual unfreezing17 were applied to the training procedure. We used the cross-entropy loss function and selected the one achieving the highest Macro F1 score on the validation set as the best model for both training steps.
Evaluation
Classifier Performance
In this paper, the performance of 4-class classification (wake, light, deep, REM) of sleep was mainly evaluated, in which N1 and N2 were merged into light sleep while N3 was considered as deep sleep.12 Performances of 3-class (wake, NREM, and REM) and 2-class (wake and sleep) classifications were also evaluated. The robustness of the model was then tested under different SNR conditions.
The classifier performance was evaluated by accuracy, Cohen’s kappa, macro-F1 score, mean per-class sensitivity, and confusion matrix. Accuracy and Cohen’s kappa were traditional metrics for evaluating classification performance. However, they were easily affected by the distribution of classes. Since sleep stages were not equally distributed, macro-F1 and mean per-class sensitivity known to take data imbalance problem into account were weighted in this study.
In addition, predicted results of sleep variables (ie, total sleep time [TST], total wake time [TWT], wake after sleep onset [WASO], sleep onset latency [SOL], sleep efficiency [SE], REM latency [RL]) were compared with results from manual scoring using Bland-Altman plots.
Ablation Study
Contributions of individual components in the SoundSleepNet were evaluated by ablation study. The three targeting components in ablation study were the pretraining step, the final step dealing with inputs as sequences, and the design of outputting only the middle of the sequence. Correspondingly, the performance of SoundSleepNet was compared with its three variants (Figure 5): (i) the one-to-one model (SoundSleepNet without the second step); (ii) the 40-to-20 model without pretraining (SoundSleepNet without the first step); (iii) the 20-to-20 model whose network structure resembled SoundSleepNet except that it had the same number of inputs and outputs (20 epoch inputs-to-20 epoch outputs). For the ablation study, only the PSG dataset was used.
External Cross-Domain Validation
In order to verify the generalization ability of SoundSleepNet, we used all three audio datasets to perform a cross-domain experiment. As illustrated in Figure 1B, three models trained on each audio training dataset were evaluated with other test datasets.
Results
Sleep Staging Performance of SoundSleepNet on PSG Audio Dataset
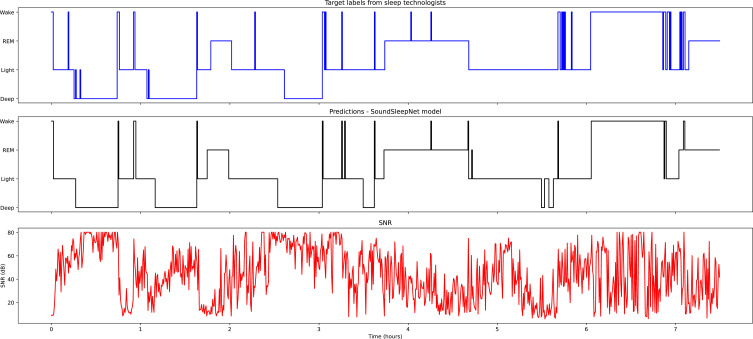
Confusion matrices of the PSG audio dataset were presented in Figure 6. In the 4-class case, the model was correct for 77% of wake, 73% of light sleep, 46% of deep sleep, and 66% of REM sleep. Most misclassifications were in the deep sleep stage, with 46% of deep stages being predicted as light stage. When sleep stages were grouped into three classes, 84% accuracy was shown for the NREM stage. The accuracy became even higher in the 2-stage case as the model was correct for 93% of sleep stages. An example of predicted sleep stages for one whole night was illustrated in Figure 7.
Figure 6.
4-stage, 3-stage, and 2-stage confusion matrices on the PSG audio test set comparing sleep stages based on sleep technologists and network predictions. The SoundSleepNet model was trained on the PSG audio training set. In each confusion matrix, each row represents sleep stages from sleep technologists and each column shows network predictions.
Figure 7.
A comparison of the one-night prediction of SoundSleepNet and the PSG result on a subject from the PSG audio test set. The top figure shows target labels given by sleep technologists. The bottom figure shows SNR (dB) of audio signals. The middle figures show predictions of the model.
Evaluation metrics for 4-stage, 3-stage, and 2-stage predictions are presented in Table 2. The 4-class sleep staging model achieved 0.532 for Cohen’s kappa, 0.644 for Macro F1, 0.655 for mean per-class sensitivity, and 0.703 for accuracy. These scores increased as the number of sleep stage class decreased. Performance comparison between the present study and previous sound-based sleep staging studies is available in supplementary material (Table S1).
Table 2.
Overall Performance of the SoundSleepNet Model
| Cohen’s Kappa | Macro F1 | Mean Per-Class Sensitivity | Accuracy | |
|---|---|---|---|---|
| 4-stage classification | 0.532 | 0.644 | 0.655 | 0.703 |
| 3-stage classification | 0.623 | 0.749 | 0.757 | 0.798 |
| 2-stage classification | 0.683 | 0.842 | 0.850 | 0.894 |
Note: The model was trained with the PSG audio training set and evaluated with the PSG audio test set.
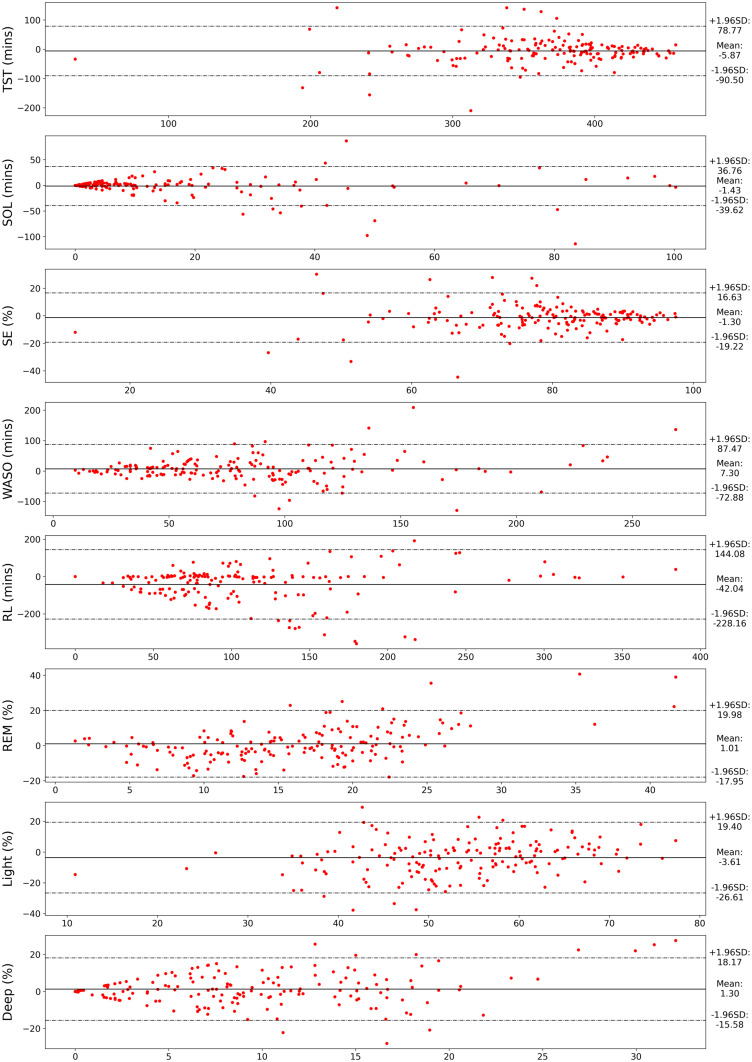
Multiple sleep metrics obtained from both SoundSleepNet and the PSG are presented in Table 3. Comparison of sleep metric mean values between SoundSleepNet and PSG showed a consistent agreement of the two methods. The absolute difference (magnitude of difference) were also minimal throughout most of the sleep metrics. Figure 8 presents the Bland-Altman plots for various sleep metrics. Data points in most of the plots were found to surround the zero line. In addition to this, the mean differences between the sleep metrics obtained from SoundSleepNet and the PSG were close to zero (TST: −5.87, SOL: −1.43, SE: −1.30, WASO: 7.3, RL: −42.04, REM: 1.01, Light: −3.61, Deep: 1.30), thereby proving that SoundSleepNet predictions are very consistent with the manual PSG reading of sleep technologists.
Table 3.
Comparison of Sleep Metrics Between PSG Labels and Predictions from the SoundSleepNet Model
| Sleep Metrics | PSG | SoundSleepNet | Difference | Absolute Difference |
|---|---|---|---|---|
| TST (mins) | 369.8 ± 61.9 (360.5, 379.1) | 363.9 ± 65.2 (354.1, 373.7) | −5.9 ± 43.2 (−12.3, 0.6) | 28.4 ± 33.1 (23.4, 33.3) |
| SOL (mins) | 16.4 ± 25.3 (12.6, 20.1) | 14.9 ± 22.2 (11.6, 18.3) | −1.4 ± 19.5 (−4.4, 1.5) | 9.4 ± 17.1 (6.9, 12.0) |
| SE (%) | 79.4 ± 12.9 (77.5, 81.3) | 78.1 ± 13.6 (76.1, 80.1) | −1.3 ± 9.1 (−2.7, 0.1) | 6.1 ± 7.0 (5.0, 7.1) |
| WASO (mins) | 79.1 ± 50.4 (71.6, 86.7) | 86.4 ± 55.4 (78.1, 94.7) | 7.3 ± 40.9 (1.2, 13.4) | 27.5 ± 31.1 (22.9, 32.2) |
| RL (mins) | 132.9 ± 82.0 (120.4, 145.4) | 90.9 ± 83.7 (78.1, 103.6) | −42.0 ± 95.0 (−56.5, −27.6) | 66.0 ± 80.1 (53.8, 78.2) |
| REM (%) | 15.5 ± 6.3 (14.6, 16.5) | 16.5 ± 10.3 (15.0, 18.1) | 1.0 ± 9.7 (−0.4, 2.5) | 7.0 ± 6.7 (6.0, 8.0) |
| Light (%) | 55.3 ± 10.5 (53.8, 56.9) | 51.7 ± 13.2 (49.7, 53.7) | −3.6 ± 11.7 (−5.4, −1.8) | 9.3 ± 8.0 (8.1, 10.5) |
| Deep (%) | 8.6 ± 7.1 (7.5, 9.6) | 9.9 ± 8.7 (8.6, 11.2) | 1.3 ± 8.6 (0.0, 2.6) | 6.2 ± 6.1 (5.3, 7.1) |
Notes: Difference in sleep metrics was calculated for each subject (SoundSleepNet – PSG) while absolute difference considers the magnitude of difference. Values are presented in the format mean ± SD (95% confidence interval).
Abbreviations: TST, total sleep time; SOL, sleep onset latency; SE, sleep efficiency; WASO, wake after sleep onset; RL, REM latency.
Figure 8.
Bland-Altman plots for common sleep metrics: Total Sleep Time (TST), Sleep Onset Latency (SOL), Sleep Efficiency (SE), Wake After Sleep Onset (WASO), REM Latency (RL), and REM, Light, and Deep percentages. X-axis represents the mean value while Y-axis represents the difference of sleep metric values from SoundSleepNet and the polysomnography (PSG). The dashed lines represent the 95% limit of agreement.
Table 4 shows Cohen’s kappa, Macro F1, and accuracy for different subject groups divided according to five clinical features: age, gender, body mass index (BMI), apnea-hypopnea index (AHI), and periodic limb movements index (PLMI). For gender and BMI features, results were consistent for all three metrics. The male group had higher scores compared to the female group. With an increase of BMI, the performance of the model increased. For remaining features, results of the three metrics were inconsistent. As for age, the model showed the highest Macro F1 score for the middle-aged group (0.652). However, it had the highest Cohen’s kappa for the young-aged group (0.566). Similarly, the model showed decreased Cohen’s kappa in Normal and Mild AHI groups (0.506 and 0.504), while it showed decreased Macro F1 score only in the Mild AHI group (0.616). As for PLMS, the score was considerably decreased in the Severe group (0.438 for Cohen’s kappa and 0.527 for macro F1) compared to other groups.
Table 4.
Performance of SoundSleepNet According to Patient Characteristics
| Feature | Group | Patients | Epochs | Cohen’s Kappa | Macro F1 | Accuracy |
|---|---|---|---|---|---|---|
| Age | Young [19, 40) | 35 | 32,560 | 0.566 | 0.583 | 0.724 |
| Middle [40, 60) | 72 | 67,220 | 0.536 | 0.652 | 0.711 | |
| Old [60, 80) | 64 | 59,340 | 0.508 | 0.604 | 0.683 | |
| Gender | Male | 113 | 104,960 | 0.556 | 0.657 | 0.724 |
| Female | 58 | 54,160 | 0.487 | 0.620 | 0.664 | |
| BMI | Underweight [0, 18.5) | 4 | 3,740 | 0.425 | 0.560 | 0.598 |
| Normal [18.5, 25) | 82 | 75,780 | 0.513 | 0.632 | 0.683 | |
| Overweight [25, 30) | 61 | 57,020 | 0.547 | 0.648 | 0.723 | |
| Obese [30, ∞) | 23 | 21,660 | 0.591 | 0.689 | 0.749 | |
| AHI | Normal [0, 5) | 46 | 42,460 | 0.506 | 0.640 | 0.668 |
| Mild [5, 15) | 39 | 36,360 | 0.504 | 0.616 | 0.684 | |
| Moderate [15, 30) | 38 | 35,440 | 0.561 | 0.662 | 0.726 | |
| Severe [30, ∞) | 48 | 44,860 | 0.556 | 0.645 | 0.735 | |
| PLMI | Normal [0, 5) | 117 | 109,140 | 0.536 | 0.651 | 0.709 |
| Mild [5, 25) | 29 | 27,320 | 0.546 | 0.644 | 0.709 | |
| Moderate [25, 50) | 16 | 14,760 | 0.525 | 0.640 | 0.696 | |
| Severe [50, ∞) | 9 | 7,900 | 0.438 | 0.527 | 0.617 |
Note: The model was trained with the PSG audio training set and evaluated with the PSG audio test set.
Abbreviations: BMI, body-mass index; AHI, apnea-hypopnea index; PLMI, periodic limb movement index.
Ablation Study of the SoundSleepNet
Our proposed deep neural network, SoundSleepNet (40-to-20 model), demonstrated the best performance among its variants in three out of four performance metrics. The gap with the second-best model, 20-to-20 variant, was substantial (difference: 0.043 in Cohen’s kappa, 0.030 in Macro F1, and 3.8% in accuracy) (Table 5). Removing the pretraining step (One-step 40-to-20) also had an unignorable impact on the performance (difference: 0.056 in Cohen’s kappa, 0.032 in Macro F1, and 6% in accuracy). For the simplest model, one-to-one variant, the gap became more prominent (difference: 0.227 in Cohen’s kappa, 0.183 in Macro F1, and 21% in accuracy).
Table 5.
Evaluation Metrics for Different Models (Results from Ablation Study)
| Cohen’s Kappa | Macro F1 | Mean Per-Class Sensitivity | Accuracy | |
|---|---|---|---|---|
| One-to-one | 0.305 | 0.461 | 0.538 | 0.493 |
| 20-to-20 | 0.489 | 0.614 | 0.640 | 0.665 |
| One-step 40-to-20 | 0.476 | 0.612 | 0.670 | 0.643 |
| SoundSleepNet | 0.532 | 0.644 | 0.655 | 0.703 |
Notes: Bolded values indicate the highest score. The model was trained with the PSG audio training set and evaluated with the PSG audio test set.
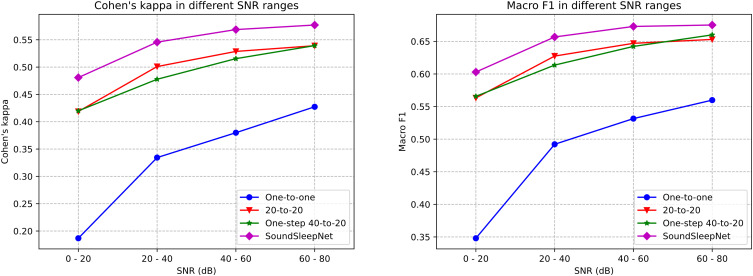
When tested with various SNR, the SoundSleepNet model not only showed the best performance across the spectrum of SNR but also were the least affected by the degree of SNR (Figure 9). The difference between the best and the worst performance for different SNR range (0.096 for Cohen’s kappa, 0.07 for Macro F1) was less than that for any other variant model (the second lowest values were: 0.119 for Cohen’s kappa, and 0.09 for Macro F1).
Figure 9.
Performances of SoundSleepNet and its counterparts in different SNR ranges.
External Cross-Domain Validation with Smartphone Audio Dataset
Table 6 shows the results of a cross-domain validation experiment using PSG, smartphone, and mixed audio datasets. The model trained with PSG training set not only performed best with the PSG test set but also yielded substantial results in external validation with smartphone test set (0.485 for Cohen’s kappa and 0.610 for Macro F1) with only a small gap (0.047 for Cohen’s kappa and 0.034 for Macro F1). It also demonstrated high performance with the mixed test set (0.522 for Cohen’s kappa and 0.636 for Macro F1). On the other hand, the model trained with smartphone training set experienced a degraded performance in external validation on PSG test set (0.349 for Cohen’s kappa and 0.494 for Macro F1) with a considerable gap (0.094 for Cohen’s kappa and 0.08 for Macro F1). This model performed the worst for all three test sets. Finally, the model trained with mixed training set showed similar or superior performance over three test sets. Especially for the smartphone test set, the model trained with the mixed dataset surprisingly gained a significant improvement and achieved the highest performance (0.512 for Cohen’s kappa and 0.647 for Macro F1). The confusion matrices for this model are shown in Figure 10.
Table 6.
Performance of SoundSleepNet Trained and Tested with Different Datasets
| Cohen’s Kappa | Macro F1 | Mean Per-Class Sensitivity | |||||||
|---|---|---|---|---|---|---|---|---|---|
| PSG Test | Smp Test | Mixed Test | PSG Test | Smp Test | Mixed Test | PSG Test | Smp Test | Mixed Test | |
| PSG training | 0.532 | 0.485 | 0.522 | 0.644 | 0.610 | 0.636 | 0.655 | 0.603 | 0.643 |
| Smp training | 0.349 | 0.443 | 0.369 | 0.494 | 0.574 | 0.511 | 0.510 | 0.563 | 0.523 |
| Mixed training | 0.525 | 0.512 | 0.524 | 0.631 | 0.647 | 0.636 | 0.643 | 0.653 | 0.645 |
Note: Bolded values indicate the highest score on a test dataset.
Abbreviations: PSG, PSG audio dataset; Smp, smartphone audio dataset; Mixed, mixed audio dataset.
Figure 10.
Four-stage, 3-stage, and 2-stage confusion matrices on the smartphone audio test set comparing stages from sleep technologists and network predictions. The SoundSleepNet model was trained on the Mixed audio dataset. In each confusion matrix, each row represents sleep stages from sleep technologists while each column shows network predictions.
Discussion
Our proposed end (sound)-to-end (sleep staging) deep learning method made it possible to accurately predict sleep stages based on nocturnal audio recorded from a distance with compact microphones of mobile devices. Our key findings were: (i) latent breathing and body movement sound in noisy audio were distinguishable in Mel spectrogram; (ii) the proposed model could detect temporal frequency patterns of breathing and body movement sound and therefore successfully classify sleep stages even for low-quality audio data measured by common microphones; (iii) significant performance improvements were achieved for sound-based sleep staging by letting the model (40-to-20) exploit past and future information (from 40 input epochs) to predict sleep stages at the middle (20 output epochs); (iv) the proposed model robustly worked well in two different domain datasets such as PSG and smartphone audio, and (v) the proposed method was robust under various sleep characteristics that entailed unusual nocturnal sound, such as sleep disordered breathing and periodic limb movements.
To the best of our knowledge, this is the first end-to-end deep learning model that can work with audio data measured in a more practical condition (non-contact and smartphone microphone). Most of previous sound-based sleep studies10–12 investigated automatic classifying sleep stages by machine learning algorithms where sound was measured in a contact way for high SNRs. Tracheal sound was measured from microphones attached to the neck so that respiratory patterns were easily obtainable through threshold-based sound event detection. Some researchers have used these respiratory patterns to extract hand-crafted features for sleep/wake detection.10,12 More recently, there were efforts to utilize non-contact measured sound but with other limitations. One study used sound measured in a non-contact manner but with the measuring device only 25 cm away from the subject’s head.18 In another study, the non-contact sound was measured at a distance of 1 m away from the head but a directional microphone was used to obtain sound with high SNR.9 In addition, extensive preprocessing and manual labeling were needed for sleep staging. Unlike previous works using high quality audio with high SNR, we used audio data with low SNR which were measured by a compact microphone embedded in a mobile device over a longer distance. In spite of using the lower quality of audio compared to previous works, our deep neural network model (SoundSleepNet) demonstrated superior performance for both PSG and smartphone audio datasets (Table S1).
The power of SoundSleepNet to work robustly in low SNR environment comes from automatic respiratory and sleep activity pattern extraction from Mel spectrogram. Figure S1 visualizes single-epoch Mel spectrograms randomly sampled from the same patient whose sleep stages are illustrated in Figure 7. Since the breathing sound is weak while recorded at a distance, detecting respiratory event using traditional methods such as threshold-based or rule-based algorithm can come up with tremendous false positive and false negative. It was observed that some respiratory patterns could not be detected by frame energy analysis because of high ambient noise energy level. On the other hand, by looking at temporal frequency patterns in Mel spectrogram, the existence of breathing sound was clearly recognizable.
Another active research field in deep learning-based sleep staging is how to utilize sequential dependency of the sleep signals.13,19 By deciding the number of input epochs and corresponding output labels, strategies of model design can be divided into (i) one-to-one,20–23 (ii) many-to-one,24–26 and (iii) many-to-many.27–30 Many recent papers are utilizing the many-to-many prediction strategy since it could achieve better performance by exploiting contextual input information and contextual output generation. We also recruited a many-to-many strategy for our proposed network. Furthermore, we designed the model to observe at least 10 adjacent epochs (5 mins) for both past and future directions (40-to-20), taking into account the slowly changing pattern of respiratory and sleep activity in response to a sleep stage change. Unlike signals from PSG, the patterns of respiratory and body movements detected from sound change at a slower tempo, and therefore, observing sufficient surrounding epochs is crucial in this case. As expected, the one-to-one model with insufficient information of future and past had frequently changing unstable predictions with low accuracy. In addition, SoundSleepNet (40-to-20) performed considerably better than the 20-to-20 model (conventional many-to-many way) in ablation study, thereby supporting the fact that past and future epochs are undoubtedly helpful for the prediction. The other essence of the design of the SoundSleepNet is the two-step training. The SoundSleepNet demonstrated better performance compared to the One-step 40-to-20, which has the same neural network architectures but omits a pretraining step. Since the model architecture is complex with 40 sequence of inputs and 20 sequence of outputs, the training signal from the label gets weaker when it goes down to the feature extractor. The pretraining of the feature extractor with the one-to-one training step contributes to the improvement of performance.
While our model showed good performance in general, it had difficulty distinguishing deep sleep from light sleep. This finding is consistent with previous studies using sound for sleep staging.9,12 We carefully assumed that low accuracy for deep sleep might be a fundamental limitation of sleep staging using mainly respiratory and body movement information. While wakefulness is characterized by frequent body movements and REM sleep by irregular breathing, light and deep sleep share features such as regular breathing with little body movement. Even in a study using respiratory inductance plethysmography signals which are measured in a contact way and are considered the most accurate respiratory signals, deep sleep stage is the least accurately predicted.31
As for evaluation on sleep metrics, the mean difference of REM Latency was relatively more significant than those from other sleep metrics (Figure 8). This was due to the fact that SoundSleepNet sometimes predicts the REM stage before detecting any Light or Deep stage, thereby setting the REM latency to be zero. Interestingly, the subjects with predicted REM latency of zero mostly belong to the Old Age group on which SoundSleepNet appears to have lower performance. Our validation dataset are from hospital patients with various sleep disorders, which result in relatively large widths of limits of agreement for several sleep metrics.
The model trained on PSG audio showed robust performance in the cross-domain validation using the smartphone dataset. On the other hand, the cross-domain validation from smartphone to PSG showed significant drops for all metrics compared to PSG to smartphone validation. While the small size of the smartphone dataset for training and the different characteristics of subject population included in the smartphone dataset (ie, high AHI) might contribute to the degradation of the external validation performance, it was more likely to be attributed to the different microphone domains. That is, a model trained with low-SNR data (PSG audio) may work well on high-SNR data (smartphone audio), but not vice versa. Notably, the model trained with the mixed dataset including both PSG and smartphone audios showed superior or comparable performance for all three types of test datasets, indicating that the diversity in the training dataset might make the model more robust. Extracting audio from PSG is the easiest way to collect nocturnal sound data having matched sleep stage labels, and developing a model generalizable to easily obtainable data is essential for practical at-home services in the future. Our results imply that the proposed model has substantial generalization capability on different microphone domains.
With the increase of interest in sleep, several commercial sleep trackers for home are now available. Wearables such as smartwatches are predominant. However, piezoelectric sensors and radar-based sleep trackers are getting more attention due to their advantages of non-contact and more convenient sensing. Unfortunately, these devices are rather expensive because they require the latest technology. On the other hand, the sound-based sleep staging can be implemented as a smartphone application since smartphones are equipped with high-quality microphones. Even with the advantage of availability with software implementation, the proposed sound-based sleep tracking showed higher performance. Table S2 summarizes performances of several commercial sleep trackers (including Fitbit Alta HR) compared with matching sleep expert-scored PSG test.32
The limitations of our work are as follows. First, our dataset only included audio recorded in a hospital environment. A home environment is exposed to a broad range of noises (eg, sound from bed partner, television, talks, air conditioner, and pets) and is different from an in-lab hospital environment. Second, when the model was trained with solely smartphone data, the sleep staging performance was not ideal, which might be due to the small size of the dataset. The external validation showed good performance for the smartphone dataset, showing a capacity for improvement of performance with a larger sample size. Third, our model was tested on sounds from only two microphone domains. Smartphones, smart speakers, and other mobile devices are equipped with various types of microphones, which may affect the performance of the model.
Conclusion
In conclusion, with a large-scale audio dataset recorded with two different microphones, we developed an end-to-end sound-based sleep stage classifier that worked well with the audio recorded in a non-contact way by compact microphones built in mobile devices such as smartphones. This study presents a potential of deep learning model for sound-based sleep staging deep to be utilized as a convenient at-home sleep tracker in a real world (eg, applied on a smartphone application). Future works are needed to recruit a larger smartphone dataset and develop a model specified with sound recorded from home environment.
Disclosure
Professor Hyeryung Jang reports grants from King’s College London, outside the submitted work. The author reports no conflicts of interest in this work.
References
- 1.Zhai B, Perez-Pozuelo I, Clifton EA, Palotti J, Guan Y. Making sense of sleep: multimodal sleep stage classification in a large, diverse population using movement and cardiac sensing. Proc ACM Interactive Mobile Wearable Ubiquit Technol. 2020;4(2):1–33. doi: 10.1145/3397325 [DOI] [Google Scholar]
- 2.Walch O, Huang Y, Forger D, Goldstein C. Sleep stage prediction with raw acceleration and photoplethysmography heart rate data derived from a consumer wearable device. Sleep. 2019;42(12):zsz180. doi: 10.1093/sleep/zsz180 [DOI] [PMC free article] [PubMed] [Google Scholar]
- 3.Liang Z, Chapa-Martell MA. Accuracy of Fitbit wristbands in measuring sleep stage transitions and the effect of user-specific factors. JMIR mHealth uHealth. 2019;7(6):e13384. doi: 10.2196/13384 [DOI] [PMC free article] [PubMed] [Google Scholar]
- 4.Toften S, Pallesen S, Hrozanova M, Moen F, Grønli J. Validation of sleep stage classification using non-contact radar technology and machine learning (Somnofy®). Sleep Med. 2020;75:54–61. doi: 10.1016/j.sleep.2020.02.022 [DOI] [PubMed] [Google Scholar]
- 5.Zaffaroni A, Doheny EP, Gahan L, et al. Non-contact estimation of sleep staging. In: EMBEC & NBC 2017. Springer; 2017:77–80. [Google Scholar]
- 6.Lauteslager T, Kampakis S, Williams AJ, Maslik M, Siddiqui F. Performance evaluation of the circadia contactless breathing monitor and sleep analysis algorithm for sleep stage classification. In: proceedings from the 2020 42nd Annual International Conference of the IEEE Engineering in Medicine & Biology Society (EMBC); 2020. [DOI] [PubMed] [Google Scholar]
- 7.Yue S, Yang Y, Wang H, et al. Bodycompass: monitoring sleep posture with wireless signals. Proc ACM Interactive Mobile Wearable Ubiquit Technol. 2020;4(2):1–25. doi: 10.1145/3397311 [DOI] [Google Scholar]
- 8.Piriyajitakonkij M, Warin P, Lakhan P, et al. SleepPoseNet: multi-view learning for sleep postural transition recognition using UWB. IEEE J Biomed Health Inform. 2020;25(4):1305–1314. doi: 10.1109/JBHI.2020.3025900 [DOI] [PubMed] [Google Scholar]
- 9.Dafna E, Tarasiuk A, Zigel Y. Sleep staging using nocturnal sound analysis. Sci Rep. 2018;8(1):1–14. doi: 10.1038/s41598-018-31748-0 [DOI] [PMC free article] [PubMed] [Google Scholar]
- 10.Ghahjaverestan NM, Akbarian S, Hafezi M, et al. Sleep/wakefulness detection using tracheal sounds and movements. Nat Sci Sleep. 2020;12:1009. doi: 10.2147/NSS.S276107 [DOI] [PMC free article] [PubMed] [Google Scholar]
- 11.Nakano H, Furukawa T, Tanigawa T. Tracheal sound analysis using a deep neural network to detect sleep apnea. J Clin Sleep Med. 2019;15(8):1125–1133. doi: 10.5664/jcsm.7804 [DOI] [PMC free article] [PubMed] [Google Scholar]
- 12.Kalkbrenner C, Brucher R, Kesztyüs T, Eichenlaub M, Rottbauer W, Scharnbeck D. Automated sleep stage classification based on tracheal body sound and actigraphy. German Med Sci. 2019;17. doi: 10.3205/000268 [DOI] [PMC free article] [PubMed] [Google Scholar]
- 13.Berry RB, Brooks R, Gamaldo CE, Harding SM, Marcus C, Vaughn BV. The AASM manual for the scoring of sleep and associated events. Am Acad Sleep Med. 2012;176:2012. [Google Scholar]
- 14.Eklund -V-V. Data augmentation techniques for robust audio analysis. 2019.
- 15.Vaswani A, Shazeer N, Parmar N, et al. Attention is all you need. In: proceedings from the Advances in neural information processing systems; 2017. [Google Scholar]
- 16.Hori T, Watanabe S, Zhang Y, Chan W. Advances in joint CTC-attention based end-to-end speech recognition with a deep CNN encoder and RNN-LM. arXiv preprint. 2017;arXiv:170602737. [Google Scholar]
- 17.Howard J, Ruder S. Universal language model fine-tuning for text classification. arXiv preprint. 2018;arXiv:180106146. [Google Scholar]
- 18.Xue B, Deng B, Hong H, Wang Z, Zhu X, Feng DD. Non-contact sleep stage detection using canonical correlation analysis of respiratory sound. IEEE J Biomed Health Inform. 2019;24(2):614–625. doi: 10.1109/JBHI.2019.2910566 [DOI] [PubMed] [Google Scholar]
- 19.Liang S-F, Kuo C-E, Hu Y-H, Cheng Y-S. A rule-based automatic sleep staging method. J Neurosci Methods. 2012;205(1):169–176. doi: 10.1016/j.jneumeth.2011.12.022 [DOI] [PubMed] [Google Scholar]
- 20.Andreotti F, Phan H, Cooray N, Lo C, Hu MT, De Vos M. Multichannel sleep stage classification and transfer learning using convolutional neural networks. In: proceedings from the 2018 40th annual international conference of the IEEE Engineering in medicine and biology society (EMBC); 2018. [DOI] [PubMed] [Google Scholar]
- 21.Andreotti F, Phan H, De Vos M. Visualising convolutional neural network decisions in automatic sleep scoring. In: proceedings from the CEUR Workshop Proceedings; 2018. [Google Scholar]
- 22.Supratak A, Dong H, Wu C, Guo Y. DeepSleepNet: a model for automatic sleep stage scoring based on raw single-channel EEG. IEEE Trans Neural Syst Rehabil Eng. 2017;25(11):1998–2008. doi: 10.1109/TNSRE.2017.2721116 [DOI] [PubMed] [Google Scholar]
- 23.Phan H, Andreotti F, Cooray N, Chén OY, De Vos M. Automatic sleep stage classification using single-channel EEG: learning sequential features with attention-based recurrent neural networks. In: proceedings from the 2018 40th annual international conference of the IEEE engineering in medicine and biology society (EMBC); 2018. [DOI] [PubMed] [Google Scholar]
- 24.Guillot A, Sauvet F, During EH, Thorey V. Dreem open datasets: multi-scored sleep datasets to compare human and automated sleep staging. IEEE Trans Neural Syst Rehabil Eng. 2020;28(9):1955–1965. doi: 10.1109/TNSRE.2020.3011181 [DOI] [PubMed] [Google Scholar]
- 25.Li Y, Gu Z, Lin Z, Yu Z, Li Y. An automatic sleep staging model combining feature learning and sequence learning. In: proceedings from the 2020 12th International Conference on Advanced Computational Intelligence (ICACI); 2020. [Google Scholar]
- 26.Seo H, Back S, Lee S, Park D, Kim T, Lee K. Intra-and inter-epoch temporal context network (IITNet) using sub-epoch features for automatic sleep scoring on raw single-channel EEG. Biomed Signal Process Control. 2020;61:102037. doi: 10.1016/j.bspc.2020.102037 [DOI] [Google Scholar]
- 27.Phan H, Chén OY, Tran MC, Koch P, Mertins A, De Vos M. XSleepNet: multi-view sequential model for automatic sleep staging. IEEE Trans Pattern Anal Mach Intell. 2021;1. doi: 10.1109/TPAMI.2021.3070057 [DOI] [PubMed] [Google Scholar]
- 28.Guillot A, Thorey V. RobustSleepNet: transfer learning for automated sleep staging at scale. arXiv preprint. 2021;arXiv:210102452. [DOI] [PubMed] [Google Scholar]
- 29.Phan H, Chén OY, Koch P, Mertins A, De Vos M. Fusion of end-to-end deep learning models for sequence-to-sequence sleep staging. In: proceedings from the 2019 41st Annual International Conference of the IEEE Engineering in Medicine and Biology Society (EMBC); 2019. [DOI] [PubMed] [Google Scholar]
- 30.Phan H, Andreotti F, Cooray N, Chén OY, De Vos M. SeqSleepNet: end-to-end hierarchical recurrent neural network for sequence-to-sequence automatic sleep staging. IEEE Trans Neural Syst Rehabil Eng. 2019;27(3):400–410. doi: 10.1109/TNSRE.2019.2896659 [DOI] [PMC free article] [PubMed] [Google Scholar]
- 31.Sun H, Ganglberger W, Panneerselvam E, et al. Sleep staging from electrocardiography and respiration with deep learning. Sleep. 2020;43(7):zsz306. doi: 10.1093/sleep/zsz306 [DOI] [PMC free article] [PubMed] [Google Scholar]
- 32.Chinoy ED, Cuellar JA, Huwa KE, et al. Performance of seven consumer sleep-tracking devices compared with polysomnography. Sleep. 2021;44(5):zsaa291. doi: 10.1093/sleep/zsaa291 [DOI] [PMC free article] [PubMed] [Google Scholar]


