Abstract
In this report, we identify the 10 most common causes of hospitalizations in the USA in 2005–2018 using the discharge data from the National Inpatient Sample database. We show that sepsis has been the leading cause of hospitalizations in the USA followed by heart failure, which has consistently been within the three most common causes of hospitalizations since 2005. In addition, we show a high burden of cardiovascular diseases as a cause of hospitalization over the study period with a consistent presence of cardiac arrhythmias as one of the top 10 causes of hospitalizations in the USA and emergence of acute myocardial infarction as one of the top 10 causes after 2014.
Keywords: Causes, Most common, Hospitalizations, Sepsis, Heart failure
Graphical Abstract
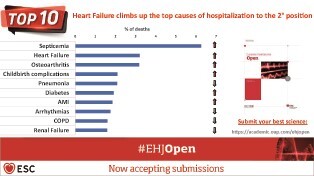
Graphical Abstract.

Most common causes of hospitalizations between 2005 and 2018.
Introduction
Cardiovascular diseases are the leading cause of death in the USA followed by cancer.1 Hospitalization for any cause is a major healthcare and economic burden with significant impacts on patients’ quality of life and subsequent clinical outcomes, including mortality.2,3 The most common causes of hospitalizations in the USA in recent years have not been well identified. In this report, we identify the most common primary discharge diagnoses between 2005 and 2018 using the National Inpatient Sample (NIS) database.
Method
A retrospective analysis of discharge data from the NIS database was conducted to identify the 10 most common primary discharge diagnoses with no restrictions related to age, discharge status (e.g. dead, alive), or disposition (e.g. home/self-care, assisted nursing facility) in 2005, 2008, 2011, 2014, 2016, and 2018 using International Classification of Diseases (ICD) codes. Primary discharge diagnosis in NIS is the condition that is primarily responsible for admission. Clinical Classifications Software (CCS) and CCS Refined (CCS-R) were used to aggregate ICD-9 diagnosis codes and ICD-10 diagnosis codes into clinical categories, respectively.4,5 We used the total number of hospitalizations for each year as the denominator to calculate percentages of the primary discharge diagnoses. The data underlying this article is available in the NIS database.
Results
Overall, childbirth was the most common primary discharge diagnosis over the study period. Following that, diseases that made up the highest volume of hospitalization were the following: The most common following primary discharge diagnoses in 2005 were (i) pneumonia, except that caused by tuberculosis or sexually transmitted disease (3.45%); (ii) coronary atherosclerosis and other heart disease (2.84%); (iii) non-hypertensive congestive heart failure (HF) (2.78%); (iv) non-specific chest pain (2.11%); (v) obstetrics-related trauma to perineum and vulva (2.01%); (vi) other complications of birth and puerperium affecting management of mother (1.95%); (vii) osteoarthritis (1.89%); (viii) cardiac dysrhythmias (1.78%); (ix) acute myocardial infarction (1.70%); and (x) spondylosis, intervertebral disc disorders, other back problems (1.66%) (Table 1).
Table 1.
The most common causes for hospitalizations in 2005, 2011, and 2018 and their percentages of the total hospitalizations in each yeara,b
|
2005 Total number of hospitalizations: 37 843 040 |
2011 Total number of hospitalizations: 36 962 415 |
2018 Total number of hospitalizations: 35 527 480 |
||||
|---|---|---|---|---|---|---|
| Diagnosis | N (%) | Diagnosis | N (%) | Diagnosis | N (%) | |
| 1 | Pneumonia (except that caused by tuberculosis or sexually transmitted disease) |
1 303 866
(3.4%) |
Pneumonia (except that caused by tuberculosis or sexually transmitted disease) |
1 060 729
(2.87%) |
Septicaemia |
2 219 455
(6.25%) |
| 2 | Coronary atherosclerosis and other heart disease |
1 075 776
(2.84%) |
Septicaemia (except in labor) |
1 045 574
(2.83%) |
Heart failure |
1 135 945
(3.20%) |
| 3 | Congestive heart failure; non-hypertensive |
1 053 079
(2.78%) |
Congestive heart failure; non-hypertensive |
928 265
(2.51%) |
Osteoarthritis |
1 128 058
(3.18%) |
| 4 | Non-specific chest pain |
798 188
(2.11%) |
Osteoarthritis |
924 227
(2.50%) |
Complications specified during childbirth |
745 020
(2.10%) |
| 5 | Obstetrics-related trauma to perineum and vulva |
759 675
(2.01%) |
Mood disorders |
861 785
(2.33%) |
Pneumonia (except that caused by tuberculosis) |
740 724
(2.08%) |
| 6 | Other complications of birth; puerperium affecting management of mother |
738 542
(1.95%) |
Cardiac dysrhythmias |
764 936
(2.07%) |
Diabetes mellitus with complication |
678 575
(1.91%) |
| 7 | Osteoarthritis |
715 924
(1.89%) |
Chronic obstructive pulmonary disease and bronchiectasis |
696 945
(1.89%) |
Acute myocardial infarction |
658 555
(1.85%) |
| 8 | Cardiac dysrhythmias |
674 175
(1.78%) |
Complication of device; implant or graft |
667 560
(1.81%) |
Cardiac dysrhythmias |
620 030
(1.75%) |
| 9 | Acute myocardial infarction |
641 717
(1.70%) |
Spondylosis; intervertebral disc disorders; other back problems |
644 648
(1.74%) |
Chronic obstructive pulmonary disease and bronchiectasis |
569 645
(1.60%) |
| 10 | Spondylosis; intervertebral disc disorders; other back problems |
627 920
(1.66%) |
Obstetrics-related trauma to perineum and vulva |
641 605
(1.74%) |
Acute and unspecified renal failure |
565 785
(1.59%) |
Childbirth was the most common coded cause of hospitalization throughout the study period.
The following categories have been used interchangeably for the table: (1) Pneumonia (except that caused by tuberculosis or sexually transmitted disease) and pneumonia (except that caused by tuberculosis); (2) other complications of birth, puerperium affecting management of mother, and complications specified during childbirth, (3) septicaemia (except in labor) and septicaemia; Ob, obstetrics; and (4) congestive heart failure (non-hypertensive) and heart failure.
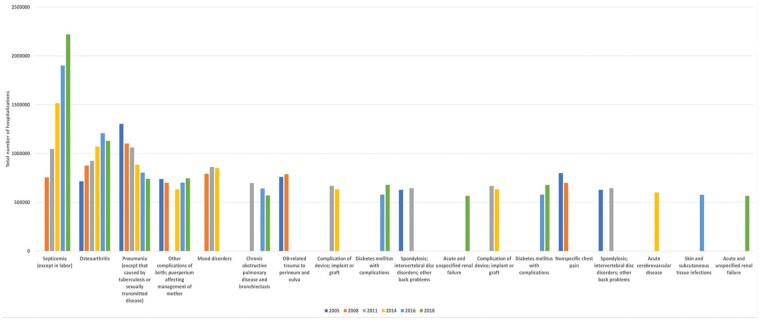
The most common primary discharge diagnoses in 2018 were: (i) septicaemia (6.25%); (ii) HF (3.20%); (iii) osteoarthritis (3.18%); (iv) complications specified during childbirth (2.10%); (v) pneumonia, except that caused by tuberculosis (2.08%); (vi) diabetes mellitus with complication (1.91%); (vii) acute myocardial infarction (1.85%); (viii) cardiac dysrhythmias (1.75%); (ix) chronic obstructive pulmonary disease and bronchiectasis (1.60%); and (x) acute and unspecified renal failure (1.59%) (Figures 1 and 2).
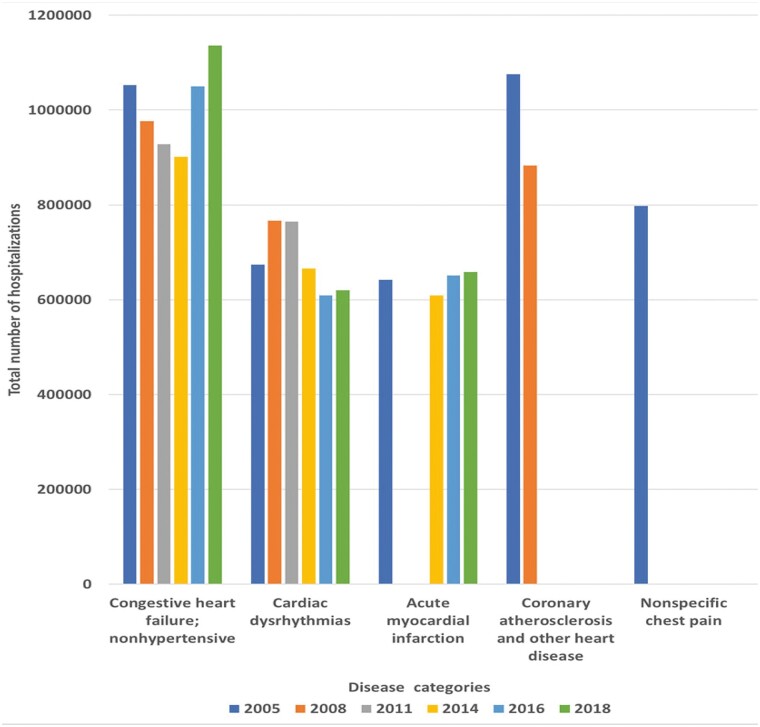
Figure 1.
Most common cardiovascular causes of hospitalizations between 2005 and 2018. *Following categories have been used interchangeably for the figure: congestive heart failure (non-hypertensive) and heart failure.
Figure 2.
Most common non-cardiovascular causes of hospitalizations between 2005 and 2018. *Following categories have been used interchangeably for the figure: (1) pneumonia (except that caused by tuberculosis or sexually transmitted disease) and pneumonia (except that caused by tuberculosis); (2) other complications of birth, puerperium affecting management of mother, and complications specified during childbirth; and (3) septicaemia (except in labor) and septicaemia; Ob, obstetrics.
Discussion
In this report, we show the 10 most common causes of hospitalizations between 2005 and 2018 with notable findings. Pneumonia was the most common disease leading to hospitalization in 2005, 2008, and 2011; however, sepsis was the most common disease leading to hospitalization in 2014, 2016, and 2018 with a significant uptrend. This shows that infectious causes have been the leading cause of hospitalization in the USA over the study period. Second, we observe a significant burden for cardiovascular diseases as a cause for hospitalization; despite a change in the most common causes of hospitalization across the years, HF was consistently within the three most common causes of hospitalization and has risen to be the second most common cause of hospitalization in 2018. A recent report showed a trend towards increase in hospitalizations for HF between 2014 and 2017;6 our analysis shows the significant impact of this trend as evident by HF being the second most common cause of hospitalization in 2018 with an increase in the total number of hospitalizations for HF between 2014 and 2018. Furthermore, we observe a consistent presence of cardiac dysrhythmias as one of the top 10 causes of hospitalization over the study period and reemergence of AMI in the top 10 causes of hospitalization after 2014. Interestingly, diabetes mellitus, a risk factor for all these cardiovascular diseases,7–9 has also emerged as one of the top 10 causes of hospitalizations in 2016 and 2018. Third, we show a consistent presence of osteoarthritis as one of the top 10 causes for hospitalization over the study period.
Over the past years, the US government mandated coding practices that have led to a reclassification of certain comorbid states. The significant uptrend of sepsis and HF hospitalizations that is observed in our analysis require further investigation to explore whether these trends are due to changes in coding practices or a change in disease incidence and prevalence.
The coronavirus disease 2019 (COVID-19) pandemic is likely to be associated with a major shift in the top causes of hospitalization and subsequent outcomes, such as mortality. While cardiovascular mortality has been relatively stable between 2015 and 2020, COVID-19 mortality has emerged as the third leading cause of death in 2020 after cancer.1 The changes in the trend of hospitalizations that is associated with COVID-19 pandemic is not clear yet. As our data predate the COVID-19 pandemic, this study will be an important comparator for future analyses related to causes of hospitalization. Some limitations should be acknowledged. First, the NIS is an administrative database that relies on ICD codes, which are primarily used for billing purposes. Second, as CCS-R does not include ICD9 codes, we used CCS for ICD-9 codes; this method was previously used by the Healthcare Cost and Utilization Project (HCUP) to estimate causes of hospitalizations.5 Third, CCS-R categorization is slightly different than CCS categorization, which could potentially introduce some heterogeneity. However, it is largely similar for most of the diagnosis groups. Fourth, as the NIS data are related to hospital discharges rather than individual patients, we could not determine to what extent patients with recurrent hospitalizations affected the results. Lastly, some changes in coding practices may have accounted for some of the observations in our study, such as the absence of sepsis as one of the top diagnoses in 2005 and disappearance of non-specific chest pain as a top diagnosis after 2005.
In summary, sepsis has been the leading cause of hospitalizations in the recent years followed by HF, which has seen an uptrend over the last decade. Cardiovascular diseases, including HF, AMI, and cardiac dysrhythmias, have been major contributors to hospitalizations.
Lead author biography

Dr Husam Salah obtained his medical degree from the Jordan University of Science and Technology and is currently a second-year internal medicine resident at the University of Arkansas for Medical Sciences. He will be serving as chief resident at the University of Arkansas for Medical Sciences for the academic year 2022–2023. Following that, he plans to pursue further training in cardiology. His research interests include heart failure and the connection between COVID-19 and cardiovascular health outcomes.
Conflict of interest: R.J.M. receives research support and honoraria from Abbott, American Regent, Amgen, AstraZeneca, Bayer, Boehringer Ingelheim/Eli Lilly, Boston Scientific, Cytokinetics, Fast BioMedical, Gilead, Innolife, Medtronic, Merck, Novartis, Relypsa, Respicardia, Roche, Sanofi, Vifor, and Windtree Therapeutics. M.F. was supported by NHLBI K23HL151744 from the National Heart, Lung, and Blood Institute (NHLBI), the American Heart Association grant No 20IPA35310955, Mario Family Award, Duke Chair’s Award, Translating Duke Health Award, Bayer, and BTG Specialty Pharmaceuticals. He receives consulting fees from AstraZeneca, AxonTherapies, CVRx, Daxor, Edwards LifeSciences, Galvani, NXT Biomedical, Zoll, and Viscardia. All the other authors declare no conflict of interest.
Contributor Information
Husam M Salah, Department of Medicine, University of Arkansas for Medical Sciences, 4301 W Markham St, Little Rock, AR 72205, USA.
Abdul Mannan Khan Minhas, Department of Medicine, Forrest General Hospital, 6051 US 49, Hattiesburg, MS 39401, USA.
Muhammad Shahzeb Khan, Department of Medicine, University of Mississippi, 2500 N. State Street, Jackson, MS 39216, USA.
Ambarish Pandey, Division of Cardiology, Department of Medicine, University Texas Southwestern, and Parkland Health and Hospital System, 5323 Harry Hines Blvd, Dallas, TX 75390, USA.
Erin D Michos, Division of Cardiology, Johns Hopkins University School of Medicine, 1800 Orleans St, Baltimore, MD 21287, USA.
Robert J Mentz, Division of Cardiology, Department of Medicine, Duke University, 2301 Erwin Road, Durham, NC 27710, USA; Duke Clinical Research Institute, 300 W Morgan St, Durham, NC 27701, USA.
Marat Fudim, Division of Cardiology, Department of Medicine, Duke University, 2301 Erwin Road, Durham, NC 27710, USA; Duke Clinical Research Institute, 300 W Morgan St, Durham, NC 27701, USA.
References
- 1. Ahmad FB, Anderson RN. The leading causes of death in the US for 2020. JAMA. 2021;325(18):1829–1830. doi:10.1001/jama.2021.5469. [DOI] [PMC free article] [PubMed] [Google Scholar]
- 2. Meira D, Lavoura P, Ferreira D, Curiati JA, Lichtenstein A, Carvalho C, Tanaka C. Impact of hospitalization in the functionality and quality of life of adults and elderlies. Eur Respir J 2015;46:PA3547. [Google Scholar]
- 3. Dobkin C, Finkelstein A, Kluender R, Notowidigdo MJ. The economic consequences of hospital admissions. Am Econ Rev 2018;108:308–352. [PubMed] [Google Scholar]
- 4. HCUP CCS. Healthcare Cost and Utilization Project (HCUP). Rockville, MD: Agency for Healthcare Research and Quality; 2017. www.hcup-us.ahrq.gov/toolssoftware/ccs/ccs.jsp. [PubMed]
- 5. Clinical Classifications Software Refined (CCSR). Healthcare Cost and Utilization Project (HCUP). Rockville, MD: Agency for Healthcare Research and Quality; 2020. www.hcup-us.ahrq.gov/toolssoftware/ccsr/ccs_refined.jsp.
- 6. Agarwal MA, Fonarow GC, Ziaeian B. National trends in heart failure hospitalizations and readmissions from 2010 to 2017. JAMA Cardiol 2021. doi:10.1001/jamacardio.2020.7472. [DOI] [PMC free article] [PubMed] [Google Scholar]
- 7. Grisanti LA. Diabetes and arrhythmias: pathophysiology, mechanisms and therapeutic outcomes. Front Physiol 2018;9:1669. [DOI] [PMC free article] [PubMed] [Google Scholar]
- 8. Keller PF, Carballo D, Roffi M. Diabetes and acute coronary syndrome. Minerva Med 2010;101:81–104. [PubMed] [Google Scholar]
- 9. Dhingra R, Vasan RS. Diabetes and the risk of heart failure. Heart Fail Clin 2012;8:125–133. [DOI] [PMC free article] [PubMed] [Google Scholar]


