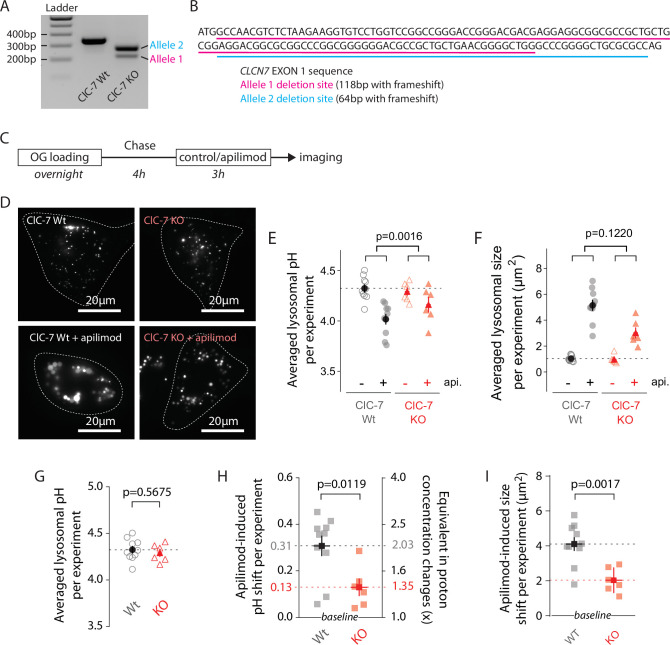
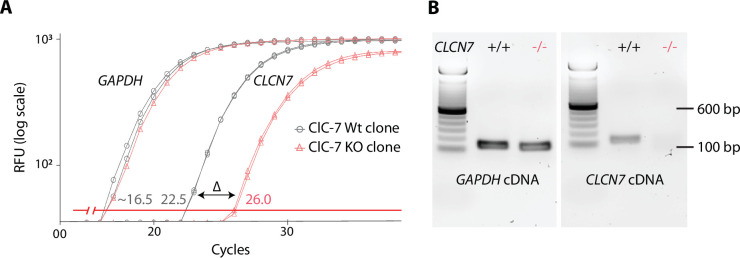
Figure 5. ClC-7 knockout (KO) cells display both lysosomal hyperacidification and swelling reduction.
(A) Agarose gel electrophoresis of PCR product amplified from ClCN7 deletion site of wildtype (ClC7 Wt, left) and CLCN7 KO (ClC-7 KO, right) U2OS cells. (B) EXON1 sequence from CLCN7 WT (black) and KO (purple and teal) alleles. (C) Protocol timeline. Cells were ‘lysosome-loaded’ with Oregon Green 488-dextran (OG) and treated for 3 hr with apilimod (100 nM, red) or its vehicle (0.25% DMSO, control) before imaging. (D) Images from a representative experiment: ClC-7 WT (left) or ClC-7 KO (right) cells acquired by 445 nm laser excitation. Bright objects represent OG-positive lysosomes in control (top) versus apilimod (bottom) conditions. Dotted lines delineate cell outlines. (E, F) Lysosomal pH (E) or size (F) from ClC-7 WT (gray circle) or ClC-7 KO (red triangle) cells in apilimod (filled symbols) versus control (empty symbols) in a representative experiment. Dark symbols are averages over all cells; each pale symbol represents the average lysosomal pH from one cell. p-Values for apilimod effects are obtained from two-way ANOVA. (G) There is no significant difference in pH between untreated WT and untreated KO cells (p=0.5675, unpaired t-test). For (G - I), dark symbols are averages over all experiments; each pale symbol represents the averaged lysosomal pH or size from one experiment (10 and 6 independent experiments for WT and KO conditions, respectively; each experiment represents 8–18 cells per condition). (H, I) Comparison of lysosomal pH shift (H) or size shift (I) induced by apilimod treatment in ClC-7 Wt (gray) versus ClC-7 KO (red) cells. Proton concentration change (H), [H+]change was calculated from apilimod-induced pH shift (∆pH) using the following relation: . p-Values from unpaired t-test.


