Abstract
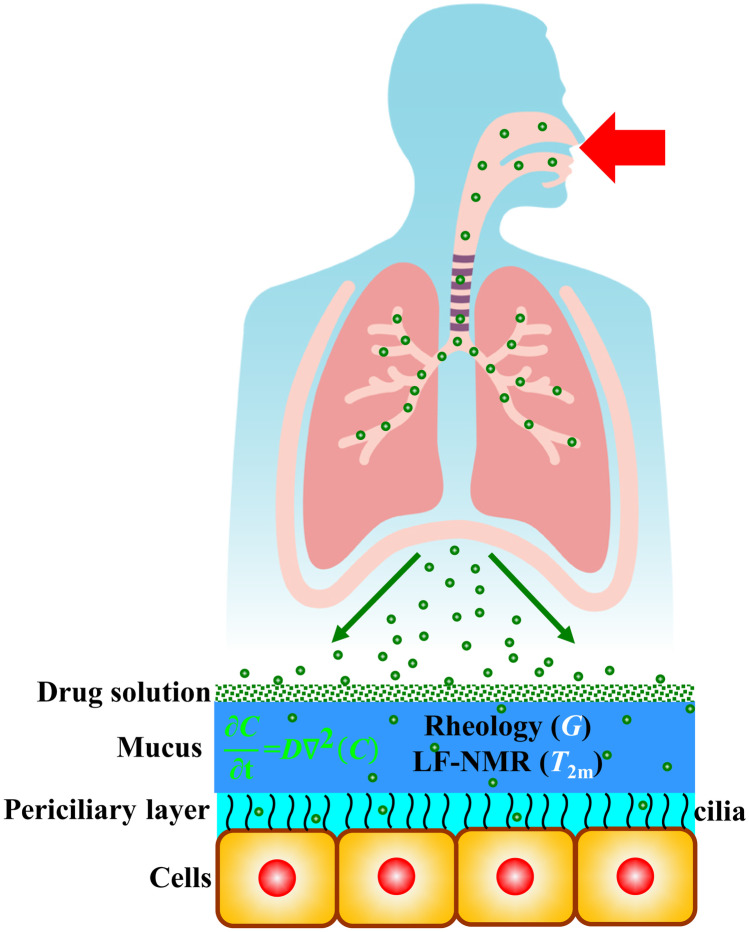
Cystic fibrosis (CF) is a disease characterized by the production of viscous mucoid secretions in multiple organs, particularly the airways. The pathological increase of proteins, mucin and biological polymers determines their arrangement into a three-dimensional polymeric network, affecting the whole mucus and impairing the muco-ciliary clearance which promotes inflammation and bacterial infection. Thus, to improve the efficacy of the drugs usually applied in CF therapy (e.g., mucolytics, anti-inflammatory and antibiotics), an in-depth understanding of the mucus nanostructure is of utmost importance. Drug diffusivity inside a gel-like system depends on the ratio between the diffusing drug molecule radius and the mesh size of the network. Based on our previous findings, we propose the combined use of rheology and low field NMR to study the mesh size distribution of the sputum from CF patients. Specifically, we herein explore the effects of chest physiotherapy on CF sputum characteristic as evaluated by rheology, low field NMR and the drug penetration through the mucus via mathematical simulation. These data show that chest physiotherapy has beneficial effects on patients, as it favourably modifies sputum and enhances drug penetration through the respiratory mucus.
Graphical abstract
Keywords: Cystic fibrosis, Sputum, Rheology, Low field NMR, Mesh size distribution, Drug delivery
Introduction
Cystic fibrosis (CF) is one of the most common lethal genetic diseases in people of Caucasian origin [1, 2]. The disease is caused by mutations in the gene encoding the cystic fibrosis transmembrane conductance regulator (CFTR). The CFTR gene encodes an ATP-regulated chloride channel present within the apical surface of epithelial cells. Dis-functional CFTR determines a decreased surface liquid volume and increased mucus viscosity in many organs, mainly to the airway. In the healthy lungs, inhaled particles are transported out of the lung by cilia movement, within a process called muco-ciliary clearance. The increased viscosity of mucus in CF patients impairs muco-ciliary clearance determining mucus stagnation, thus favouring bacterial lung infections, a typical event in CF patients [2]. In this regard, CF patients are often colonized by S. aureus in the early childhood [3]. S. aureus is replaced during disease progression by P. aeruginosa as the dominant pathogen. By the time of reaching adulthood, up to 80% of CF patients are chronically infected by P. aeruginosa. These chronic pulmonary infections are associated with a rapid decline in lung functions, high morbidity and short life expectancy [4]. One of the most striking hallmarks of P. aeruginosa in chronically infected CF patients is the conversion to a mucoid phenotype of the mucus due to the increased production of alginates [5–7], natural polymers composed of mannuronic and guluronic acid units arranged in a block-wise pattern [8]. Alginates overproduction can contribute to a strong inflammatory response sustained by immune cells that can influence lung epithelial cells [9–11]. During inflammation, substances like proteins, mucin and biological polymers increase in mucus as well as the increased alginate production. These compounds organize into a three-dimensional polymeric network, affecting the whole mucus, impairing the muco-ciliary clearance, promoting bacterial infection and hindering drug diffusion to the epithelial cells.
The nanostructure of the network requires an in-depth understanding, in order to improve the efficacy of the drugs usually employed in CF therapy (e.g., mucolytics, anti-inflammatory and antibiotics) when administered alone or in combination with chest physiotherapy. Indeed, drug diffusivity inside a gel-like system depends on the ratio between the diffusing drug molecule radius and the network mesh size. This parameter has driven several research studies focus to date, due to its relevance on the CF sputum/mucus properties [12]. Hanes et al. demonstrated that sputum/mucus is a heterogeneous medium made up of mainly physical cross-linked polymeric regions, embedded in a low viscosity, water-like and fluid [12–14]. According to their complex structure, both the macro- and the micro-rheological mucus/sputum properties have been studied by classical strain/stress controlled rheometers and an innovative particle tracking approach [13]. The network mesh size was determined relaying on rheological sputum characteristics [14] and probe particles tracking [15]. However, as clearly pointed out by Bhat and co-workers [16–18], drug diffusion through mucus can be also affected by drug binding to the glycoproteins. In addition, drug action can be reduced by non-physiological ionic strength, pH, mucociliary clearance and biochemical alterations of mucus [18].
Based on our previous findings, we herein propose the synergic combination of rheology and low-field nuclear magnetic resonance (LF-NMR) to study the mesh size distribution changes of mucus in CF patients (obtained by voluntary expectoration and from now on called “sputum”), prior and after chest physiotherapy. Indeed, while LF-NMR can provide for info about sputum structure, depending on the magnetic relaxation of water hydrogen trapped in the network, rheology can yield to further insights on the nanostructure, relaying on the mechanical relaxation of the polymeric network chains. Furthermore, LF-NMR allows determining the spin–spin relaxation time (T2m) of the water hydrogens, whereas rheology allows measuring the shear modulus G of the sputum. Remarkably, it is possible to determine important features of the sputum nanostructure and further develop innovative drug penetration range, on the T2m and G knowledge. In particular, the present work focuses on the effects that chest physiotherapy has on sputum characteristic leant on rheology/LF-NMR analysis. Therefore, we hypothesize that chest physiotherapy can also influence the sputum nanostructure, representing a pivotal information for clinicians in order to optimize the therapy, for future precision and personalized medicine approach.
Materials and methods
Samples collection
Sputum samples were provided by the Burlo Garofolo Hospital, following a procedure approved by the Ethics Committee (prot n. 496/2916, CI M-11, 22–3-2016). Written informed consent was obtained from each patient. One sputum specimen was collected before and after chest physiotherapy session in randomly selected adult and young patients able to expectorate. Non-expectorant patients were excluded, as were subjects ≤ 7 years of age. The chest physiotherapy technique is set up on patient to patient even if the technique most used for the patients enrolled in this study is the pep-mask. Sometimes, autogenous drainage has also been used. Chest physiotherapy was provided as standard procedure for CF patients, to improve clearance, both by using positive expiratory pressure devices and standardised physiotherapist-guided chest applied manoeuvres, as well as effective breathing exercise [19].
The aforementioned criteria allowed for the recruitment of most patients who attended Burlo Garofolo Hospital for a clinical visit during our study period (from January 2019 to December 2020). Spontaneously expectorated (1–2 mL) sputum was collected from CF patients in sterile cups and immediately used for T2m determination. The samples were then transferred from the LF-NMR glass tube to a rheometer device for analysis. Patient’s lung functionality, performed after chest physiotherapy, was evaluated by the Burlo Garofolo Hospital by means of FEV1 (forced expiratory volume in the first second), i.e. the volume of air that can be forced out in one second after taking a deep breath.
Rheology
The viscoelastic properties of the analysed samples were determined by means of two rheological tests called, respectively, stress sweep and frequency sweep test. These experiments require the application of a sinusoidal stress () to the sample in order to measure the related oscillatory deformation (). Stress sweep tests were lead applying a sinusoidal stress of constant frequency (f = 1 Hz) and increasing amplitude to detect the limit of the linear viscoelastic range. Frequency sweep tests, performed in the linear viscoelastic range, as to prevent any sample structure damaging, were lead in the frequency range 10–0.01 Hz. The output of the frequency sweep tests, i.e. the elastic (G’) and viscous (G’’) moduli dependence on pulsation (= 2f) (mechanical spectrum), were fitted by the generalized Maxwell model [20]:
| 1 |
| 2 |
where nR is the number of Maxwell elements considered, whereas gi (ith elastic constant), i (ith viscosity) and i (ith relaxation time) represent model fitting parameters. Model fitting was performed assuming that i were scaled by a factor 10 (i+1 = 10 i) [20]. Although other fitting strategies could have been followed, this approach enables getting a wider and, thus, clearer, relaxation spectrum (gi vs i). The nR determination was performed according to a statistical procedure, in order to minimize the product N*2, where N indicates the number of fitting parameters and 2 is the sum of the squared errors [21]). The sample shear modulus G was evaluated as the sum of all gi (G = gi) [22]. Therefore, Flory theory [23] allows to evaluate the polymeric network crosslink density, x, defined as the moles of junction points between different polymeric chains per hydrogel unit volume, based on previous G determination:
| 3 |
where R is the universal gas constant and T is the absolute temperature. Therefore, the equivalent network theory [24] enables the determination of the average mesh size a:
| 4 |
where NA is the Avogadro number.
Low-field NMR
NMR is based on hydrogen atoms dipole reaction to the external constant magnetic field (B0) switch where they are embedded. Indeed, inside B0, hydrogen atoms dipoles tend to line up in the B0 direction so that, globally, they give origin to the induced magnetization vector M, oriented in the B0 direction. Due to B0 perturbation, realized by the application of a proper radio frequency pulse B1 perpendicular to B0, M rotates in the XY plane of B1 (that perpendicular to B0). Upon B1 removal, M tends to line up again to the B0 direction (relaxation) so that its XY component (MXY) diminishes with time and its component in the B0 direction (conventionally the vertical or Z one; MZ) increases in time. The mathematical description of the relaxation process (i.e. the MXY time reduction) is given by the solution of the magnetization diffusion equation proposed by Brownstein and Tarr [25, 26]:
| 5 |
where t is time, I(t) is the ratio between the time dependent value of MXY and its maximum value (MXYmax) occurring just after B1 removal, T2i represent the ith spin–spin or transverse relaxation times, while Ai are “weights” proportional to the number of hydrogen atoms whose dipoles relaxation is characterized by T2i. Equation (5) simply states that the relaxation process is the result of “m” exponential relaxation processes each one characterized by its own relaxation time (T2i) and weight (Ai). The determination of the unknown couples (T2i, Ai) was performed by Eq. (5) fitting to the experimental I(t) values (Is(t)), and the number, m, of exponential decays appearing in Eq. (5) was determined per the statistics applied in the Rheology section [21].
The average relaxation time (T2m) and the average inverse relaxation time ((1/T2)m), depending on several variables such as temperature, B0 strength, and the presence of a disperse phase in the system as it happens in hydrogel system [26], can be defined by:
| 6 |
when T2m is evaluated as the inverse of (1/T2)m, it is named T2mb.
While Eq. (5) provides the discrete relaxation time distribution represented by the m couples (Ai%-T2i), it is possible to determine the continuous distribution according to what suggested by Whittal and MacKay [27]:
| 7 |
where T2max (= 104 ms) and T2min (= 0.1 ms) indicate, respectively, the lower and upper values of the continuous T2 distribution, a(T2) is the unknown amplitude of the spectral component at the relaxation time T2, while exp{-t/T2} represents the decay term. Equation (7) represents the “continuous” expression of Eq. (5). This means that while Eq. (5) describes the MXY relaxation process by means of a limited (discrete) number of initially unknowns T2i, Eq. (7) makes use of a much higher number of known relaxation times belonging to the interval (T2min – T2max) and comprehending all the possible relaxation times characterizing the sample under study (continuous distribution of relaxation times).
In order to fit the experimental MXY time decay (Is(t)) by Eq. (7) and get the continuous T2 distribution (the unknowns Ai = ai(T2i)*T2i), the following discretization was applied [27]:
| 8 |
where the range of the T2 distribution (T2min – T2max) was logarithmically subdivided into N = 200 parts (higher N values were unnecessary). Because of the noise disturbing the measure of Is, the fitting procedure must not minimize the 2 statistic, but a smoothed definition of it () [27]:
| 9 |
where i is the ith datum standard deviation and is the weight of the smoothing term (second summation in Eq. (9)) proposed by Provencher [28]. Although different criteria can be used to determine , the strategy proposed by Wang [29] was applied. Based on this strategy, the correct value is that occurring just below the heel (slope variation) of the function ln(s) vs ln(). In the present work, = 150 was determined.
The discrete and continuous T2 distribution can be transformed into hydrogel mesh size distribution resorting to one of the fundamental relations of the low-field NMR field. This relation, based on the solution of the magnetization diffusion equation proposed by Brownstein and Tarr [25, 26], establishes the link between (1/T2)m and the ratio of the surface (S) of the dispersed/solubilized substances in the sample and the volume (V) of the sample water molecules:
| 10 |
where T2H2O is the bulk protons relaxation time (i.e. the water proton relaxation time in the absence of polymer, the so-called free water relaxation time ≈ 3700 ms at 37 °C and B0 = 0.47 T [30]) and M (length/time) is a physical parameter, named relaxivity, which represents the effect of the surface of polymer chains on water proton relaxation. Indeed, M is equal to the ratio between thickness and relaxation time of the bound water layer adhering to the solid surface. Equation (10), stating that (1/T2)m depends on (S/V), clearly establishes the relation between the relaxation time and the spatial organization of the sample network that heavily affects the S/V ratio [26]. For instance, in many polymeric systems, crosslinking induces a spatial reorganization of the polymeric chains contained in the original solution that involves the increase of the ratio S/V [31, 32]. This, in turn, reflects in the increase of (1/T2)m and in the decrease of T2m.
Despite its theoretical importance, Eq. (10) can be re-written in a more useful form, based on the fibre cell [26] and Scherer theories [33]. At this purpose, Abrami et al. [34] demonstrated that, for a hydrogel polymer volume fraction < 0.6, the term (S/V) can be expressed as a function of the average mesh size a of the polymeric network (error < 5%):
| 11 |
where C0 and C1 are two constants depending on the mesh architecture and equal, respectively, to 1 and 3 in the case of cubic mesh [33]. Thus, Eq. (10) becomes
| 12 |
while Eq. (12) refers, averagely, to all the polymeric network meshes, similar expressions can be written for meshes of different dimensions (i), assuming the M independence on the mesh size [26]:
| 13 |
where T2i is the relaxation time of water protons trapped in polymer meshes of size i. The bi-univocal correspondence between T2i and i only holds in the fast-diffusion regime (typical of gels), i.e. when the mobility of water molecules, expressed by their self-diffusion coefficient D (3.04 × 10⁻⁹ m2/s at 37 °C [35]), is large whether compared to the rate of magnetization loss (Rc × M) (i.e. Rc*M/D ≪ 1). In the slow diffusion regime, relaxation of all the water protons contained in the volume of a mesh of size i is not described by just one T2i but several T2i. Rc indicates the radial distance from the polymer chain axis where the effect of polymeric chains on water proton relaxation becomes negligible. This can be expressed by [26]
| 14 |
The combination of Eqs. (12) and (13) allows to conclude that the ratio between i and its average value, a, depends exclusively on the relaxation times T2i and T2m (except for the free water relaxation time T2H2O):
| 15 |
Thus, Eq. (5) or Eq. (8) fitting to experimental MXY decay (Is(t)) allows determining the discrete or continuous relaxation spectrum (Ai% − T2i), whereas Eq. (13) provides for the conversion into the discrete or continuous mesh size distribution of the sputum (Ai% − i).
LF-NMR measurements were performed at 37 °C by means of a Bruker Minispec mq20 (0.47 T, Germany). The determination of T2m was performed according to the CPMG sequence (Carr–Purcell–Meiboom–Gill) [36] {90°[-τ-180°-τ(echo)]n-TR} with a 8.36 μs wide 90° pulse, τ = 250 μs, and TR (sequences repetition rate) equal to 10 s. In order to obtain the final Is of 2%, the proper n was chosen. m was determined according to the statistics applied in the Rheology section [21]. Each spin-echo decay, composed by n points, was repeated 36 times (number of scans).
Drug diffusion
The walls of the bronchial tree are covered by a very thin layer of a water-like serous fluid, the periciliary liquid (PCL), where cells cilia beat with a typical frequency of 20 Hz and amplitude about 5 m. On the top of PCL, a thin layer of a non-Newtonian viscoelastic fluid lies, named mucus [37] (see Fig. 1).
Fig. 1.
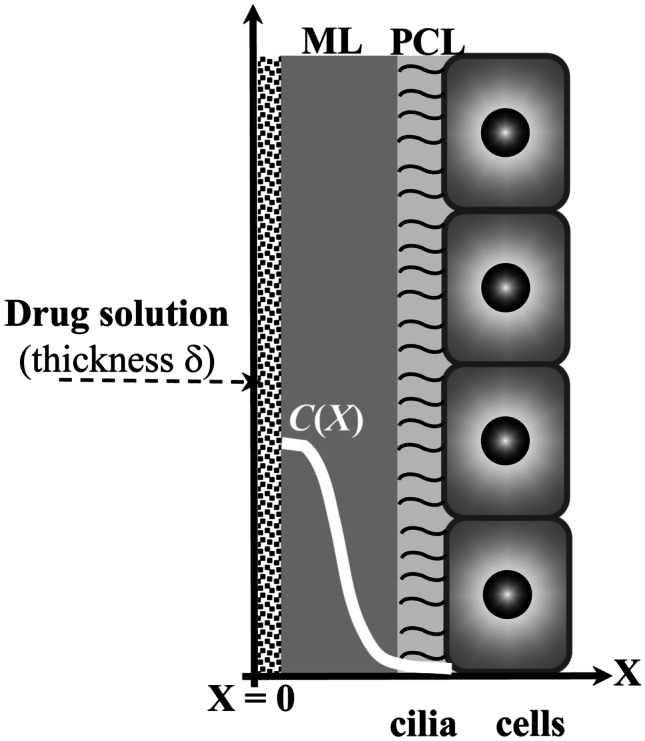
The airway surface liquid (ASL) lining the walls of the bronchial tree is composed by the periciliary liquid (PL), where cells cilia beat, and by the mucus layer (ML). When a drug solution is inhaled, it spreads on the ML, and the drug can diffuse inside the ASL. White line indicates the hypothetical drug concentration profile inside ASL
PCL and mucus layer (ML) constitute the airway surface liquid (ASL) [38]. The viscoelastic nature of mucus depends on the presence of different components such as proteins, alginates, white blood cells, DNA, bacteria and mucin (whose levels are pathologically increased compared with healthy subjects [39]) that lead to a three-dimensional network [40]. Drug permeation inside the ASL is a complex phenomenon affected by many factors such as the thickness of ASL, which depends on the ASL rheological properties and the airflow [37, 41, 42]. Moreover, possible interactions (e.g. electrostatic and hydrogen bonding) between the diffusing drug and the polymeric components of the ALS cannot be a priori excluded [43]. Furthermore, as ASL is not homogeneous, the drug diffusion coefficient (D) should be position dependent [42]. However, assuming that drug transport is mainly affected by diffusion with constant D, the prediction of the drug penetration inside ASL can be obtained by referring to the one-dimensional Fick’s equation with proper initial and boundary conditions. In detail, it is assumed that at time zero (deposition of drug solution on ASL, following inhalation), the drug is not present inside ASL, and it is uniformly distributed, at the known concentration C0, in the solution layer of thickness (see Fig. 1). Boundary conditions involve the existence of an impermeable wall in X = 0 (the drug cannot diffuse in the X negative direction) and the possibility of drug diffusion in the positive X direction up to infinite (therefore, the drug can diffuse inside cells, too). According to these hypotheses, the time evolution of the drug profile concentration (C) inside ASL is determined by
| 16 |
where t is time. The D value to be used in Eq. (15) can be provided by the Lusting-Peppas equation [44] as per Abrami et al. [23]:
| 17 |
where rs is the radius of the drug molecule imagined to be a sphere, D0 is the drug diffusion coefficient in water, while Y is a model parameter that, lacking further information, can be set equal to 1 [44], although it usually ranges between 3 and 30 [45, 46] (see Appendix 1 for some considerations on the potentiality of Eq. (17)). The solid volume fraction φ was set equal to 0.05, this being the most common situation, albeit variability can occur among samples [47]. For what concerns rs and D0, with an attention focus on typical antibiotics used for FC patients (ciprofloxacin and tobramycin, for example [48]), reasonable values are 1.1 nm and 3 × 10⁻¹⁰ m2/s, respectively [49, 50]. Moreover, it is worth mentioning that while the PCL thickness ranges between 5 and 10 m [51], in healthy subjects and in CF patients, ML thickness is similar and, approximately, equal to 25–30 m [37, 52]. Vice-versa, patients affected by chronic obstructive pulmonary diseases (COPD) exhibit an ML thickness value up to 300 m [41].
Statistical analysis
The nature of the experimental data distribution (normal or not) was evaluated by the Kolmogorov–Smirnov test (KS-test). Based on KS-test results, the Spearman’s correlation coefficient (rsp) was considered to verify possible direct or inverse correlations among T2m, FEV1 and G. Correlations among variables were considered significant when p <0.05, corresponding to a probability of 95%. Lower probability was associated to a lack of correlation among variables.
Results and discussion
Figure 2 remarkably shows that there is a statistically significant correlation between T2m measured in CF sputum and FEV1 before (dark circles; rsp = 0.69, p = 0.006) and after (white circles; rsp = 0.44, p = 0.044) chest physiotherapy. As lung functionality increases with FEV1 [53], Fig. 2 indicates that T2m increase is connected with improved patient clinical conditions. Moreover, the inspection of Fig. 2 reveals that, on average, after chest physiotherapy, T2m is higher.
Fig. 2.
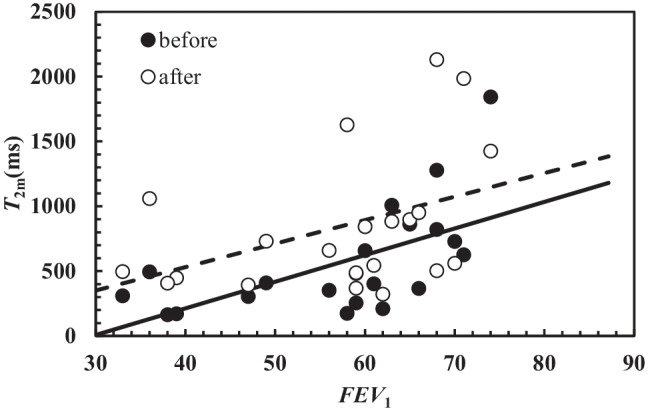
Correlation between T2m and FEV1 before (black circles) and after (white circles) chest physiotherapy. In both cases, the correlation is statistically significant (before: rsp = 0.69, p = 0.006; after rsp = 0.44, p = 0.044). The linear relation occurring between T2m and FEV1 is represented by solid line (before: T2m(ms) = (20.5 ± 6.3) × FEV1 – (609 ± 366)) and dashed line (after: T2m(ms) = (18.1 ± 9.0) × FEV1 – (193 ± 526))
Indeed, the dashed line (connected with the T2m vs FEV1 trend after chest physiotherapy) is characterized by a higher intercept with respect to solid line (connected with the T2m vs FEV1 trend after chest physiotherapy), and the two straight lines share, approximately, the same slope. Thus, the beneficial action of chest physiotherapy is clearly evident.
Interestingly, similar correlations between T2mb (average relaxation time evaluated as the inverse of (1/T2)m) and FEV1 have been determined both before and after chest physiotherapy as shown on Fig. 3.
Fig. 3.
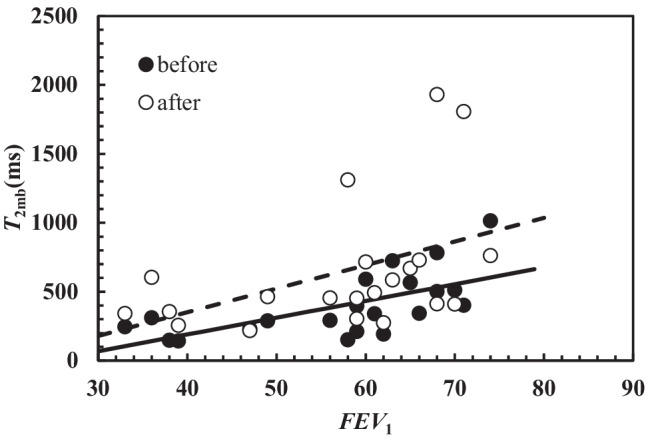
Correlation between T2mb and FEV1 before (dark circles) and after (white circles) chest physiotherapy. In both cases, the correlation is statistically significant (before: rsp = 0.73, p = 0.0002; after rsp = 0.51, p = 0.019). The linear relation occurring between T2mb and FEV1 is represented by solid line (before: T2mb(ms) = (12.2 ± 3.3) × FEV1 – (295 ± 195)) and dashed line (after: T2mb(ms) = (17.1 ± 8.0) × FEV1 – (333 ± 464))
This finding is due to the strong correlation existing between T2m and T2mb (rsp = 0.97, p <0.0001), as per Fig. 4 for all the analysed samples. Even though considering separately the samples before and after chest physiotherapy, the same strong correlation is demonstrated too.
Fig. 4.
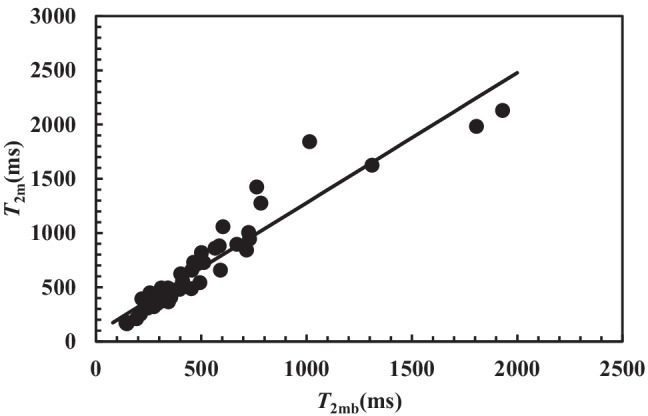
Statistically significant correlation between T2m and T2mb referring to all the 42 samples considered (rsp = 0.97, p < 0.0001). Solid line represents the linear interpolant: T2m(ms) = (1.2 ± 0.06) × T2mb + (78 ± 41)
Thus, for what concerns the evaluation of lung functionality in relation to FEV1, both T2m and T2mb can be chosen as indicators of patient clinical conditions. Figure 5 shows the significant inverse correlation between T2m and the shear modulus G on the samples both before and after chest physiotherapy (rsp = −0.58, p = 0.0001). These evidences support the beneficial effects of chest physiotherapy. Indeed, at fixed G, Fig. 5 shows that chest physiotherapy leads to a higher T2m (see the solid and dashed lines in Fig. 5). An additional and conclusive proof of chest physiotherapy benefit is displayed in Fig. 6. This picture reports the %, relative (compared to the value before chest physiotherapy, T2mBef) variation (T2m) of T2m versus the %, relative (with respect to the value before chest physiotherapy, GBef) variation (G) of G. It is possible to detect that in the 57.1% of the cases (section I in Fig. 6), chest physiotherapy leads to both an increase of T2m and a decrease of G, which indicates the partial breakage of the original mucus polymeric network that yields to a weaker nanostructure. Indeed, the combination of Eqs. (3), (4) and (12) evidences that T2m (or T2mb) is inversely proportional to G1/3. Therefore, network damaging is due to a T2m increase, as per G decrease due to a reduction of crosslink density (see Eq. (3)). The direct correlation between T2m and FEV1 evidences that nanostructure variation indicates a better lung functionality. Figure 6, section IV shows that in the 23.9% of the cases, chest physiotherapy determines an increase both in T2m and G. This behaviour could be explained assuming that the increase of sputum stiffness is not due to the increase of the crosslink density, but to the increase of polymeric fibres strength as the polymeric chains group into thicker fibres (see Fig. 6). This perfectly matches with G and T2m increase, as T2m rises with the decrease of the ratio between the solid (fibres) surface (S) in contact with water molecules and the hydrogel water molecule volume (V) as per Eq. (10) [22, 54].
Fig. 5.
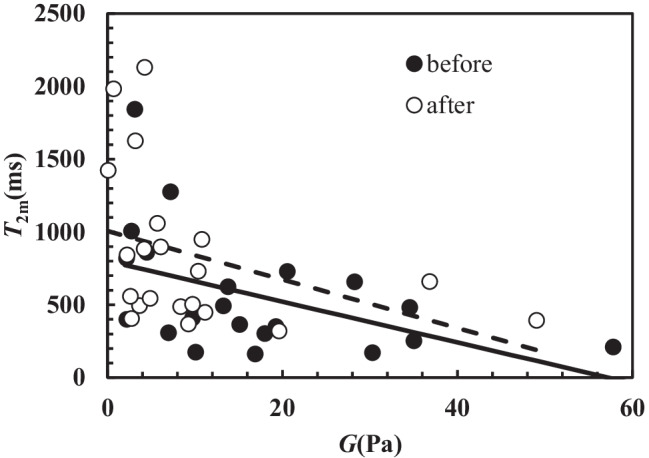
Correlation between T2m and G. Dark circles indicate samples before chest physiotherapy, while white circles refer to samples after chest physiotherapy. A statistically significant correlation between T2m and G occurs both before (rsp = −0.53, p = 0.014; T2m(ms) = −(14.0 ± 6.0) × G(Pa) + (801 ± 131); solid line) and after (rsp = −0.495, p = 0.023; T2m(ms) = −(14.6 ± 9.3) × G(Pa) + (1006 ± 143); dashed line) chest physiotherapy. The overall correlation is statistically significant (rsp = −0.58, p = 0.0001; T2m(ms) = −(16.8 ± 5.2) × G(Pa) + (928 ± 97))
Fig. 6.
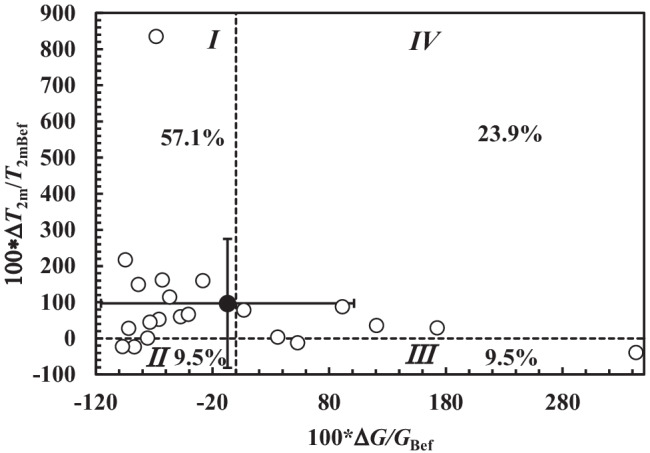
Relative percentage variation of the relaxation time (100*T2m/T2mBef) versus the relative percentage variation of the shear modulus (100*G/GBef) considering samples after and before chest physiotherapy (open circles). Black circle indicates the average value of 100*T2m/T2mbef and 100*G/Gbef, while vertical and horizontal solid lines indicate the associated standard deviation in the vertical and horizontal direction
Figure 6 section II reveals that in 9.5% of the cases, chest physiotherapy determines both G and T2m reduction. This proves the increase of the crosslink density, which takes place among thinner and weaker fibres. In the 9.5% of the cases, chest physiotherapy determines a G increase and T2m decrease (Fig. 6 section III). In this case, T2m decrease and G increase could be related to mesh size reduction. Overall, the effect of chest physiotherapy on sputum nanostructure is positive, as it determines the average T2m increase and the average G decrease (see the black dot in section I of Fig. 6). Figure 7 qualitatively sums up the effect of chest physiotherapy on the sputum nanostructure, based on the relative variations of T2m and G shown in Fig. 6.
Fig. 7.
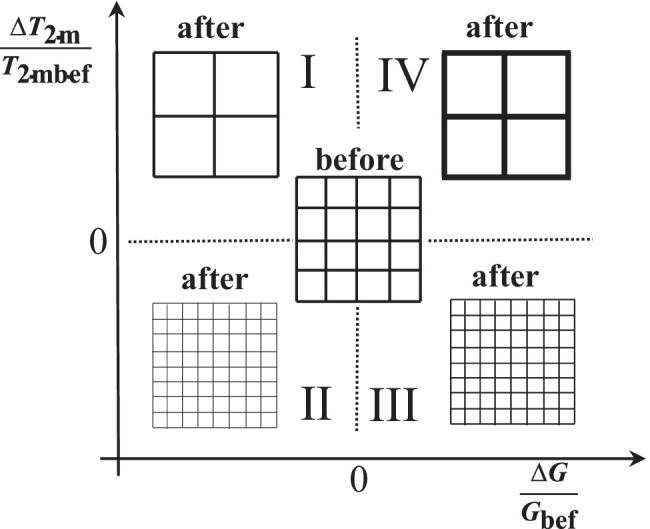
Qualitative effect of chest physiotherapy on sputum nanostructure deduced by the percentage variation of the relaxation time (100*T2m/T2mbef) and the relative percentage variation of the shear modulus (100*G/Gbef) (sections I–IV are those of Fig. 6). Depending on the relative variation of T2m and G, different mucus nanostructures can be supposed
It is of outmost importance to remind that all the above considerations relay on the interpretation of experimental results in the light of Eqs. (3), (4) and (12). Thus, other experimental techniques (such as TEM/SEM or other image techniques) will be considered. However, the complex nature of CF sputum nanostructure, reported in Fig. 8, and the issues connected to the reliable acquisition and interpretation of images [55–57] make this task absolutely challenging.
Fig. 8.
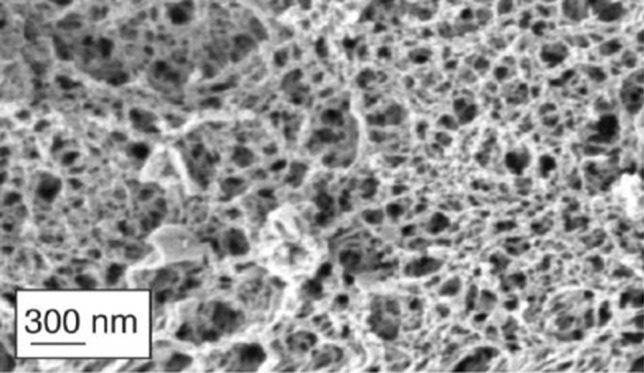
Nanostructure of CF sputum. The complexity of CF nanostructure is increased by the presence of DNA, cell debris and bacteria (not visible in this figure). (
Adapted from Ref [58] with permission from FutureScience)
Moreover, for what concerns the image analysis, the presence of DNA, cell debris and bacteria can create an extremely complex scenario. On the other hand, this is not a problem for the proposed combined approach (rheology and LF-NMR) as the presence of additional components just alters the S/V ratio (see Eq. (10)) that reflects in a variation of T2m. Similarly, the presence of additional components affects the sputum rheological behaviour reflecting in alterations of G’ (shall they represent physical or chemical bonds among different polymeric chains) or G’’ (shall they stay in the sputum sol fraction). Thus, the presence of DNA, cell debris and bacteria is accounted for by our approach, and it is interpreted as a sort of network architecture modifications.
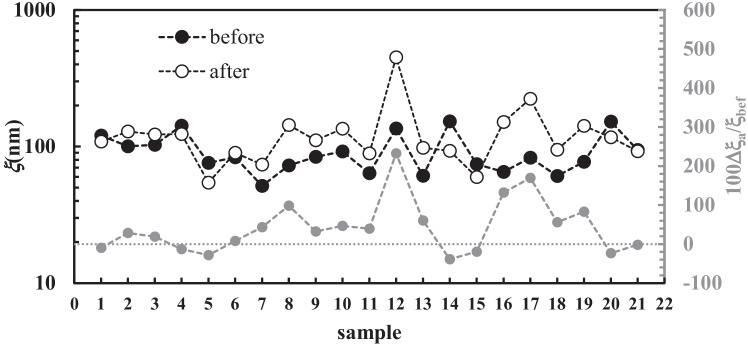
The general soundness of the presented approach is proved by Figs. 9 and 10 showing, respectively, the average mesh size (a) of all samples and the continuous mesh size distribution referring to sample 11 before and after chest physiotherapy (see Table 1 in Appendix 2). Indeed, according to Hanes and co-workers [58, 59], who applied a sophisticated particles tracking methods, the mesh size distribution of the CF sputum network ranges between 60 and 300 nm, with a mean value of (145 ± 50) nm. Figure 9 shows that, except for one case, a refers to the range of 50–250 nm, i.e. within the range indicated by Hanes and co-workers. Moreover, Fig. 10 shows that before chest physiotherapy (unperturbed sputum), the continuous mesh size distribution spans between 20 and 300 nm, perfectly matching Hanes and co-workers findings. Thus, the two different strategies (our bulk rheology-LF-NMR and Hanes’ particle tracking) provide similar results.
Fig. 9.
Variation of the average mesh size (a) for the 21 samples considered (black circles, before chest physiotherapy; white circles after chest physiotherapy). Grey circles indicate the relative percentage variation of the average mesh size a (secondary vertical axis)
Fig. 10.
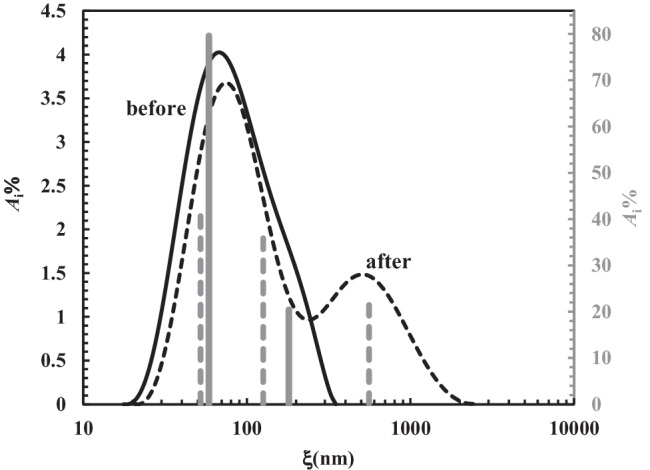
Comparison between the continuous mesh size distribution before (solid black curve) and after (dashed black line) chest physiotherapy referring to samples 11 (see Table 1). Solid grey vertical lines (secondary vertical axis on the right) indicate the discrete mesh size distribution referring the solid black curve. Dashed grey vertical lines (secondary vertical axis on the right) indicate the discrete mesh size distribution referring the dashed black curve
Figure 9 also allows to sum up the effect of chest physiotherapy on sputum nanostructure. Indeed, Fig. 9 suggests that, on average, chest physiotherapy leads to an increase of a, as its relative variation (100a/bef) is mainly positive. Conversely, negative variations are limited in their amplitude (grey circles), with reference to positive ones (see dotted grey line). As per Eqs. (8) and (15), it is possible to determine the variation of the continuous mesh size distribution, based on chest physiotherapy treatment. Figure 10 shows, e.g. this comparison in the case of samples 11 (see Table 1 in Appendix 2).
It is possible to notice that chest physiotherapy pushes towards higher mesh size values () the entire mesh size distribution (compare the black solid line and dashed black line). It also provides for changes in the shape of the distribution, making more evident the second peak, which is just slightly visible before the treatment. This is a pivotal hallmark: the second peak, moving from, about, 200 nm to 500 nm, refers to mesh size range which is typical of healthy sputum.
Moreover, Fig. 10 clearly proves that about 20% of the mesh size distribution is on the normal range size (dashed black line), while, before chest physiotherapy (continuous solid line), 100% of the mesh size refers to the pathological range. Therefore, both before and after chest physiotherapy, the discrete mesh size distribution (grey vertical lines) results in a trend of the continuous one.
Drug delivery through mucus is a complex phenomenon which is on stage for researchers, with a main focus of the current COVID period the world is facing [16–18, 60]. For what concerns drug (e.g. antibiotics, anti-inflammatory and mucolytics) administration by inhalation and in order to achieve this task, detailed information about mesh size are of key importance. Indeed, the entire delivery process implies different steps such as drug deposition on ASL (airway surface liquid, sum of the periciliary liquid and mucus layers) and drug diffusion throughout it. Modern strategies ensure that within, about, 7 min, the administered aerosol can get the ASL [61, 62]. In the light of the simplifying hypotheses on which Eq. (16) relies, we would like to simulate the kinetics of the drug diffusion process inside ASL. At this purpose, the drug diffusion coefficient D was evaluated according to Eq. (17) assuming the values of the model parameters (φ = 0.05, rs = 1.1 nm, D0 = 3 × 10⁻¹⁰ m2/s) presented in the “Diffusion” section. Moreover, the average mesh size was fixed equal to the average value (92 nm) reported in Table 1; Y was set equal to 3 or 30 to account for two limiting conditions and = 3 m. When Y = 3 (this corresponding to a higher drug diffusivity D = 2.5 × 10⁻¹⁰ m2/s), Fig. 11A reveals that within few seconds, the drug can cross the ASL typical thickness of healthy subjects and CF patients (≈ 30 m).
Fig. 11.
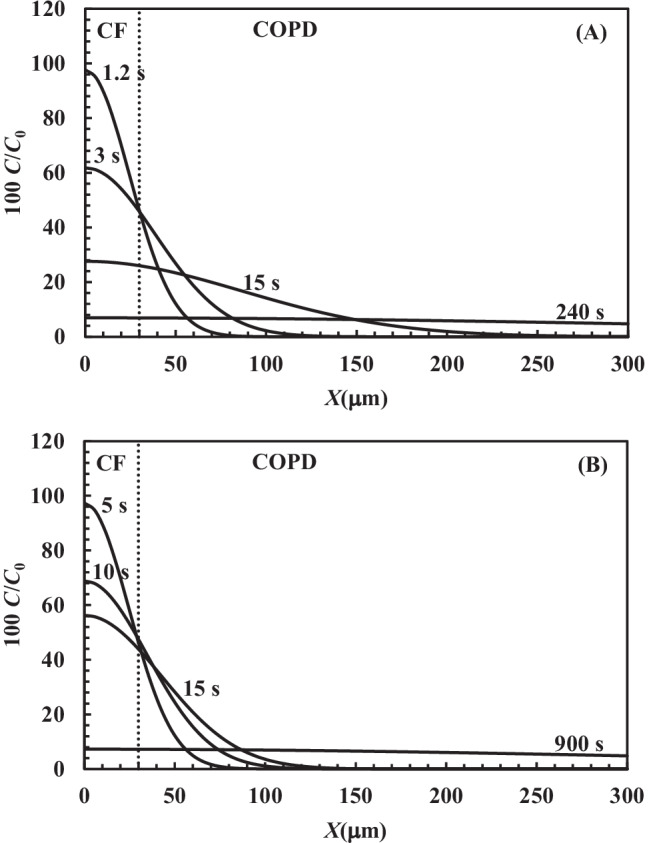
Drug profile concentration (C/C0, solid line) inside ASL thickness at different times according to Eq. (16) assuming = 3 m. The drug diffusion coefficient has been evaluated according to Eq. (17) assuming φ = 0.05, rs = 1.1 nm, D0 = 3 × 10⁻¹⁰ m2/s and A Y = 3 (D = 2.5 × 10⁻¹⁰ m2/s) or B Y = 30 (D = 0.6 × 10⁻¹⁰ m2/s)
Indeed, the dimensionless concentration C/C0 achieves about 50% of the initial solution concentration at the ASL bottom in a very short time (see the profile concentration curves labelled 1.2 and 3 s in Fig. 11A). For longer times, the C/C0 profile assumes a flatter shape (see the 15 s labelled curve in Fig. 11A) and a uniform distribution is achieved after 240 s through the ASL thickness competing to COPD (chronic obstructive pulmonary diseases) patients (300 m). COPD has been considered as it is due to an acquired CFTR impairment, resulting in increased lung mucus viscosity similarly to CF. Considering Y = 30, this value represents a lower value of the diffusion coefficient (D = 0.6 × 10⁻¹⁰ m2/s). Figure 11B reveals that the diffusion process is slowed down, but C/C0 is about 50% at a penetration depth of 30 m after 5 s. Moreover, 900 s are required to get a flat concentration profile up to 300 m, i.e. the ASL thickness which can be detected in COPD patients. Thus, in the case of CF patients, these simulations indicate that the drug can diffuse on the ASL thickness in a few seconds. On the other hand, in the case of COPD patients, 6–15 min are required to get the same effect if ASL thickness is about 300 m. It is worth to mention that the values of the diffusion coefficients therein reported, assuming Y = 3 or 30 (2.5 × 10⁻¹⁰ m2/s and 0.6 × 10⁻¹⁰ m2/s, respectively), approximately represent the maximum and minimum D range which can be determined by the experimental permeability data through mucus performed by Bhat and co-workers [17, 18] that span from 2.4 × 10⁻¹⁰ m2/s down to 0.7 × 10⁻¹⁰ m2/s.
In the case of CF patients, drug diffusion through mucus is not the rate determining step of the whole delivery process. In the worst conditions for COPD patients, drug diffusion can be compared to the inhalation time. However, in both cases, the time required for drug diffusion is short, this witnessing the promising role of inhalation to match pulmonary diseases.
Conclusions
The characterization of the sputum of CF by the combined use of rheology and LF-NMR allowed getting information about the nanostructure of sputum derived from the mucus lining the bronchial tree. In particular, this analysis was aimed to determine sputum nanostructure variations, as a result of chest physiotherapy, a routine procedure adopted in CF patients. We could verify that significant nanostructure variations occurred upon chest physiotherapy, leading to beneficial clinical effects for the patients. Interestingly, the combined use of rheology and LF-NMR allowed to define the nanostructure characteristics that each technique (if used singularly) would have never been able to provide. Moreover, assuming that drugs diffuse inside mucus according to Fick’s law, as well as in the sputum nanostructure, we could determine that in the case of healthy subjects and CF patients, about 7 min from inhalation are needed to get the drug active inside the mucus, i.e. a very short time. In case of COPD patients, this time has been estimated to about 15 min in the worst situation (300 m ASL thickness). Anyway, in both cases, the time required to get drug action since inhalation resulted to be short. Therefore, the inhalation delivery demonstrated a key role to provide for effective info about pulmonary diseases, such as those afflicting CF and COPD patients.
Appendix 1
The approximation of the Scherer theory [33] by Abrami and co-workers [34] allows to provide a simple relation between the average mesh size a, the polymer volume fraction φ and the polymeric chains radius rf:
| 18 |
where C1 and C0 are two constants depending on the network architecture (cubical, tetrahedral or octahedral) whose values are defined by the Scherer theory ([33]; for a cubical network, C0 = 1 and C1 = 3). The combination of Eq. (18) and Eq. (17) allows expressing the ratio D/D0 as function of the polymer volume fraction (φ) or the average mesh size (a):
| 19 |
| 20 |
Figure 12, Eq. (18) shows Eqs. (19) and (20) trend assuming different values of the ratio rs/rf.
Fig. 12.
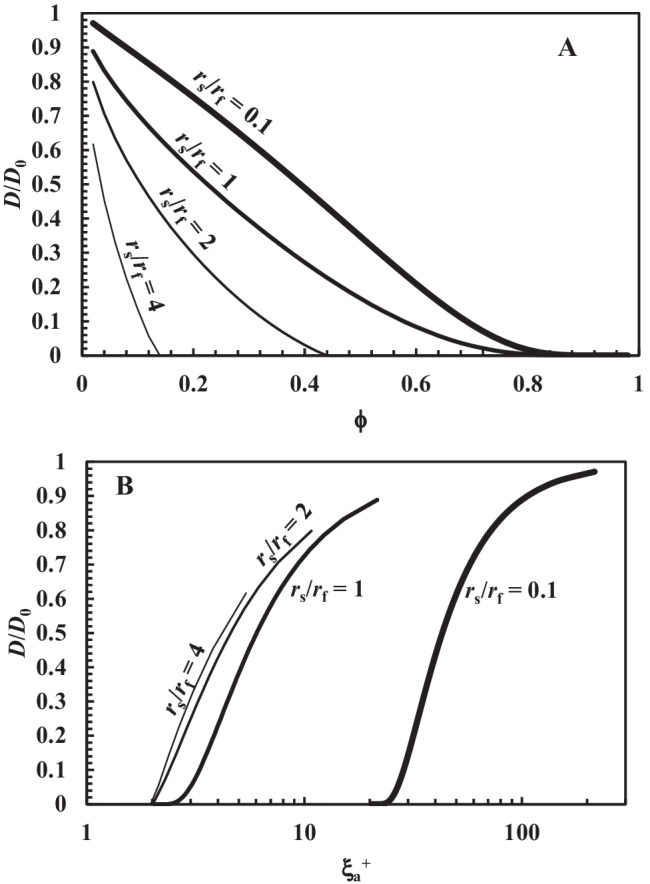
A Variation of the ratio D/D0 according to Eq. (18) and B Eq. (19) assuming different values of the ratio between the drug molecule radius (rs) and the radius (rf) of the fibres constituting the polymeric network pervading the hydrogel. These simulation refer to a cubical mesh organization (C0 = 1; C1 = 3 [33])
The advantage connected with the use of these equations consists in the possibility of simultaneously accounting for both the effect of volume fraction and average mesh size on drug diffusivity, an aspect, usually not explicitly dealt with in literature.
Appendix 2
Table 1.
Shear modulus (G), average mesh size (a), average value of the inverse relaxation time ((1/T2)m), and percentage (Ai%) of the different relaxation times T2i and mesh size i
| Sample | G(Pa) | a (nm) | (1/T2)m ms−1 | A i% | T2i(ms) | i(nm) |
|---|---|---|---|---|---|---|
| Before chest physiotherapy | ||||||
| 1 | 4.5 | 120 | 1.767 × 10⁻³ | 17.5 | 2182 | 961 |
| 42.8 | 798 | 183 | ||||
| 39.7 | 344 | 68 | ||||
| 2 | 7 | 100 | 4.079 × 10⁻³ | 19.4 | 612 | 280 |
| 65.8 | 261 | 107 | ||||
| 14.8 | 119 | 47 | ||||
| 3 | 7.2 | 103 | 1.278 × 10⁻³ | 43.6 | 2095 | 501 |
| 41.3 | 775 | 102 | ||||
| 15.1 | 281 | 31 | ||||
| 4 | 2.7 | 142 | 1.379 × 10⁻³ | 34.5 | 1463 | 429 |
| 43.9 | 730 | 161 | ||||
| 21.6 | 292 | 56 | ||||
| 5 | 18 | 76 | 4.360 × 10⁻³ | 6.9 | 955 | 400 |
| 42.6 | 365 | 125 | ||||
| 50.5 | 162 | 52 | ||||
| 6 | 15 | 83 | 2.910 × 10⁻³ | 31.5 | 511 | 130 |
| 68.5 | 299 | 71 | ||||
| 7 | 58 | 51 | 5.200 × 10⁻³ | 56.9 | 261 | 71 |
| 43.1 | 143 | 38 | ||||
| 8 | 21 | 72 | 1.952 × 10⁻³ | 32.9 | 1218 | 222 |
| 51.6 | 575 | 83 | ||||
| 15.5 | 197 | 25 | ||||
| 9 | 13 | 84 | 3.219 × 10⁻³ | 24.2 | 1047 | 362 |
| 42.6 | 435 | 122 | ||||
| 33.2 | 165 | 43 | ||||
| 10 | 10 | 92 | 6.645 × 10⁻³ | 21.5 | 330 | 212 |
| 78.5 | 131 | 79 | ||||
| 11 | 30 | 64 | 7.014 × 10⁻³ | 20.4 | 355 | 169 |
| 79.6 | 124 | 55 | ||||
| 12 | 3 | 135 | 0.985 × 10⁻³ | 53.7 | 2780 | 1089 |
| 29.4 | 989 | 131 | ||||
| 16.9 | 341 | 36 | ||||
| 13 | 34 | 61 | 2.523 × 10⁻³ | 22.7 | 866 | 155 |
| 71.0 | 389 | 60 | ||||
| 6.3 | 145 | 21 | ||||
| 14 | 2 | 153 | 1.994 × 10⁻³ | 16.7 | 1831 | 956 |
| 45.3 | 861 | 296 | ||||
| 32.3 | 364 | 106 | ||||
| 5.7 | 117 | 32 | ||||
| 15 | 19 | 74 | 3.434 × 10⁻³ | 40.7 | 502 | 136 |
| 50.9 | 270 | 68 | ||||
| 8.4 | 115 | 28 | ||||
| 16 | 28 | 65 | 1.692 × 10⁻³ | 39.4 | 935 | 116 |
| 60.6 | 476 | 51 | ||||
| 17 | 14 | 83 | 2.486 × 10⁻³ | 10.5 | 2033 | 830 |
| 62.0 | 571 | 124 | ||||
| 27.5 | 204 | 40 | ||||
| 18 | 35 | 61 | 4.729 × 10⁻³ | 8.4 | 632 | 206 |
| 70.2 | 248 | 72 | ||||
| 21.4 | 121 | 34 | ||||
| 19 | 17 | 77 | 6.794 × 10⁻³ | 13.1 | 353 | 197 |
| 52.7 | 133 | 70 | ||||
| 34.2 | 139 | 73 | ||||
| 20 | 2 | 152 | 2.936 × 10⁻³ | 18.4 | 680 | 338 |
| 62.6 | 384 | 174 | ||||
| 19.0 | 183 | 78 | ||||
| 21 | 10 | 94 | 3.462 × 10⁻³ | 21.1 | 875 | 345 |
| 55.3 | 343 | 114 | ||||
| 23.6 | 147 | 46 | ||||
| After chest physiotherapy | ||||||
| 1 | 6 | 108 | 1.494 × 10⁻³ | 15.0 | 2191 | 716 |
| 52.8 | 828 | 142 | ||||
| 32.2 | 408 | 61 | ||||
| 2 | 3.7 | 100 | 2.926 × 10⁻³ | 20.5 | 1108 | 541 |
| 44.6 | 441 | 171 | ||||
| 34.9 | 202 | 73 | ||||
| 3 | 4.3 | 122 | 0.518 × 10⁻³ | 86.0 | 2322 | 189 |
| 14.0 | 946 | 38 | ||||
| 4 | 4.2 | 142 | 1.708 × 10⁻³ | 38.3 | 1463 | 429 |
| 32.4 | 730 | 161 | ||||
| 29.3 | 292 | 56 | ||||
| 5 | 49.5 | 54 | 4.576 × 10⁻³ | 14.1 | 1224 | 428 |
| 22.5 | 483 | 130 | ||||
| 45.4 | 205 | 51 | ||||
| 18.0 | 101 | 24 | ||||
| 6 | 11 | 90 | 1.371 × 10⁻³ | 30.5 | 1632 | 289 |
| 60.2 | 699 | 85 | ||||
| 9.3 | 287 | 31 | ||||
| 7 | 19.6 | 74 | 3.628 × 10⁻³ | 23.5 | 500 | 143 |
| 66.7 | 288 | 77 | ||||
| 9.8 | 116 | 30 | ||||
| 8 | 2.6 | 144 | 2.435 × 10⁻³ | 20.0 | 1117 | 498 |
| 61.0 | 492 | 177 | ||||
| 19.0 | 187 | 61 | ||||
| 9 | 5.7 | 84 | 1.657 × 10⁻³ | 36.4 | 1924 | 618 |
| 33.8 | 812 | 160 | ||||
| 29.8 | 283 | 47 | ||||
| 10 | 3.2 | 135 | 0.763 × 10⁻³ | 57.2 | 2067 | 312 |
| 36.6 | 1152 | 111 | ||||
| 6.2 | 368 | 27 | ||||
| 11 | 11 | 89 | 3.903 × 10⁻³ | 21.5 | 1176 | 557 |
| 37.6 | 352 | 126 | ||||
| 40.9 | 154 | 52 | ||||
| 12 | 0.1 | 450 | 1.311 × 10⁻³ | 36.1 | 2439 | 3364 |
| 35.7 | 1194 | 827 | ||||
| 21.9 | 487 | 263 | ||||
| 6.3 | 152 | 74 | ||||
| 13 | 8.4 | 98 | 2.210 × 10⁻³ | 46.2 | 628 | 143 |
| 53.8 | 365 | 77 | ||||
| 14 | 9.7 | 93 | 2.425 × 10⁻³ | 14.7 | 979 | 267 |
| 67.5 | 477 | 110 | ||||
| 17.8 | 207 | 44 | ||||
| 15 | 36.8 | 60 | 2.197 × 10⁻³ | 18.0 | 1540 | 304 |
| 47.8 | 609 | 84 | ||||
| 34.2 | 264 | 33 | ||||
| 16 | 2.3 | 151 | 1.399 × 10⁻³ | 9.5 | 1797 | 597 |
| 45.4 | 968 | 224 | ||||
| 45.1 | 514 | 102 | ||||
| 17 | 0.7 | 223 | 0.554 × 10⁻³ | 72.6 | 2296 | 384 |
| 27.4 | 1153 | 106 | ||||
| 18 | 9.3 | 94 | 3.288 × 10⁻³ | 66.0 | 342 | 107 |
| 17.7 | 667 | 232 | ||||
| 16.3 | 149 | 44 | ||||
| 19 | 2.7 | 142 | 2.818 × 10⁻³ | 42.8 | 581 | 249 |
| 57.2 | 275 | 107 | ||||
| 20 | 4.9 | 117 | 2.027 × 10⁻³ | 73.8 | 627 | 155 |
| 26.2 | 308 | 69.0 | ||||
| 21 | 10.4 | 92 | 2.155 × 10⁻³ | 32.5 | 1386 | 386 |
| 46.0 | 509 | 103 | ||||
| 21.5 | 211 | 39 | ||||
Author contribution
M. Abrami, M. Maschio, M. Conese, M. Confalonieri, M. Grassi and G. Grassi conceived the paper. M. Grassi, G. Grassi and G. Milcovich wrote the paper with the support of M. Maschio, M. Grassi and G. Grassi. G. Milcovich and A. Biasin took care of text critical revision, re-editing and re-writing. M. Conese, M. Confalonieri, M. Abrami and C. Fornasier executed the experimental tests. A. Adrover took care of all the statistical aspects. F. Gerin took care of sample collection, storing and transfer to the LF-NMR laboratory. F. Salton, B. Dapas and R. Farra ensured the connection between the different laboratories involved and critically reviewed paper draft. All authors equally contributed to the definition of the experimental plan.
Funding
Open access funding provided by Università degli Studi di Trieste within the CRUI-CARE Agreement. This paper has been financed by Fondazione CRT Trieste project n°103069 and by the so-called Programma di valorizzazione dei brevetti del sistema universitario del Friuli Venezia Giulia, Unity FVG PoC, 2020, Italy.
Availability of data and materials
Where not directly provided in the paper, all the data referring to this paper are available upon request to the corresponding author.
Declarations
Ethics approval and consent to participate
Sputum samples were provided by the Burlo Garofolo Hospital, following a procedure approved by the Ethics Committee (prot n. 496/2916, CI M-11, 22–3-2016). Written informed consent was obtained from each patient.
Consent for publication
Not applicable.
Competing interests
The authors declare no competing interests.
Footnotes
Publisher's Note
Springer Nature remains neutral with regard to jurisdictional claims in published maps and institutional affiliations.
Change history
7/17/2022
Missing Open Access funding information has been added in the Funding Note.
References
- 1.Farrell PM. The prevalence of cystic fibrosis in the European Union. J Cyst Fibros. 2008;7:450–453. doi: 10.1016/j.jcf.2008.03.007. [DOI] [PubMed] [Google Scholar]
- 2.Ciofu O, Tolker-Nielsen T, Jensen PO, Wang H, Hoiby N. Antimicrobial resistance, respiratory tract infections and role of biofilms in lung infections in cystic fibrosis patients. Adv Drug Deliv Rev. 2015;85:7–23. doi: 10.1016/j.addr.2014.11.017. [DOI] [PubMed] [Google Scholar]
- 3.Cystic Fibrosis Foundation Patient Registry 2014 Annual Data Report, Bethesda, Maryland, 2015 Cystic Fibrosis Foundation; Cystic Fibrosis Foundation Patient Registry 2019 Annual Data Report, Bethesda, Maryland, 2020 Cystic Fibrosis Foundation.
- 4.Emerson J, Rosenfeld M, McNamara S, Ramsey B, Gibson RL. Pseudomonas aeruginosa and other predictors of mortality and morbidity in young children with cystic fibrosis. Pediatr Pulmonol. 2002;34:91–100. doi: 10.1002/ppul.10127. [DOI] [PubMed] [Google Scholar]
- 5.Fyfe JA, Govan JR. Alginate synthesis in mucoid Pseudomonas aeruginosa: a chromosomal locus involved in control. J Gen Microbiol. 1980;119:443–450. doi: 10.1099/00221287-119-2-443. [DOI] [PubMed] [Google Scholar]
- 6.Govan JR, Deretic V. Microbial pathogenesis in cystic fibrosis: mucoid Pseudomonas aeruginosa and Burkholderia cepacia. Microbiol Rev. 1996;60:539–574. doi: 10.1128/mmbr.60.3.539-574.1996. [DOI] [PMC free article] [PubMed] [Google Scholar]
- 7.Folkesson A, Jelsbak L, Yang L, Johansen HK, Ciofu O, Hoiby N, Molin S. Adaptation of Pseudomonas aeruginosa to the cystic fibrosis airway: an evolutionary perspective. Nat Rev Microbiol. 2012;10:841–851. doi: 10.1038/nrmicro2907. [DOI] [PubMed] [Google Scholar]
- 8.Posocco B, Dreussi E, de Santa J, Toffoli G, Abrami M, Musiani F, Grassi M, Farra R, Tonon F, Grassi G, Daps B. Polysaccharides for the delivery of antitumor drugs. Materials. 2015;8:2569–2651. doi: 10.3390/ma8052569. [DOI] [Google Scholar]
- 9.Yang D, Jones KS. Effect of alginate on innate immune activation of macrophages. J Biomed Mater Res A. 2009;90:411–418. doi: 10.1002/jbm.a.32096. [DOI] [PubMed] [Google Scholar]
- 10.Iwamoto M, Kurachi M, Nakashima T, Kim D, Yamaguchi K, Oda T, Iwamoto Y, Muramatsu T. Structure–activity relationship of alginate oligosaccharides in the induction of cytokine production from RAW264.7 cells. FEBS Lett. 2005;579:4423–29. 10.1016/j.febslet.2005.07.007. [DOI] [PubMed]
- 11.Cobb LM, Mychaleckyj JC, Wozniak DJ, Lopez-Boado YS. Pseudomonas aeruginosa flagellin and alginate elicit very distinct gene expression patterns in airway epithelial cells: implications for cystic fibrosis disease. J Immunol. 2004;173:5659–5670. doi: 10.4049/jimmunol.173.9.5659. [DOI] [PubMed] [Google Scholar]
- 12.Lai SK, Wang YY, Wirtz D, Hanes J. Micro- and macrorheology of mucus. Adv Drug Deliv Rev. 2009;61(2):86–100. doi: 10.1016/j.addr.2008.09.012. [DOI] [PMC free article] [PubMed] [Google Scholar]
- 13.Dawson M, Wirtz D, Hanes J. Enhanced viscoelasticity of human cystic fibrotic sputum correlates with increasing microheterogeneity in particle transport. J Biol Chem. 2003;278(50):50393–50401. doi: 10.1074/jbc.M309026200. [DOI] [PubMed] [Google Scholar]
- 14.Duncan GA, Jung J, Joseph A, Thaxton AL, West NE, Boyle MP, Hanes J, Suk JS. Microstructural alterations of sputum in cystic fibrosis lung disease. JCI Insight. 2016;1(18):e88198. doi: 10.1172/jci.insight.88198. [DOI] [PMC free article] [PubMed] [Google Scholar]
- 15.Lai SK, Wang YY, Hida K, Cone R, Justin HJ. Nanoparticles reveal that human cervicovaginal mucus is riddled with pores larger than viruses. PNAS. 2010;107(2):598–603. doi: 10.1073/pnas.0911748107. [DOI] [PMC free article] [PubMed] [Google Scholar]
- 16.Bhat PG, Flanagan DR, Donovan MD. The limiting role of mucus in drug absorption: drug permeation through mucus solution. Int J Pharm. 1995;126:179–187. doi: 10.1016/0378-5173(95)04120-6. [DOI] [Google Scholar]
- 17.Bhat PG, Flanagan DR, Donovan MD. Drug binding to gastric mucus glycoproteins. Int J Pharm. 1996;134:15–25. doi: 10.1016/0378-5173(95)04333-0. [DOI] [Google Scholar]
- 18.Bhat PG, Flanagan DR, Donovan MD. Drug diffusion through cystic fibrotic mucus: steady-state permeation, rheologic properties, and glycoprotein morphology. J Pharm Sci. 1996;85:624–630. doi: 10.1021/js950381s. [DOI] [PubMed] [Google Scholar]
- 19.Mcllwaine M, Button B, Dawn K. Positive expiratory pressure physiotherapy for airway clearance in people with cystic fibrosis. Cochrane Database Syst Rev. 2015; 6: CD003147. 10.1002/14651858.CD003147.pub4. [DOI] [PubMed]
- 20.Lapasin R, Pricl S. Rheology of industrial polysaccharides: theory and applications. Springer Verlag, chapter. 1995;3:162–249. doi: 10.1007/978-1-4615-2185-3. [DOI] [Google Scholar]
- 21.Draper NR, Smith H. Applied regression analysis. New York: John Wiley & Sons Inc; 1966. [Google Scholar]
- 22.Abrami M, Marizza P, Zecchin F, Paolo Bertoncin P, Marson D, Lapasin R, de Riso F, Posocco P, Grassi G, Grassi M. Theoretical importance of PVP-alginate hydrogels structure on drug release kinetics. Gels. 2019;5(2):22. doi: 10.3390/gels5020022. [DOI] [PMC free article] [PubMed] [Google Scholar]
- 23.Flory PJ. The thermodynamics of polymer solutions. In: Principles of Polymer Chemistry. Cornell University Press, Ithaca, N.Y., 469–470. 1953.
- 24.Schurz J. Rheology of polymer solutions of the network type. Prog Polym Sci. 1991;16:1–53. doi: 10.1016/0079-6700(91)90006-7. [DOI] [Google Scholar]
- 25.Brownstein KR, Tarr CE. Importance of classical diffusion in NMR studies of water in biological cells. Phys Rev A. 1979; 19(6):2446–53.
- 26.Chui MM, Phillips RJ, McCarthy MJ. Measurement of the porous microstructure of hydrogels by nuclear magnetic resonance. J Colloid Interface Sci. 1995;174(2):336–344. doi: 10.1006/jcis.1995.1399. [DOI] [Google Scholar]
- 27.Whittal KP, MacKay AL. Quantitative interpretation of NMR relaxation data. J Magn Reson. 1989;84:134–152. doi: 10.1016/0022-2364(89)90011-5. [DOI] [Google Scholar]
- 28.Provencher SWA. A constrained regularization method for inverting data represented by linear algebraic or integral equations. Comput Phys Comm. 1982;27:213–227. doi: 10.1016/0010-4655(82)90173-4. [DOI] [Google Scholar]
- 29.Wang X, Ni Q. Determination of cortical bone porosity and pore size distribution using a low field pulsed NMR approach. J Orthop Res. 2003;21:312–319. doi: 10.1016/S0736-0266(02)00157-2. [DOI] [PubMed] [Google Scholar]
- 30.Coviello T, Matricardi P, Alhaique F, Farra R, Tesei G, Fiorentino S, Asaro F, Milcovich G, Grassi M. Guar gum/borax hydrogel: rheological, low field NMR and release characterizations. eXPRESS Polym Lett. 2013;7, 733–46. 10.3144/expresspolymlett.2013.71.
- 31.Abrami M, Siviello C, Grassi G, Larobina D, Grassi M. Investigation on the thermal gelation of chitosan/β-glycerophosphate solutions. Carbohyd Polym. 2019;214:110–116. doi: 10.1016/j.carbpol.2019.03.015. [DOI] [PubMed] [Google Scholar]
- 32.Kopac T, AbramiM, Grassi M, Rucigaj A, Krajnc M. Polysaccharide-based hydrogels crosslink density equation: a rheological and LF-NMR study of polymer-polymer interaction. Carbohydr Polym. 2022;277, 118895, 1–15. 10.1016/j.carbpol.2021.118895. [DOI] [PubMed]
- 33.Scherer GW. Hydraulic radius and mesh size of gels. J Sol-Gel Sci Techn. 1994;1:285–291. doi: 10.1007/BF00486171. [DOI] [Google Scholar]
- 34.Abrami M, Chiarappa G, Farra R, Grassi G, Marizza P, Grassi M. Use of low field NMR for the characterization of gels and biological tissues. ADMET & DMPK. 2018;6:34–46. doi: 10.5599/admet.6.1.430. [DOI] [Google Scholar]
- 35.Holz M, Heil SR, Sacco A. Temperature-dependent self-diffusion coefficients of water and six selected molecular liquids for calibration in accurate 1H NMR PFG measurements. Phys Chem Chem Phys. 2000;2:4740–4742. doi: 10.1039/b005319h. [DOI] [Google Scholar]
- 36.Meiboom S, Gill D. Modified spin-echo method for measuring nuclear relaxation times. Rev Sci Instrum. 1958;29(8):688–691. doi: 10.1063/1.1716296. [DOI] [Google Scholar]
- 37.Manolidis M, Isabey D, Louis B, Grotberg JB, Filoche M. A Macroscopic Model for simulating the mucociliary clearance in a bronchial bifurcation: the role of surface tension. J Biomed Eng. 2016;138(121005):1–8. doi: 10.1115/1.4034507. [DOI] [PubMed] [Google Scholar]
- 38.Derichs N, Jin BJ, Song Y, Finkbeiner WE, Verkman AS. Hyperviscous airway periciliary and mucous liquid layers in cystic fibrosis measured by confocal fluorescence photobleaching. The FASEB J Res Commun. 2011;(25), 2325–32. 10.1096/fj.10-179549. [DOI] [PMC free article] [PubMed]
- 39.Abrami M, Ascenzioni F, Di Domenico EG, Maschio M, Ventura A, Confalonieri M, Di Gioia S, Conese M, Dapas B, Grassi G, Grassi M. A Novel Approach based on low-field NMR for the detection of the pathological components of sputum in cystic fibrosis patients. Magn Reson Med. 2018;79:2323–2331. doi: 10.1002/mrm.26876. [DOI] [PubMed] [Google Scholar]
- 40.King M. Physiology of mucus clearance. Paediatr Respir Rev. 2006;7S:S212–S214. doi: 10.1016/j.prrv.2006.04.199. [DOI] [PubMed] [Google Scholar]
- 41.Ren S, Li W, Wang L, Shi Y, Cai M, Hao L, Luo Z, Niu J, Xu W, Luo Z. Numerical analysis of airway mucus clearance effectiveness using assisted coughing techniques. Sci Rep. 2020;(10), 2030, 1–10. 10.1038/s41598-020-58922-7. [DOI] [PMC free article] [PubMed]
- 42.Saxena A, Kumar V, Shukla JB. Four layer cylindrical model of mucus transport in the lung: effect of prolonged cough. Bangladesh J Med Sci. 2020;19:53–63. doi: 10.3329/bjms.v19i1.43873. [DOI] [Google Scholar]
- 43.Grassi M, Grassi G. Application of mathematical modeling in sustained release delivery systems. Expert Opin Drug Deliv. 2014;11:1299–1321. doi: 10.1517/17425247.2014.924497. [DOI] [PubMed] [Google Scholar]
- 44.Lustig SR, Peppas NA. Solute diffusion in swollen membranes. IX. Scaling laws for solute diffusion in gels. J Appl Polym Sci. 1988;36, 735–47. 10.1002/app.1988.070360401. [DOI]
- 45.Amsden B. Solute diffusion within hydrogels. Mechanisms and models Macromolecules. 1998;31:8382–8395. doi: 10.1021/ma980765f. [DOI] [Google Scholar]
- 46.Dalmoro A, Barba AA, Lamberti G, Grassi M, d’Amore M. Pharmaceutical applications of biocompatible polymer blends containing sodium alginate. Adv Polym Technol. 2012;31:219–230. doi: 10.1002/adv.21276. [DOI] [Google Scholar]
- 47.Samet JM, Cheng WP. The role of airway mucus in pulmonary toxicology. Environ Health Perspect. 1994;102 (Suppl 2), 89–103. 10.1289/ehp.9410289. [DOI] [PMC free article] [PubMed]
- 48.Benke E, Farkas A, Imre BI, Szabo-Revesz P, Ambrus R. Stability test of novel combined formulated dry powder inhalation system containing antibiotic: physical characterization and in vitro–in silico lung deposition results. Drug Develop Ind Pharm. 2019;45:1369–1378. doi: 10.1080/03639045.2019.1620268. [DOI] [PubMed] [Google Scholar]
- 49.Meulemans A, Paycha F, Hannoun P, Vulpillat M. Measurements and clinical pharmacokinetic implications of diffusion coefficient of antibiotics in tissues. Antimicrob Agents Chemother. 1989;(33), 1286–90. 10.1128/AAC.33.8.1286. [DOI] [PMC free article] [PubMed]
- 50.Soriano AN, Bonifacio PB, Adamos KG, Adornado AP. Prediction of self-diffusion coefficients of ions from various livestock antibiotics in water at infinite dilution. Earth Environ Sci. 2018;(191) 012092IOP, 1 – 10. 10.1088/1755-1315/191/1/012092.
- 51.Rajendran RR, Banerjee A. Mucus transport and distribution by steady expiration in an idealized airway geometry. Med Eng Phys. 2019;66:26–39. doi: 10.1016/j.medengphy.2019.02.006. [DOI] [PubMed] [Google Scholar]
- 52.Olivença DV, Fonseca LL, Voit EO, Pinto FR. Thickness of the airway surface liquid layer in the lung is affected in cystic fibrosis by compromised synergistic regulation of the ENaC ion channel. J R Soc Interface. 2019;16:20190187. doi: 10.1098/rsif.2019.0187. [DOI] [PMC free article] [PubMed] [Google Scholar]
- 53.Abrami M, Maschio M, Conese M, Confalonieri M, Di Gioia S, Gerin F, Dapas B, Tonon F, farra R, Murano R, Zanella G, Salton F, Grassi G, Grassi M. Use of low field nuclear magnetic resonance to monitor lung inflammation and the amount of pathological components in the sputum of cystic fibrosis patients. Magn Reson Med. 2020;(84): 427 – 36. 10.1002/mrm.28115. [DOI] [PubMed]
- 54.Maestri CA, Abrami M, Hazan S, Chistè E, Golan Y, Rohrer J, Bernkop-Schnürch A, Grassi M, Scarpa M, Bettotti P. Role of sonication pre-treatment and cation valence in the sol-gel transition of nano-cellulose suspensions. Sci Rep. 2017;7:11129. doi: 10.1038/s41598-017-11649-4. [DOI] [PMC free article] [PubMed] [Google Scholar]
- 55.Wei Z, Gourevich I, Lora FL, Coombs N, Eugenia KE. TEM imaging of polymer multilayer particles: advantages, limitations, and artifacts. Macromolecules. 2006;39:2441–2444. doi: 10.1021/ma052029z. [DOI] [Google Scholar]
- 56.Monsegue N, Reynolds WT, Jr., Hawk J. A., Murayama M. How TEM projection artifacts distort microstructure measurements: a case study in a 9 pct Cr-Mo-V steel. Metall and Mater Trans A. 2014;45A:3708–3713. doi: 10.1007/s11661-014-2331-0. [DOI] [Google Scholar]
- 57.Gregersen SB, Glover ZJ, Wiking L, Cohen SA, C., Bertelsen K., Pedersen B., Poulsen K. R., Andersen U., Hammershøj M. Microstructure and rheology of acid milk gels and stirred yoghurts –quantification of process-induced changes by auto- and cross correlation image analysis. Food Hydrocolloids. 2021;111(106269):1–7. doi: 10.1016/j.foodhyd.2020.106269. [DOI] [Google Scholar]
- 58.Suk JS, Lai SK, Boylan NJ, Dawson MR, Boyle MP, Hanes J. Rapid transport of muco-inert nanoparticles in cystic fibrosis sputum treated with N-acetyl cysteine. Nanomedicine. 2011;6:365–375. doi: 10.2217/nnm.10.123. [DOI] [PMC free article] [PubMed] [Google Scholar]
- 59.Suk JS, Lai SK, Wang YY, Ensign LM, Zeitlin PL, Boyle MP, Hanes J. The penetration of fresh undiluted sputum expectorated by cystic fibrosis patients by non-adhesive polymer nanoparticles. Biomaterials. 2009;30:2591–2597. doi: 10.1016/j.biomaterials.2008.12.076. [DOI] [PMC free article] [PubMed] [Google Scholar]
- 60.Khanvilkar K, Donovan MD, Flanagan DR. Drug transfer through mucus. Adv Drug Deliv Rev. 2001;48:173–193. doi: 10.1016/s0169-409x(01)00115-6. [DOI] [PubMed] [Google Scholar]
- 61.Maselli DJ, Keyt H, Restrepo MI. Inhaled antibiotic therapy in chronic respiratory diseases. Int J Mol Sci. 2017;(18), 1062, 1–23. 10.3390/ijms18051062. [DOI] [PMC free article] [PubMed]
- 62.Sorino C, Negri S, Spanevello A, Visca D, Scichilone N. Inhalation therapy devices for the treatment of obstructive lung diseases: the history of inhalers towards the ideal inhaler. Eur J Intern Med. 2020;75:15–18. doi: 10.1016/j.ejim.2020.02.023. [DOI] [PubMed] [Google Scholar]
Associated Data
This section collects any data citations, data availability statements, or supplementary materials included in this article.
Data Availability Statement
Where not directly provided in the paper, all the data referring to this paper are available upon request to the corresponding author.


