

Abstract
Obesity is a major risk factor for cancers including hepatocellular carcinoma (HCC) that develops from a background of non-alcoholic fatty liver disease (NAFLD). Hypercholesterolemia is a common comorbidity of obesity. Although cholesterol biosynthesis mainly occurs in the liver, its role in HCC development of obese people remains obscure. Using high-fat high-carbohydrate diet-associated orthotopic and spontaneous NAFLD-HCC mouse models, we found that hepatic cholesterol accumulation in obesity selectively suppressed natural killer T (NKT) cell-mediated antitumor immunosurveillance. Transcriptome analysis of human liver revealed aberrant cholesterol metabolism and NKT cell dysfunction in NAFLD patients. Notably, cholesterol-lowering rosuvastatin restored NKT expansion and cytotoxicity to prevent obesogenic diet-promoted HCC development. Moreover, suppression of hepatic cholesterol biosynthesis by a mammalian target of rapamycin (mTOR) inhibitor vistusertib preceded tumor regression, which was abolished by NKT inactivation but not CD8+ T cell depletion. Mechanistically, sterol regulatory element-binding protein 2 (SREBP2)-driven excessive cholesterol production from hepatocytes induced lipid peroxide accumulation and deficient cytotoxicity in NKT cells, which were supported by findings in people with obesity, NAFLD and NAFLD-HCC. This study highlights mTORC1/SREBP2/cholesterol-mediated NKT dysfunction in the tumor-promoting NAFLD liver microenvironment, providing intervention strategies that invigorating NKT cells to control HCC in the obesity epidemic.
Keywords: NAFLD, NKT cells, HCC, mTOR, cholesterol
Subject terms: Tumour immunology, Cancer microenvironment, Cancer models
Introduction
The worldwide incidence of obesity has nearly tripled over the past four decades with a parallel rise in the prevalence of obesity-related cancers, such as colorectal, pancreatic, thyroid, uterine, and liver cancers [1, 2]. Epidemiological studies demonstrate that obesity is associated with poorer prognosis and therapeutic efficacy for cancer patients [1, 3]. It has become clear that obesity induces systemic perturbations to organismal metabolism in dyslipidemia, insulin resistance, as well as chronic inflammation that promote cancer development and therapeutic resistance [4]. Moreover, obesity-induced metabolic disorders also exhibit broad-ranging and long-lasting detrimental effects on antitumor immune responses. For example, tumor cells induce fatty acid metabolism in obesity and change their microenvironment to impair CD8+ T cell infiltration and antitumor function [5]. As obesity is expected to affect 1 in 2 adults by 2030 [6], it is crucial to elucidate the immuno-metabolic mechanisms by which obesity increases tumor burden.
The obesity epidemic and the accompanying development of non-alcoholic fatty liver disease (NAFLD), which has a global prevalence of 25%, are crucial contributors in the development of hepatocellular carcinoma (HCC) [7, 8]. NAFLD encompass a disease continuum from hepatic steatosis to non-alcoholic steatohepatitis (NASH) and is strongly associated with metabolic syndrome [9]. Chronically elevated oxidative stress by fatty acid-mediated lipotoxicity, in combination with innate and adaptive immune responses, are thought to promote hepatocyte death and the ensuing inflammatory and reparative responses leading to HCC [10–12]. Accumulating evidence also highlights the importance of cholesterol as a pathologic metabolic stimulus, and its excessive accumulation is critical in the progression of obesity-related NAFLD and subsequently HCC [13]. In human studies involving obese individuals, excessive cholesterol is synthesized and secreted by the hepatocytes [14], which is controlled by the mammalian target of rapamycin complex 1 (mTORC1)/sterol regulatory element-binding protein 2 (SREBP2)-mediated mevalonate pathway and correlated with the severity of NAFLD [15]. Conversely, long-term use of statins, a class of cholesterol-lowering drugs that inhibit the mevalonate pathway, was associated with reduced risk of HCC in patients with obesity and chronic liver diseases [16, 17]. However, it is still unclear how changes in cholesterol metabolism induced by obesity affect the local liver microenvironment to impact HCC development.
Natural killer T (NKT) cells comprise a unique subset of CD1d-restricted T cells that recognize lipid antigens to mediate immune responses in inflammation, infection, autoimmunity, and cancer [18]. As the major population of innate-like lymphocytes in the liver, NKT cell subsets account for 30–40% and 5–25% of liver lymphocytes in mouse or human, respectively, and play important roles in inflammatory liver diseases [19, 20]. Although recent studies have shown that NKT cells are recruited in the liver to control tumor growth [21], their roles and regulatory mechanisms in obese liver microenvironment and HCC development remains obscure. We have recently demonstrated the key roles of epigenetic and transcriptional reprogramming for CD8+ T cell recruitment and NKT cell accumulation in primary HCC and liver metastasis [22, 23]. Here, our findings in animal models and human immune cell systems uncovered that obesity-induced cholesterol accumulation by mTORC1/SREBP2 signaling activation selectively suppresses NKT cell-mediated antitumor surveillance in the liver. Importantly, as we also observed positive correlations between hypercholesterolemia and NKT cell reduction in obesity, NAFLD, and NAFLD-HCC patients, our findings provide insights on obesity-related HCC prevention and treatment by modulating the liver immuno-metabolic microenvironment.
Results
Obesity-promoted NAFLD is accompanied by a selective NKT cell reduction
To investigate the roles of hypercholesterolemia, the major comorbidity of obesity, in modulating hepatic immune responses and HCC development, we chose a high-fat-high-carbohydrate (HFHC) diet-induced obese mouse model that mimics NAFLD pathogenesis of obesity in humans (Fig. 1A and Supplementary Fig. S1a) [24, 25]. In parallel with the body weight gain starting from week 8 (p < 0.01; Fig. 1B), the HFHC-fed C57BL/6 mice exhibited increase in both circulating and hepatic cholesterol levels when compared to their counterparts on control diet (CD) (p < 0.05; Fig. 1C, D). We next used multi-color flow cytometry to profile the immune cell populations, including CD4+ and CD8+ T cells, natural killer (NK) cells, NKT cells, macrophages, monocytic-myeloid derived suppressor cells (M-MDSCs), and polymorphonuclear (PMN)-MDSCs in the liver of the CD and HFHC-fed mice (Supplementary Fig. S1b). Consistent with previous findings, CD11b+GR-1−Ly6C−F4-80+ macrophages and CD11b+GR-1+Ly6G−Ly6C+M-MDSCs were significantly increased in NAFLD livers (Supplementary Fig. S1c) [26, 27]. Notably, we found a selective and consistent reduction on NK1.1+TCRβ+NKT cells, but not the other immune surveilling cells including CD3+CD4+T cells, CD3+CD8+ T cells, and TCRβ-NK1.1+NK cells, in the liver of obese mice during NAFLD development (Fig. 1E and Supplementary Fig. S1c). Moreover, at week 15 when hepatic steatosis and fibrosis were prominent (Supplementary Fig. S1a), we observed significant inverse correlations between increased cholesterol level and reduced NKT proportion in both liver (p < 0.05, R = −0.6139; Fig. 1F) and blood (p < 0.01, R = −0.7249; Fig. 1G, H) of the mice. We further consolidated the role of hypercholesterolemia using a high cholesterol (Hcho, 1.25%) diet-induced NAFLD model which exhibited mild lobular inflammation and moderate hepatocellular ballooning (Supplementary Fig. S2a). Mice fed with Hcho diet for 15 weeks showed significantly higher liver cholesterol concentration (p < 0.01) and reduced hepatic NKT proportion (p < 0.01; Supplementary Fig. S2b, c) compared to the CD group. Moreover, hepatic NKT cells from the Hcho group also showed a significantly higher level of intracellular cholesterol by Filipin staining (p < 0.01; Supplementary Fig. S2d). Taken together, these results suggested a potential role of cholesterol in causing NKT dysfunction in NAFLD livers.
Fig. 1.

Obesity-promoted NAFLD is accompanied by a selective NKT cell reduction. A Schematic for orthotopic NAFLD-HCC mouse model. Body weight (B), cholesterol level in blood and liver (C, D), the proportion of NK1.1+TCRβ+NKT cells in liver infiltrating CD45+ leukocytes (E) and PBMCs (G) of CD- and HFHC-fed mice at week 8, 12 and 15. F, H, Correlations between cholesterol level and NKT cell proportion in liver and blood. I Principal component analysis comparing human NAFLD liver samples with healthy controls. J Gene Ontology analysis of top differentially upregulated genes (adjusted p < 0.05, Log2FC > 1.5, n = 301) in NAFLD livers compared to healthy livers using MSigDB Hallmark 2020 database. K, L Volcano plots of differentially expressed genes in NAFLD livers compared to healthy livers (blue points, Log2FC > 1.5; brown points, Log2FC < −1.5). Genes involved in Cholesterol Homeostasis/mTORC1 Signaling (B) and NKT signatures (L) are highlighted. Representative photos of liver and tumor, and tumor weight (M) as well as proportions of NKT cells in tumor infiltrating CD45+ leukocytes (N) at the endpoint were shown. Data are mean ± SD of at least 5 mice per group. *p < 0.05; **p < 0.01 (B–E, G, M, N, two-tailed t test; F, H, Spearman’s correlation coefficient)
To validate our findings in human, we utilized a published RNA-sequencing dataset of histologically normal (n = 10) and NAFLD (n = 51) liver samples, which showed distinct transcriptomic profiles by principal component analysis (Fig. 1I) [28]. Consistent with the findings in our mouse model, human NAFLD livers also demonstrated aberrant cholesterol metabolism as indicated by significant enrichment of upregulated genes in cholesterol homeostasis and mTORC1 signaling, the major metabolic pathway responsible for cholesterol synthesis [29] (Fig. 1J, K). In contrast, the expression of NKT signature genes [30–32] were downregulated in human NAFLD livers compared with healthy livers in the same dataset (Fig. 1L), suggesting enhanced cholesterol accumulation and NKT dysregulation in human NAFLD liver microenvironment.
Given the crucial role of NKT cells in regulating liver cancer [21], we next determined whether the altered liver immune microenvironment influences tumor growth by intrahepatically inoculating RIL-175 mouse hepatoma cells [33] at week 15 (Fig. 1A). At the endpoint (week 17), we found a significant increase in the tumor weight in the HFHC-fed mice compared to the CD counterparts (p < 0.05; Fig. 1M), which was accompanied by a reduction of tumor infiltration of NKT cells (p < 0.05; Fig. 1N). To validate this, we utilized a widely used NASH model by feeding C57BL/6 mice with choline-deficient, l-amino acid-defined, high-fat diet (CDAHFD) for 3 weeks [34], which exhibited marked lobular inflammation and hepatocellular ballooning (Supplementary Fig. S3a) with significant increase in liver cholesterol level (p < 0.005; Supplementary Fig. S3b). In the CDAHFD-fed mice, we observed a comparable reduction in hepatic NKT cells as the HFHC or Hcho diet models (p < 0.001; Supplementary Fig. S3c), which exhibited significant negative correlation with liver cholesterol level (p < 0.0005; Supplementary Fig. S3d) and higher intracellular cholesterol level (p < 0.01; Supplementary Fig. S3e). Consistent with the HFHC model, we also found a significant increase in the RIL-175 orthotopic tumor weight in the CDAHFD-fed mice compared to the CD counterparts (p < 0.05; Supplementary Fig. S3f). In summary, these findings demonstrate the cholesterol accumulation in the NAFLD microenvironment, which may contribute to a preferential NKT cell dysregulation and subsequent obesity-promoted HCC development.
Cholesterol-lowering statin restores NKT cell-mediated liver immunosurveillance to prevent obesity-promoted HCC
Statins effectively normalize cholesterol in people with obesity and may reduce the risk of HCC incidence [16]. To investigate if cholesterol modulation by statin could control HCC development via NKT cells, we first administered rosuvastatin (Crestor) or vehicle control to HFHC-fed mice from week 12 to 15 when NKT cell proportion was reduced (Fig. 2A). Rosuvastatin administration not only significantly reduced cholesterol levels in blood and liver (p < 0.01; Fig. 2B and Supplementary Fig. S4a), but also hepatic steatosis in the HFHC-fed mice (Fig. 2C). Of note, the proportion of circulating and hepatic NKT cells were also restored (p < 0.05, Fig. 2D and Supplementary Fig. S4b), which were negatively correlated with the corresponding cholesterol levels (p < 0.05, R = −0.6663 and −0.5666; Fig. 2E and Supplementary Fig. S4c). Moreover, normalization of the liver cholesterol level by rosuvastatin further increased the cytolytic activity of hepatic NKT cells, as shown by enhanced CD69 expression and direct killing effect on CD1d-expressing mouse tumor cells (p < 0.05; Fig. 2F, G) [21]. These results reveal that lowering cholesterol in obese mice could restore the proportion and cytolytic function of hepatic NKT cells, highlighting the negative impact of cholesterol on NKT cell-mediated immunosurveillance.
Fig. 2.

Rosuvastatin restores NKT cell-mediated liver immunosurveillance to prevent obesity-promoted HCC. A HFHC-fed mice were treated with vehicle or rosuvastatin (40 mg/kg) for the latter 3 weeks via oral gavage (5 times/week) before intrahepatic injection of 5 × 10⁵ RIL-175 cells at week 15. Isotype (rat IgG1 HRPN), anti-CD1d (19G11) or anti-CD8α (YTS169.4) antibodies were injected into rosuvastatin-treated mice one day before tumor injection and every 5 days for a total of three injections. Liver cholesterol level (B), representative images and H&E staining of livers (C), as well as proportion of NKT cells in liver infiltrating CD45+ leukocytes (D) in vehicle- and rosuvastatin-treated mice at week 15 were shown. E Correlation between liver cholesterol level and hepatic NKT cell proportion was shown. F CD69+ proportion in the hepatic NKT cells of vehicle- and rosuvastatin-treated mice at week 15 was shown. G Cytolytic activity of hepatic NKT cells sorted from vehicle- and rosuvastatin-treated mice was determined on RIL-175 cells. H Representative photos of liver and tumor, as well as statistic of tumor weight were shown. I, J, The proportions of NKT and CD8+ T cells in tumor-infiltrating CD45+ leukocytes were determined at the endpoint. K, L, Correlations between the proportions of tumor-infiltrating NKT or CD8+ T cells toward tumor weight were shown. Data are mean ± SD of at least 6 mice per group. *p < 0.05; **p < 0.01. (B, D, F, two-tailed t test; E, K, L, Spearman’s correlation coefficient; G two-way ANOVA; H–J, one-way ANOVA)
We next investigated the effect of rosuvastatin pretreatment on tumor growth in HFHC-fed mice using the same orthotopic model. To determine the causal role of NKT cell-mediated immunosurveillance on tumor development, NKT cells inactivation was performed by intraperitoneal injection of anti-CD1d antibody [21] starting from one day before tumor inoculation (Fig. 2A). Similarly, the role of CD8+ T cells, the major player in systematic antitumor immune responses, was also examined by anti-CD8α depleting antibody [22] (Fig. 2A). We found that reshaping of NAFLD microenvironment by rosuvastatin reduced the subsequent orthotopic tumor growth, which was abolished by NKT inactivation in the liver (p < 0.05; Fig. 2H, I). In contrast, CD8+ T cell depletion in the liver could not reverse rosuvastatin-mediated tumor suppression (Fig. 2H, J). Consistently, the proportion of tumoral NKT cells, but not CD8+ T cells, was negatively correlated with the tumor weight (p < 0.05, R = −0.4314; Fig. 2K, L). Taken together, our data demonstrate that amelioration of liver cholesterol level by statin could prevent obesity-promoted HCC development in a NKT cell-dependent manner.
Pharmacological inhibition of mTOR confines obesity-promoted HCC development via NKT but not CD8+ T cells
Compared to the NAFLD mouse model induced by direct dietary cholesterol uptake [35, 36], the source of excessive cholesterol in our HFHC-induced obesity model was derived from biosynthesis in hepatocytes via the mTORC1/SREBP2 pathway [29]. Indeed, the signaling molecules of mTORC1/SREBP2 pathway, including pmTORSer2448, pS6KThr398, p4EBP1Thr37/46, SREBP1 and SREBP2 were concordantly elevated in the livers of HFHC- compared to CD-fed mice (Supplementary Fig. S5a), and positively correlated with increased liver cholesterol levels (p < 0.01; Supplementary Fig. S5b). Therefore, we speculated that normalizing liver cholesterol by mTORC1/SREBP2 inhibition may alleviate NKT cell suppression to prevent obesity-promoted HCC. Thus, we first administered AZD2014 (vistusertib), a potent mTOR kinase inhibitor currently undergone phase I/II clinical trials for solid cancers treatment [37, 38], to HFHC-fed mice from week 12–15 (Fig. 3A). Compared to vehicle control, AZD2014 treatment not only suppressed hepatic mTORC1/SREBP2 activation and cholesterol level (p < 0.05; Fig. 3B, C), but also restored NKT cell proportion in the HFHC-fed mice (p < 0.01; Fig. 3D). The suppressed SREBP2 in the livers of HFHC-fed mice treated with AZD2014 was positively correlated with decreased liver cholesterol levels (p < 0.01, R = 0.693; Supplementary Fig. S6a). The significant inverse correlations between cholesterol and NKT cells in both liver (p < 0.05, R = −0.5833; Fig. 3E) and blood (p < 0.001, R = −0.8377; Supplementary Fig. S6b–d) underscored the immuno-metabolic alteration by AZD2014, which further alleviated hepatic steatosis with no evidence of toxicity in kidney and intestine of the HFHC-fed mice (Supplementary Fig. S6e).
Fig. 3.

mTOR inhibitor AZD2014 confines obesity-promoted HCC development via NKT but not CD8+ T cells. A HFHC-fed mice were received vehicle or AZD2014 (10 mg/kg) treatment for the latter 3 weeks via oral gavage (5 times/week) before RIL-175 inoculation at week 15. Isotype control, anti-CD1d or anti-CD8α antibodies were injected into AZD2014-treated mice one day before tumor injection and every 5 days for a total of three injections. B Western blot analysis of pmTORser2448, mTOR, SREBP2 in livers of vehicle- and AZD2014-treated mice at week 15. β-actin served as loading control. Liver cholesterol level (C) and proportion of NKT cells in liver infiltrating CD45+ leukocytes (D) in vehicle- and AZD2014-treated mice at week 15 were shown. E Correlation between liver cholesterol level and hepatic NKT cell proportion was shown. Representative photos of liver and tumor, H&E staining with highlighted tumor regions (F), tumor weight (G), proportions of NKT cells (H) and CD8+ T cells (I) in tumor-infiltrating CD45+ leukocytes in indicated groups of mice at the endpoint were shown. J Correlations between proportions of tumor-infiltrating NKT or CD8+ T cells toward tumor weight were shown. K Schematic diagram of spontaneous NAFLD-HCC model induced by streptozocin (STZ) and HFHC diet. The mice were treated with vehicle or AZD2014 (10 mg/kg, 5 times/week) from week 16 to 19. L Western blot of pmTORser2448, mTOR and SREBP2 in livers of vehicle and AZD2014-treated STZ-HFHC mice were shown. β-actin served as loading control. Liver cholesterol level (M) and proportion of NKT cells in liver infiltrating CD45+ leukocytes (N) were shown in STZ-HFHC mice treated with vehicle or AZD2014 at the endpoint. O Representative photos of liver and tumor, with tumor lesions highlighted by blue arrows, as well as statistic of tumor weight were shown. Data are mean ± SD of at least 5 mice per group. *p < 0.05; **p < 0.01; ****p < 0.0001. (C, D, M, N, O, two-tailed t test; E, J, Spearman’s correlation coefficient; G–I, one-way ANOVA)
Next, we determined whether and how mTOR inhibition could reinstate antitumor immunosurveillance in HFHC-fed mice. To this end, AZD2014-treated mice were injected with isotype control, anti-CD1d or anti-CD8α antibody before orthotopic tumor inoculation (Fig. 3A). We found that HFHC-fed mice pretreated with mTOR inhibitor were significantly more resilient than vehicle control in suppressing HCC tumorigenicity (p < 0.0001; Fig. 3F, G), which was accompanied with increased intratumoral infiltration of NKT (p < 0.05; Fig. 3H) but not CD8+ T cells (Fig. 3I). Notably, inactivation of NKT but not depletion of CD8+ T cells abolished AZD2014-mediated tumor regression (p < 0.05; Fig. 3F–i). Consistently, the proportion of NKT rather than CD8+ T cells was negatively correlated with tumor weight (p < 0.01, R = −0.5313; Fig. 3J). Altogether, these findings suggest that inhibition of cholesterol biosynthesis pathway could prevent obesity-promoted HCC development in a NKT cell-dependent manner. To consolidate this notion, we applied an additional HCC model using HFHC-fed male C57BL/6 mice with neonatal streptozocin (STZ) treatment (Fig. 3K), which closely resembles the characteristics of human NAFLD with consistent progression to HCC [22]. The HFHC-STZ spontaneous NAFLD-HCC model also showed elevated liver cholesterol level (p < 0.05) and activated mTORC1/SREBP2 cascade (Supplementary Fig. S6f, g), which was associated with hepatic NKT reduction (p < 0.05; Supplementary Fig. S6h). Of note, no elevation of liver triglyceride and SREBP1 levels was observed in this model (Supplementary Fig. S6f, g), further emphasizing the role of SREBP2-cholesterol cascade in NKT dysregulation. In accordance with the orthotopic model, treatment of AZD2014 in the last 3 weeks of this spontaneous model not only suppressed liver mTORC1/SREBP2 signaling (Fig. 3l) but also significantly reduced liver cholesterol level (p < 0.01; Fig. 3M), which was inversely associated with hepatic NKT restoration (p < 0.05, R = −0.6956; Fig. 3N and Supplementary Fig. S6i), leading to a dramatic reduction in NAFLD-HCC development (p < 0.01; Fig. 3O). Taken together, these data demonstrate that pharmacological mTOR inhibition specifically restores hepatic NKT cells to foster a tumor-suppressive liver microenvironment.
SREBP2-mediated hepatic cholesterol biosynthesis precedes NKT cell dysfunction and HCC development
We next elucidated the effect of hepatic inhibition of SREBP2-mediated cholesterol biosynthesis on NKT cell-mediated antitumor immunosurveillance using a lentiviral-based short-hairpin RNA (shRNA) system that mainly targets the liver [24, 25]. Similar to the systemic drug treatment, mice fed with HFHC diet for 12 weeks were injected with lentivirus expressing shRNA against control (shCtrl) or Srebp2 (shSrebp2) through tail vein before orthotopic tumor inoculation (Fig. 4A). Downregulation of SREBP2 in HFHC-fed mice not only alleviated hepatic steatosis and cholesterol level (Fig. 4B–D), but also significantly increased hepatic NKT cell proportion (p < 0.05, Fig. 4E), leading to suppressed tumorigenicity (p < 0.05, Fig. 4F) that was correlated with elevated tumor NKT cell proportion (p < 0.05, R = −0.5172; Fig. 4G, H). To consolidate the direct impact of hepatic SREBP2-mediated cholesterol biosynthesis on NKT cells, we overexpressed SREBP2 in an immortalized hepatocyte cell line LO2, resulting in concordant elevation of cholesterol biosynthetic genes [29] and intracellular cholesterol level when compared to VECTOR control (p < 0.01, Fig. 4I, J). Treatment of LO2-VECTOR cells with a cholesterol transport inhibitor U18666A [39] increased the intracellular cholesterol level, which was further enhanced in LO2-SREBP2 cells (Fig. 4J), thus indicating cholesterol release in the conditional medium (CM). We next determined the effects of hepatocyte-derived cholesterol on human NKT cell expansion and cytolytic activity by culturing CD3+cells or CD3+CD56+TCRα+NKT cells isolated from healthy donor peripheral blood mononuclear cells (PBMCs) with LO2-CM as described previously, in which a NKT cell-specific glycolipid alpha-galactosylceramide (α-GalCer) and interleukin (IL-2) were supplemented [40] (Fig. 4K). We found a robust reduction of CD3+CD56+TCRα+NKT cell proportion in CD3+cells when cultured with CM derived from LO2-SREBP2 relative to LO2-VECTOR cells (p < 0.01; Fig. 4L). Moreover, LO2-SREBP2-CM significantly diminished the killing activity of NKT cells against CD1d+Huh7 human HCC cells when compared to the LO2-VECTOR-CM (p < 0.05; Fig. 4M). These in vivo and in vitro findings collectively suggest that the deficiency of antitumor NKT cells is caused by the aberrant SREBP2-mediated hepatic cholesterol biosynthesis of the obese mice.
Fig. 4.

SREBP2-mediated hepatic cholesterol biosynthesis precedes NKT dysfunction and HCC development. A HFHC-fed mice were received a single injection of 5 × 10⁷ TU lentivirus-shCtrl or -shSrebp2 at week 12 and intrahepatic inoculation with RIL-175 cells at week 15. B Western blot analysis of SREBP2 in livers of shCtrl or shSrebp2 treated-NAFLD mice at week 15 was shown. β-actin served as loading control. Representative images and H&E staining of livers (C), liver cholesterol level (D) and proportion of NKT cells in liver infiltrating CD45+ leukocytes (E) in shCtrl or shSrebp2 treated mice at week 15 were shown. Representative images of liver and tumor, H&E staining of tumor, tumor weight (F) and proportion of NKT cells in tumor infiltrating CD45+ leukocytes (G) were shown at the endpoint. H Correlation between NKT cell proportion and tumor weight was shown. I Western blot of SREBP2 and loading control β-actin, heatmap of relative fold change of SREBP2, CYP51A1, DHCR7, HMGCR, HMGCS and SQLE mRNA level in LO2-SREBP2 toward LO2-VECTOR cells were shown. J Intracellular cholesterol levels of LO2-VECTOR and -SREBP2 cells treated with DMSO or U18666A (1.25 μM) was determined by Filipin III staining and shown as overlay histogram. Blue line represented LO2-VECTOR while purple line represented LO2-SREBP2. K Schematic for NKT cell expansion and cytotoxicity analysis in the presence of α-GalCer (100 ng/mL) and LO2 conditional medium (CM) in vitro. L Representative flow cytometry dot plots and percentage of CD3+CD56+TCRα+NKT cells in CD3+T cells cultured by LO2-VECTOR or -SREBP2 CM. M The cytolytic activity of NKT cells cultured by LO2-VECTOR or -SREBP2 CM was determined on HCC Huh7 cells. Data are mean ± SD of at least 5 mice per group or 3 biological replicates of at least 3 independent experimental settings. *p < 0.05; **p < 0.01. (D, E, F, G, two-tailed unpaired t test; H Spearman’s correlation coefficient; L, M two-tailed paired t test)
Cholesterol directly impairs NKT expansion and cytotoxicity by lipid peroxide accumulation
We next determined whether excessive cholesterol could directly impair human NKT cell expansion and cytolytic activity (Fig. 5A). As cholesterol is like other unsaturated lipids in being susceptible to peroxidative degradation and is known to mediate lipid peroxidation and impair CD8+ T cells function [41–44], we speculated that excessive cholesterol uptake may lead to lipid peroxidation and induction of NKT cell dysfunction. First, we found that culturing healthy donor PBMCs with cholesterol significantly attenuated the induction of CD3+CD56+TCRα+NKT cell proportion by α-GalCer (p < 0.05; Fig. 5B) [45]. Second, we applied a ratiometric fluorescence method that measures lipid peroxidation by a peroxide-sensitive fluorescent probe [46]. Of note, uptake of excessive cholesterol by NKT cells (Fig. 5C) induced a remarkable increase in lipid peroxidation as early as 4 h of exposure to cholesterol (p < 0.01) which was sustained after 24 h (p < 0.05; Fig. 5D). NKT cells exposed to cholesterol also showed reduced production of two major cytotoxic cytokines, Granzyme B and interferon gamma (IFN-γ) (p < 0.05; Fig. 5E), leading to a significant loss of killing activity against CD1d+Huh7 human HCC cells (p < 0.05; Fig. 5F). These findings provide direct evidence of NKT cell reduction and dysfunction by cholesterol.
Fig. 5.

Cholesterol directly impairs NKT cell expansion and cytotoxicity by lipid peroxide accumulation. A Schematic for NKT cell expansion and functional analysis in the presence of α-GalCer (100 ng/mL) and cholesterol (20 μg/mL). B The proportion of CD3+CD56+TCRα+NKT cells in PBMCs. C Representative overlay histograms of Filipin III intensity indicated intracellular cholesterol level. D NKT cells treated with or without cholesterol (c) for 4 h and 24 h were analyzed for lipid peroxidation. E Concentration of of granzyme B and IFN-γ and the cytolytic activity of NKT cells cultured with or without cholesterol on Huh7 cells were shown. F The cytolytic activity of NKT cells cultured in the presence of cholesterol on Huh7 cells were shown. Blood cholesterol level (G), proportion of NKT cells in PBMCs (H), intracellular cholesterol content (I), and lipid peroxidation level in NKT cells (J) of 7 healthy donors and 8 obese people (BMI ≥ 40 kg/m2) were shown. Correlations between cholesterol content and lipid peroxidation levels in NKT cells (K), blood cholesterol level and NKT cell cholesterol content (L), blood cholesterol and NKT cell lipid peroxidation level (M), blood cholesterol level and NKT cell proportion (N) were shown. Data are mean ± SD of at least three biological replicates from two independent experiments. *p < 0.05; **p < 0.01. (E one-way ANOVA; D–J, two-tailed paired t test; K–N, Spearman’s correlation coefficient)
Next, we evaluated the clinical relevance of our findings in PBMCs from blood of healthy donors (n = 7) and people with obesity (n = 8; Supplementary Fig. S7a). Consistent with the HFHC-fed mouse model (Fig. 1), concomitant hypercholesterolemia (p < 0.001; Fig. 5G) and CD3+CD56+TCRα+NKT cell reduction (p < 0.01; Fig. 5H) were noted in people with obesity (Supplementary Fig. S7a) when compared to healthy donors. Moreover, the levels of intracellular cholesterol and lipid peroxidation in NKT cells were also significantly higher in the obese people (p < 0.01; Fig. 5I, J) and positively correlated with each other (p < 0.01; R = 0.6656; Fig. 5K). As the blood cholesterol concentration was positively correlated with NKT cell intracellular cholesterol and lipid peroxidation level (p < 0.05 and 0.01; R = 0.6355 and 0.7461; Fig. 5L, M, respectively) and inversely correlated with NKT cell proportion (p < 0.05; R = −0.6315; Fig. 5N), these human data supported the notion that excessive cholesterol uptake dysregulates NKT cells by lipid peroxide accumulation in obesity.
Hypercholesterolemia is associated with NKT cell reduction and dysfunction in people with NAFLD and NAFLD-HCC
To further evaluate the significance of hepatic NKT cells in NAFLD and NAFLD-HCC, we next assessed the functional status of NKT cells in a single-cell RNA-sequencing (scRNAseq) dataset of CD3+cells from 4 healthy liver and 6 NAFLD/NASH liver tissues [30]. A subset of NKT cells with high expression of signature genes including CD3E, CD7, IL2RB, KLRB1, KLRC1, KLRD1, NCAM1, NKG7, TIGIT, and XCL1 was identified (Fig. 6A, B). When compared to their counterparts from healthy livers, 455 differentially expressed genes were identified to be significantly downregulated in NAFLD/NASH livers. Interestingly, the Kyoto Encyclopedia of Genes and Genomes (KEGG) enrichment analysis of these genes revealed NK cell-mediated cytotoxicity as the top enriched pathway, suggesting the dysfunctional status of NKT cells from NAFLD/NASH livers (Adjusted p = 1.76 × 10⁻⁷; Fig. 6C).
Fig. 6.

Hypercholesterolemia is associated with NKT cell reduction and dysfunction in people with NAFLD and NAFLD-HCC. A UMAP plot of CD3+ single-cell transcriptomes from human healthy and NAFLD/NASH livers. NKT-like cells were colored by blue. B UMAP plots showing the expressions and distributions of CD3E, CD4, CD8A, and certain NKT cell markers. C KEGG pathway analysis showing the top 6 enriched categories of downregulated genes in NKT cells from NAFLD/NASH livers (Adjusted p < 0.05, Log2FC > 0.15, n = 455). D H&E, CD3 and CD56 co-immunofluorescence in healthy livers (n = 8), NAFLD livers (n = 26) and NAFLD-HCC- tumor-adjacent liver tissues (n = 30) were shown. Co-localization of CD3 positive and CD56 positive cells were shown in the merged images. Hoechst served as positive control for cell nuclei staining. Scale bar = 100 μm. Correlations between CD3/CD56 scores (E) toward blood total cholesterol (F) or LDL levels (G) were shown. Data are mean ± SD. ****p < 0.0001. (E, one-way ANOVA; F, G, Spearman’s correlation coefficient)
Furthermore, we assessed the proportion of hepatic NKT cells in our in-house tissue cohort from healthy donors undergone liver transplantation and patients with NAFLD (n = 26, Supplementary Fig. S7b) or NAFLD-associated HCC (n = 30, Supplementary Fig. S7c) by co-immunofluorescence of NKT cell surface markers CD3 and CD56 (Fig. 6D). The results showed that the numbers of CD3/CD56 double-positive NKT cells in NAFLD livers were uniformly reduced when compared to the normal livers (p < 0.0001; Fig. 6E), whereas the proportions of CD8+ T cells and CD57+NK cells were comparable between the NAFLD and normal livers (Supplementary Fig. S8a, b). Consistently, we found a reduction of NKT cells in ~90% (26/30) of the matched liver tissues of NAFLD-HCC (Fig. 6E). Moreover, in this small cohort of patients, we observed an inverse correlation between the NKT cells with the blood cholesterol (p < 0.05, R = −0.3892; Fig. 6F) and low-density lipoprotein (LDL) levels (p < 0.01, R = −0.5096; Fig. 6G). Taken together, our data suggest that selective NKT cell deficiency and functional impairment by cholesterol may limit the antitumor surveillance in human NAFLD.
Discussion
Understanding the liver microenvironment of NAFLD has been valuable in establishing potential therapeutic targets to prevent its complications including HCC [47]. The reason underlining increased tumor growth in NAFLD liver is a complex landscape composed of interconnected pathways linking lipotoxicity, oxidative stress, immune and inflammatory responses [12]. Emerging evidence suggests that hepatic cholesterol is a major lipotoxic molecule critical in the development of experimental and human NASH in the setting of NAFLD [13], but whether excessive cholesterol impacts the NAFLD immune microenvironment to promote tumor growth remains poorly understood. Our study revealed that distinct from its role in triggering hepatic pro-inflammatory signaling [13, 48], cholesterol overload directly dampened NKT cell function via increased lipid peroxidation, thereby undermining the antitumor surveillance in the NAFLD liver. Pharmacological and genetic inhibition of the aberrant hepatic cholesterol biosynthesis thwarted obesogenic diet-promoted HCC development in a NKT cell-dependent manner (Fig. 7). As we also demonstrated associations between hypercholesterolemia, NKT cell lipid peroxidation and loss in people with obesity, NAFLD, and NAFLD-HCC, our findings define a potentially new mechanism of action of statins in HCC protection [49–51], and lay the mechanistic foundation for the potential clinical applications of NKT cell-based modalities for NAFLD-HCC prevention.
Fig. 7.
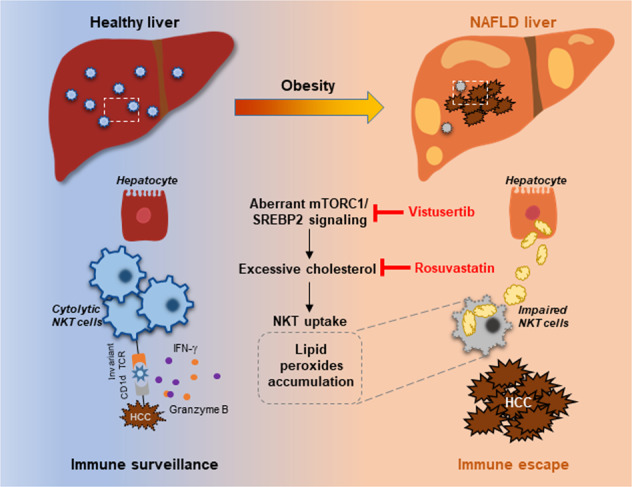
Schematic diagram of our study. Aberrant mTORC1/SREBP2-mediated cholesterol accumulation causes NKT dysfunction in the NAFLD liver microenvironment, undermining the antitumor immunosurveillance in obesity. Our study provides intervention strategies e.g. vistusertib and rosuvastatin that invigorating NKT cells to control HCC in the obesity epidemic
There are two major types of NKT cells, which exert opposing roles in cancer development. A recent study pinpointed that the type I NKT cells with extensive IFN-γ production and tumor-killing effects are antitumor effector cells, while type II NKT cells could promote tumor growth via IL-10 production [52]. Using a choline-deficient high-fat diet (CD-HFD)-induced NASH model, Heikenwalder and colleagues showed that type II NKT cell accumulation in the liver promotes NASH and HCC development through interaction with hepatocytes via inflammatory signaling and cytokine production [53]. Indeed, the Ja18−/− or Cd1d−/− mice that lack type I NKT cells still developed NASH upon CD-HFD stimulation [54]. In concordance, our study has identified the key role of IFN-γ-producing type I NKT cells in antitumor immunosurveillance, thus highlighting the distinct functional significance of NKT subtypes in NASH progression.
Cholesterol metabolism is critical for tumor initiation and development through cancer cell-intrinsic mechanisms and immune cell modulation in the tumor microenvironment (TME) [55]. Our results suggest that modulating cholesterol metabolism in the fatty liver reinvigorates antitumor immunity by NKT but not CD8+ T cells. This notion is supported by the preferential loss of NKT cells in the cholesterol-rich fatty liver microenvironment but normalized in the obese mice treated with rosuvastatin and AZD2014. Depleting NKT instead of CD8+ T cells abrogated the tumor-preventive effects of both drugs in the orthotopic HCC models. The dramatic reduction of tumors developed in the spontaneous NAFLD-HCC model treated prophylactically with the mTOR inhibitor corroborated these data, showing reduced liver cholesterol level and restoration of hepatic NKT cells. Excessive free cholesterol uptake by CD8+ T cells has been shown to induce functional exhaustion via upregulation of co-inhibitory ligands such as programmed death 1 (PD-1) and downregulation of cytolytic cytokines including IFN-γ, granzyme B, and IL-9 in the TME [56, 57]. In the context of diet-induced obesity, however, fatty acid partitioning and utilization by tumor cells in the TME might impair CD8+ T cell infiltration and antitumor function [5]. Recently, Dudek et al. reported that fatty acid-induced metabolic activation of CD8+ T cells, characterized by tissue residency with effector and exhaustion markers, execute auto-aggression in the development of obesity-induced NASH [54]. These studies showed the important roles of fatty acids in CD8+ T cell dysfunction, which may limit effective antitumor immune responses in NAFLD. Thus, our study suggests that reprogramming of NKT cells, another major hepatic lymphocytes [19, 20] may be an effective strategy to improve antitumor immunosurveillance in obesity-induced NASH.
The roles of hepatocyte intrinsic mTORC1/SREBP2 pathway in liver metabolism and hepatocarcinogenesis are well-established [58, 59]. Recent study also suggested that P53 loss-induced HCC tumorigenesis is dependent on SREBP2-mediated mevalonate pathway activation [60]. Although mTOR signaling in cancer cells can stimulate MDSC accumulation for tumor immunosuppression, its role in regulating immune microenvironment under the context of NAFLD is not clear [61]. Using both in vivo and in vitro models, we demonstrated that obesity-induced over-activation of mTORC1/SREBP2 cascade in NAFLD liver abolished the proportion and function of NKT cells. To exclude the direct antitumor effects of mTOR inhibitor and Srebp2 knockdown in our orthotopic NAFLD-HCC model, we applied AZD2014 treatment and shSrebp2-lentivirus before tumor inoculation and showed that modulating the NAFLD immune microenvironment alone could reduce tumorigenicity even without suppressing the tumor-intrinsic mTOR/SREBP2 signaling. More specifically, lentivirus-mediated Srebp2 knockdown recovered antitumor immune surveillance by reducing cholesterol content and revitalizing NKT cells in the liver. This work has illustrated a non-canonical oncogenic function of mTORC1/SREBP2 pathway in NAFLD immunological network, thus providing additional cellular target of this druggable pathway against NAFLD-associated tumor development.
The major risk factors of HCC are undergoing a global transition, with the prevalence of hepatitis B and C viruses declining while obesity and diabetes increasing in many regions [62]. Moreover, patients with non-viral HCC, in particular NAFLD-associated HCC, are less responsive to T cell-based immunotherapy targeted at PD-1 or its ligand PD-L1, possibly due to fatty acid-induced aberrant T cell activation causing tissue damage that impairs immune surveillance [30, 54]. Our results from obese mice and people provide a mechanistic linkage between mTORC1/SREBP2 activation, hepatic cholesterol accumulation, and impaired antitumor immunosurveillance in NAFLD. Our study also highlights the importance of manipulating mTORC1/SREBP2/cholesterol signaling cascade as an alternative strategy to prevent and treat HCC in the era of obesity epidemic.
Materials and methods
Antibodies
Antibodies used for immunoblotting, immunohistochemistry and flow cytometry were as follows: Phospho-mTOR (Ser2448) Antibody (CST 2971S), mTOR (7C10) Rabbit mAb (CST 2983S), Phospho-p70 S6 Kinase (Thr389) Antibody (CST 9205S), p70 S6 Kinase (49D7) Rabbit mAb (CST 2708S), Phospho-4E-BP1 (Thr37/46) (236B4) Rabbit mAb (CST 2855S), 4E-BP1 (53H11) Rabbit mAb (CST 9644S), SREBP1 Antibody (2A4) (Santa Cruz sc-13551), Anti-SREBP2 Antibody (Abcam ab30682), β-Actin (8H10D10) Mouse mAb (CST 3700S) (1:1,000 for immunoblotting); Mouse anti-Human CD3 (CD3-12) (Bio-rad MCA1477), NCAM1 (CD56) (123C3) Mouse mAb (CST 3576S), CD57 Monoclonal Antibody (HNK-1 (Leu-7)) (Invitrogen MA5-11605), CD8α (C8/144B) Mouse mAb (CST 70306), Goat Anti-Rat IgG H&L (Abcam Alexa Fluor® 594) (ab150160), Goat anti-Mouse IgG H&L (Invitrogen Alexa Fluor 488) (A-11029), Hoechst 33342 Solution (20 mM) (Thermo Fisher Scientific 62249) (1:200 for immunohistochemistry); Anti-mouse CD3 (clone 17A2, Biolegend 100241), anti-mouse CD4 (clone GK1.5, Biolegend 100428), Anti-mouse CD8 (clone 53-6.7, Biolegend 100714), anti-mouse CD11b (clone M1/70, Biolegend 101208), Anti-mouse CD45 (clone 30-F11, Invitrogen, 17-0451-82), Anti-mouse NK1.1 (clone PK136, Biolegend 108753), Anti-mouse Gr-1 (clone RB6-8c5, BD 557661), Anti-mouse CD69 (clone H1.2F3, Biolegend 104507), Anti-mouse TCRβ (clone H57-597, Invitrogen 11-5961-82), Anti-mouse F4-80 (clone BM8, Biolegend 123116), Anti-mouse Ly-6C (clone HK1.4, Invitrogen 48-5932-82), Anti-mouse Ly-6G (clone 1A8, Biolegend 127643), Anti-human CD3 (clone UCHT1, Biolegend 300458), Anti-human CD56 (clone TULY56, Invitrogen 12-0567-42), Anti-human TCRVα24-jα18 (clone 6B11, Biolegend 342902) for flow cytometry.
Human samples
Peripheral blood from 7 healthy donors and 8 obese people (Fig. S4A) were collected from Hong Kong Red Cross or Prince of Wales Hospital (Hong Kong), respectively. 26 liver biopsies from obese people who underwent gastric bypass surgery (Fig. S4B) and 30 tumor-surrounding liver tissues from NAFLD-HCC patients who underwent liver surgery (Fig. S4C) were collected from Prince of Wales Hospital (Hong Kong). Eight histologically normal livers from donors of liver transplantation were collected from Shanghai Ren Ji Hospital. All the obese people (age around 23–62, body mass index >40 kg/m2) were reported with a history of metabolic syndrome (10 out of 16 were diagnosed with type 2 diabetes). Written informed consents were obtained by all participants according to ethical approval from the joint The Chinese University of Hong Kong (CUHK)-New Territories East Cluster (NTEC) Clinical Research Ethics Committee or Shanghai Jiaotong University School of Medicine/Renji Hospital Ethics Committee, respectively.
Cell lines
Mouse C57BL/6 syngeneic RIL-175 HCC cell line (generous gift from Prof. Lars Zender and Prof. Tim Greten), immortal human hepatocyte LO2, human HCC cell line Huh7, and 293 T cells (ATCC) were cultured in dulbecco’s modified eagle medium (DMEM, Gibco, Invitrogen) supplemented with 10% fetal bovine serum (FBS, Gibco, 10500064) at 37 °C in 5% CO2 humidified atmosphere.
LO2-SREBP2 and LO2-VECTOR stable cell lines were transduced by lentivirus packaged from pLV[Exp]-EGFP:T2A:Puro-CBh>hSREBF2[NM_004599.3] or control vector. The transduced cells were selected for stable gene expression using puromycin (2 μg/mL). Upon 2 weeks of puromycin selection, the expression level of SREBP2 and downstream genes were evaluated by RT-qPCR and western blot.
Primary cell isolation and culture
Peripheral blood mononuclear cells (PBMCs) were freshly isolated from whole blood of anonymous healthy donors or obese people using Ficoll-Hypaque (GE Healthcare). PBMCs were cultured in RPMI1640 supplemented with 10% FBS (Gibco) at 37 °C in 5% CO2 humidified atmosphere.
Single cells were isolated from fresh liver and tumor tissues by liver dissociation kit mouse (Miltenyi Biotec, 130-105-807) and gentleMACS Dissociators (Miltenyi Biotec) following manufacturer’s instructions.
Mouse NKT cells were sorted by flow cytometry (FACSAria Fusion) using anti-mouse CD45, NK1.1, TCRβ from the livers of HFHC mice received vehicle or rosuvastatin and cultured in RPMI1640 supplement with 10% FBS. Human NKT cells were sorted from PBMCs by flow cytometry (FACSAria Fusion) using anti-human CD3, CD56 and TCRα and cultured with conditional medium (CM) from LO2 stable cell lines, or RPMI1640 supplement with 10% FBS, IL-2 (30 IU/mL, R&D system, 202-IL) and α-GalCer (100 ng/mL, Abcam, ab144262), and treated with cholesterol (20 μg/mL, Merck, 57-88-5) as indicated.
Animal experiments
Mice were obtained and housed at Laboratory Animal Services Centre of CUHK under specific pathogen-free condition. All animal experiments were carried out in accordance with the guidelines approved by the Animal Experimentation Ethics Committee of The Chinese University of Hong Kong (CUHK-AEEC).
For the diet-induced NAFLD/NASH mouse model, 6-week-old C57BL/6 male mice were randomly assigned to receive regular control diet (CD), high-fat high-carbohydrate (HFHC) diet (D12331, RESEARCH DIETS, USA) plus drinking water enriched with high-fructose corn sirup or a high cholesterol (Hcho) diet [63] (D12336, 1.25% cholesterol, RESEARCH DIETS, USA) for 15 weeks. An additional batch of 6-week-old C57BL/6 male mice was randomly assigned to receive CD or choline-deficient, L-amino acid-defined, high-fat diet (CDAHFD) (A06071302, RESEARCH DIETS, USA) for 3 weeks. HFHC-fed mice were treated with vehicle control, AZD2014 (10 mg/kg, AstraZeneca), or rosuvastatin (40 mg/kg, AstraZeneca) via oral gavage (5 times/week). Mice were sacrificed at week 15. Blood and livers were collected for plasma and primary cell isolation, cholesterol measurement, immune profiling analysis by multi-color flow cytometry as well as western blot, H&E, and Sirius red staining.
For the NAFLD/NASH-HCC mouse model, 6-week-old C57BL/6 male mice were firstly fed with HFHC for 15 weeks or CDAHFD for 3 weeks. 5 × 10⁵ RIL-175 cells were then intrahepatically injected into the left liver lobe by microsyringe at week 15. NKT cell inactivation or CD8+ T cell depletion were conducted by intraperitoneally administration of anti-CD1d antibody (10 mg/kg, clone 19G11, BE0000, BioXCell) or anti-CD8α antibody (10 mg/kg, clone YTS169.4, BE0117, BioXCell) one day before tumor inoculation, at day 6 and 11 post-tumor implantation respectively. Isotype (rat IgG1 HRPN, BE0088, BioXCell) was used in parallel as control. All mice were sacrificed 2 weeks post-tumor inoculation or at the endpoints approved by CUHK-AEEC. Tumor and blood were collected for primary cell isolation and subsequent immune profiling analysis.
For the spontaneous NAFLD-HCC mouse model, 2-day-old male mice were intraperitoneally injected with a single dose of streptozocin (STZ) [200 μg diluted in 15 μL of 0.01 M sodium citrate buffer (pH 4.5)] and fed with HFHC diet from the age of 4–19 weeks. All mice were sacrificed at week 19 or at the endpoints approved by CUHK-AEEC. Blood and livers were collected for plasma and primary cell isolation, and subsequent cholesterol measurement as well as immune profiling analysis.
Cholesterol measurement
Plasma was directly used for cholesterol measurement by cholesterol quantification kit (Abcam ab65359) according to manufacturer’s instruction. For total lipids extraction, briefly, 20 mg frozen liver tissues were homogenized in 200 μL of chloroform: isopropanol: NP-40 (7:11:0.1) buffer using a micro-homogenizer, and then spinned down at 15000 × g to obtain the lipid-containing organic phase. The liquid was vacuumed for 30 minutes to remove trace organic solvent and then the dried lipids were re-dissolved. The cholesterol level was measured by cholesterol quantification kit accordingly.
Flow cytometry
PBMCs or single cells isolated from liver or tumor tissues were collected and washed, then incubated with 2.4G2 mAb (Invitrogen, 1 μg/million cells) for 15 min at 4 °C to block Fc gamma receptors. For cell surface staining, single cells were incubated in 100 μL FACS staining buffer (1 × PBS with 1% FBS) with antibodies at the optimal dilution according to the manufacturer’s instructions for 20 min at room temperature. For intracellular staining, cells were permeabilized with 100 μL Fixation/Permeabilization solution (BD Biosciences, 554722) for 20 minutes at 4 °C, washed by 1× Perm/Wash buffer (BD Biosciences), and resuspended with indicated antibodies diluted in 100 μL 1 × Perm/Wash buffer for 60 minutes at 4 °C. Flow cytometry data were acquired by FACSAria Fusion (BD Biosciences) and analyzed by FlowJo software (Tree Star).
NKT cell expansion and cytotoxicity assay
For NKT cell expansion, human PBMCs were cultured in RPMI1640 supplement with 10% FBS, IL-2 (30 IU/mL, R&D system, 202-IL), and α-GalCer (100 ng/mL, Abcam, ab144262) for 7 days as described previously. Cholesterol (20 μg/mL, Merck, 57-88-5) was added in the culture medium. NKT cell proportion in PBMCs were determined by flow cytometry using antibodies against human CD3, CD56 and TCRα.
For NKT cytotoxicity analysis, LIVE/DEAD Viability/Cytotoxicity Kit (Invitrogen, MP03224) was used following manufacturer’s instructions. Briefly, mouse RIL-175 or human Huh7 cells were pre-labeled with cell-permeant calcein acetoxymethyl (AM), and co-cultured with mouse or human NKT cells respectively in medium containing ethdium homodimer-1 (EthD-1) for 2 h at 37 °C. Tumor cell death rate was determined by EthD-1 positive cells in total calcein AM-labeled tumor cells by flow cytometry.
Western blot
Protein lysates from cell lines or tissues were prepared using protease inhibitor cocktail-containing (Roche) lysis buffer (50 mM Tris-HCl, pH 7.5, 150 mM NaCl, 1% NP-40, 0.5% Na-deoxycholate) and T-PER Tissue Protein Extraction Reagent (Thermo Fisher Scientific, 78510), respectively. Protein concentration was determined by the Bradford method (Bio-Rad). Ten to fifty micrograms protein was resolved by 6–12% sodium dodecyl sulfate polycrylamide gel electrophoresis (SDS-PAGE) using Mini-PROTEAN® II apparatus (Bio-Rad), and transferred to nitrocellulose membrane (Bio-Rad). Membranes were blocked with 5% non-fat milk in 1× TBST and incubated with primary antibodies at 4 °C overnight followed by incubation with secondary antibodies for 2 h at room temperature. Antibody-antigen complexes were detected with Enhanced Chemiluminescence (GE Healthcare Life Sciences) and ChemDoc Imaging System (Bio-Rad). Signals were quantified by Image J software and defined as the ratio of target protein relative to β-actin.
In vivo lentivirus based gene knockdown experiment
Lentivirus was prepared by co-transfection of pMD2G (encoding for VSV G envelope protein), pCMVR8.74 (encoding for HIV-1 Gag, Pol, Tat and Rev proteins) and pGLVH1/GFP + Puro>mSrebp2/Vector (5′-GCCGTCTTCTATACCTGTAGA-3′) into 293 T cells using 2.5 M CaCl2 [25]. Culture medium was harvested 24 h post transfection and centrifuged at 400 × g for 5 min to remove cell dribs and filtered through a 0.45-μm filter. The virus particle was collected by ultracentrifuge (Beckman Optima (XPN-100) ULTRA-centrifuge) for 120 min at 50,000 × g, 4 °C and stored at −80 °C. The titer of lentivirus was determined by transducing units per milliliter (TU/mL). Lentivirus expressing pGLVH1/GFP + Puro>mSrebp2 or Vector was then administrated via tail vein injection at a dose of 5 × 10⁷ TU/mouse in HFHC-fed mice at week 12.
ELISA
Secreted granzyme B and IFN-γ were measured in cell culture supernatants from NKT cells by ELISA kits (Invitrogen BMS2027 and Biolegend 430104) respectively according to the manufacturer’s instructions.
RNA Isolation and reverse transcription-quantitative polymerase chain reaction (RT-qPCR)
Total RNA was extracted by using TRIzol reagent (Invitrogen). One microgram RNA was reversely transcribed to complementary DNA (cDNA) using Reverse Transcription Master Kit (Takara) according to the manufacturer’s instructions. For quantitative PCR analysis, cDNA was amplified using Power SYBR Green (SYBR® Premix Ex Taq™ II, Takara) and QuantStudio™ 7 Flex Real-Time PCR System (Applied Biosystems). GAPDH was used as an internal control. All reactions were performed in triplicate.
Intracellular cholesterol and lipid peroxidation measurement
Intracellular cholesterol measurement was conducted by Filipin III staining using Cholesterol Cell-Based Detection Assay Kit (Cayman Chemical, 10009779) in NKT cells or human PBMCs. Briefly, cells were fixed and stained with Filipin III solution for 60 min in the dark, and then washed, and flow cytometry analysis was performed within 2 h after staining.
Lipid peroxidation was measured according to the manufacturer’s protocol. Briefly, cells were incubated in humidified chamber at 37 °C with 5% CO2 for 30 min with Lipid Peroxidation Sensor (BODIPY™ 581/591 C11, Invitrogen, D3861) in cell culture medium. After incubation, cells were washed and examined by flow cytometry within 2 h of staining.
H&E and immunofluorescence staining
Liver and tumor tissues were collected and fixed in 4% paraformaldehyde (Sigma-Aldrich) for 24 h, washed in 70% ethanol, and embedded in paraffin. Five-millimeter sections from paraffin-embedded liver tissues were deparaffinized, rehydrated, and rinsed in distilled water. The sections were then stained with haematoxylin and eosin (H&E) or Sirius red. Antigen retrieval was done by using a pressure cooker with 1 mM EDTA buffer (pH 8.0) for 10 min. Immunofluorescence staining was then performed with monoclonal antibody against CD56 (1:200), CD8 (1:200) or CD57 (1:200) together with CD3 (1:200) and at 4 °C overnight. Hoechst (1:100) and secondary antibodies including Goat anti-Rat IgG H&L (Alexa Fluor 594, 1:200) and Goat anti-Mouse IgG H&L (Alexa Fluor 488, 1:200) were incubated with the slides for 2 h at room temperature in the dark. Slides were washed and mounted with a drop of VECTASHIELD® Antifade Mounting Medium (vector laboratories). The images were visualized by Q-imaging Digital Camera and Carl Zeiss Axiophot 2 Upright Microscope and Nikon live cell imaging system Ti-E inverted fluorescence microscope.
Bulk RNAseq and scRNAseq data analysis
The raw data of RNA sequencing (GEO: GSE135251) from Govaere et al. [28] were downloaded and DESeq2 (v1.30.1) was applied to perform differential gene expression analysis between NAFLD and health donor. Genes with counts less than 10 were removed from the analysis. Transcripts were variance stabilizing transformed using vst function to construct a PCA plot. Raw counts were then normalized with the default parameters. Differential genes were selected with log2FoldChange > 1.5 and q value < 0.01. Gene Ontology analysis was performed using the Hallmark gene sets from MSigDB.
The raw data of scRNAseq (GEO: GSE159977) from Pfister et al. [30] were downloaded. For quality control, we removed low quality reads according to the following criteria: (1) Number of expressed genes <200 & >6000; (2) Percentage of mitochondrial genes ≥ 10%. (3) Number of UMIs < 500 & >20000. Seurat v3 (v3.2.2) was applied for data normalization (SCTransform), principal component analysis (RunPCA), dimension reducntion (RunUMAP) and unsupervised graph-based clustering (FindNeighbors & FindClusters). Top marker genes were identified for each cluster (FindAllMarkers). KEGG pathway enrichment analysis of DEGs between healthy and NAFLD/NASH NKT cells was performed by ClusterProfiler [64].
Statistical analysis
Data were analyzed using GraphPad Prism 8 and are presented as mean ± SD. Statistical comparison between two groups was performed using the Mann-Whitney U test and unpaired Student’s t test to calculate two-tailed p value. The normality of data was confirmed by Shapiro–Wilk test with a P value greater than 0.05 when Student’s t test was applied. Statistical comparison between groups from the same donor was performed using the paired Student’s t test to calculate two-tailed p value. One-way ANOVA followed by Dunnett’s multiple comparison test were performed when more than two groups were included in the experimental results. Correlation analysis was assessed by Spearman’s correlation. Significance was defined as p value < 0.05.
Supplementary information
Acknowledgements
We acknowledge Prof. Lars Zender and Prof. Tim F. Greten for their kind gift of the RIL-175 HCC cell line. This project is supported by the University Grants Committee through the Collaborative Research Fund (C4045-18W), AstraZeneca Research Program (2017), General Research Fund (14105419, 14104820), the Li Ka Shing Foundation, and the Terry Fox Foundation.
Author contributions
WT, JZ, and ASLC conceived the study. WT and JZ conducted experiments, analyzed, and interpreted data. HW assisted with bioinformatics analysis. WY, YF, HW, MTSM, LZ, ZL, XL, ZX, XZ, J.Wang, J.Lu., J.Li., and XT assisted with animal experiments. HS, PCY, YH, HML, CCHL, HHWL, AWHC, KFT, J.Wong, PBSL, KKCN, SKHW, VWSW, and APSK. provided patient materials, acquired clinical data, assisted in analyzing NKT cell frequency in patient specimens and interpreted with clinical data. WT, JZ, and ASLC wrote the manuscript. JZ, PBSL, KKCN, VWSW, APSK, JJYS, and ASLC reviewed and edited the manuscript. JZ, JJYS, and ASLC acquired funding for the study. JZ and ASLC supervised the study. All authors read and provided feedback on the manuscript.
Data availability
All data in this study are available in the text and its Supplementary Information files. The data that support the findings of this study are available from the corresponding authors upon reasonable request. The RNAseq and scRNAseq data analyzed in this study were accessed with the Gene Expression Omnibus (GEO) series accession numbers: GSE135251 and GSE159977.
Competing interests
JZ and ASLC received the funding support and drug (vistusertib) from AstraZeneca. VWSW has consultancy in 3V-BIO, AbbVie, Allergan, Boehringer Ingelheim, Center for Outcomes Research in Liver Diseases, Echosens, Gilead Sciences, Hanmi Pharmaceutical, Intercept, Inventiva, Merck, Novartis, Novo Nordisk, Perspectum Diagnostics, Pfizer, ProSciento, Sagimet Biosciences, TARGET PharmaSolutions and Terns; has lectures in Abbott, AbbVie, Bristol-Myers Squibb, Echosens, Gilead Sciences and Novo Nordisk; received research grants from Gilead Sciences; and holds stock as co-founder of Illuminatio Medical Technology Limited. The other authors declare no competing interests.
Contributor Information
Jingying Zhou, Email: zhoujy@cuhk.edu.hk.
Alfred S. L. Cheng, Email: alfredcheng@cuhk.edu.hk
Supplementary information
The online version contains supplementary material available at 10.1038/s41423-022-00872-3.
References
- 1.Lauby-Secretanuby-Secretan B, Scoccianti C, Loomis D, Grosse Y, Bianchini F, Straif K. Body fatness and cancer-viewpoint of the IARC Working Group. N Engl J Med. 2016;375:794–8. doi: 10.1056/NEJMsr1606602. [DOI] [PMC free article] [PubMed] [Google Scholar]
- 2.Quail DF, Dannenberg AJ. The obese adipose tissue microenvironment in cancer development and progression. Nat Rev Endocrinol. 2019;15:139–54. doi: 10.1038/s41574-018-0126-x. [DOI] [PMC free article] [PubMed] [Google Scholar]
- 3.Demark-Wahnefriedmark-Wahnefried W, Platz EA, Ligibel JA, Blair CK, Courneya KS, Meyerhardt JA, et al. The role of obesity in cancer survival and recurrence. Cancer Epidemiol Biomark Prev. 2012;21:1244–59. doi: 10.1158/1055-9965.EPI-12-0485. [DOI] [PMC free article] [PubMed] [Google Scholar]
- 4.Avgerinos KI, Spyrou N, Mantzoros CS, Dalamaga M. Obesity and cancer risk: emerging biological mechanisms and perspectives. Metabolism. 2019;92:121–35. doi: 10.1016/j.metabol.2018.11.001. [DOI] [PubMed] [Google Scholar]
- 5.Ringelngel AE, Drijvers JM, Baker GJ, Catozzi A, García-Cañaveras JC, Gassaway BM, et al. Obesity shapes metabolism in the tumor microenvironment to suppress anti-tumor immunity. Cell. 2020;183:1848–66 e1826. doi: 10.1016/j.cell.2020.11.009. [DOI] [PMC free article] [PubMed] [Google Scholar]
- 6.Wardrd ZJ, Bleich SN, Cradock AL, Barrett JL, Giles CM, Flax C, et al. Projected U.S. state-level prevalence of adult obesity and severe obesity. N Engl J Med. 2019;381:2440–50. doi: 10.1056/NEJMsa1909301. [DOI] [PubMed] [Google Scholar]
- 7.Younossiunossi Z, Anstee QM, Marietti M, Hardy T, Henry L, Eslam M, et al. Global burden of NAFLD and NASH: trends, predictions, risk factors and prevention. Nat Rev Gastroenterol Hepatol. 2018;15:11–20. doi: 10.1038/nrgastro.2017.109. [DOI] [PubMed] [Google Scholar]
- 8.Bhaskaranaskaran K, Douglas I, Forbes H, dos-Santos-Silva I, Leon DA, Smeeth L. Body-mass index and risk of 22 specific cancers: a population-based cohort study of 5.24 million UK adults. Lancet. 2014;384:755–65. doi: 10.1016/S0140-6736(14)60892-8. [DOI] [PMC free article] [PubMed] [Google Scholar]
- 9.Powell EE, Wong VW, Rinella M. Non-alcoholic fatty liver disease. Lancet. 2021;397:2212–24. doi: 10.1016/S0140-6736(20)32511-3. [DOI] [PubMed] [Google Scholar]
- 10.Grohmannrohmann M, Wiede F, Dodd GT, Gurzov EN, Ooi GJ, Butt T, et al. Obesity drives STAT-1-dependent NASH and STAT-3-dependent HCC. Cell. 2018;175:1289–306 e1220. doi: 10.1016/j.cell.2018.09.053. [DOI] [PMC free article] [PubMed] [Google Scholar]
- 11.Masaroneasarone M, Rosato V, Dallio M, Gravina AG, Aglitti A, Loguercio C, et al. Role of oxidative stress in pathophysiology of nonalcoholic fatty liver disease. Oxid Med Cell Longev. 2018;2018:9547613. doi: 10.1155/2018/9547613. [DOI] [PMC free article] [PubMed] [Google Scholar]
- 12.Anstee QM, Reeves HL, Kotsiliti E, Govaere O, Heikenwalder M. From NASH to HCC: current concepts and future challenges. Nat Rev Gastroenterol Hepatol. 2019;16:411–28. doi: 10.1038/s41575-019-0145-7. [DOI] [PubMed] [Google Scholar]
- 13.Ioannou GN. The role of cholesterol in the pathogenesis of NASH. Trends Endocrinol Metab. 2016;27:84–95. doi: 10.1016/j.tem.2015.11.008. [DOI] [PubMed] [Google Scholar]
- 14.Ståhlberg D, Rudling M, Angelin B, Björkhem I, Forsell P, Nilsell K, et al. Hepatic cholesterol metabolism in human obesity. Hepatology. 1997;25:1447–50. doi: 10.1002/hep.510250623. [DOI] [PubMed] [Google Scholar]
- 15.Min HK, Kapoor A, Fuchs M, Mirshahi F, Zhou H, Maher J, et al. Increased hepatic synthesis and dysregulation of cholesterol metabolism is associated with the severity of nonalcoholic fatty liver disease. Cell Metab. 2012;15:665–74. doi: 10.1016/j.cmet.2012.04.004. [DOI] [PMC free article] [PubMed] [Google Scholar]
- 16.Huang DQ, El-Serag HB, Loomba R. Global epidemiology of NAFLD-related HCC: trends, predictions, risk factors and prevention. Nat Rev Gastroenterol Hepatol. 2021;18:223–38. doi: 10.1038/s41575-020-00381-6. [DOI] [PMC free article] [PubMed] [Google Scholar]
- 17.Hsiang JC, Wong GL-H, Tse Y-K, Wong VW-S, Yip TC-F, Chan HL-Y. Statin and the risk of hepatocellular carcinoma and death in a hospital-based hepatitis B-infected population: a propensity score landmark analysis. J Hepatol. 2015;63:1190–7. doi: 10.1016/j.jhep.2015.07.009. [DOI] [PubMed] [Google Scholar]
- 18.McEwen-Smith RM, Salio M, Cerundolo V. The regulatory role of invariant NKT cells in tumor immunity. Cancer Immunol Res. 2015;3:425–35. doi: 10.1158/2326-6066.CIR-15-0062. [DOI] [PMC free article] [PubMed] [Google Scholar]
- 19.Gao B, Radaeva S, Park O. Liver natural killer and natural killer T cells: immunobiology and emerging roles in liver diseases. J Leukoc Biol. 2009;86:513–28. doi: 10.1189/JLB.0309135. [DOI] [PMC free article] [PubMed] [Google Scholar]
- 20.Bandyopadhyay K, Marrero I, Kumar V. NKT cell subsets as key participants in liver physiology and pathology. Cell Mol Immunol. 2016;13:337–46. doi: 10.1038/cmi.2015.115. [DOI] [PMC free article] [PubMed] [Google Scholar]
- 21.Ma C, Han M, Heinrich B, Fu Q, Zhang Q, Sandhu M, et al. Gut microbiome-mediated bile acid metabolism regulates liver cancer via NKT cells. Science. 2018;360. 10.1126/science.aan5931. [DOI] [PMC free article] [PubMed]
- 22.Yang W, Feng Y, Zhou J, Cheung OK-W, Cao J, Wang J, et al. A selective HDAC8 inhibitor potentiates antitumor immunity and efficacy of immune checkpoint blockade in hepatocellular carcinoma. Sci Transl Med. 2021;13. 10.1126/scitranslmed.aaz6804. [DOI] [PubMed]
- 23.Zeng X, Zhou J, Xiong Z, Sun H, Yang W, Mok MTS, et al. Cell cycle-related kinase reprograms the liver immune microenvironment to promote cancer metastasis. Cell Mol Immunol. 2021;18:1005–15. doi: 10.1038/s41423-020-00534-2. [DOI] [PMC free article] [PubMed] [Google Scholar]
- 24.Tian Y, Wong VW, Wong GL, Yang W, Sun H, Shen J, et al. Histone deacetylase HDAC8 promotes insulin resistance and beta-catenin activation in NAFLD-associated hepatocellular carcinoma. Cancer Res. 2015;75:4803–16. doi: 10.1158/0008-5472.CAN-14-3786. [DOI] [PubMed] [Google Scholar]
- 25.Sun H, Yang W, Tian Y, Zeng X, Zhou J, Mok M, et al. An inflammatory-CCRK circuitry drives mTORC1-dependent metabolic and immunosuppressive reprogramming in obesity-associated hepatocellular carcinoma. Nat Commun. 2018;9:5214. doi: 10.1038/s41467-018-07402-8. [DOI] [PMC free article] [PubMed] [Google Scholar]
- 26.Krenkel O, Hundertmark J, Abdallah AT, Kohlhepp M, Puengel T, Roth T, et al. Myeloid cells in liver and bone marrow acquire a functionally distinct inflammatory phenotype during obesity-related steatohepatitis. Gut. 2020;69:551–63. doi: 10.1136/gutjnl-2019-318382. [DOI] [PubMed] [Google Scholar]
- 27.Yao L, Abe M, Kawasaki K, Akbar SMF, Matsuura B, Onji M, et al. Characterization of liver monocytic myeloid-derived suppressor cells and their role in a murine model of non-alcoholic fatty liver disease. PLoS ONE. 2016;11:e0149948. doi: 10.1371/journal.pone.0149948. [DOI] [PMC free article] [PubMed] [Google Scholar]
- 28.Govaere O, Cockell S, Tiniakos D, Queen R, Younes R, Vacca M, et al. Transcriptomic profiling across the nonalcoholic fatty liver disease spectrum reveals gene signatures for steatohepatitis and fibrosis. Sci Transl Med. 2020;12:150. doi: 10.1126/scitranslmed.aba4448. [DOI] [PubMed] [Google Scholar]
- 29.Luo J, Yang H, Song BL. Mechanisms and regulation of cholesterol homeostasis. Nat Rev Mol Cell Biol. 2020;21:225–45. doi: 10.1038/s41580-019-0190-7. [DOI] [PubMed] [Google Scholar]
- 30.Pfister D, Nunez NG, Pinyol R, Govaere O, Pinter M, Szydlowska M, et al. NASH limits anti-tumour surveillance in immunotherapy-treated HCC. Nature. 2021;592:450–6. doi: 10.1038/s41586-021-03362-0. [DOI] [PMC free article] [PubMed] [Google Scholar]
- 31.Engel I, Seumois G, Chavez L, Samaniego-Castruita D, White B, Chawla A, et al. Innate-like functions of natural killer T cell subsets result from highly divergent gene programs. Nat Immunol. 2016;17:728–39. doi: 10.1038/ni.3437. [DOI] [PMC free article] [PubMed] [Google Scholar]
- 32.Baranek T, Lebrigand K, de Amat Herbozo C, Gonzalez L, Bogard G, Dietrich C, et al. High dimensional single-cell analysis reveals iNKT cell developmental trajectories and effector fate decision. Cell Rep. 2020;32:108116. doi: 10.1016/j.celrep.2020.108116. [DOI] [PubMed] [Google Scholar]
- 33.Kapanadze T, Gamrekelashvili J, Ma C, Chan C, Zhao F, Hewitt S, et al. Regulation of accumulation and function of myeloid derived suppressor cells in different murine models of hepatocellular carcinoma. J Hepatol. 2013;59:1007–13. doi: 10.1016/j.jhep.2013.06.010. [DOI] [PMC free article] [PubMed] [Google Scholar]
- 34.Kawachi Y, Fujishima Y, Nishizawa H, Nakamura T, Akari S, Murase T, et al. Increased plasma XOR activity induced by NAFLD/NASH and its possible involvement in vascular neointimal proliferation. JCI Insight. 2021;6:1. doi: 10.1172/jci.insight.144762. [DOI] [PMC free article] [PubMed] [Google Scholar]
- 35.Zhang X, Coker OO, Chu ES, Fu K, Lau HCH, Wang YX, et al. Dietary cholesterol drives fatty liver-associated liver cancer by modulating gut microbiota and metabolites. Gut. 2021;70:761–74. doi: 10.1136/gutjnl-2019-319664. [DOI] [PMC free article] [PubMed] [Google Scholar]
- 36.Liu D, Wong CC, Zhou Y, Li C, Chen H, Ji F, et al. Squalene epoxidase induces nonalcoholic steatohepatitis via binding to carbonic anhydrase III and is a therapeutic target. Gastroenterology. 2021;160:2467–82 e2463. doi: 10.1053/j.gastro.2021.02.051. [DOI] [PubMed] [Google Scholar]
- 37.Basu B, Dean E, Puglisi M, Greystoke A, Ong M, Burke W, et al. First-in-human pharmacokinetic and pharmacodynamic study of the dual m-TORC 1/2 inhibitor AZD2014. Clin Cancer Res. 2015;21:3412–9. doi: 10.1158/1078-0432.CCR-14-2422. [DOI] [PMC free article] [PubMed] [Google Scholar]
- 38.Janku F, Yap TA, Meric-Bernstam F. Targeting the PI3K pathway in cancer: are we making headway? Nat Rev Clin Oncol. 2018;15:273–91. doi: 10.1038/nrclinonc.2018.28. [DOI] [PubMed] [Google Scholar]
- 39.Liscum L, Faust JR. The intracellular transport of low density lipoprotein-derived cholesterol is inhibited in Chinese hamster ovary cells cultured with 3-beta-[2-(diethylamino)ethoxy]androst-5-en-17-one. J Biol Chem. 1989;264:11796–806. doi: 10.1016/S0021-9258(18)80136-3. [DOI] [PubMed] [Google Scholar]
- 40.Schmid H, Schneidawind C, Jahnke S, Kettemann F, Secker KA, Duerr-Stoerzer S, et al. Culture-expanded human invariant natural killer T cells suppress T-cell alloreactivity and eradicate leukemia. Front Immunol. 2018;9:1817. doi: 10.3389/fimmu.2018.01817. [DOI] [PMC free article] [PubMed] [Google Scholar]
- 41.Girotti AW, Korytowski W. Cholesterol hydroperoxide generation, translocation, and reductive turnover in biological systems. Cell Biochem Biophys. 2017;75:413–9. doi: 10.1007/s12013-017-0799-0. [DOI] [PMC free article] [PubMed] [Google Scholar]
- 42.Forcina GC, Dixon SJ. GPX4 at the crossroads of lipid homeostasis and ferroptosis. Proteomics. 2019;19:e1800311. doi: 10.1002/pmic.201800311. [DOI] [PubMed] [Google Scholar]
- 43.Girotti AW, Korytowski W. Cholesterol peroxidation as a special type of lipid oxidation in photodynamic systems. Photochem Photobiol. 2019;95:73–82. doi: 10.1111/php.12969. [DOI] [PMC free article] [PubMed] [Google Scholar]
- 44.Xu S, Chaudhary O, Rodríguez-Morales P, Sun X, Chen D, Zappasodi R, et al. Uptake of oxidized lipids by the scavenger receptor CD36 promotes lipid peroxidation and dysfunction in CD8(+) T cells in tumors. Immunity. 2021;54:1561–77 e1567. doi: 10.1016/j.immuni.2021.05.003. [DOI] [PMC free article] [PubMed] [Google Scholar]
- 45.Khan AA, Agarwal H, Reddy SS, Arige V, Natarajan B, Gupta V, et al. MicroRNA 27a Is a Key Modulator of Cholesterol Biosynthesis. Mol Cell Biol. 2020;40. 10.1128/MCB.00470-19. [DOI] [PMC free article] [PubMed]
- 46.Ma X, Xiao L, Liu L, Ye L, Su P, Bi E, et al. CD36-mediated ferroptosis dampens intratumoral CD8(+) T cell effector function and impairs their antitumor ability. Cell Metab. 2021;33:1001–12 e1005. doi: 10.1016/j.cmet.2021.02.015. [DOI] [PMC free article] [PubMed] [Google Scholar]
- 47.Neuschwander-Tetri BA. Therapeutic landscape for NAFLD in 2020. Gastroenterology. 2020;158:1984–98 e1983. doi: 10.1053/j.gastro.2020.01.051. [DOI] [PubMed] [Google Scholar]
- 48.Liu D, Wong CC, Zhou Y, Li C, Chen H, Ji F, et al. Squalene epoxidase induces nonalcoholic steatohepatitis via binding to carbonic anhydrase 3 and is a therapeutic target. Gastroenterology. 2021;160:2467–82. doi: 10.1053/j.gastro.2021.02.051. [DOI] [PubMed] [Google Scholar]
- 49.El-Serag HB, Johnson ML, Hachem C, Morgana RO. Statins are associated with a reduced risk of hepatocellular carcinoma in a large cohort of patients with diabetes. Gastroenterology. 2009;136:1601–8. doi: 10.1053/j.gastro.2009.01.053. [DOI] [PMC free article] [PubMed] [Google Scholar]
- 50.McGlynn KA, Divine GW, Sahasrabuddhe VV, Engel LS, VanSlooten A, Wells K, et al. Statin use and risk of hepatocellular carcinoma in a U.S. population. Cancer Epidemiol. 2014;38:523–7. doi: 10.1016/j.canep.2014.06.009. [DOI] [PMC free article] [PubMed] [Google Scholar]
- 51.Kaplan DE, Serper MA, Mehta R, Fox R, John B, Aytaman A, et al. Effects of hypercholesterolemia and statin exposure on survival in a large national cohort of patients with cirrhosis. Gastroenterology. 2019;156:1693–706 e1612. doi: 10.1053/j.gastro.2019.01.026. [DOI] [PubMed] [Google Scholar]
- 52.LaMarche NM, Kane H, Kohlgruber AC, Dong H, Lynch L, Brenner MB. Distinct iNKT cell populations use IFNgamma or ER stress-induced IL-10 to control adipose tissue homeostasis. Cell Metab. 2020;32:243–58 e246. doi: 10.1016/j.cmet.2020.05.017. [DOI] [PMC free article] [PubMed] [Google Scholar]
- 53.Wolf MJ, Adili A, Piotrowitz K, Abdullah Z, Boege Y, Stemmer K, et al. Metabolic activation of intrahepatic CD8+ T cells and NKT cells causes nonalcoholic steatohepatitis and liver cancer via cross-talk with hepatocytes. Cancer Cell. 2014;26:549–64. doi: 10.1016/j.ccell.2014.09.003. [DOI] [PubMed] [Google Scholar]
- 54.Dudek M, Pfister D, Donakonda S, Filpe P, Schneider A, Laschinger M, et al. Auto-aggressive CXCR6(+) CD8 T cells cause liver immune pathology in NASH. Nature. 2021;592:444–9. doi: 10.1038/s41586-021-03233-8. [DOI] [PubMed] [Google Scholar]
- 55.Huang B, Song BL, Xu C. Cholesterol metabolism in cancer: mechanisms and therapeutic opportunities. Nat Metab. 2020;2:132–41. doi: 10.1038/s42255-020-0174-0. [DOI] [PubMed] [Google Scholar]
- 56.Ma X, Bi E, Lu Y, Su P, Huang C, Liu L, et al. Cholesterol induces CD8(+) T cell exhaustion in the tumor microenvironment. Cell Metab. 2019;30:143–56 e145. doi: 10.1016/j.cmet.2019.04.002. [DOI] [PMC free article] [PubMed] [Google Scholar]
- 57.Ma X, Bi E, Huang C, Lu Y, Xue G, Guo X, et al. Cholesterol negatively regulates IL-9-producing CD8(+) T cell differentiation and antitumor activity. J Exp Med. 2018;215:1555–69. doi: 10.1084/jem.20171576. [DOI] [PMC free article] [PubMed] [Google Scholar]
- 58.Matter MS, Decaens T, Andersen JB, Thorgeirsson SS. Targeting the mTOR pathway in hepatocellular carcinoma: current state and future trends. J Hepatol. 2014;60:855–65. doi: 10.1016/j.jhep.2013.11.031. [DOI] [PMC free article] [PubMed] [Google Scholar]
- 59.Xue L, Qi H, Zhang H, Ding L, Huang Q, Zhao D, et al. Targeting SREBP-2-regulated mevalonate metabolism for cancer therapy. Front Oncol. 2020;10:1510. doi: 10.3389/fonc.2020.01510. [DOI] [PMC free article] [PubMed] [Google Scholar]
- 60.Moon SH, Huang CH, Houlihan SL, Regunath K, Freed-Pastor WA, Morris JP, et al. p53 represses the mevalonate pathway to mediate tumor suppression. Cell. 2019;176:564–80 e519. doi: 10.1016/j.cell.2018.11.011. [DOI] [PMC free article] [PubMed] [Google Scholar]
- 61.Welte T, Kim IS, Tian L, Gao X, Wang H, Li J, et al. Oncogenic mTOR signalling recruits myeloid-derived suppressor cells to promote tumour initiation. Nat Cell Biol. 2016;18:632–44. doi: 10.1038/ncb3355. [DOI] [PMC free article] [PubMed] [Google Scholar]
- 62.Marengo A, Rosso C, Bugianesi E. Liver cancer: connections with obesity, fatty liver, and cirrhosis. Annu Rev Med. 2016;67:103–17. doi: 10.1146/annurev-med-090514-013832. [DOI] [PubMed] [Google Scholar]
- 63.Tian D, Hong H, Shang W, Ho CC, Dong J, Tian XY. Deletion of Ppard in CD11c(+) cells attenuates atherosclerosis in ApoE knockout mice. FASEB J. 2020;34:3367–78. doi: 10.1096/fj.201902069R. [DOI] [PubMed] [Google Scholar]
- 64.Yu G, Wang LG, Han Y, He QY. clusterProfiler: an R package for comparing biological themes among gene clusters. OMICS. 2012;16:284–7. doi: 10.1089/omi.2011.0118. [DOI] [PMC free article] [PubMed] [Google Scholar]
Associated Data
This section collects any data citations, data availability statements, or supplementary materials included in this article.
Supplementary Materials
Data Availability Statement
All data in this study are available in the text and its Supplementary Information files. The data that support the findings of this study are available from the corresponding authors upon reasonable request. The RNAseq and scRNAseq data analyzed in this study were accessed with the Gene Expression Omnibus (GEO) series accession numbers: GSE135251 and GSE159977.