Abstract
In cold regions, calcium and magnesium chloride deicing salts damage concrete pavements due to the formation of certain deleterious chemical phases, including calcium oxychloride. While there is much research at a cement paste-scale, damage in concrete has been less studied. In this study, we evaluate concrete damage due to calcium and magnesium chloride and explain the roles of supplementary cementitious materials (SCM) replacement level, air entrainment, salt type, and exposure conditions in damage development. Various non-destructive test methods including bulk resistivity, mass change, and visual damage assessment were used to monitor the damage over time. Damage was reduced as the SCM replacement level and air content increased, regardless of exposure conditions. Bulk resistivity and visual assessment were promising indicators of damage. The product of 91-day bulk resistivity and the air content predicted concrete performance when exposed to concentrated deicing salts. Based on several criteria, mixtures with 20% fly ash replacement level or 35% slag mitigated damage significantly when the air content was greater than 5% by concrete volume. Damage mitigation mechanisms of SCM and air are discussed.
Supplementary Information
The online version contains supplementary material available at 10.1617/s11527-022-01992-y.
Keywords: Deicing salt, Calcium oxychloride, Non-destructive testing, Calcium chloride, Magnesium chloride
Introduction
Concrete pavements generally show long-term durability, however, early-age damage has often been reported at pavement joints in cold regions in North America and elsewhere [1–5]. While freeze–thaw does contribute to a portion of this damage, the other portion is associated with chemical reactions between specific deicing salts at high concentrations (calcium chloride, CaCl2, and magnesium chloride, MgCl2, at concentrations typically greater than 15% by mass) and calcium hydroxide in the concrete [1, 2, 6, 7]. These reactions lead to the formation of a solid phase known as calcium oxychloride, which causes damage to the concrete. Damage mechanisms have not been well studied and are poorly understood but are likely linked to crystallization and/or expansive pressures from the calcium oxychloride phase formation [7].
The most commonly suggested form of calcium oxychloride in concrete has the chemical formula 3Ca(OH)2⋅CaCl2⋅12H2O [5–8] and the reaction showing its formation is given in Eq. 1 [6]. A series of equations which describe the formation of calcium oxychloride when concrete is exposed to MgCl2 are discussed in Qiao et al., but, in summary, calcium oxychloride only forms when the Ca(OH)2/MgCl2 molar ratio is greater than 1 [9].
| 1 |
Much research has been performed on damage mitigation in cement pastes [9–12] and mortars [10, 13, 14], but damage in concrete has been less studied, especially over long-term exposure periods [15–18]. Paste and mortar research has shown that damage is reduced due to the replacement of cement with supplementary cementitious materials (SCMs) [7–14], which consume calcium hydroxide in pozzolanic/latent hydraulic reactions [19]. The damage is observed to be proportional to the amount of calcium oxychloride that can form, and this amount is linearly correlated with the calcium hydroxide content in cement pastes [1, 11, 20–23]. Indeed, based on cement paste results, threshold levels of SCM replacement, calcium hydroxide content, and calcium oxychloride content (around 15 g/100 g cement paste) for damage have been proposed [11, 12, 23]. Apart from SCM replacement, paste damage reduces as the curing duration increases from 28 to 91-days, especially for Class F fly ash [10]. In concrete, in addition to SCM replacement level, the damage reduces as the air entrainment increases [15, 18].
How other experimental conditions influence damage is unclear. Typically, increased concentrations of deicing salts lead to greater calcium oxychloride formation in cement pastes [20] and greater damage in concrete [24]. However, Julio-Betancourt suggested that there could be pessimum concentrations of CaCl2 for damage. These concentrations increase as the temperature is increased [17]. While these findings are important, the impacts of exposure conditions have not been evaluated in concrete mixtures in which both air and SCM contents were significantly and systematically varied. In this study, we evaluate two deicing salts (CaCl2 and MgCl2) using two exposure conditions (5 °C constant exposure and 5 °C to 20 °C temperature cycles). Multiple concrete mixtures with varying air and SCM contents were exposed to these conditions and damage was monitored over the long-term using mass change, bulk resistivity, and visual observation. This study is the third part of a larger project which investigates the damage of cement paste, mortar [10], and concrete [15] exposed to high concentrations of deicing salts. In previous work, low-temperature cycles (− 8 °C to 25 °C) and CaCl2 exposure were studied. Damage was reduced as the SCM replacement level and curing time increased. Mortar and concrete generally outperformed cement pastes [10, 15].
Materials and methods
Materials
Type I/II ordinary portland cement (OPC), Class F fly ash, and ground granulated blast furnace slag (referred to as slag in the text), were used as cementitious materials in the concretes. The chemical compositions of the cementitious materials obtained from the manufacturer or through X-ray fluorescence testing performed on beads using a calibrated device are given in Table 1 [10, 15].
Table 1.
| Oxide | Cementa | Fly ash | Slag |
|---|---|---|---|
| SiO2 | 19.90 | 56.01 | 32.09 |
| Al2O3 | 4.55 | 21.71 | 12.88 |
| Fe2O3 | 3.77 | 12.98 | 0.75 |
| CaO | 63.96 | 4.81 | 42.44 |
| MgO | 1.17 | 1.03 | 6.53 |
| SO3 | 2.35 | 0.37 | 3.03 |
| K2O | 0.37 | 2.57 | 0.27 |
| Na2O | 0.18 | 0.30 | 0.13 |
aThe cement had a limestone content of 3.8%, an LOI of 2.5%, and a Blaine fineness of 386 m2/kg
The chemical admixtures used in the concrete included a commercial superplasticizer and an air entraining agent [10, 15]. Coarse aggregates were oolitic limestone (nominal maximum size 25.4 mm, 3.75% absorption capacity) and fine aggregates were siliceous sand (nominal maximum size 4.75 mm, 2.84% absorption capacity) [10, 15]. Mixing water quantities were corrected for aggregate water content before mixing. Commercial deicing CaCl2 and MgCl2 with > 95% purity were used to prepare solutions with 20% concentration by mass by thoroughly mixing the salts with tap water.
Mixing and curing procedures
Concrete mixtures were designed with water-to-cementitious materials ratio (w/cm) 0.40 and with fly ash and slag replacement levels of 0, 20, and 35% (by mass) and are shown in Table 2. Mixtures were designed to have targeted air contents of 2 ± 1%, 5 ± 1%, and 8 ± 1% which were achieved using the air entraining agent [15]. Superplasticizer was used in four mixtures which showed poor workability at the time of mixing. The tolerances in the air contents were somewhat smaller than the 1.5% which is common in field conditions [15]. These mixtures are modified variants of a realistic base mixture design, which was obtained after discussion with a ready-mix concrete producer [15]. The concrete was mixed in a rotating drum mixer [15]. The aggregates were initially added and mixed for one minute. Subsequently, the cementitious materials were added, and mixing was continued for two minutes. Finally, water and chemical admixtures were added, and mixing was continued for a further ten minutes. Air content was tested for all mixtures. After mixing, nine 100 × 200 mm concrete cylinders were cast for each mixture and moist cured for 91 days.
Table 2.
Concrete mixtures tested in this study for 1 m3 mixture
| Mixture | TAC* (%) |
w/cm | Cement (kg/m3) | Fly ash (kg/m3) |
Slag (kg/m3) |
Sand (kg/m3) |
Coarse aggregate (kg/m3) |
Air entrainer (%) |
SP (%) |
|---|---|---|---|---|---|---|---|---|---|
| OPC-1.9 | 2 | 0.40 | 372 | – | – | 757 | 1051 | – | 0.30 |
| OPC-6.2 | 5 | 0.40 | 372 | – | – | 757 | 1051 | 0.10 | – |
| OPC-8.5 | 8 | 0.40 | 372 | – | – | 757 | 1051 | 0.38 | – |
| FA20-1.6 | 2 | 0.40 | 298 | 74 | – | 757 | 1051 | – | 0.11 |
| FA20-5.1 | 5 | 0.40 | 298 | 74 | – | 757 | 1051 | 0.24 | 0.09 |
| FA20-7.0 | 8 | 0.40 | 298 | 74 | – | 757 | 1051 | 0.66 | – |
| FA35-0.9 | 2 | 0.40 | 242 | 130 | – | 757 | 1051 | – | – |
| FA35-4.3 | 5 | 0.40 | 242 | 130 | – | 757 | 1051 | 0.30 | – |
| FA35-8.1 | 8 | 0.40 | 242 | 130 | – | 757 | 1051 | 0.75 | – |
| SL20-1.1 | 2 | 0.40 | 298 | – | 74 | 757 | 1051 | – | 0.26 |
| SL20-5.0 | 5 | 0.40 | 298 | – | 74 | 757 | 1051 | 0.08 | – |
| SL20-7.0 | 8 | 0.40 | 298 | – | 74 | 757 | 1051 | 0.20 | – |
| SL35-1.3 | 2 | 0.40 | 242 | – | 130 | 757 | 1051 | – | – |
| SL35-4.5 | 5 | 0.40 | 242 | – | 130 | 757 | 1051 | 0.10 | – |
| SL35-9.0 | 8 | 0.40 | 242 | – | 130 | 757 | 1051 | 0.30 | – |
TAC is target air content, SP is superplasticizer; SP and air entrainer are by weight of cementitious material
Test methods
Concrete air content
After ten minutes of mixing, the concrete was tested for air content in accordance with ASTM C231.
Low temperature exposure cycles
After 91 days of curing, three concrete cylinders from each mixture were submerged in 20% CaCl2 solutions in a sealed container (liquid–solid ratio ~ 0.7 by mass) and moved into a refrigerator for 48 h. After 48 h of immersion, the refrigerator was turned off and left fully opened and exposed to room temperature for 48 h after which the procedure was repeated. Using this method, each cycle took 96 h. Residue and spalled material in the containers were removed on average every 30 cycles. The CaCl2 solution was replaced with fresh solution every 100 cycles. Solution replenishment guidelines for such exposures are not available in literature, and the frequency was limited in practice by the amount of effort and massive solution volumes needed for more frequent replenishment. Temperature was monitored for ambient conditions, the CaCl2 solution, and the core of the concrete cylinders during the exposure cycles and the average values are shown in Fig. 1 [10, 15]. The average ambient temperature was 20 ± 1 °C. The lowest average temperatures for the cylinders and the solution were measured to be 5 ± 2 °C in the refrigerator. In each cycle, in the first half, the cylinders spend about 40 h at 5 ± 2 °C. In the second half, the temperatures slowly increase to about 20 °C over the next 24 h, after which they are relatively unchanged. The cycle was restarted after 96 h. These specimens are denoted as Group 1 specimens in the rest of the text.
Fig. 1.
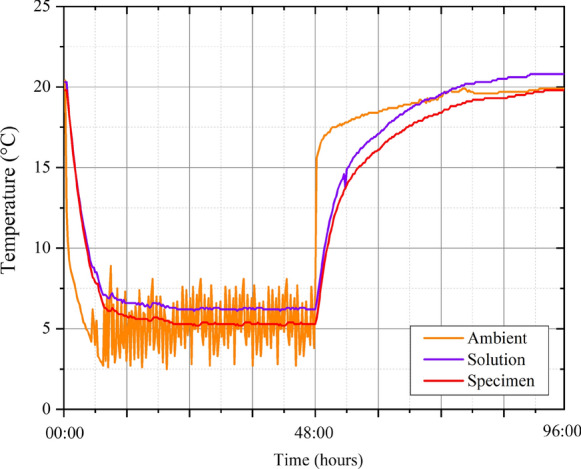
Temperature monitoring for samples exposed to low temperature cycles
Constant temperature exposure
After 91 days of curing, two concrete cylinders from each mixture design were submerged in 20% CaCl2 solution in a large, sealed container (liquid–solid ratio ~ 0.7 by mass) and were then moved into an industrial refrigerator which was set to a constant temperature of 5 ± 1 °C. These specimens are denoted as Group 2 specimens. Two cylinders from each mixture were submerged in 20% MgCl2 solution in a separate but similar large container and kept in the same refrigerator as the Group 2 specimens. These latter specimens were labeled Group 3 specimens (Table 3).
Table 3.
Specimen group numbers based on tested conditions
| Group number | Description | Solution | Duration |
|---|---|---|---|
| Group 1 | Low temperature cycles (5 °C to 20 °C) | 20% CaCl2 | Up to 150 cycles/600 days |
| Group 2 | Constant temperature (5 °C) | 20% CaCl2 | Up to 600 days |
| Group 3 | Constant temperature (5 °C) | 20% MgCl2 | Up to 600 days |
All specimens were exposed for a total of 600 days to the concentrated salt solutions.
Mass change
For Group 1 specimens, the masses of the concrete cylinders were measured at 91 days and after approximately every 15 cycles during the first 75 cycles of the experiment and approximately every 30 cycles on average for the rest of experiment up to 150 cycles (600 days). For Group 2 and Group 3 specimens, the masses were measured at 91 days and after approximately every 30 days during the first 150 days and then at every 100 days for up to 600 days. The relatively infrequent measurements in the latter half were in part due to COVID-19-related disruptions. Additionally, measurement frequency was reduced because many of the mixtures showed low levels of damage which did not change substantially over time in the latter portion of exposure. The surface of the concrete was air dried for 2 h in the laboratory at 25 ± 2 °C before mass was measured. The mass and dimensions were used to calculate density at 91 days. The COV values of the density measurements at 91 days based on three replicates ranged from 0.4 to 1.6% and averaged 0.7%.
Bulk resistivity
For Group 1 specimens, the bulk resistivity of the concrete cylinders was measured at 91 days and after approximately every 15 cycles for the first 75 cycles and every 30 cycles for the rest of the experiment. For Group 2 and Group 3 samples, the bulk resistivity was measured at 91 days and after approximately every 30 days for the first 150 days and every 100 days for the rest of the experiment. Measurements were based on ASTM C1876 and performed at a frequency of 1 kHz. The COV values of bulk resistivity measurements at 91 days for three replicates ranged from 4.5 to 11.7% and averaged 6.7%.
Formation factor
Pore solution expression was performed on concrete cylinders following the procedure described in Montanari et al. [25]. The concrete cylinders were crushed with an electrical hammer equipped with a flat head. The crushed concrete was sieved using a 9.5-mm sieve and then introduced inside an apparatus similar to the one designed by Longuet and then modified and improved by Barneyback and Diamond [25–27]. The apparatus is constituted of three interlocking gigs. The top gig was hollow in the middle and hosted the specimen during the expression. The expressed pore solution was collected inside a connected plastic vial. The apparatus was used in conjunction with a compression machine which applied a monotonic load at a rate of 2450 N/s up to a maximum pressure of 985 MPa. Once the maximum pressure was reached, it was held constant for three minutes. For each specimen, the pore solution was expressed from two replicates. After the expression, each pore solution was filtrated by using a 0.3 µm filter and a vacuum flask. The pore solutions were then stored at 5 °C until they were tested.
Pore solution electrical resistivity was measured by means of a cylindrical plastic cell, whose ends were in contact with two stainless steel electrodes [25, 28]. The pore solution was introduced inside the plastic cell through a syringe. An alternate current with frequency of 30 kHz was then applied to the electrodes and the impedance of the pore solution was measured, together with the corresponding phase angle. The resistivity was calculated by multiplying together the impedance, the cosine of the phase angle, and the geometry factor of the cell (the ratio of the cross-sectional area and the length). The temperature effect on resistivity was accounted for by applying an activation energy-based correction to the test results [28]. Two pore solution replicates were measured for each system.
The (apparent) formation factor was calculated by dividing the measured bulk resistivity with the pore solution electrical resistivity.
Visual damage monitoring
A visual damage classification method for concrete developed in [15] was used here (Table 4). At each measurement cycle (or day), each cylinder was carefully observed and assigned one classification for each measurement. As the visual damage is only assessed periodically, the condition of the concrete in between cycles is assumed to be an average of the prior and next measurement.
Table 4.
Visual damage classification [15]
| Damage classification | Description | Representative image |
|---|---|---|
| None | No signs of cracks on the ends or the sides of the cylinders |
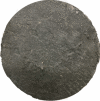
|
| Minor | Short and thin cracks on the ends but no damage on the sides of the cylinders |
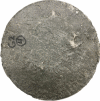
|
| Moderate | Long and deep cracks on the ends; some cracking on the sides of the cylinders |
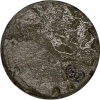
|
| Severe | Large amount of spalling at the ends of the cylinder; some cracking on the sides and middle but middle is still intact |

|
| Failure | More than half of the cylinder has spalled; cracks throughout the volume |

|
The cylinder width is ~10 cm
Post-exposure measurements
At the end of the experiment (600 days), concrete cylinders were tested for compressive strength in accordance with ASTM C39. All cylinders were capped with sulfur prior to testing. The coefficient of variation (COV) values of strength for three replicates ranged from 0.5 to 25.5% and averaged 10.4%.
In addition, when cylinders reached failure prior to the end of the experiment, they were broken into smaller pieces and small, representative, pieces from their cores were extracted and oven dried at 100 °C for 72 h. For specimens which lasted 600 days, small pieces were extracted after compressive strength testing. For all specimens, mass was measured before and after oven drying, and the reduction in mass is used as an estimate of the solution absorption.
An overview of the testing performed is shown in Table S1.
Results and discussion
Fresh and hardened properties of concrete
Table 5 shows the fresh and hardened properties of the concrete mixtures. The air content values ranged from 0.9 to 9.0%. Only in two cases (OPC-6.2 and FA35-0.9) were the target air contents not achieved. Loss of air content or the quality of the air void system is not considered in the current study; further studies on this topic are required. Neither the fresh concrete slump nor concrete strength were measured as prior studies showed no correlations between these properties and level of damage [15]. On the contrary, high-strength, OPC-only mixtures showed the worst damage resistance.
Table 5.
Fresh (air content) and hardened (density and bulk resistivity at 91-days) properties of the concrete
| Mixture | Air content (%) | Density (kg/m3) | Bulk resistivity (Ohm m) |
|---|---|---|---|
| OPC-1.9 | 1.9 | 2276 | 55.6 |
| OPC-6.2 | 6.2 | 2164 | 50.6 |
| OPC-8.5 | 8.5 | 2086 | 52.4 |
| FA20-1.6 | 1.6 | 2273 | 115.6 |
| FA20-5.1 | 5.1 | 2165 | 110.8 |
| FA20-7.0 | 7.0 | 2130 | 132.3 |
| FA35-0.9 | 0.9 | 2238 | 243.7 |
| FA35-4.3 | 4.3 | 2246 | 257.2 |
| FA35-8.1 | 8.1 | 2056 | 395.3 |
| SL20-1.1 | 1.1 | 2263 | 98.0 |
| SL20-5.0 | 5.0 | 2188 | 106.6 |
| SL20-7.0 | 7.0 | 2166 | 108.0 |
| SL35-1.3 | 1.3 | 2259 | 177.8 |
| SL35-4.5 | 4.5 | 2168 | 162.2 |
| SL35-9.0 | 9.0 | 2067 | 189.6 |
The 91-day bulk resistivity values for the concrete mixtures (Table 5) tested in this study were plotted against air content (Fig. 2). Values from a previous study, using the same materials and concretes with similar air contents, but cured for 28 days are also shown in the figure [15]. All mixtures showed increasing bulk resistivity as the curing duration increased from 28 to 91 days. However, the increase in the control mixture was negligible when compared to mixtures with SCMs, consistent with findings from literature which show that the incorporation of SCMs increases bulk resistivity, especially at later ages [29]. This increased bulk resistivity implies that the concrete has a more refined microstructure and reduced conductivity of the pore solution (due to pozzolanic/latent hydraulic reactions that result in greater alkali binding) [19, 30, 31]). The refined microstructure suggests that the concrete would be more resistant to solution ingress (and therefore, calcium oxychloride damage). The 91-day bulk resistivity increased as the SCM replacement increased and was higher for the more pozzolanic fly ash compared to the latent hydraulic slag [30, 31]. The air content did not have a strong impact on the bulk resistivity, except for the FA35 mixture, which showed a sharp increase in the bulk resistivity at the highest air content. Bulk resistivity measurements when curing is done in a moist room are somewhat complex to interpret and ideally these measurements should be done on specimens immersed in limewater or simulated pore solutions, which ensures controlled leaching and degree of saturation [32]. These last two curing choices were deliberately not utilized here because of the potential for reactions between calcium hydroxide that is deposited on the surface and deicing salt solutions that complicate interpretations of damage [33].
Fig. 2.
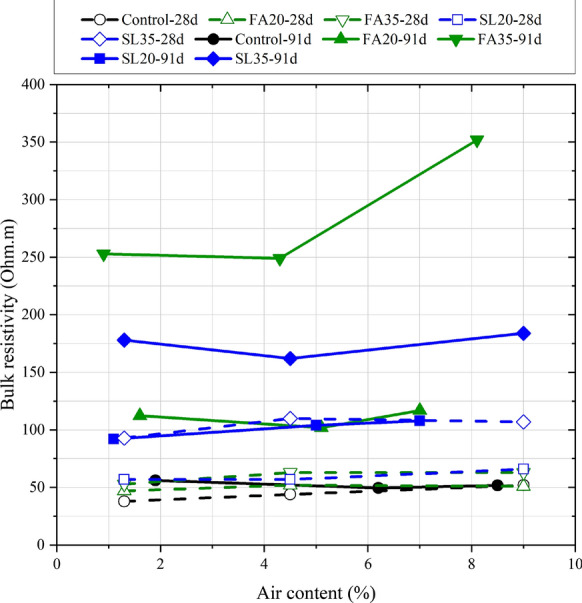
Bulk resistivity of the concrete specimens after 91 days of curing in the moist room compared with corresponding mixtures using similar materials cured for 28 days in the moist room [15]
Figure 3 shows a plot of the 91-day formation factor values (calculated using the measured pore solution resistivity) versus the bulk resistivity values. There was a strong linear relationship between the two parameters. Theoretically, because the bulk resistivity is affected by a number of experimental variables, it is often stated that the formation factor is a better parameter to use for durability assessments [33]. In this study, while there is some scatter, formation factor and bulk resistivity were interchangeable. This was because the range of bulk resistivity was much greater than the range of pore solution resistivities (the latter only varied from 0.27 to 0.49 Ohm m, with most values falling in a narrower range as shown in Figure S1). Similar correlations have also been reported in literature [34]. While the formation factor is considered by many to be a more fundamental parameter, its measurement can, depending on the followed procedures and saturation procedure, be complex. Therefore, for mixtures which do not have unusual admixtures or SCMs, the bulk resistivity may be an adequate proxy for the formation factor.
Fig. 3.
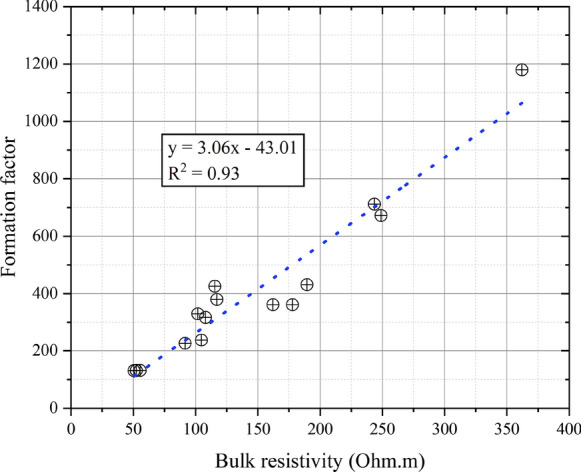
Formation factor plotted against bulk resistivity values at 91-days (before exposure)
Visual monitoring during exposure
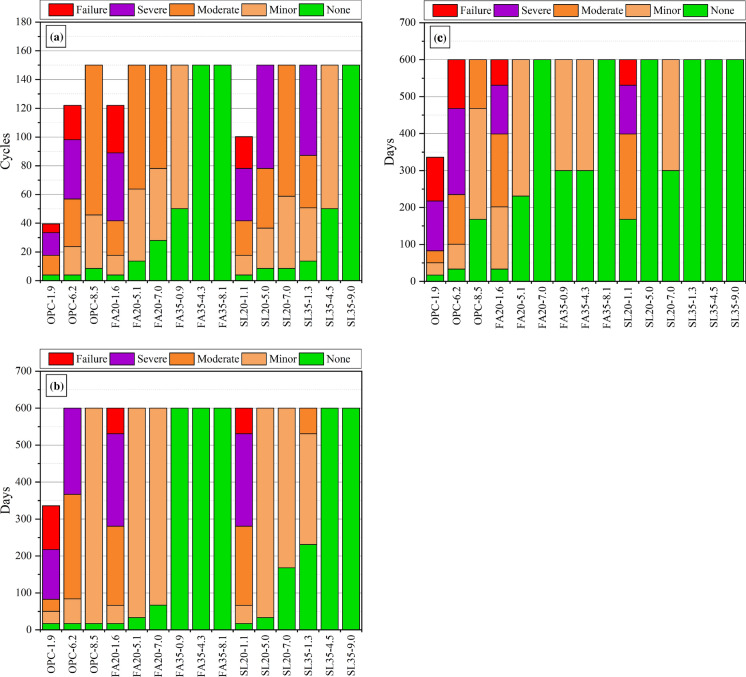
Figure 4 shows the damage progression in Group 1 (Fig. 4a), Group 2 (Fig. 4b), and Group 3 (Fig. 4c) specimens during exposure. The results show that increasing SCM replacement and air content significantly reduce the damage at any given exposure duration, an observation in alignment with literature [15]. The increase in durability due to air entrainment could be linked to the reduction in the degree of saturation due to changed (slower) sorption behavior of the air voids [3, 33, 35]. In addition, the air voids provide ‘space’ which reduces expansion/crystallization pressures associated with the formation of calcium oxychloride and other phases [3]. The increase in durability due to SCMs is because they reduce the amount of calcium oxychloride that forms (Eq. 1) through dilution, pozzolanic, and latent hydraulic reactions [15, 19, 20, 22, 23]. In addition, SCMs at later ages also likely reduce the ingress of the salt solutions due to a continuous refinement of the microstructure from pozzolanic reactions [36]. Finally, increased chloride binding in mixtures with SCM due to Friedel’s salt formation [37] could also reduce the amount of chloride available to form calcium oxychloride. In all cases, an increase in SCM replacement levels resulted in further damage reduction [15]. In all specimens, mixtures with low/no SCM and air entrainment showed the earliest signs of damage (often in the first 50 days of exposure) and the most rapid damage progression.
Fig. 4.
Visual damage classification evolution for a Group 1 specimens (150 cycles/600 days), b Group 2 specimens, and c for Group 3 specimens
In Group 1, OPC-1.9, OPC-6.2, FA20-1.6, and SL20-1.1 failed after 39, 122, 122, and 100 cycles. Three mixtures with the highest levels of SCM replacement (FA35-4.3, FA35-8.1, and SL35-9.0) did not show any sign of damage at the end of the exposure duration. By comparing Fig. 4b and c, damage caused by the different salts showed the same trends. In Group 2, OPC-1.9, FA20-1.6, and SL20-1.1 failed after 336 days, 600 days, and 600 days, respectively. Five mixtures with the highest SCM levels did not show any damage during exposure. In Group 3, OPC-1.9, OPC-6.2, FA20-1.6, and SL20-1.1 failed after 336 days, 600 days, 600 days, and 600 days, respectively. Six mixtures did not show any damage during exposure. Generally, damage was most severe in Group 1 (20% CaCl2, temperature cycles 5 to 20 °C), and the least severe in Group 2 (20% CaCl2, constant temperature 5 °C). Most crucially, in all exposure conditions, the effects of SCMs and air entrainment were consistent, with both substantially reducing damage. The same observation was made in harsher exposure conditions (25% CaCl2, temperature cycles − 8 to 25 °C), suggesting that the effects of SCMs and air entrainment in improving durability are universal and independent of exposure conditions [15]. The mixtures exposed previously to harsher conditions showed significantly more damage than the mixtures in this study, but it is unclear if that was largely due to the harsher conditions or if it was because those specimens were only cured for 28-days [10, 15]. It is known that both these factors (curing duration and exposure solution concentration) do affect damage significantly [10, 15, 20].
Mass changes during exposure
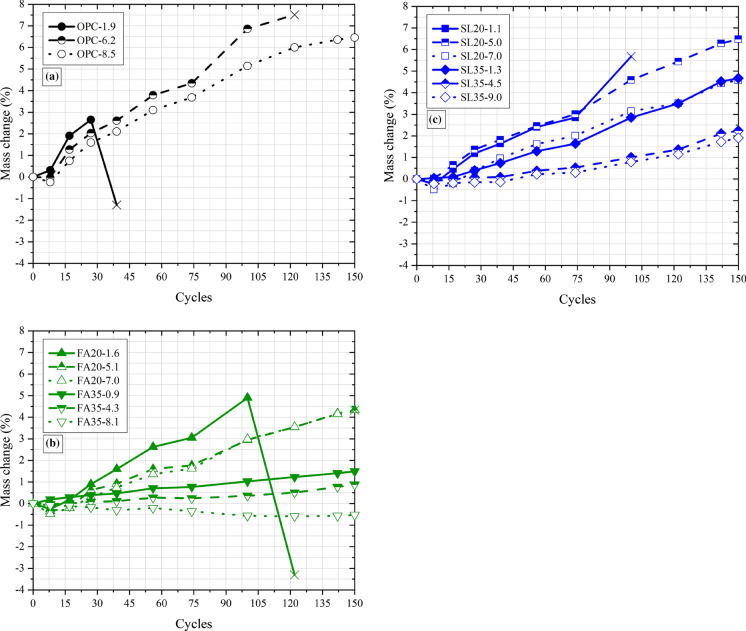
Figure 5 shows the mass change values for control (Fig. 5a), fly ash (Fig. 5b) and slag (Fig. 5c) Group 1 mixtures. The mass increases as the specimens are exposed to the salt solutions [15, 35]. Despite the scatter, the mass change behavior is roughly linear. In previous work [15], distinct non-linearity/bi-linear mass change behavior was apparent in mixtures with high SCM and high air content. Sorption in cementitious materials when plotted against the square root of time is known to follow bi-linear behavior with initial and final sorption behaviors being controlled by matrix saturation and air void saturation, respectively [3, 33, 38]. The linear behavior and the low values of mass change could imply that the air voids in high SCM/high air mixtures are unsaturated, due to a more refined microstructure and less aggressive exposure conditions [15, 34]. However, sorption in cementitious materials, even with water, is complex, and affected strongly by specimen preparation and other factors [33, 34, 38, 39]. For high concentrations of salt solutions, due to the chemical interactions affecting transport [40], advanced reactive transport models are likely needed to fundamentally explain mass change behavior. At any rate, further studies and direct measurements are needed to quantify air void saturation in these systems.
Fig. 5.
Mass change in Group 1 specimens plotted against the number of cycles (150 cycles/600 days total) for a control mixtures, b fly ash mixtures, and c slag mixtures. The “X” is the failure point for specimens that failed in this figure and the rest of the figures
Mass change is also affected by spalling and leaching processes, however, it appears in this case, that solution sorption dominated, as in all cases, the rate of mass change (slope of the curve) was reduced as the air content and SCM replacement level increased. Often, mixtures which showed poor durability showed high values of mass change (5% or greater), and mixtures which showed high durability showed low values of mass change (2% or lower). However, there were several exceptions, and there was no single level of mass change which corresponded to failure. In actuality, as SCM and air content increased, the mass change value that corresponded to failure increased. For the SCMs, this is because there is lower chemical damage potential at higher replacements due to the lower amount of calcium hydroxide [3, 21]. For the air, the reason is because a higher amount of solution needs to be absorbed in higher air content mixtures to reach degrees of saturation comparable to lower air content mixtures [3, 40, 41]. Therefore, the rate of mass change is critical. Because enough specimens have not failed, it is unclear how exactly the mass change at failure depends on SCM and air content. If this relationship could be determined, then based on the rate of mass change, times to failure/service life could be determined through curve fitting [15]. The final measurement is shown as “X” in these figures. This point is not reliable because significant spalling can occur around failure (reflected as a sharp drop in mass), which interferes with mass change measurements. Therefore, the mass change point that is before this final point was used for fitting and developing relationships (as in Table 6).
Table 6.
Slope of mass change curves (SLP), final mass change values (FMC), and damage at the end of the test for all groups
| Mixture | Group 1 | Group 2 | Group 3 | ||||||
|---|---|---|---|---|---|---|---|---|---|
| SLP | FMC (%) | Final damage | SLP | FMC (%) | Final damage | SLP | FMC (%) | Final damage | |
| OPC-1.9 | 2.49 | 2.65 | Failure | 3.16 | 2.43 | Failure | 4.30 | 2.48 | Failure |
| OPC-6.2 | 1.55 | 7.51 | Failure | 0.86 | 5.70 | Severe | 1.98 | 7.35 | Failure |
| OPC-8.5 | 1.11 | 6.45 | Moderate | 0.70 | 4.12 | Minor | 1.27 | 4.94 | Moderate |
| FA20-1.6 | 1.26 | 4.90 | Failure | 0.92 | 2.63 | Failure | 1.40 | 4.66 | Failure |
| FA20-5.1 | 0.81 | 4.33 | Moderate | 0.45 | 3.21 | Minor | 0.32 | 0.61 | Minor |
| FA20-7.0 | 0.85 | 4.33 | Moderate | 0.43 | 3.31 | Minor | 0.23 | 0.55 | None |
| FA35-0.9 | 0.23 | 1.49 | Minor | 0.12 | 0.80 | None | 0.22 | 1.00 | Minor |
| FA35-4.3 | 0.14 | 0.88 | None | 0.05 | 0.43 | None | 0.10 | − 0.14 | Minor |
| FA35-8.1 | − 0.09 | − 0.53 | None | 0.06 | 0.87 | None | 0.21 | 1.01 | None |
| SL20-1.1 | 1.33 | 5.68 | Failure | 0.77 | 4.14 | Failure | 0.43 | 0.77 | Failure |
| SL20-5.0 | 1.09 | 6.48 | Severe | 0.39 | 2.67 | Minor | 0.31 | 0.88 | None |
| SL20-7.0 | 0.87 | 4.57 | Moderate | 0.35 | 1.95 | Minor | 0.32 | 0.80 | None |
| SL35-1.3 | 0.83 | 4.67 | Severe | 0.27 | 1.75 | Minor | 0.11 | 0.38 | None |
| SL35-4.5 | 0.39 | 2.24 | Minor | 0.11 | 0.81 | None | 0.16 | 0.37 | None |
| SL35-9.0 | 0.40 | 1.91 | None | 0.14 | 1.36 | None | 0.23 | 0.72 | None |
When comparing fly ash and slag mixtures, the fly ash mixtures had lower mass changes, reflecting their overall lower damage status (Fig. 4a).
Figure S2 and Figure S3 (Supplementary Material) show the mass change values for control, fly ash, and slag mixtures in Group 2 and Group 3, respectively. Results from Group 2 and Group 3 were strikingly similar to those from Group 1: mass change behavior was roughly linear, increase in SCM replacement and air content resulted in lower rate of mass change in all mixtures, and tolerable mass change values increased as the SCM replacement and air content increased. The extent of sorption (mass change) was lower in Group 2 and Group 3 (constant temperature) than in the harsher exposure conditions in Group 1 (low temperature cycles), suggesting that the temperature cycling contributes to an increase in damage. One important difference in Group 3 mixtures is the significant initial reduction in mass in these specimens which was not that obvious in the other specimens. This initial decrease may be linked to calcium hydroxide leaching, which is known to be occur when mixtures are exposed to MgCl2 [9]. Support for this hypothesis comes from the fact that this initial decrease is not as apparent when the SCM replacement increases, which is expected because calcium hydroxide content also decreases as the SCM replacement increases. However, the reduction is almost 1% in some mixtures, which would need a large proportion of the present calcium hydroxide to leach, which may be unrealistic given the time and the specimen size. Therefore, leaching of other phases or gradual damage could also contribute to the reduction. Subsequent increases in masses in these specimens are higher than in Group 2 specimens. The increased leaching likely contributed to a more porous microstructure, which drove greater mass sorption, explaining the somewhat higher damage in Group 3 specimens when compared to Group 2 specimens (Fig. 4).
Table 6 shows the slope of the mass change curves multiplied by 100, based on linear fitting for all Groups 1 (SLP). The values are shown for all groups using a common unit of days. The final mass change (FMC) for the Groups and the damage state at the end of the test is also shown. As SCM replacement and air content increased, SLP reduced, and damage at the end of the test also reduced. At equivalent damage levels, FMC (or the tolerable mass change before failure) increased as SCM replacement and air content increased.
Bulk resistivity changes
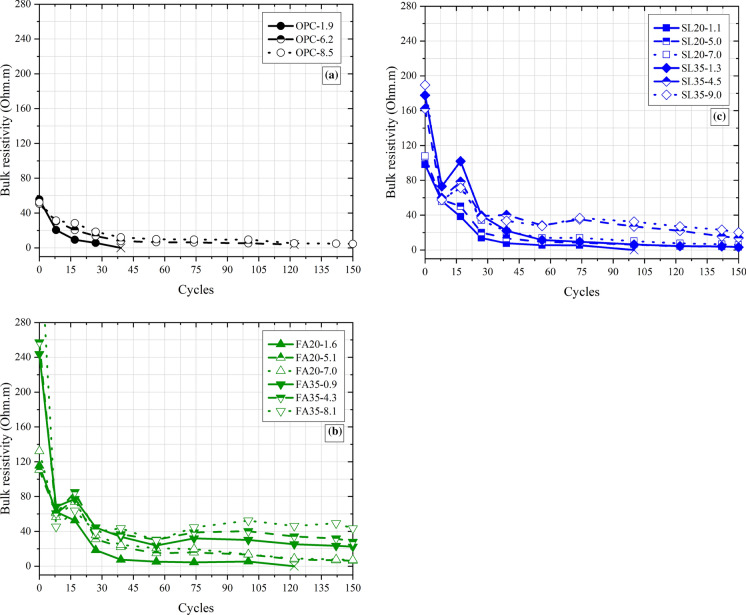
Bulk resistivity values over time for the control, fly ash and slag mixtures in the Group 1 specimens are shown in Fig. 6. The bulk resistivity behavior is the opposite of the mass change behavior, with the bulk resistivity decreasing over time. However, the behavior is clearly non-linear; prior work has shown power-law fits the bulk resistivity evolution [15]. The bulk resistivity behavior in this case appears to follow either power-law or a bi-linear behavior. The level of scatter in the measurements makes fitting somewhat challenging. Regardless, most mixtures show a point at which the rate of change of bulk resistivity changes. The bulk resistivity at this point, similar to a nick point [42], increases with SCM replacement and air content. At any given cycle, the bulk resistivity of the concretes increases with air content and SCM replacement, consistent with findings from Figs. 4 and 5. This trend continues until failure or the end of experiment. Previously, based on a comparison of resistivity with visual damage, it was suggested that a bulk resistivity threshold of 4 Ohm m corresponded to failure [15]. Not enough specimens failed in these exposure conditions to confirm or deny this threshold value (or if the threshold of bulk resistivity also depended on SCM replacement and air entrainment). Regardless, specimens with higher initial bulk resistivities showed lower mass loss and experienced lower visual damage at any given number of cycles.
Fig. 6.
Bulk resistivity changes in Group 1 specimens plotted against the number of cycles (total 150 cycles/600 days) for a control mixtures, b fly ash mixtures, and c slag mixtures
Figure S4 and Figure S5 in the Supplementary Material show the bulk resistivity values for Group 2 and Group 3 specimens. A detailed discussion is not presented here as the conclusions from these specimens are the same as those in Group 1 specimens. The CaCl2 caused a greater decrease in bulk resistivity (57% on average for all mixtures) in comparison to MgCl2 (36% on average for all mixtures) possibly linked to its greater conductivity at 20% concentration [43].
Post-exposure measurements
After 150 cycles/600 cycles, all remaining mixtures were taken out of the solution and the cylinders were capped and tested for compressive strength. Results are shown in Table 7. Specimens with severe damage had 3.0 to 4.2 MPa strength (average 3.8 MPa), those with moderate damage had 6.4 to 23.0 MPa strength (average 11.2 MPa), those with minor damage had 11.2 to 23.5 MPa strength (average 16.5 MPa), and those with no damage had 11.4 to 32.1 MPa strength (average 18.2 MPa). The increasing strengths with reduced damage suggest that damage classification broadly works, although there is clearly scatter and some overlap between classifications. On average, strengths were 14.2 MPa, 17.1 MPa, and 15.3 MPa for Group 1, Group 2, and Group 3 mixtures, which suggests that Group 1 exposure conditions were the harshest and Group 2 conditions were the least harsh. Post-exposure, the strongest mixtures were mixtures with 35% slag or fly ash, largely independent of the type of exposure.
Table 7.
Changes in compressive strength of all mixtures after 150 cycles/600 days (compressive strength measurements are shown as average ± standard deviation)
| Mixture | Compressive Strength (MPa) | ||
|---|---|---|---|
| Group 1 | Group 2 | Group 3 | |
| OPC-6.2 | (Failure) | 3.0 ± 0.0 (Severe) | (Failure) |
| OPC-8.5 | 6.6 ± 0.1 (Moderate) | 11.2 ± 0.2 (Minor) | 6.4 ± 1.6 (Moderate) |
| FA20-5.1 | 12.3 ± 0.5 (Moderate) | 16.2 ± 3.0 (Minor) | 18.8 ± 3.7 (Minor) |
| FA20-7.0 | 10.9 ± 1.1 (Moderate) | 10.5 ± 0.9 (Minor) | 17.4 ± 1.0 (None) |
| FA35-0.9 | 23.5 ± 2.1 (Minor) | 17.7 ± 0.1 (None) | 17.1 (Minor) |
| FA35-4.3 | 32.1 ± 1.2 (None) | 21.0 ± 4.4 (None) | 17.5 ± 5.7 (Minor) |
| FA35-8.1 | 22.8 ± 1.1 (None) | 13.7 ± 1.1 (None) | 12.5 ± 3.2 (None) |
| SL20-5.0 | 4.2 ± 0.6 (Severe) | 18.8 ± 0.5 (Minor) | 19.6 ± 1.7 (None) |
| SL20-7.0 | 7.9 ± 0.7 (Moderate) | 19.2 ± 0.1 (Minor) | 13.2 ± 1.6 (Minor) |
| SL35-1.3 | 4.2 ± 2.7 (Severe) | 23.0 ± 2.8 (Moderate) | 14.4 ± 1.9 (None) |
| SL35-4.5 | 16.6 ± 4.5 (Minor) | 21.1 ± 6.7 (None) | 19.8 ± 2.9 (None) |
| SL35-9.0 | 14.9 ± 0.2 (None) | 15.7 ± 1.8 (None) | 11.4 ± 4.3 (None) |
Table 8 shows the estimated solution absorption values for all specimens at the end of testing. Specimens which absorbed the highest amount of solution inevitably failed (OPC-1.9), whereas specimens which absorbed low amounts of solution (SL-9.0) showed limited or no damage at the end of testing. Similar to the strength after exposure, the solution absorption depended strongly on the SCM replacement and air content. Because of variabilities in both parameters and the complexities associated with the measurements, the correlation between the strength and absorption was rather poor (not shown).
Table 8.
Estimated solution absorption for all mixtures after 150 cycles/600 days (absorbed solution values are shown as average ± standard deviation)
| Mixture | Solution absorption (%) | ||
|---|---|---|---|
| Group 1 | Group 2 | Group 3 | |
| OPC-1.9 | 14.2 ± 1.0 (Failure) | 7.7 ± 0.1 (Failure) | 9.7 ± 0.6 (Failure) |
| OPC-6.2 | 10.5 ± 0.5 (Failure) | 7.7 ± 1.3 (Severe) | 9.3 ± 0.0 (Failure) |
| OPC-8.5 | 6.9 ± 1.2 (Moderate) | 7.0 ± 0.4 (Minor) | 4.5 ± 0.7 (Moderate) |
| FA20-1.6 | 10.0 ± 0.4 (Failure) | 8.5 ± 0.2 (Failure) | 9.0 ± 1.4 (Failure) |
| FA20-5.1 | 4.9 ± 0.3 (Moderate) | 6.5 ± 0.1 (Minor) | 5.9 ± 0.5 (Minor) |
| FA20-7.0 | 4.7 ± 0.8 (Moderate) | 6.4 ± 0.5 (Minor) | 5.3 ± 1.2 (None) |
| FA35-0.9 | 5.8 ± 0.2 (Minor) | 7.5 ± 0.8 (None) | 6.6 ± 0.7 (Minor) |
| FA35-4.3 | 3.9 ± 0.6 (None) | 6.0 ± 1.3 (None) | 5.6 ± 0.1 (Minor) |
| FA35-8.1 | 4.2 ± 0.0 (None) | 4.8 ± 0.5 (None) | 4.7 ± 0.1 (None) |
| SL20-1.1 | 7.1 ± 0.4 (Failure) | 7.3 ± 1.2 (Failure) | 4.0 (Failure) |
| SL20-5.0 | 6.5 ± 0.5 (Severe) | 5.0 ± 0.6 (Minor) | 3.5 ± 0.4 (None) |
| SL20-7.0 | 6.2 ± 0.2 (Moderate) | 4.9 ± 1.0 (Minor) | 3.7 ± 1.0 (None) |
| SL35-1.3 | 5.6 ± 1.0 (Severe) | 6.2 ± 0.2 (Minor) | 6.3 ± 0.1 (None) |
| SL35-4.5 | 3.9 ± 0.9 (Minor) | 5.5 ± 0.2 (None) | 5.3 ± 0.8 (None) |
| SL35-9.0 | 3.7 ± 1.4 (None) | 4.7 ± 0.4 (None) | 3.4 ± 0.4 (None) |
In earlier work, we stated that mixture bulk resistivity multiplied by air content could be used to predict concrete resistance to calcium oxychloride damage [15]. Because the exposure conditions in this study are less harsh and the mixtures are more durable due to the longer curing, limited number of specimens failed. Therefore, it was considered that predicting time to reach a failure classification would not be reliable. Thus, we evaluated whether the bulk resistivity multiplied by air content could predict the number of days taken for Group 1 mixtures to reach a damage classification of Moderate (Fig. 7). Broad trends did not change when using Group 2 or Group 3 mixtures, or when using the damage classification of Minor instead of Moderate. The figure shows a moderate correlation between bulk resistivity multiplied by the air content and the time required to reach Moderate damage, confirming that this could be a performance-based specification against damage. Another way of looking at these results is to consider the relationship between damage state at the end of testing and the product of bulk resistivity and air content (Table 9). While these is clear separation between mixtures showing no damage (average value of 2005 for the product of bulk resistivity and air content) and mixtures showing failure (average value of 178), there is some overlap in the values for minor, moderate, and severe damage. Because bulk resistivity does increase with air content for some mixtures, it is possible that the weights for these parameters need to be reduced. These attempts by using the square roots for bulk resistivity and air content are also shown in Table 9. Of these parameters, BR*Air content0.5 works the best in differentiating mixtures with different levels of damage. Other parameters were also tested and using bulk resistivity and air content appears to be reasonably, but not completely, effective in differentiating mixtures which show minor, moderate, and severe damage. Prediction accuracy could be further increased by considering the quality of the air void system, or by accounting for varied degree of saturation.
Fig. 7.
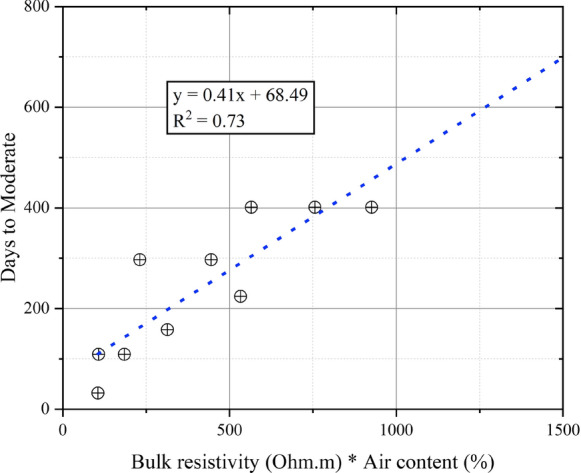
Number of days taken for to reach a damage classification of moderate plotted against the product of bulk resistivity and the air content
Table 9.
Average values of bulk resistivity multiplied by air content and similar parameters and the damage at the end of testing for Group 1 specimens
| Final damage | BR*Air content (Average) |
BR0.5*Air content (Average) |
BR*Air content0.5 (Average) |
|---|---|---|---|
| None | 2005 | 118 | 742 |
| Minor | 475 | 36 | 288 |
| Moderate | 673 | 67 | 260 |
| Severe | 533 | 17 | 203 |
| Failure | 178 | 22 | 113 |
As results for the three Groups were similar, durable mixtures in Group 1 exposure were identified and are assumed to be representative. This was done using two conditions—one was damage status of none/moderate/minor at the end of testing and the second condition was that compressive strength post-exposure was larger than 10 MPa. As shown in Table 10, both conditions result in the same mixtures, with two exceptions (OPC-8.5 and SL20-7.0). This provides further validation that the damage classification is relatively robust. If we consider both conditions need to be met, the durable mixtures are FA20-5.1, FA20-7.0, FA35-0.9, FA35-4.3, FA35-8.1, SL35-4.5, SL35-9.0. The results are broadly similar to those from an earlier study [15], where durable mixtures were those with 20% SCM and 8% air and 35% SCM and more than 4% air. Because of the longer curing duration employed here, the fly ash shows better performance than the slag. Therefore, the durable mixtures were: 20% fly ash, 5.1% air or more; 35% fly ash, 0.9% air or more; 35% slag, 4.5% air or more. For freeze–thaw resistance, less than 5% air is sub-optimal, therefore, the durable mixtures can be considered to be 20% or more fly ash and 5% or more air; 35% or more slag and 5% or more air.
Table 10.
Measured compressive strength and final damage at the end of testing for durable Group 1 specimens
| Mixture | Final damage | Measured compressive strength (MPa) |
|---|---|---|
| OPC-8.5 | Moderate | 6.6 |
| FA20-5.1 | Moderate | 12.3 |
| FA20-7.0 | Moderate | 10.9 |
| FA35-0.9 | Minor | 23.5 |
| FA35-4.5 | None | 32.1 |
| FA35-8.1 | None | 22.8 |
| SL20-7.0 | Moderate | 7.9 |
| SL35-4.5 | Minor | 16.6 |
| SL35-9.0 | None | 14.9 |
OPC-8.5 and SL20-7.0 showed moderate damage but strength < 10 MPa
Mitigation mechanisms
Based on our results, we explain the mechanisms of mitigation for SCMs and air.
SCMs have two damage mitigation mechanisms. The first is through a reduction in the rate of solution ingress, apparent when considering the lower slopes in the mass change curves (Table 6), which occurs in almost all cases when SCMs are used. The reason why SCMs reduce sorption rates is linked to the microstructural densification of the cementitious matrix, which is apparent from their increased bulk resistivity values, especially as curing duration increases (Fig. 2)—this is an expected consequence of the pozzolanic reaction [36]. The second mitigation mechanism is through a reduction of damage potential, driven by reductions in the calcium hydroxide and calcium oxychloride contents [7, 20, 23]. The outstanding performance of certain mixtures, for example, Group 1 FA35-0.9 (Table 7), which show only minor levels of damage at the end of testing provides evidence for this hypothesis. Considering this mixture does not have entrained air, and the deicing salt solution is clearly being absorbed, the minimal damage observed in this mixture cannot be linked exclusively to a reduction in solution sorption, but it must be also connected to the inherently low amounts of calcium hydroxide present in the system. Indeed, beyond certain SCM replacement limits, no calcium oxychloride forms, and damage is not observed [44].
The air mitigates damage by reducing the degree of saturation at any given time. This is a consequence of the slower sorption associated with greater air void contents [41]. The greater total porosity due to the air volume will also reduce the degree of saturation at equivalent amount of solution absorption. This mitigation mechanism of air is reflected in the slower rate of mass gain in concrete mixtures with greater air contents (Fig. 5a and Table 6). Table 6 shows that increasing air by 4% roughly halves the slope of the mass gain curves. The second mechanism through which the air acts is by reducing crystallization/expansive pressures through provision of space for pressure relief. A similar mechanism is suggested for air reducing freeze–thaw damage [3]. This mechanism is supported by the finding that specimens with higher air contents fail at higher levels of mass gain. Specifically, Table 6 shows that Group 1 OPC-1.9 failed at 2.6% mass gain whereas Group 1 OPC-6.2 failed at 7.5% mass gain. The OPC-6.2 mixture needed to absorb three times as much solution as the OPC-1.9 mixture to fail. These mixtures have no SCMs, and differing mass change kinetics do not affect mass change at failure. Therefore, the higher mass gain tolerance of the OPC-6.2 mixture is likely because the air is allowing for greater solution sorption. This finding does not conclusively demonstrate that the air reduces pressures, however, it does provide support for the hypothesis.
Conclusions
This study evaluated concrete damage due to exposure to calcium chloride and magnesium chloride using different low temperature exposure conditions with the objective of explaining the roles of salt type, air content, supplementary cementitious materials (SCM) replacement level, and exposure conditions in damage development. Bulk resistivity, mass change, and visual damage assessment were used to monitor the damage over time. The following conclusions were drawn for all exposure conditions:
The use of air entrainment and SCMs reduced the damage at any given time in any exposure condition. Damage was reduced as the SCM replacement increases.
Bulk resistivity, mass change, and visual assessment appear to be clear indicators of damage progression over time. The slope of the mass change curves and the tolerable level of mass change depended on SCM replacement and air content. Mixtures with higher values of bulk resistivity generally showed high resistance to damage.
Compressive strengths measured at the end of testing were generally consistent with visual observation and solution absorption and could be used to classify mixture performance. Bulk resistivity multiplied by air content worked reasonably well for this purpose. However, initial strength had no correlation with mixture performance and should not be specified for durability.
Based on multiple criteria, we suggest that in high salt concentrations and low temperature exposure conditions, durable mixtures had 20% or more fly ash and 5% or more air; 35% or more slag and 5% or more air.
SCMs reduced the rate of solution ingress due to microstructural densification and reduced the damage potential due to reduced calcium hydroxide and calcium oxychloride contents. The air mitigated damage by reducing the degree of saturation at any given time because of the slower sorption associated with greater air void contents. In addition, the air also reduced crystallization/expansive pressures through provision of space for pressure relief.
Supplementary Information
Below is the link to the electronic supplementary material.
Acknowledgements
RMC Research & Education Foundation and Knight Foundation Endowment (University of Miami College of Engineering) are thanked for funding. We thank Dr. Eric Koehler (Titan America), Dr. Amir Hajibabaee (Ozinga Inc.), Dr. Micah Hale (University of Arkansas), Dr. Casey Jones (University of Arkansas), Dr. Colin Lobo (NRMCA), Dr. Karthik Obla (NRMCA), and Dr. Robert Spragg (Federal Highway Administration Turner-Fairbank Highway Research Center) for insightful thoughts on this topic which improved the quality of this work.
Footnotes
Publisher's Note
Springer Nature remains neutral with regard to jurisdictional claims in published maps and institutional affiliations.
References
- 1.Suraneni P, Azad VJ, Isgor OB, Weiss J. Deicing salts and durability of concrete pavements and joints. Concr Int. 2016;38:48–55. [Google Scholar]
- 2.Jones W, et al. An overview of joint deterioration in concrete pavement: mechanisms, solution properties, and sealers. Purdue Univ Rep. 2013 doi: 10.5703/1288284315339. [DOI] [Google Scholar]
- 3.Smith SH, Qiao C, Suraneni P, Kurtis KE, Weiss WJ. Service-life of concrete in freeze-thaw environments: critical degree of saturation and calcium oxychloride formation. Cem Concr Res. 2019;122:93–106. doi: 10.1016/j.cemconres.2019.04.014. [DOI] [Google Scholar]
- 4.Rangaraju PR. Investigating premature deterioration of a concrete highway. Transp Res Rec. 2002;1798:1–7. doi: 10.3141/1798-01. [DOI] [Google Scholar]
- 5.Monical J, Unal E, Barrett T, Farnam Y, Weiss WJ. Reducing joint damage in concrete pavements: quantifying calcium oxychloride formation. Transp Res Rec. 2016;2577:17–24. doi: 10.3141/2577-03. [DOI] [Google Scholar]
- 6.Galan I, Perron L, Glasser FP. Impact of chloride-rich environments on cement paste mineralogy. Cem Concr Res. 2014;68:174–183. doi: 10.1016/j.cemconres.2014.10.017. [DOI] [Google Scholar]
- 7.Jones C, Ramanathan S, Suraneni P, Hale WM. Calcium oxychloride: a critical review of the literature surrounding the formation, deterioration, testing procedures, and recommended mitigation techniques. Cement Concr Compos. 2020;113:1–19. doi: 10.1016/j.cemconcomp.2020.103663. [DOI] [Google Scholar]
- 8.Monical J, Villani C, Farnam Y, Unal E, Weiss WJ. Using low-temperature differential scanning calorimetry to quantify calcium oxychloride formation for cementitious materials in the presence of calcium chloride. Adv Civil Eng Mater. 2016;5:142–156. doi: 10.1520/ACEM20150024. [DOI] [Google Scholar]
- 9.Qiao C, Suraneni P, Chang MT, Weiss WJ. Damage in cement pastes exposed to MgCl2 solutions. Mater Struct. 2018;51:74. doi: 10.1617/s11527-018-1191-2. [DOI] [Google Scholar]
- 10.Hosseinzadeh N, Montanari L, Qiao C, Suraneni P. Damage in cement pastes and mortars exposed to CaCl2 and low-temperature cycles. Mater Struct. 2021 doi: 10.1617/s11527-022-01949-1. [DOI] [Google Scholar]
- 11.Qiao C, Suraneni P, Weiss WJ. Flexural strength reduction of cement pastes exposed to CaCl2 solutions. Cement Concr Compos. 2018;86:297–305. doi: 10.1016/j.cemconcomp.2017.11.021. [DOI] [Google Scholar]
- 12.Traore F, Jones C, Ramanathan S, Suraneni P, Hale WM. Using compressive strength and mass change to verify the calcium oxychloride threshold in cementitious pastes with fly ash. Constr Build Mater. 2021;296:123640. doi: 10.1016/j.conbuildmat.2021.123640. [DOI] [Google Scholar]
- 13.Qiao C, Chen X, Suraneni P, Weiss WJ, Rothstein D. Petrographic analysis of in-service cementitious mortar subject to freeze-thaw cycles and deicers. Cement Concr Compos. 2021;122:104112. doi: 10.1016/j.cemconcomp.2021.104112. [DOI] [Google Scholar]
- 14.Wang X, Sadati S, Taylor P, Li C, Wang X, Sha A. Material characterization to assess effectiveness of surface treatment to prevent joint deterioration from oxychloride formation mechanism. Cement Concr Compos. 2019;104:103394. doi: 10.1016/j.cemconcomp.2019.103394. [DOI] [Google Scholar]
- 15.Hosseinzadeh N, Suraneni P. Synergistic effects of air content and supplementary cementitious materials in reducing damage caused by calcium oxychloride formation in concrete. Cement Concr Compos. 2021;122:104170. doi: 10.1016/j.cemconcomp.2021.104170. [DOI] [Google Scholar]
- 16.Ghazy A, Bassuoni MT. Resistance of concrete to different exposures with chloride-based salts. Cem Concr Res. 2017;101:144–158. doi: 10.1016/j.cemconres.2017.09.001. [DOI] [Google Scholar]
- 17.Julio-Betancourt GA (2009) Effect of deicer and anti-icer chemicals on the durability, microstructure, and properties of cement-based materials. University of Toronto, Ph.D. Thesis
- 18.Collepardi M, Coppola L, Pistolesi C. Durability of concrete structures exposed to CaCl2 based deicing salts. ACI Spec Public. 1994;145:107–120. [Google Scholar]
- 19.Suraneni P, Weiss WJ. Examining the pozzolanicity of supplementary cementitious materials using isothermal calorimetry and thermogravimetric analysis. Cement Concr Compos. 2017;83:273–278. doi: 10.1016/j.cemconcomp.2017.07.009. [DOI] [Google Scholar]
- 20.Suraneni P, Monical J, Unal E, Farnam Y, Weiss WJ. Calcium oxychloride formation potential in cementitious pastes exposed to blends of deicing salt. ACI Mater J. 2017;114:631–641. doi: 10.14359/51689607. [DOI] [Google Scholar]
- 21.Suraneni P, Azad VJ, Isgor OB, Weiss WJ. Role of supplementary cementitious material type in the mitigation of calcium oxychloride formation in cementitious pastes. J Mater Civ Eng. 2018;30:04018248. doi: 10.1061/(asce)mt.1943-5533.0002425. [DOI] [Google Scholar]
- 22.Suraneni P, Azad VJ, Isgor OB, Weiss WJ. Calcium oxychloride formation in pastes containing supplementary cementitious materials: Thoughts on the role of cement and supplementary cementitious materials reactivity. RILEM Tech Lett. 2016;1:24–30. doi: 10.21809/rilemtechlett.2016.7. [DOI] [Google Scholar]
- 23.Suraneni P, Azad VJ, Isgor OB, Weiss J. Use of fly ash to minimize deicing salt damage in concrete pavements. Transp Res Rec. 2017;2629:24–32. doi: 10.3141/2629-05. [DOI] [Google Scholar]
- 24.Darwin D, Browning J, Gong L, Hughes SR. Effects of deicers on concrete deterioration. ACI Mater J. 2008;105:622–627. [Google Scholar]
- 25.Montanari L, Tanesi J, Kim H, Ardani A. Influence of loading pressure and sample preparation on ionic concentration and resistivity of pore solution expressed from concrete samples. J Test Eval. 2020;49:3482–3505. doi: 10.1520/JTE20190765. [DOI] [Google Scholar]
- 26.Barneyback RS, Jr, Diamond S. Expression and analysis of pore fluids from hardened cement pastes and mortars. Cem Concr Res. 1981;11:279–285. doi: 10.1016/0008-8846(81)90069-7. [DOI] [Google Scholar]
- 27.Longuet P, Burglen L, Zelwer A. The liquid phase of hydrated cement. Revue des Materiaux et Construction. 1973;676:35–41. [Google Scholar]
- 28.Coyle AT, Spragg RP, Suraneni P, Amirkhanian AN, Weiss WJ. Comparison of linear temperature corrections and activation energy temperature corrections for electrical resistivity measurements of concrete. Adv Civil Eng Mater. 2018;7:174–187. doi: 10.1520/ACEM20170135. [DOI] [Google Scholar]
- 29.Ramanathan S, Croly M, Suraneni P. “Comparison of the effects that supplementary cementitious materials replacement levels have on cementitious paste properties. Cement Concr Compos. 2020;112:103678. doi: 10.1016/j.cemconcomp.2020.103678. [DOI] [Google Scholar]
- 30.Wang Y, Burris L, Shearer CR, Hooton D, Suraneni P. Strength activity index and bulk resistivity index modifications that differentiate inert and reactive materials. Cement Concr Compos. 2021;124:104240. doi: 10.1016/j.cemconcomp.2021.104240. [DOI] [Google Scholar]
- 31.Suraneni P, Hajibabaee A, Ramanathan S, Wang Y, Weiss J. New insights from reactivity testing of supplementary cementitious materials. Cement Concr Compos. 2019;103:331–338. doi: 10.1016/j.cemconcomp.2019.05.017. [DOI] [Google Scholar]
- 32.Moradllo MK, Qiao C, Isgor B, Reese S, Weiss WJ. Relating formation factor of concrete to water absorption. ACI Mater J. 2018;115:887–898. [Google Scholar]
- 33.Jones C, Suraneni P, Hale WM. Investigating concrete deterioration due to calcium oxychloride formation. Constr Build Mater. 2021 doi: 10.1016/j.conbuildmat.2021.125600. [DOI] [Google Scholar]
- 34.Riding KA, Ferraro CC, Almarshoud M, Mosavi H, Alrashidi R, Alyami MH (2018) Durability evaluation of ternary mix designs for extremely aggressive exposures, Florida Department of Transportation Report BDV31-977-65
- 35.Bharadwaj K, Glosser D, Moradllo MK, Isgor OB, Weiss WJ. Toward the prediction of pore volumes and freeze-thaw performance of concrete using thermodynamic modelling. Cem Concr Res. 2019;124:105820. doi: 10.1016/j.cemconres.2019.105820. [DOI] [Google Scholar]
- 36.Lothenbach B, Scrivener K, Hooton RD. Supplementary cementitious materials. Cem Concr Res. 2011;41:1244–1256. doi: 10.1016/j.cemconres.2010.12.001. [DOI] [Google Scholar]
- 37.Thomas MDA, Hooton RD, Scott A, Zibara H. The effect of supplementary cementitious materials on chloride binding in hardened cement paste. Cem Concr Res. 2012;42:1–7. doi: 10.1016/j.cemconres.2011.01.001. [DOI] [Google Scholar]
- 38.Moradllo MK, Qiao C, Ghantous RM, Zaw M, Hall H, Ley MT, Weiss WJ. Quantifying the freeze-thaw performance of air-entrained concrete using the time to reach critical saturation modelling approach. Cem Concr Compos. 2020;106:103479. doi: 10.1016/j.cemconcomp.2019.103479. [DOI] [Google Scholar]
- 39.Van den Heede P, Gruyaert E, De Belie N. Transport properties of high-volume fly ash concrete: capillary water sorption, water sorption under vacuum and gas permeability. Cem Concr Compos. 2010;32:749–756. doi: 10.1016/j.cemconcomp.2010.08.006. [DOI] [Google Scholar]
- 40.Farnam Y, Washington T, Weiss J. The influence of calcium chloride salt solution on the transport properties of cementitious materials. Adv Civil Eng. 2015;2015:929864. doi: 10.1155/2015/929864. [DOI] [Google Scholar]
- 41.Li W, Pour-Ghaz M, Castro J, Weiss J. Water absorption and critical degree of saturation relating to freeze-thaw damage in concrete pavement joints. J Mater Civ Eng. 2012;24:299–307. doi: 10.1061/(ASCE)MT.1943-5533.0000383. [DOI] [Google Scholar]
- 42.Qiao C, Moradllo MK, Hall H, Ley MT, Weiss WJ. Electrical resistivity and formation factor of air-entrained concrete. ACI Mater J. 2019;116:85–93. [Google Scholar]
- 43.Haynes WM. Handbook of chemistry and physics. 95. Boca Raton: CRC Press; 2014. [Google Scholar]
- 44.Farnam Y, Zhang B, Weiss J. Evaluating the use of supplementary cementitious materials to mitigate damage in cementitious materials exposed to calcium chloride deicing salt. Cem Concr Compos. 2017;81:77–86. doi: 10.1016/j.cemconcomp.2017. [DOI] [Google Scholar]
Associated Data
This section collects any data citations, data availability statements, or supplementary materials included in this article.


