Abstract
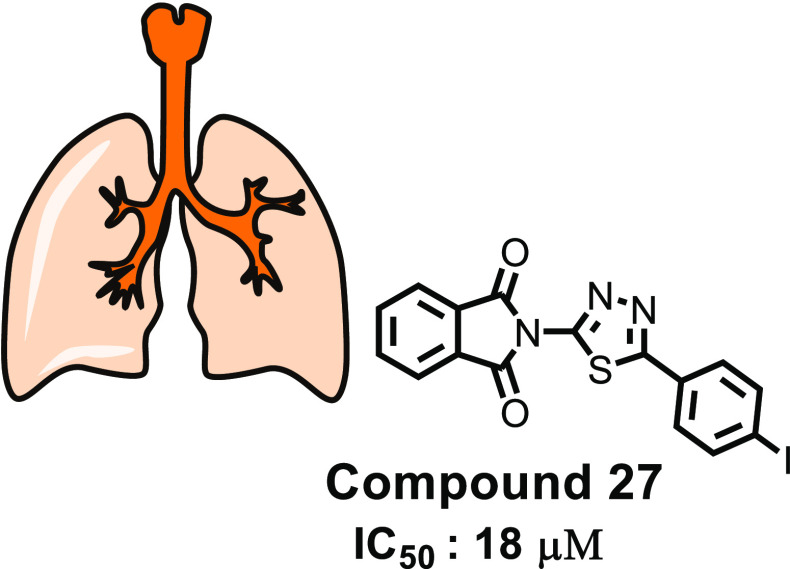
The condensation of phthalic anhydride afforded structurally modified isoindoline-1,3-dione derivatives with selected amino-containing compounds. The title compounds (2–30) have been characterized by thin-layer chromatography (TLC), infrared spectroscopy, 1H and 13C NMR spectroscopy, and mass spectroscopy. All of the compounds were assessed for their antimycobacterial activity toward the H37Rv strain by a dual read-out assay method. Among the synthesized compounds, compound 27 possessed a significant IC50 of 18 μM, making it the most potent compound of the series. The InhA inhibitory (IC50) activity of compound 27 was 8.65 μM in comparison to Triclosan (1.32 μM). Computational studies like density functional theory (DFT) study, molecular docking, and dynamic simulation studies illustrated the reactivity and stability of the synthesized compounds as InhA inhibitors. A quantum-mechanics-based DFT study was carried out to investigate the molecular and electronic properties, reactivities, and nature of bonding present in the synthesized compounds and theoretical vibrational (IR) and isotropic value (1H and 13C NMR) calculations.
1. Introduction
Tuberculosis (TB), caused by Mycobacterium tuberculosis (Mtb), is one of the most fatal infectious diseases burdening the world.1 The WHO has recently updated its data on TB deaths, which shows that 1.5 million people (including 214,000 people with human immunodeficiency virus (HIV)) died from TB in 2020. TB is the 13th leading cause of mortality worldwide and the second leading infectious killer after COVID-19 (above HIV/acquired immunodeficiency syndrome (AIDS)). In 2020, there are estimated 10 million new cases of tuberculosis (TB) worldwide, including 3.3 million women, 5.6 million men, and 1.1 million children.1−3 The 30 most high-burden countries in 2020 will account for 86% of new TB cases. Eight countries make up two-thirds of the total, with India leading the pack, followed by China, Indonesia, the Philippines, Pakistan, Nigeria, Bangladesh, and South Africa. Globally, the TB rate is declining at a rate of about 2% per year, and it declined by 11% between 2015 and 2020.1−3
In the 1960s, the use of pyrazinamide and rifampicin led to a radical transformation of antimycobacterial therapy.4 Combined with isoniazid, ethambutol, and/or streptomycin, it has led to short-course chemotherapy (SCC), which reduces the time of treatment from 18 to 6 months.5−8 The prolonged course of treatment leads many patients to stop taking the medication after their symptoms disappear. By stopping the medication before the infection has cleared up, the bacteria can develop resistance to the antibiotic, potentially leading to multidrug-resistant (MDR) infection.5−8 HIV co-infection further complicates the ability to treat TB, increasing resistance to treatment and the transmission rates and death due to TB.8 According to these findings, there is an urgent need to develop an antitubercular treatment that is less toxic and more effective than the current first- and second-line antitubercular drugs. A subunit of isoindoline-1,3-dione is an important drug candidate having a variety of biological activities against diseases including cancer, leprosy, inflammation, AIDS, cyclooxygenase (COX) inhibitors, multiple myeloma, and antidepressants.9 Structure–activity relationships (SAR) of metabolites and analogues of thalidomide have shown that the isoindoline-1,3-dione ring system plays an essential role in the drug’s pharmacophore.10 Isoindoline-1,3-diones possess planar aromatic ring and hydrophobicity; therefore, interaction of these drugs with different biologically active targets constitutes the basis for the evaluation of their biological activity.11 Due to their planar aromatic ring and hydrophobicity, isoindoline-1,3-diones interact with a variety of biologically active target molecules. Thus, the interaction between these drugs and their biological targets provides the basis for the evaluation of their biological activity.12 The minimal inhibitory concentrations (MICs) of some of these derivatives with an N-substituted isoindoline-1,3-dione moiety are comparable to those of clinically used antibiotics.12
Akgün et al. reported the sulfonamido-fused isoindoline-1,3-dione derivative i with an MIC of 32 μg/mL against the H37Ra strain.9 In an article by Elumalai et al., they described an isoniazid-fused compound ii with an MIC of 1.15 μg/mL against H37Rv.13 In their study, Phatak et al. examined the antimycobacterial activity of an isoindoline-1,3-dione bearing 1,2,3-triazole (compound iii) with an MIC of 12.5 μg/mL.14 As reported by Paraiso et al., sulfonamido-clubbed isoindoline-1,3-dione derivatives iv have an MIC of 10 μg/mL against the M. tuberculosis H37Rv strain.15 Several nonfluorinated derivatives of isoniazide (v) have been synthesized by Santos et al. (MIC: 5 μg/mL) (Figure 1).16
Figure 1.
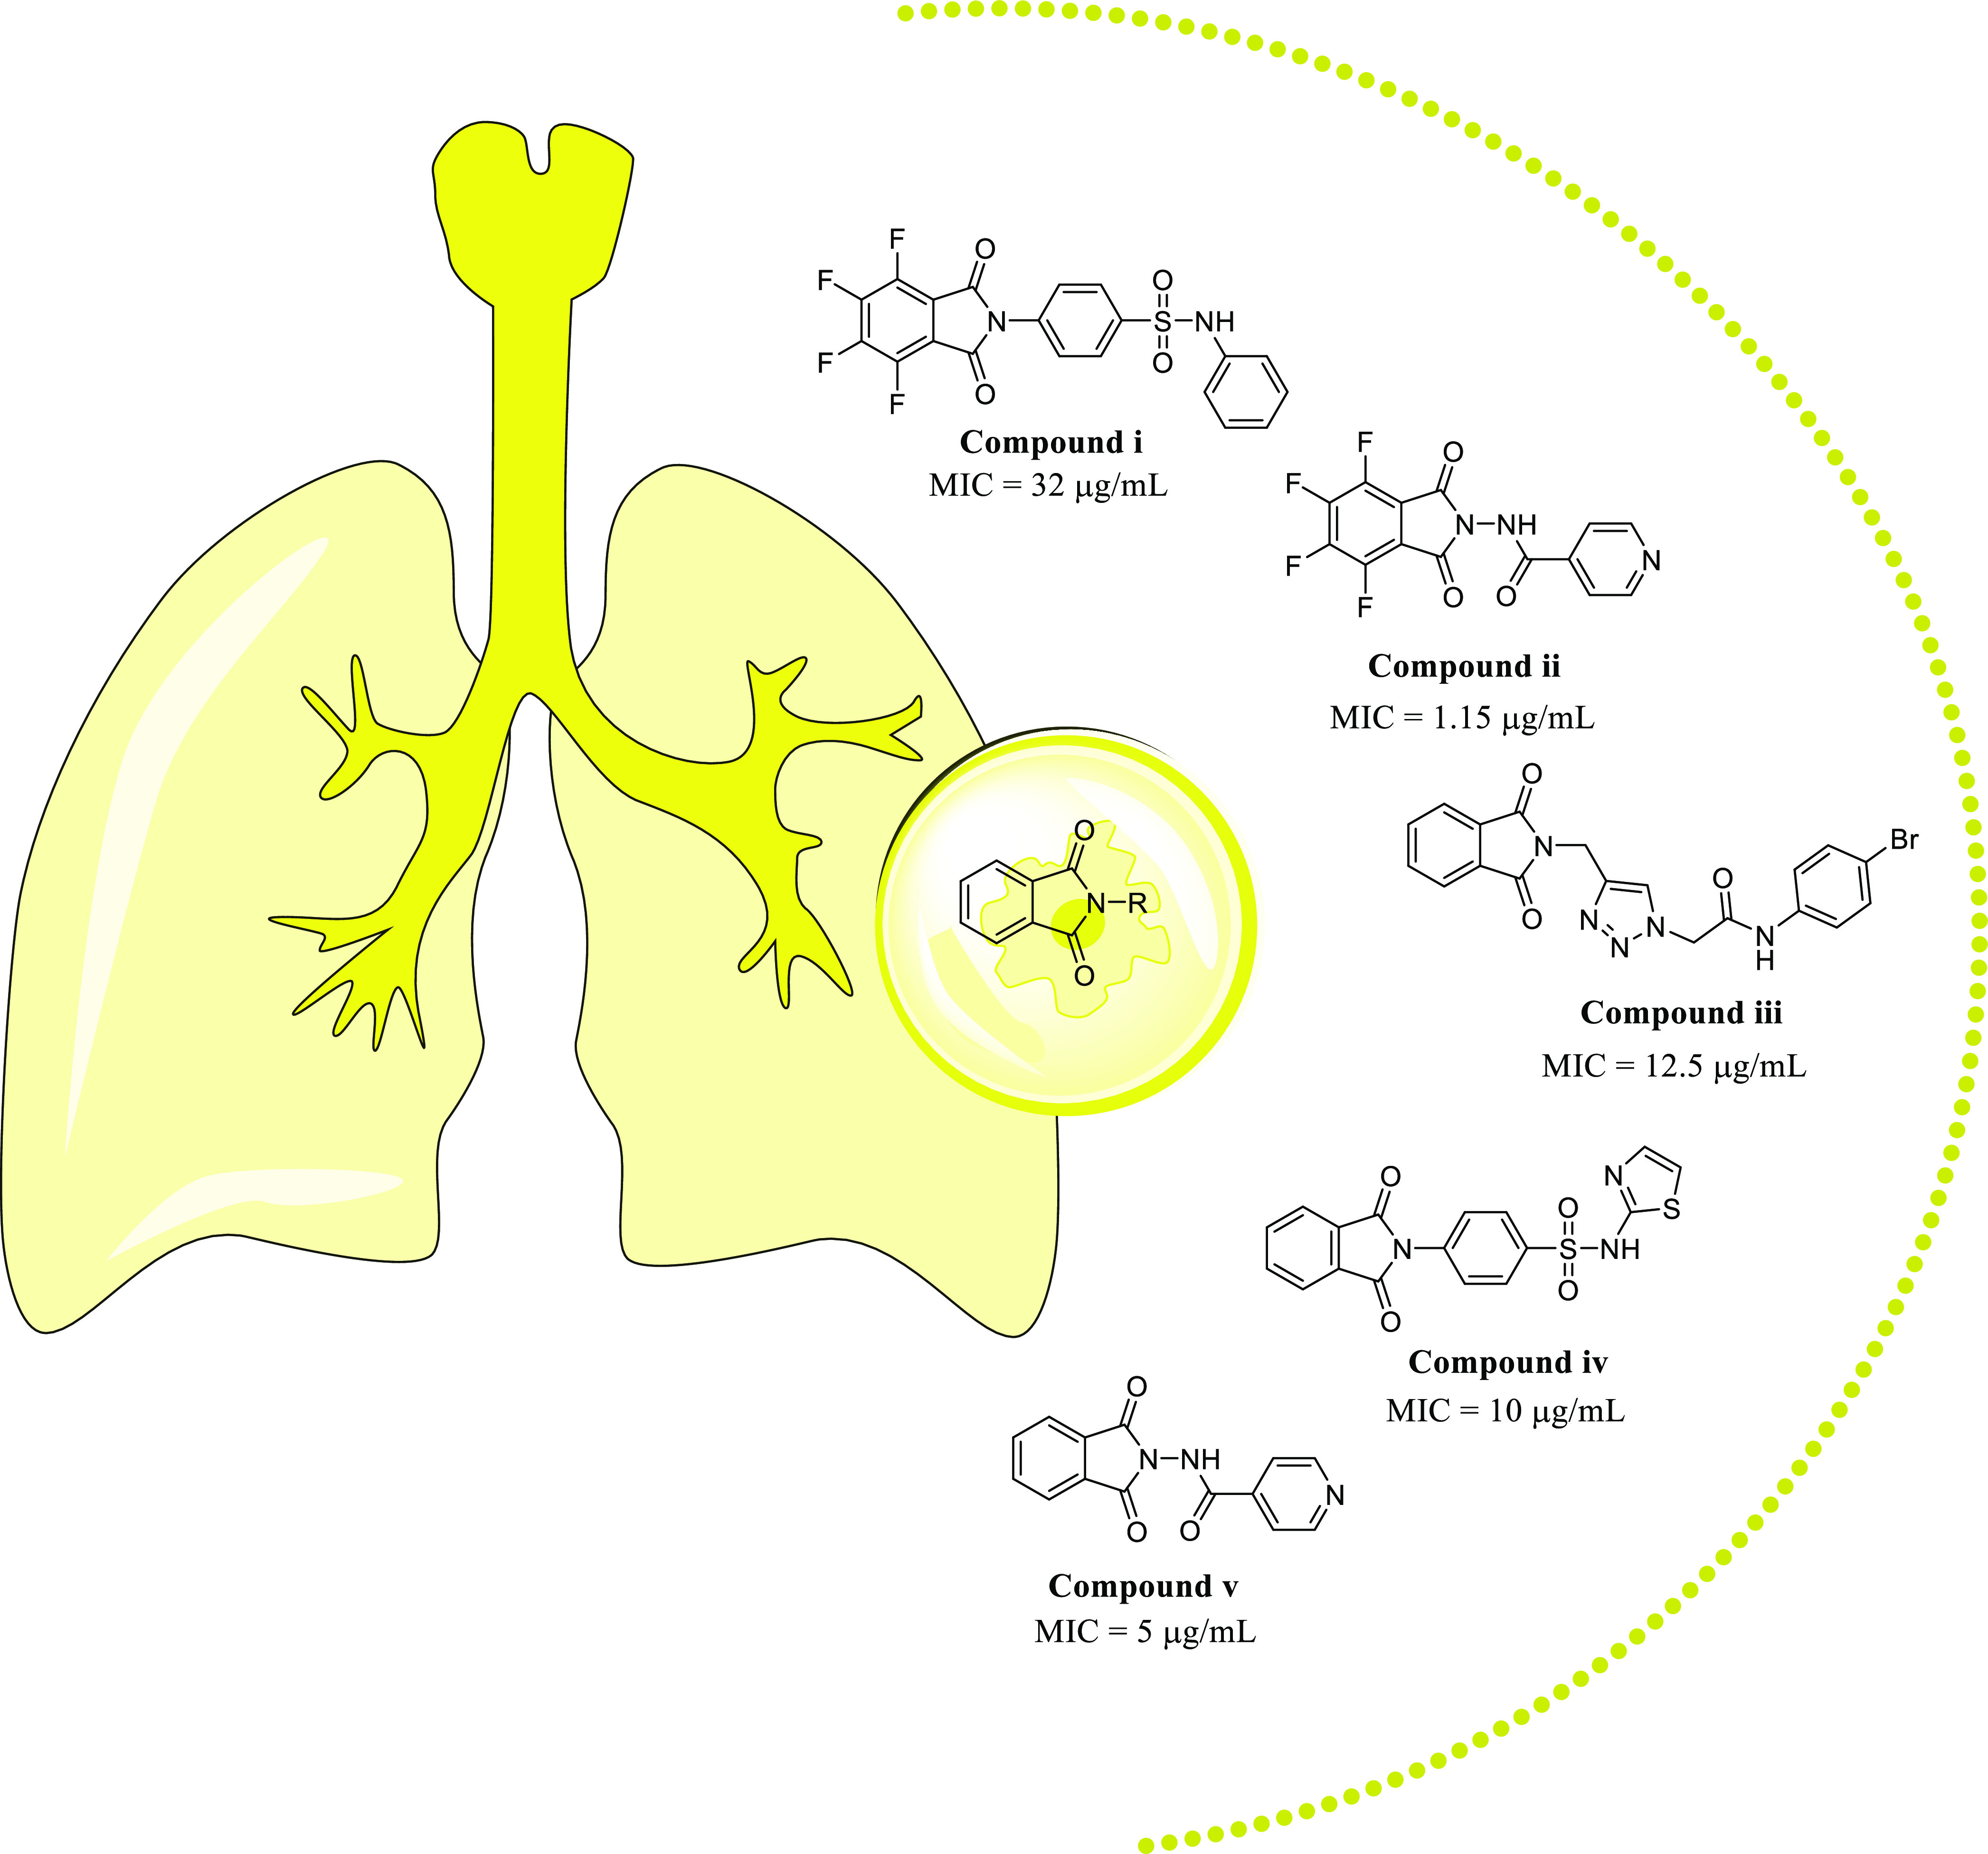
Reported isoindoline-1,3-dione derivatives.
Inspired by the above literature, in the current research work, we have reported the synthesis, spectroscopic study, molecular modeling, and quantum-mechanics-based investigation of the isoindoline-1,3-dione derivatives as an antimycobacterial agent.
2. Result and Discussion
2.1. Chemistry
The isoindoline-1,3-dione derivatives (2–30) were prepared by condensing an equimolar quantity of phthalic anhydride and primary amino group containing alicyclic compounds in 50–75 mL glacial acetic acid in an equimolar quantity (Schemes 1 and 2). After pouring the content into the ice, a solid precipitated out, which was filtered and recrystallized from ethanol (60–80% yields), and the compounds were purified by flash chromatography. Thin-layer chromatography (TLC) was used to verify the purity of synthesized compounds, and spectroscopic data were used to identify their structures. The IR spectra of compounds 2–30 displayed the characteristic band indicating the carbonyl group of the imide isoindoline-1,3-dione ring, ranging from 1699 to 1779 cm–1. The 1H NMR spectra of compounds 2–30 showed multiple signals corresponding to resonances of isoindoline-1,3-dione protons at 6.45–8.48 δ ppm. The 13C NMR and mass data further confirmed the synthesis of the title compounds 2–30. The lipophilicity values (Log P) of the synthesized compounds (2–30) were calculated using CHEMDRAW ultra-14.0.
Scheme 1.
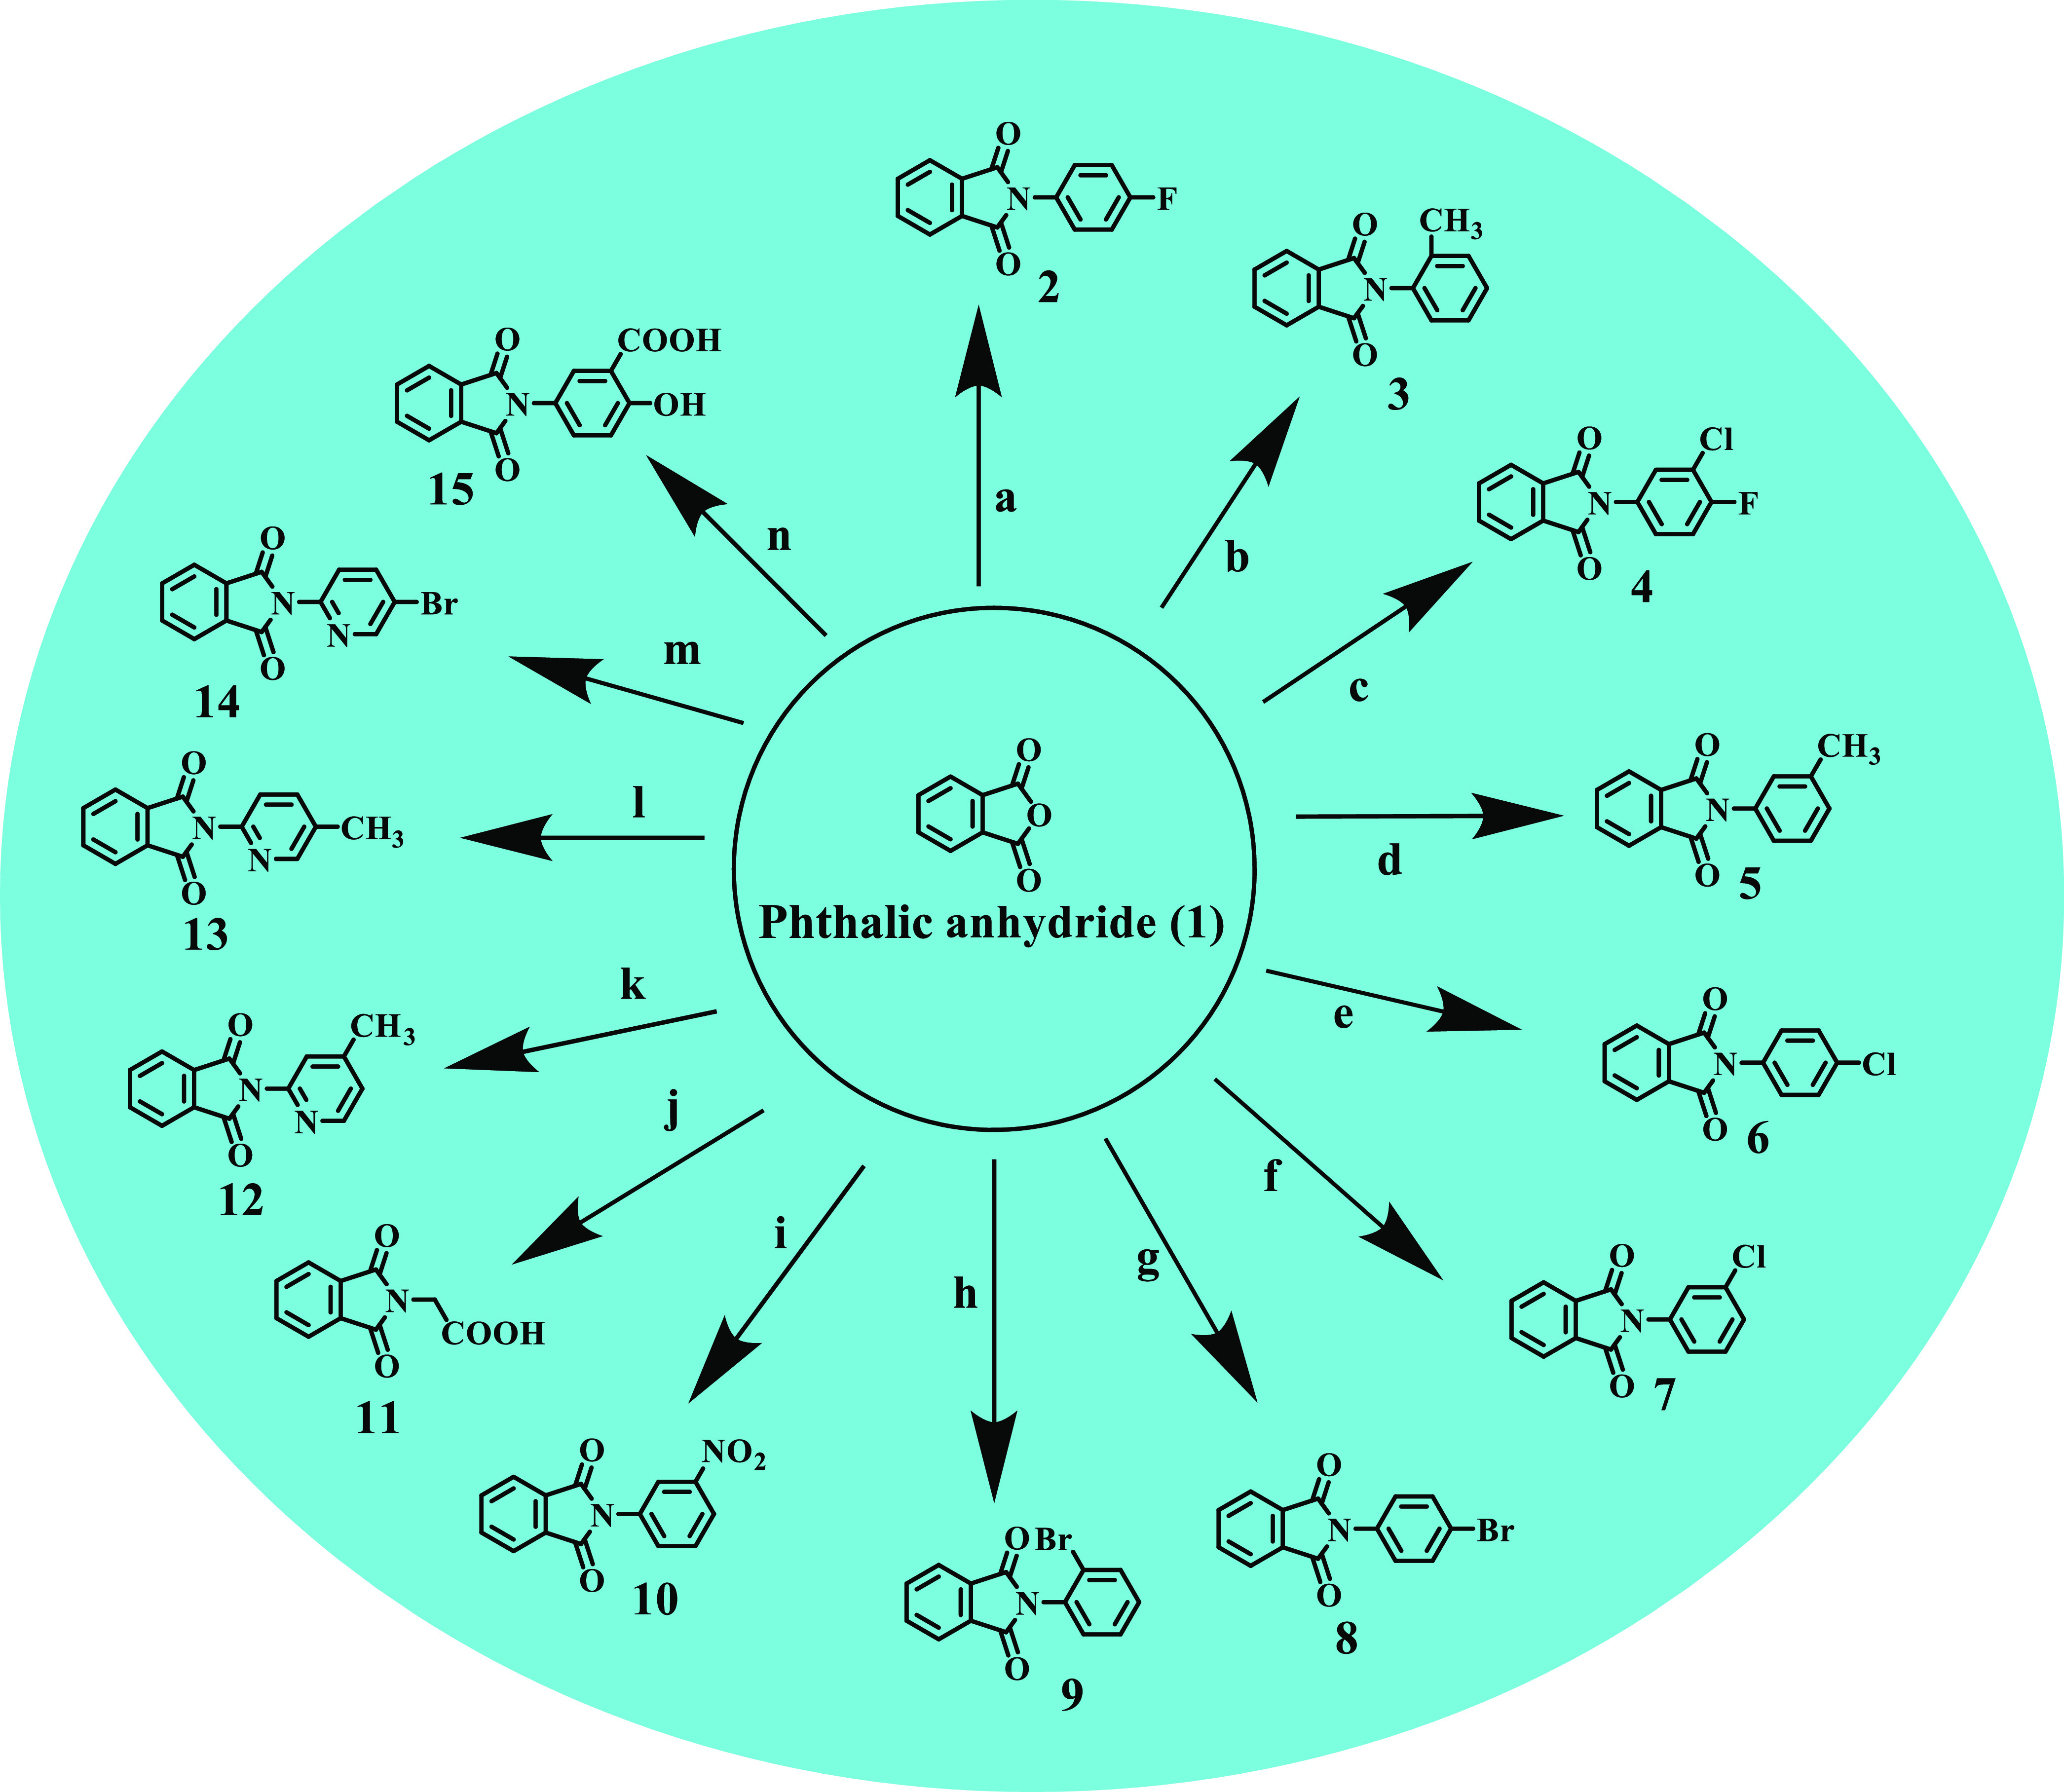
Reagents and conditions: 0.1 mol of the primary amino group containing alicyclic compound, 0.1 mol of phthalic anhydride in 50–75 mL of glacial acetic acid, reflux for 3 h; (a) 4-fluoroaniline, (b) 2-methylaniline, (c) 3-chloro-4-fluoroaniline, (d) 3-methylaniline, (e) 4-chloroaniline, (f) 3-chloroaniline, (g) 4-bromoaniline, (h) 2-bromoaniline, (i) 3-nitroaniline, (j) glycine, (k) 4-methylpyridin-2-amine, (l) 5-methylpyridin-2-amine, (m) 5-bromopyridin-2-amine, (n) 5-amino-2-hydroxybenzoic acid.
Scheme 2.
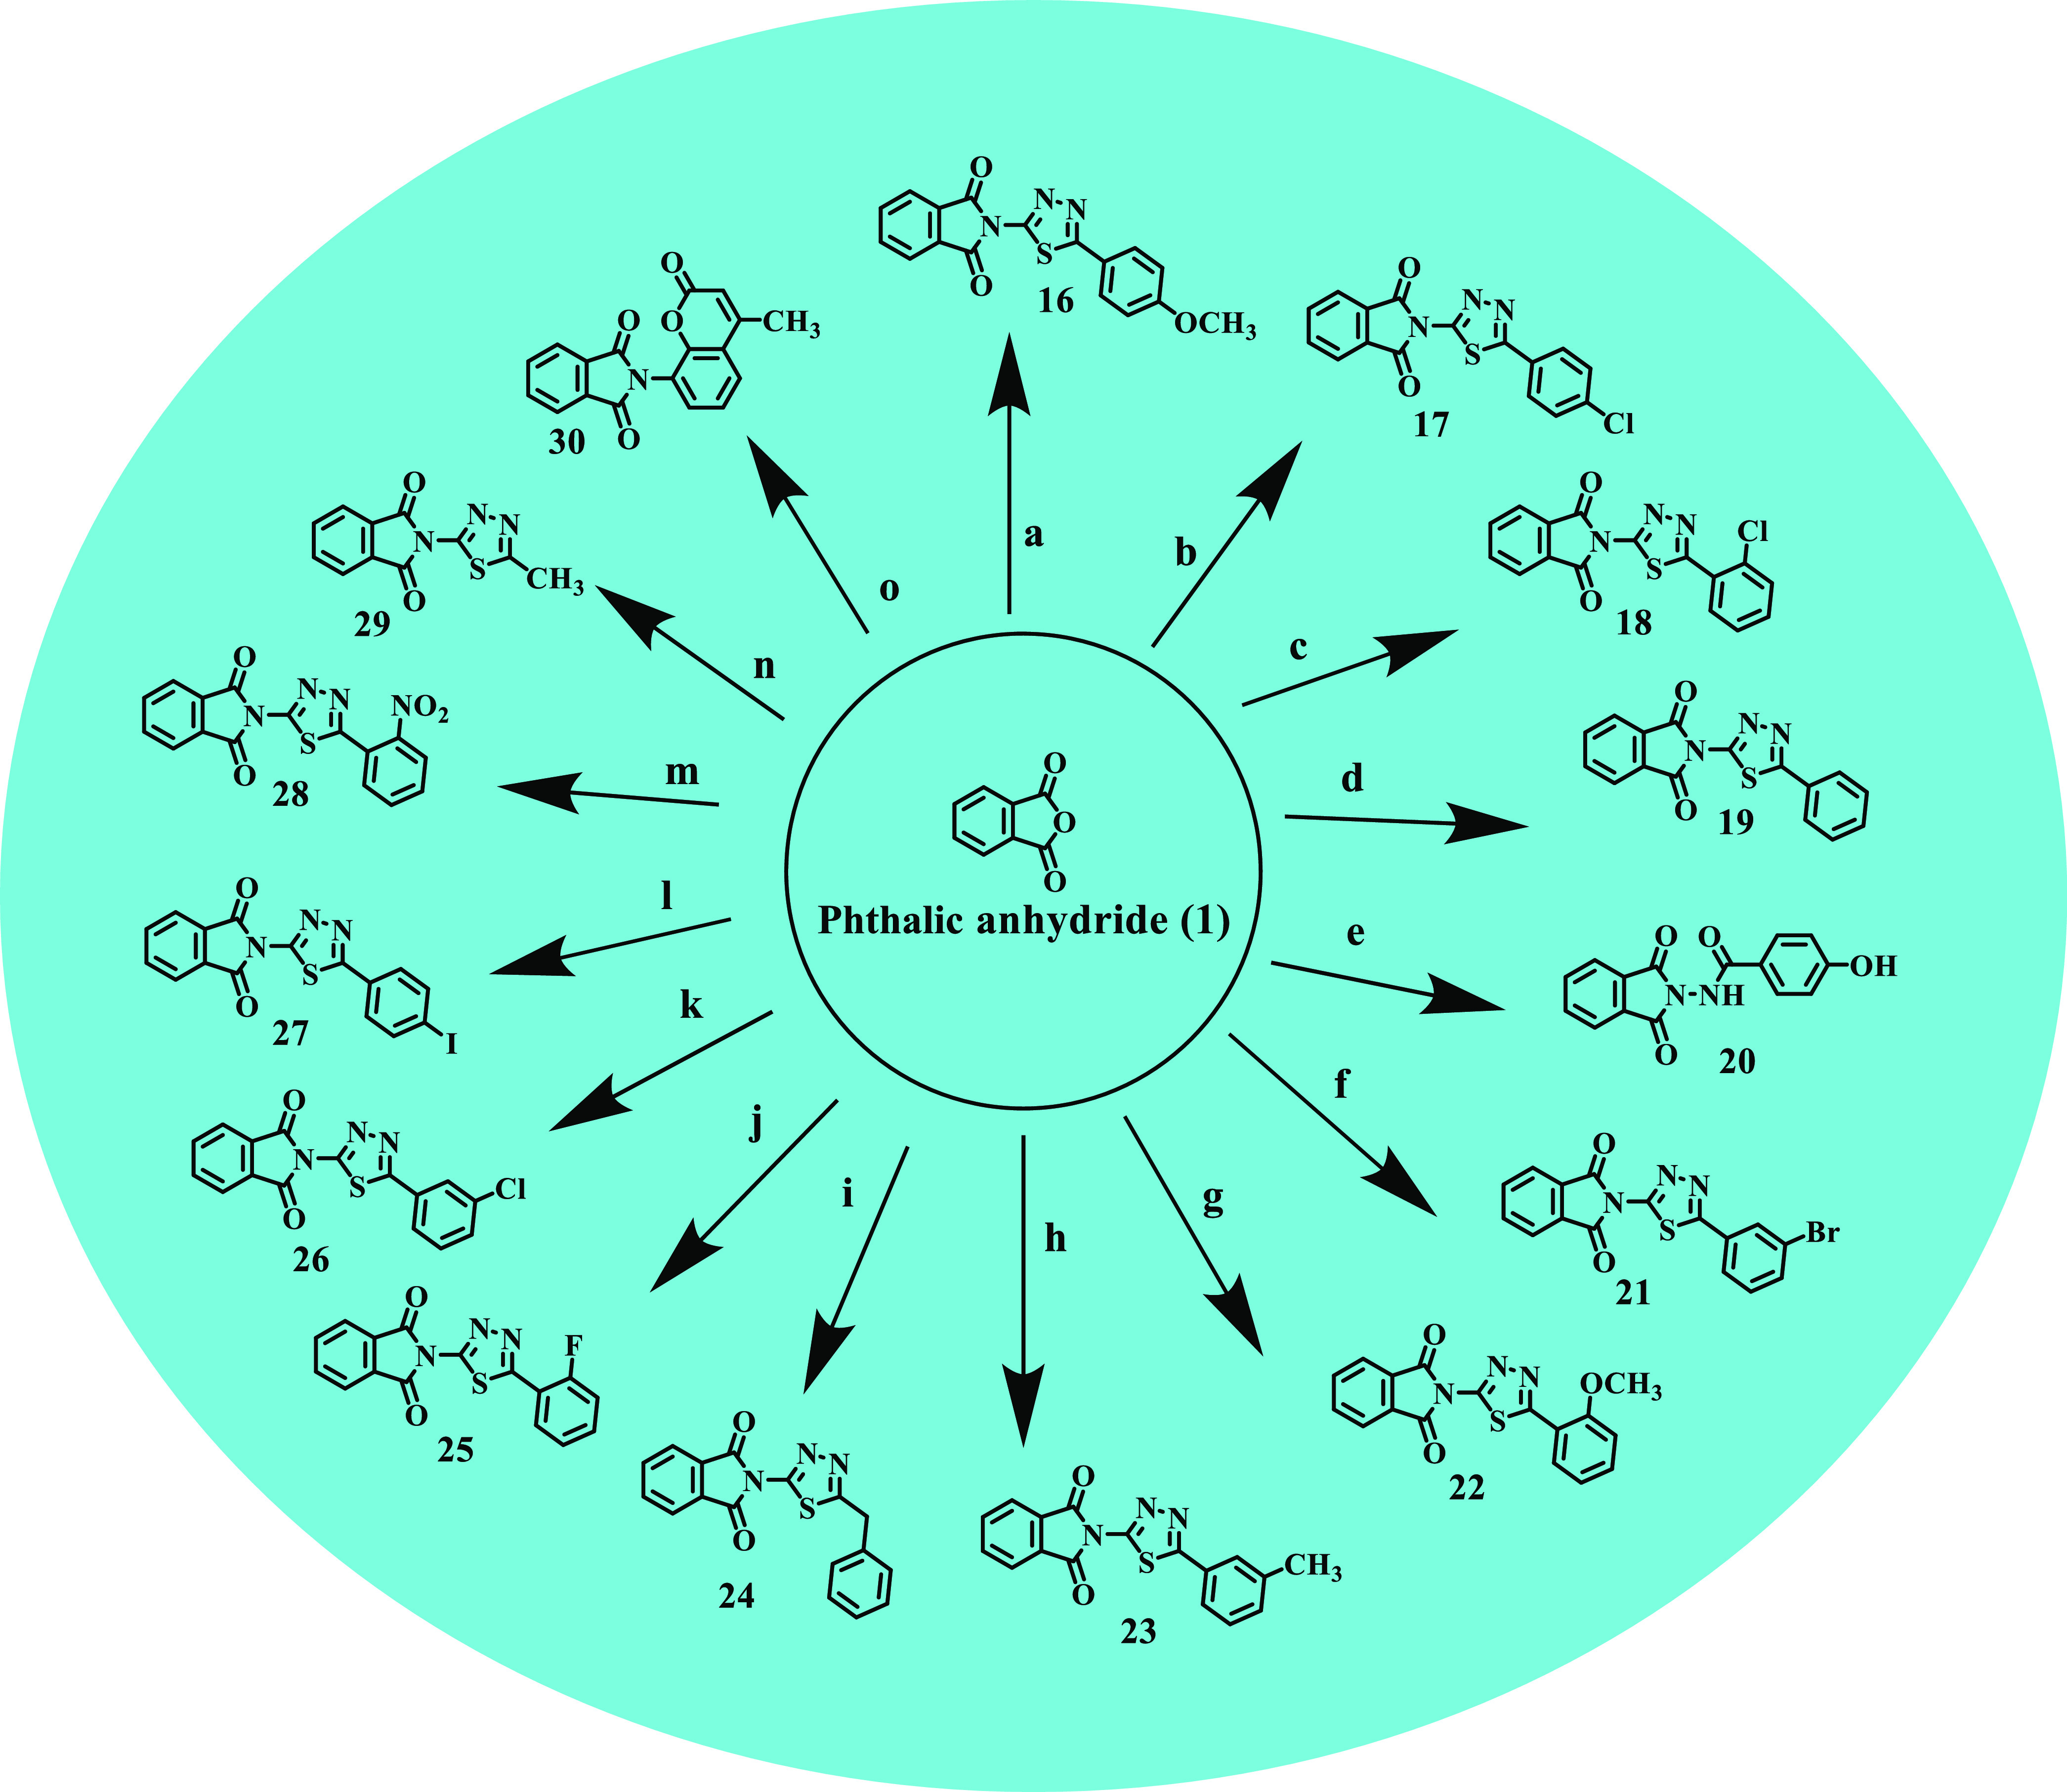
Reagents and conditions: 0.1 mol of the primary amino group containing alicyclic compound, 0.1 mol of phthalic anhydride in 50–75 mL of glacial acetic acid, reflux for 3 h; (a) 5-(4-methoxyphenyl)-1,3,4-thiadiazol-2-amine, (b) 5-(4-chlorophenyl)-1,3,4-thiadiazol-2-amine, (c) 5-(2-chlorophenyl)-1,3,4-thiadiazol-2-amine, (d) 5-phenyl-1,3,4-thiadiazol-2-amine, (e) 5-(4-methoxyphenyl)-1,3,4-thiadiazol-2-amine, (f) 5-(3-bromophenyl)-1,3,4-thiadiazol-2-amine, (g) 5-(3-methoxyphenyl)-1,3,4-thiadiazol-2-amine, (h) 5-(3-methylphenyl)-1,3,4-thiadiazol-2-amine, (i) 5-benzyl-1,3,4-thiadiazol-2-amine, (j) 5-(2-fluorophenyl)-1,3,4-thiadiazol-2-amine, (k) 5-(3-chlorophenyl)-1,3,4-thiadiazol-2-amine, (l) 5-(4-iodophenyl)-1,3,4-thiadiazol-2-amine, (m) 5-(2-nitrophenyl)-1,3,4-thiadiazol-2-amine, (n) 5-methyl-1,3,4-thiadiazol-2-amine, (o) 8-amino-4-methyl-2H-chromen-2-one.
The synthesis of the isoindoline-1,3-dione derivatives (2–30) was successfully carried out from phthalic anhydride and different primary amino-containing heterocycles with 95–100% purity. Purification of the compounds was carried out using flash chromatography and verified by liquid chromatography–mass spectrometry (LCMS).
2.2. Theoretical and Experimental Spectral Correlation
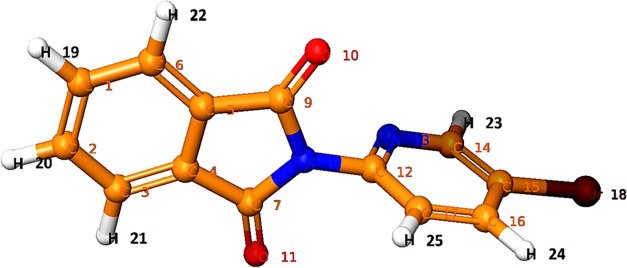
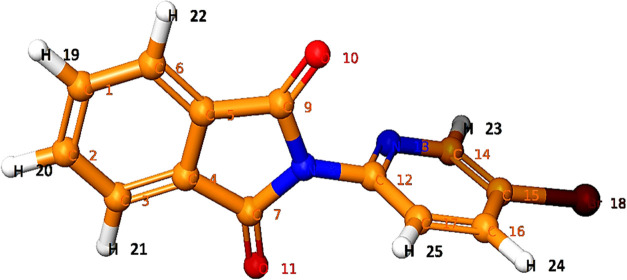
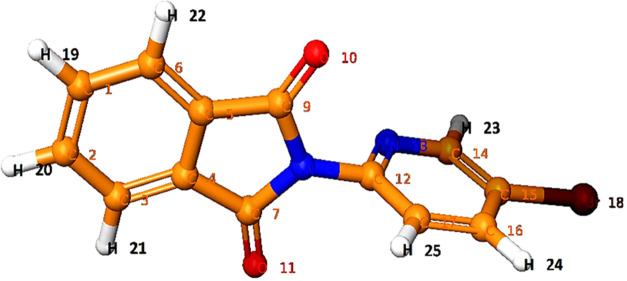
The use of IR and NMR (1H and 13C) spectroscopy, nowadays coupled with theoretical computations, is proving to be an effective tool for analyzing the vibrational and chemical shifts within molecules.17 The vibrational spectra, chemical shifts, and simulated outcomes can help to distinguish vibrational modes, chemical shifts (isotropic value), and structural features of the synthesized compounds.18 Using density functional theory (DFT)/B3LYP methods with the B3LYP/6-311** basis set, we examined the vibrational spectra and chemical shift (isotropic value).17,18 First, conformational search of compound 14 was first performed using the OPLS-2005 method. Consequently, the conformers were reoptimized by applying DFT at the B3LYP/6-311** level. The geometry optimized parameters of compound 14 are given in Table 1.
Table 1. Geometry-Optimized Structure of Compound 14 by DFT.
| bond angles (deg) | torsional angles (deg) | bond lengths (Å) | ||
|---|---|---|---|---|
| C6–C1–C2: 121.101621 | H23–C14–N13: 117.071275 | C1–C2–C3–C4: −0.123433 | C7–N8–C9–O10: −179.025033 | C1–C2: 1.401747 |
| H19–C1–C2: 119.318463 | H23–C14–C15: 120.702746 | C1–C2–C3–H21: −179.918978 | C7–N8–C12–N13: 85.109609 | C1–C6: 1.400602 |
| H19–C1–C6: 119.579865 | C16–C15–C14: 119.899225 | C1–C6–C5–C4: −0.124082 | C7–N8–C12–C17: −94.890391 | C1–H19: 1.086312 |
| C3–C2–C1: 121.101621 | Br18–C15–C14: 119.57376 | C1–C6–C5–C9: 179.776645 | N8–C12–N13–C14: 180.000000 | C2–C3: 1.400602 |
| H20–C2–C1: 119.318463 | Br18–C15–C16: 120.527014 | C2–C1–C6–C5: 0.123433 | N8–C12–C17–C16: 179.999999 | C2–H20: 1.086312 |
| H20–C2–C3: 119.579865 | C17–C16–C15: 117.701529 | C2–C1–C6–H22: 179.918978 | N8–C12–C17–H25: 0.000001 | C3–C4: 1.386955 |
| C4–C3–C2: 117.303383 | H24–C16–C15: 120.967860 | C2–C3–C4–C5: 0.124082 | C9–C5–C6–H22: −0.021522 | C3–H21: 1.085525 |
| H21–C3–C2: 121.955182 | H24–C16–C17: 121.330612 | C2–C3–C4–C7: −179.776645 | C9–N8–C7–O11: 179.025033 | C4–C5: 1.395452 |
| H21–C3–C4: 120.741115 | C16–C17–C12: 118.254907 | C3–C2–C1–C6: 0.000000 | C9–N8–C12–N13: −85.109609 | C4–C7 :1.490906 |
| C5–C4–C3: 121.594877 | H25–C17–C12: 120.290287 | C3–C2–C1–H19: 179.917540 | C9–N8–C12–C17: 94.890391 | C5–C6: 1.386955 |
| C7–C4–C3: 129.710583 | H25–C17–C16: 121.45480 | C3–C4–C5–C6: 0.000000 | O10–C9–N8–C12: −7.844467 | C5–C9: 1.490906 |
| C7–C4–C5: 108.694481 | C3–C4–C5–C9: −179.919378 | O11–C7–N8–C12: 7.844467 | C6–H22: 1.085525 | |
| C6–C5–C4: 121.594877 | C3–C4–C7–N8: −179.191936 | C12–N13–C14–C15: 0.000000 | C7–N8: 1.414388 | |
| C9–C5–C4: 108.694481 | C3–C4–C7–O11: 0.224911 | C12–N13–C14–H23: 180.000000 | C7–O11: 1.210985 | |
| C9–C5–C6: 129.710583 | C4–C3–C2–H20: 179.793894 | C12–C17–C16–C15: 0.000000 | N8–C9: 1.414388 | |
| C5–C6–C1: 117.303383 | C4–C5–C6–H22: −179.922250 | C12–C17–C16–H24: 179.999999 | N8–C12: 1.423335 | |
| H22–C6–C1: 121.955182 | C4–C5–C9–N8: −0.897331 | N13–C12–C17–C16: 0.000000 | C9–O10 :1.210985 | |
| H22–C6–C5: 120.741115 | C4–C5–C9–O10: 179.685821 | N13–C12–C17–H25: 180.000000 | C12–N13:1.332308 | |
| N8–C7–C4: 105.075084 | C4–C7–N8–C9: −1.528816 | N13–C14–C15–C16: 0.000000 | C12–C17: 1.394047 | |
| O11–C7–C4: 129.387418 | C4–C7–N8–C12: −172.709383 | N13–C14–C15–Br18: 180.000000 | N13–C14: 1.333632 | |
| O11–C7–N8: 125.534776 | C5–C4–C3–H21: 179.922250 | C14–N13–C12–C17: 0.000001 | C14–C15 :1.397358 | |
| C9–N8–C7: 112.437750 | C5–C4–C7–N8: 0.897331 | C14–C15–C16–C17: 0.000000 | C14–H23 :1.086646 | |
| C12–N8–C7: 123.466902 | C5–C4–C7–O11: −179.685821 | C14–C15–C16–H24: 180.000000 | C15–C16: 1.392428 | |
| C12–N8–C9: 123.466902 | C5–C6–C1–H19: −179.79389 | C15–C16–C17–H25: 180.000000 | C15–Br18 :1.90764 | |
| N8–C9–C5: 105.075084 | C5–C9–N8–C7: 1.528816 | C16–C15–C14–H23: 180.000000 | C16–C17: 1.392395 | |
| O10–C9–C5: 129.387418 | C5–C9–N8–C12: 172.70938 | C17–C16–C15–Br18: 180.000000 | C16–H24 :1.084458 | |
| O10–C9–N8: 125.534776 | C6–C1–C2–H20: −179.917540 | Br18–C15–C14–H23: 0.000000 | C17–H25: 1.084341 | |
| N13–C12–N8: 116.130169 | C6–C5–C4–C7: 179.919378 | Br18–C15–C16–H24: 0.000001 | ||
| C17–C12–N8: 119.725519 | C6–C5–C9–N8: 179.191936 | H19–C1–C2–H20: 0.000000 | ||
| C17–C12–N13: 124.1443 | C6–C5–C9–O10: −0.22491 | H19–C1–C6–H22: 0.001651 | ||
| C14–N13–C12: 117.7740 | C7–C4–C3–H21: 0.021522 | H20–C2–C3–H21: −0.001651 | ||
| C15–C14–N13: 122.2259 | C7–C4–C5–C9: 0.000000 | H24–C16–C17–H25: 0.000000 | ||
2.2.1. Vibrational Analysis (IR Spectral Analysis)
IR spectra were recorded for the solid substances using the KBr press pellet technique in the region between 4000 and 400 cm–1 with 40 number of scans on a Shimadzu FTIR-8400S at a resolution of 4 Hz. The calculated vibrational wavenumbers and IR intensities of compound 14 are provided in Table 2 and Figures 2 and 3. The linear correlations between calculated and assessed data have been obtained by the DFT/B3LYP method and are illustrated by eq 1.
| 1 |
As the DFT calculated vibrational wavenumbers were higher than those calculated experimentally, they were scaled down by the scaling factors 0.958 and 0.983 for the wavenumbers in the range of 4000–1700 cm–1 and lower than 1700 cm–1, respectively.19
Table 2. Experimental and Calculated Wavenumbers (cm–1) for Compound 14.
| calculated IR by B3LYP/6-311** |
calculated IR by B3LYP/6-311** |
||||||
|---|---|---|---|---|---|---|---|
| mode | experimental IR | unscaled | scaled | mode | experimental IR | unscaled | scaled |
| 1 | 33.07 | 32.51 | 36 | 1171.60 | 1151.69 | ||
| 2 | 46.69 | 45.90 | 37 | 1200.45 | 1180.04 | ||
| 3 | 79.62 | 78.27 | 38 | 1219.70 | 1198.96 | ||
| 4 | 124.43 | 122.31 | 39 | 1245.64 | 1224.46 | ||
| 5 | 143.21 | 140.78 | 40 | 1286.82 | 1264.95 | ||
| 6 | 169.39 | 166.51 | 41 | 1306.73 | 1284.51 | ||
| 7 | 177.07 | 174.06 | 42 | 1364.00 | 1340.81 | ||
| 8 | 235.44 | 231.43 | 43 | 1357.93 | 1384.02 | 1360.49 | |
| 9 | 288.57 | 283.66 | 44 | 1439.47 | 1415.00 | ||
| 10 | 291.24 | 286.29 | 45 | 1444.20 | 1419.65 | ||
| 11 | 348.94 | 343.01 | 46 | 1460.58 | 1435.75 | ||
| 12 | 369.19 | 362.92 | 47 | 1465.95 | 1512.64 | 1486.93 | |
| 13 | 376.14 | 369.74 | 48 | 1538.27 | 1512.12 | ||
| 14 | 444.47 | 436.91 | 49 | 1570.11 | 1599.41 | 1572.22 | |
| 15 | 461.42 | 453.57 | 50 | 1626.21 | 1598.56 | ||
| 16 | 506.24 | 497.63 | 51 | 1644.88 | 1616.92 | ||
| 17 | 553.41 | 544.00 | 52 | 1650.97 | 1622.90 | ||
| 18 | 558.33 | 548.84 | 53 | 1682.28 | 1653.68 | ||
| 19 | 578.97 | 569.13 | 54 | 1692.26 | 1663.49 | ||
| 20 | 638.34 | 627.48 | 55 | 1721.25 | 1648.95 | ||
| 21 | 665.46 | 657.89 | 646.70 | 56 | 1725.96 | 1653.47 | |
| 22 | 715.61 | 722.32 | 710.04 | 57 | 1738.93 | 1665.90 | |
| 23 | 737.00 | 724.47 | 58 | 1757.39 | 1683.58 | ||
| 24 | 755.47 | 742.62 | 59 | 1718.63 | 1804.81 | 1729.00 | |
| 25 | 786.98 | 770.95 | 757.85 | 60 | 1809.16 | 1733.18 | |
| 26 | 835.21 | 840.12 | 825.84 | 61 | 1873.55 | 1794.86 | |
| 27 | 883.43 | 856.11 | 841.56 | 62 | 1934.41 | 1853.16 | |
| 28 | 927.50 | 911.73 | 63 | 3144.55 | 3012.48 | ||
| 29 | 986.32 | 969.55 | 64 | 3146.35 | 3014.21 | ||
| 30 | 1006.88 | 1030.97 | 1013.45 | 65 | 3150.33 | 3018.02 | |
| 31 | 1052.82 | 1034.93 | 66 | 3151.00 | 3018.66 | ||
| 32 | 1072.46 | 1100.22 | 1081.51 | 67 | 3153.79 | 3021.33 | |
| 33 | 1103.17 | 1084.42 | 68 | 3158.79 | 3026.12 | ||
| 34 | 1132.09 | 1112.84 | 69 | 3064.99 | 3164.93 | 3032.00 | |
| 35 | 1139.92 | 1120.54 | 70 | ||||
Figure 2.
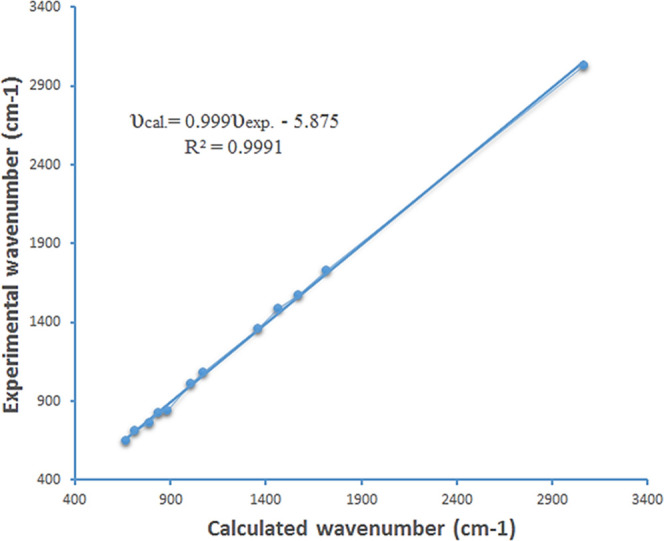
Linear regression between experimental and calculated wavenumbers for compound 14.
Figure 3.
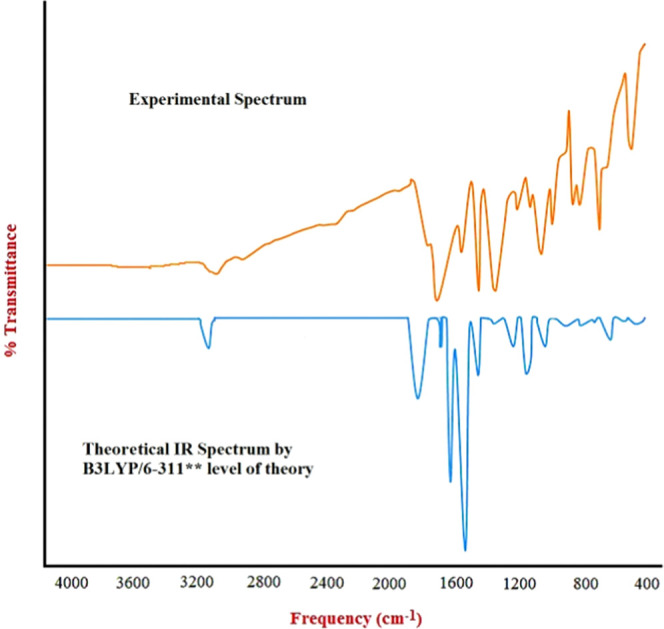
Experimental and theoretical IR spectra of compound 14.
We compared the scaled theoretical values with the experimental values for compound 14. The CH vibrations are a common vibrational frequency observed in IR spectra. Unsaturated hydrocarbons have vibrational frequencies ranging from 3100 to 3000 cm–1. Experimental aromatic CH stretching was observed at 3064.99 cm–1, and a calculated peak was observed at 3032.00 cm–1 for compound 14. It is easy to recognize the stretching vibrational absorption of C=O since it usually appears in the region of ∼1700 cm–1 with a sharp, distinct peak.
The experimental peak of the C=O pear at 1718.63 cm–1 and the theoretical scaled peak was observed at 1729.00. The C–N (m–s) and C=N (m–s) peaks are generally observed between 1350–1000 and 1690–1640 cm–1. Experimentally, C–N and C=N peaks are observed at 1357.93 and 1570.11 cm–1 and at 1360.49 and 1572.22 cm–1 in the simulated spectrum, respectively. The bromide usually appears at <667 cm–1 in IR. Practically, it appeared at 665.46 cm–1 and theoretically, by quantum mechanics, at 646.70 cm–1.
2.2.2. 1H NMR Spectral Analysis
At ambient temperature, 1H NMR and 13C NMR spectra were recorded on a Bruker Avance-II 400 NMR spectrometer operating at 400 MHz. Chemical shifts were calculated and reported in δ ppm in comparison to the internal standard tetramethylsilane (TMS) (Table 3 and Figures 4 and 5). 1H NMR spectra provide information about peak shapes, chemical shifts, sources of hydrogen atoms, coupling constants, etc. Aromatic hydrogen atoms tend to appear in high-field regions, and aliphatic hydrogen atoms appear in low-field regions; with an increased electron cloud density, electronegative groups can increase the chemical shift.17−20
Table 3. Experimental and Calculated 1H NMR Spectra of Compound 14.
| label | isotropic shielding | calculated 1H NMR chemical shift relative to TMS (δ ppm) | experimental chemical shift (multiplets) (δ ppm) | average chemical shift (δ ppm) |
|---|---|---|---|---|
| H19 and H20 | 23.51 | 8.13 | 7.9873–8.0087 | 7.99 |
| H21 and H22 | 23.63 | 8.01 | 7.9204–7.9419 | 7.93 |
| H23 | 22.89 | 8.75 | 8.7906–8.7847 | 8.78 |
| H24 | 23.12 | 8.52 | 8.2838–8.3113 | 8.3 |
| H25 | 24.05 | 7.59 | 7.5794–7.5582 | 7.56 |
Figure 4.
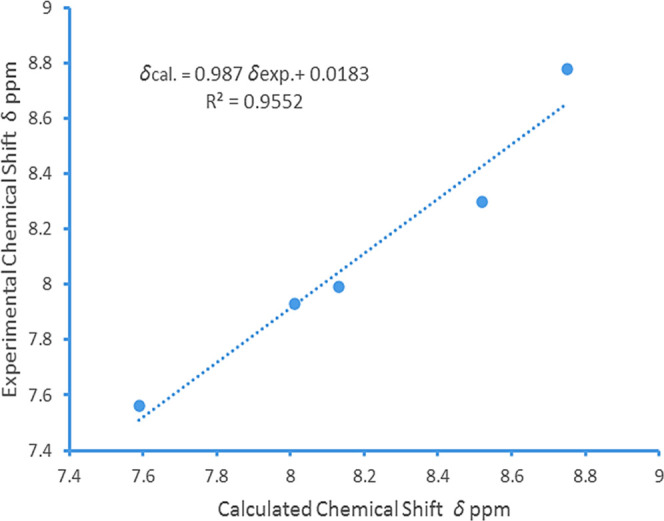
Analysis of the linear relationship between experimental and calculated chemical shifts (1H NMR) for compound 14.
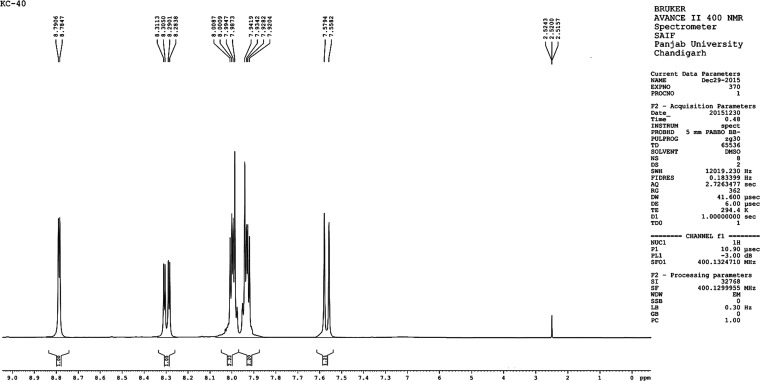
Figure 5.
1H NMR spectrum of compound 14.
The linear correlation between calculated and observed data was found for compound 14 by the DFT/B3LYP method and is explained by eq 2.
| 2 |
As shown in Table 3, H21 and H22 of the isoindoline-1,3-dione ring of compound 14 are in the same chemical environment and should appear as doublet of doublet (dd). In the simulation study, they had an isotropic shielding value of 23.63 and the calculated 1H NMR chemical shift relative to TMS was found to be 8.01 δ ppm. The average experimental chemical shift was observed at 7.93 δ ppm (dd). Similarly, H19 and H20 were having similar chemical environment (isotropic value: 23.51) and their calculated chemical shift was observed at 8.13 δ ppm and practical average chemical shift as dd observed at 7.99 δ ppm. The meta coupled H23 of 4-bromo pyridinyl of compound 14 appeared at 8.78–8.79 δ ppm (average: 8.78 δ ppm), and in quantum simulation, it appeared at 8.75 δ ppm with an isotropic value of 22.89.
A sharp doublet of H25 appeared at 7.55–7.57 δ ppm (average: 7.56 δ ppm), and a theoretical calculated chemical shift appeared at 7.59 δ ppm. A double-notched doublet of pyridinyl proton H24 was observed at 8.28–8.31 δ ppm (average: 8.3 δ ppm), and the calculated 1H NMR chemical shift relative to TMS appeared at 8.52 δ ppm (Figure 5).
2.2.3. 13C NMR Spectral Analysis
The 13C chemical shift of carbon is determined to a large extent by its hybrid orbital states. Generally, sp3 hybrid carbons have a resonance in the high field, sp2 hybrid carbons have one in the low field, and sp hybrid carbons resonate in between them. Using TMS as an internal standard substance, δ values of sp3 carbon range between 0 and 60 ppm, sp2 hybrid carbon is in between 100 and 150 ppm, and the range of δ values of sp hybrid carbon is 60–95 ppm.17−23
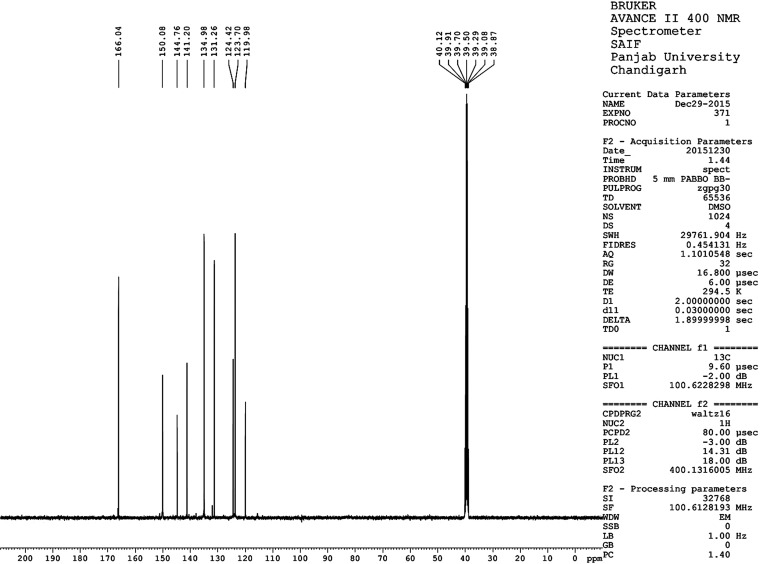
Besides induction and conjugation effects, the variation in electron cloud density outside the carbon nucleus can also affect chemical shifts. This results in a shift of the resonance absorption peak in high and low fields.17,18 The Bruker Avance-II 400 NMR spectrometer operating at 400 MHz was used to record 13C NMR spectra, and chemical shifts were measured compared to the TMS (Table 4 and Figures 6 and 7). The characteristic carbonyl carbon (C7 and C9) of the isoindoline-1,3-dione ring of compound 14 appeared at 166.04 δ ppm (calculated: 174.35 δ ppm). Other aromatic carbons of compound 14 are observed between 119.98 and 150.08 δ ppm. A significant linear correlation has been observed between calculated and observed chemical shift data for 13C NMR (Figure 6) and is described by eq 3.
| 3 |
Table 4. Experimental and Theoretical Calculated 13C NMR Spectra of Compound 14.
| label | isotropic shielding | calculated 13C NMR chemical shift relative to TMS (δ ppm) | experimental chemical shift (δ ppm) |
|---|---|---|---|
| C1 and C2 | 63.13 | 134.73 | 134.98 |
| C3 and C6 | 70.58 | 126.79 | 123.70 |
| C4 and C5 | 60.06 | 138.01 | 131.26 |
| C7 and C9 | 25.99 | 174.35 | 166.04 |
| C12 | 44.18 | 154.95 | 141.20 |
| C14 | 42.72 | 156.5 | 150.08 |
| C15 | 73.1 | 124.7 | 119.98 |
| C16 | 56.45 | 141.85 | 144.76 |
| C17 | 69.73 | 127.69 | 124.42 |
Figure 6.
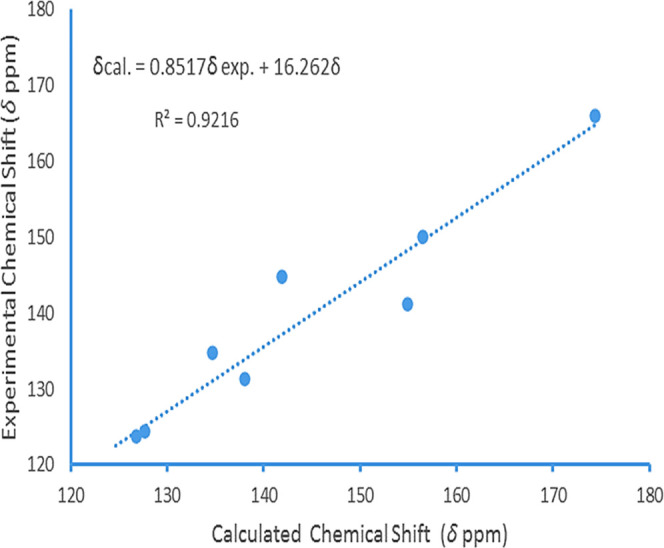
Linear regression between experimental and calculated chemical shifts (13C NMR) for compound 14.
Figure 7.
13C NMR spectrum of compound 14.
2.3. Antimycobacterial Activity and Structure–Activity Relationship (SAR)
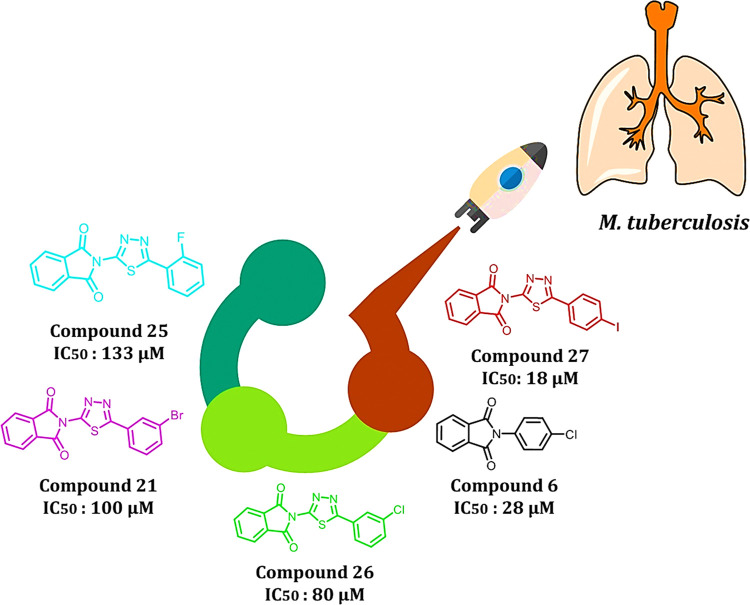
Newly synthesized compounds have been evaluated for their antimycobacterial activity using a dual read-out (OD590 and fluorescence) assay procedure to determine the MIC against the Mtb H37Rv strain.24−26 Results of the antimycobacterial activity are shown in Table 5. The series of the synthesized isoindoline-1,3-diones (2–30) can be broadly divided into substituted aniline derivatives (2–15) and substituted 1,3,4-thiadiazol derivatives (16–19, 21–29) and have an IC50 value of 18–197 μM against M. tuberculosis. Structural relationship suggested that the substituted 1,3,4-thiadiazols are more potent than the substituted anilines at the second position of the 2-isoindoline-1,3-dione [compound 27 (IC50: 18 μM); compound 6 (IC50: 28 μM)]. Among the halo-phenyl-substituted 1,3,4-thiadiazols at the second position, iodophenyl [compound 27 (IC50: 18 μM)] was more potent compared to the chloro [compound 26 (IC50: 80 μM)], bromo [compound 21 (IC50: 100 μM)], and fluorophenyl [compound 25 (IC50: 133 μM)]. Among the anilines, 4-chloro aniline (4-chlor phenyl) has shown significant antimycobacterial activity (IC50: 28 μM) compared to other anilines. It was expected that pyridine-substituted 2-isoindoline-1,3-diones (compounds 12, 13, and 14) would show significant antimycobacterial activity, but practically, they have demonstrated only moderate antimycobacterial activity [compound 14 (IC50: 90 μM); compound 12 (IC50: 148 μM); compound 13 (IC50: 160 μM)] (Figure 8).
Table 5. Antimycobacterial and Cytotoxicity Study of the Synthesized Compounds (2–30).
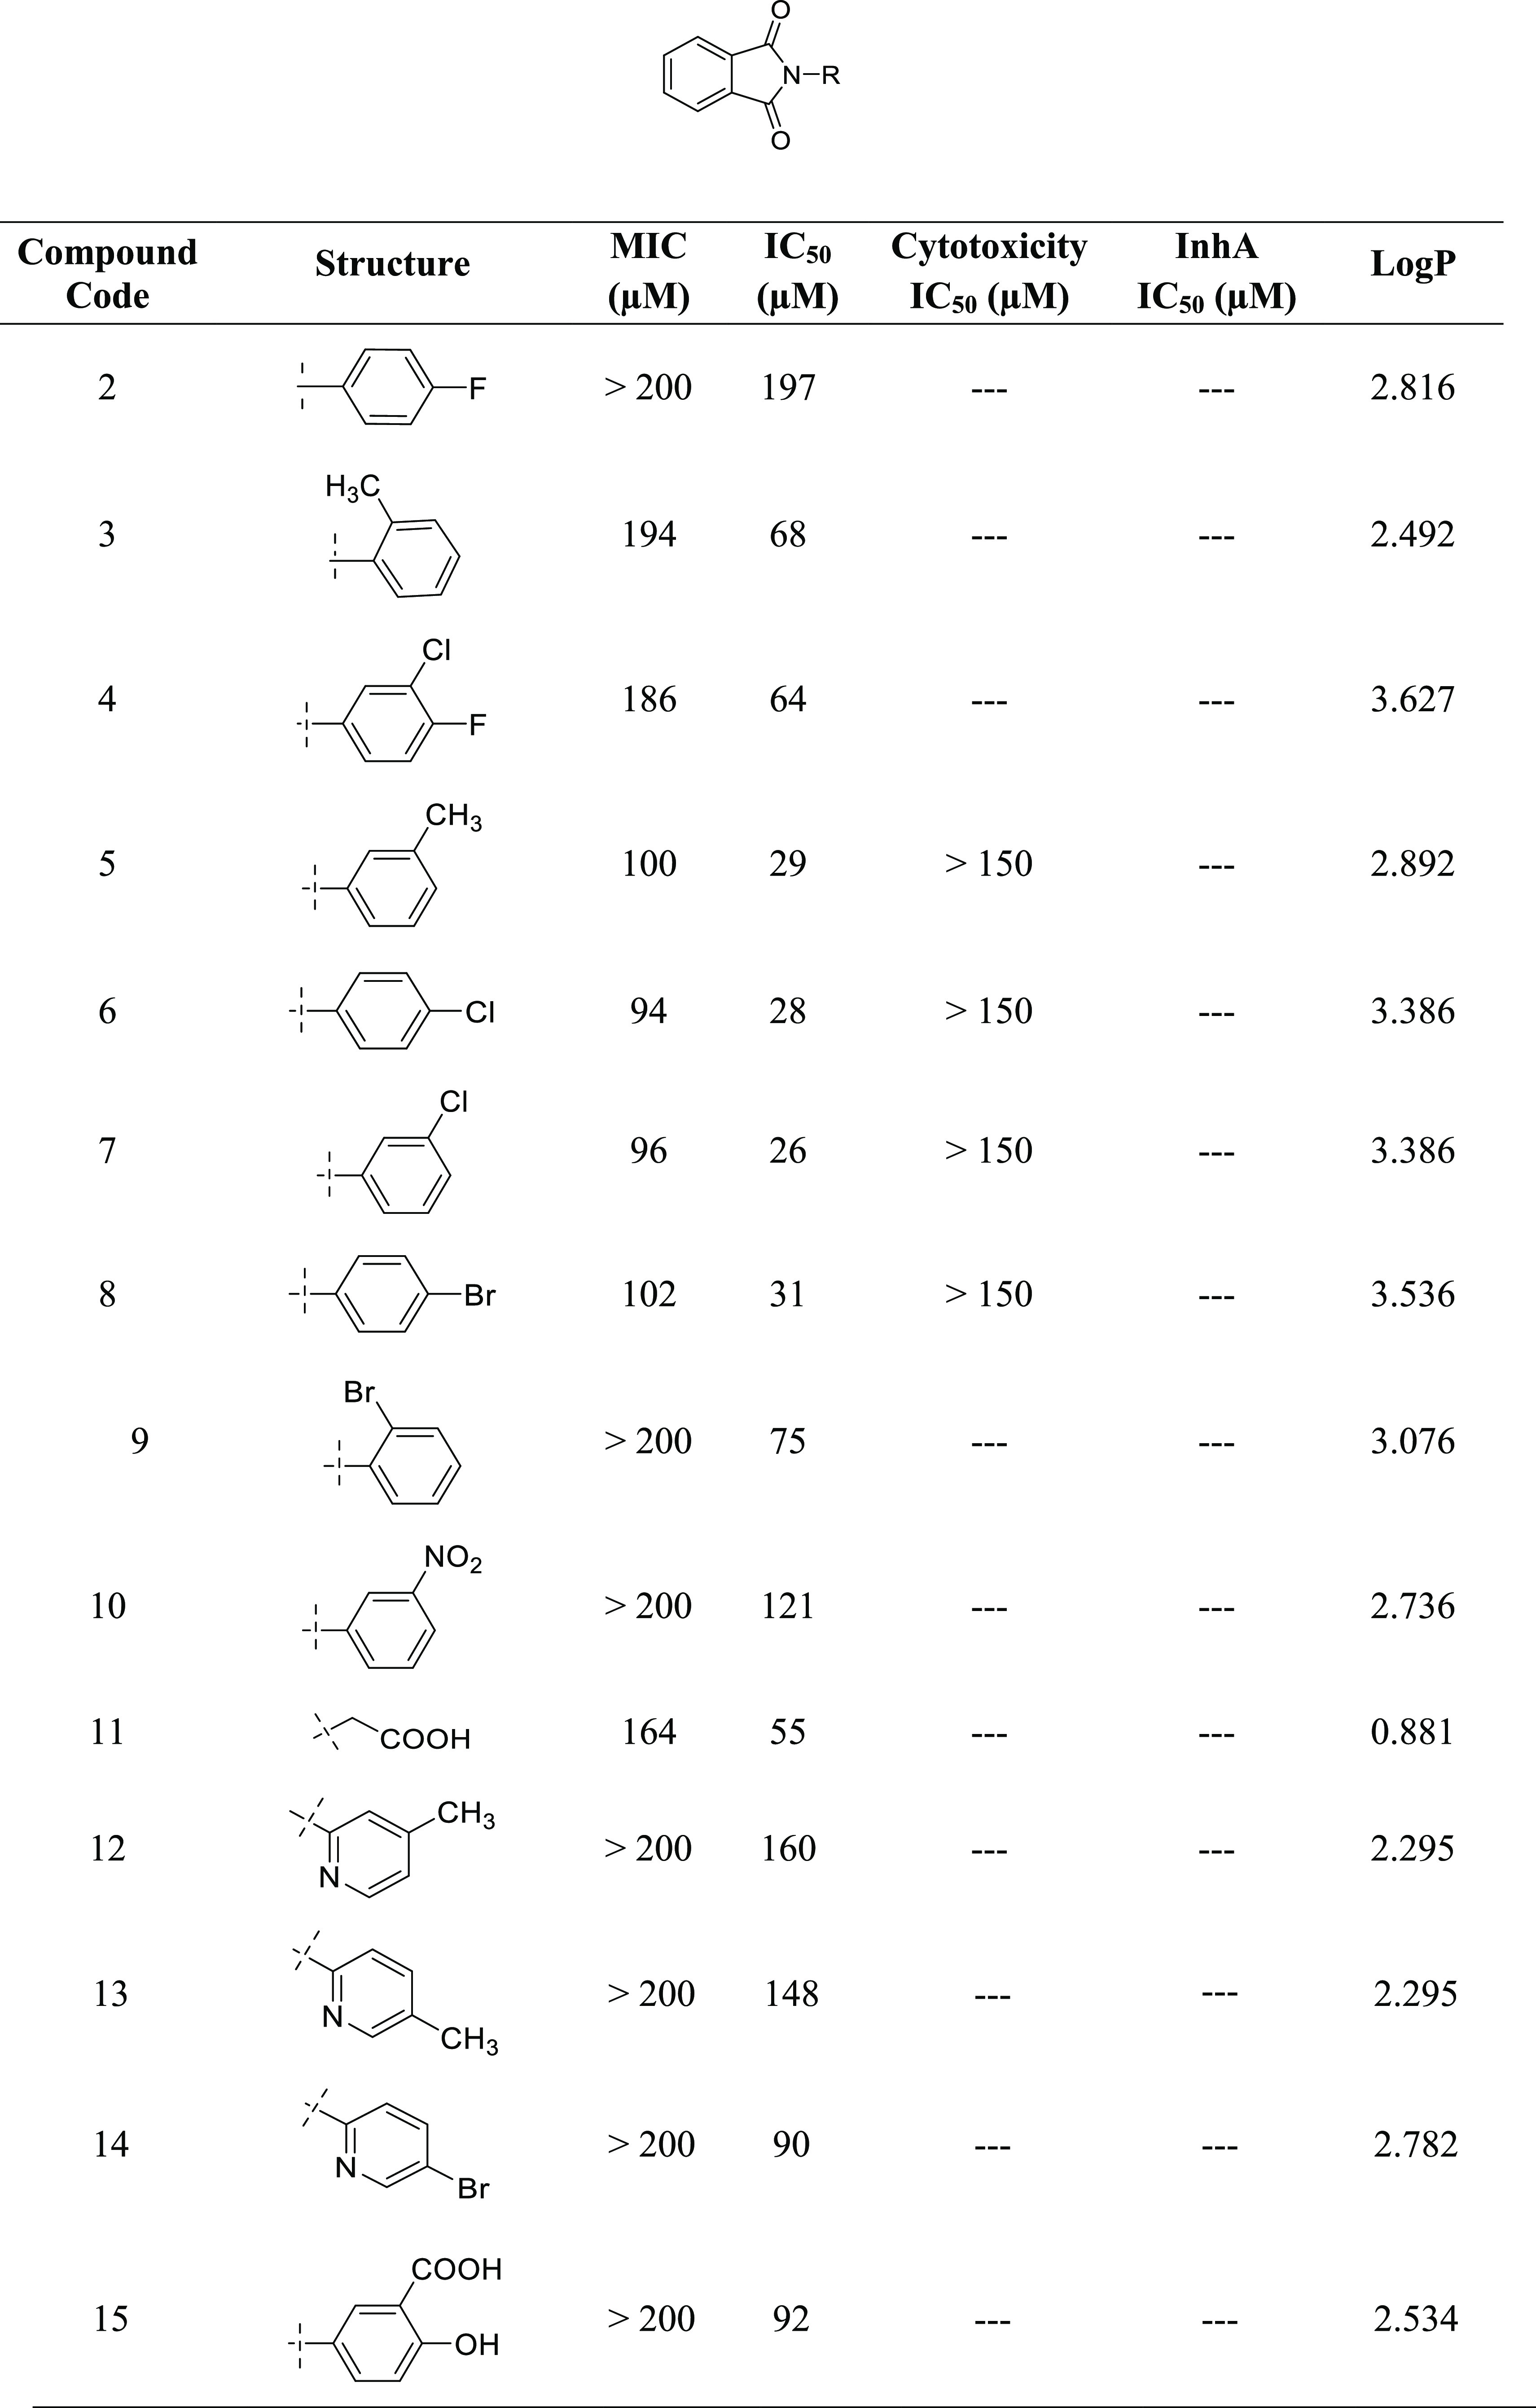
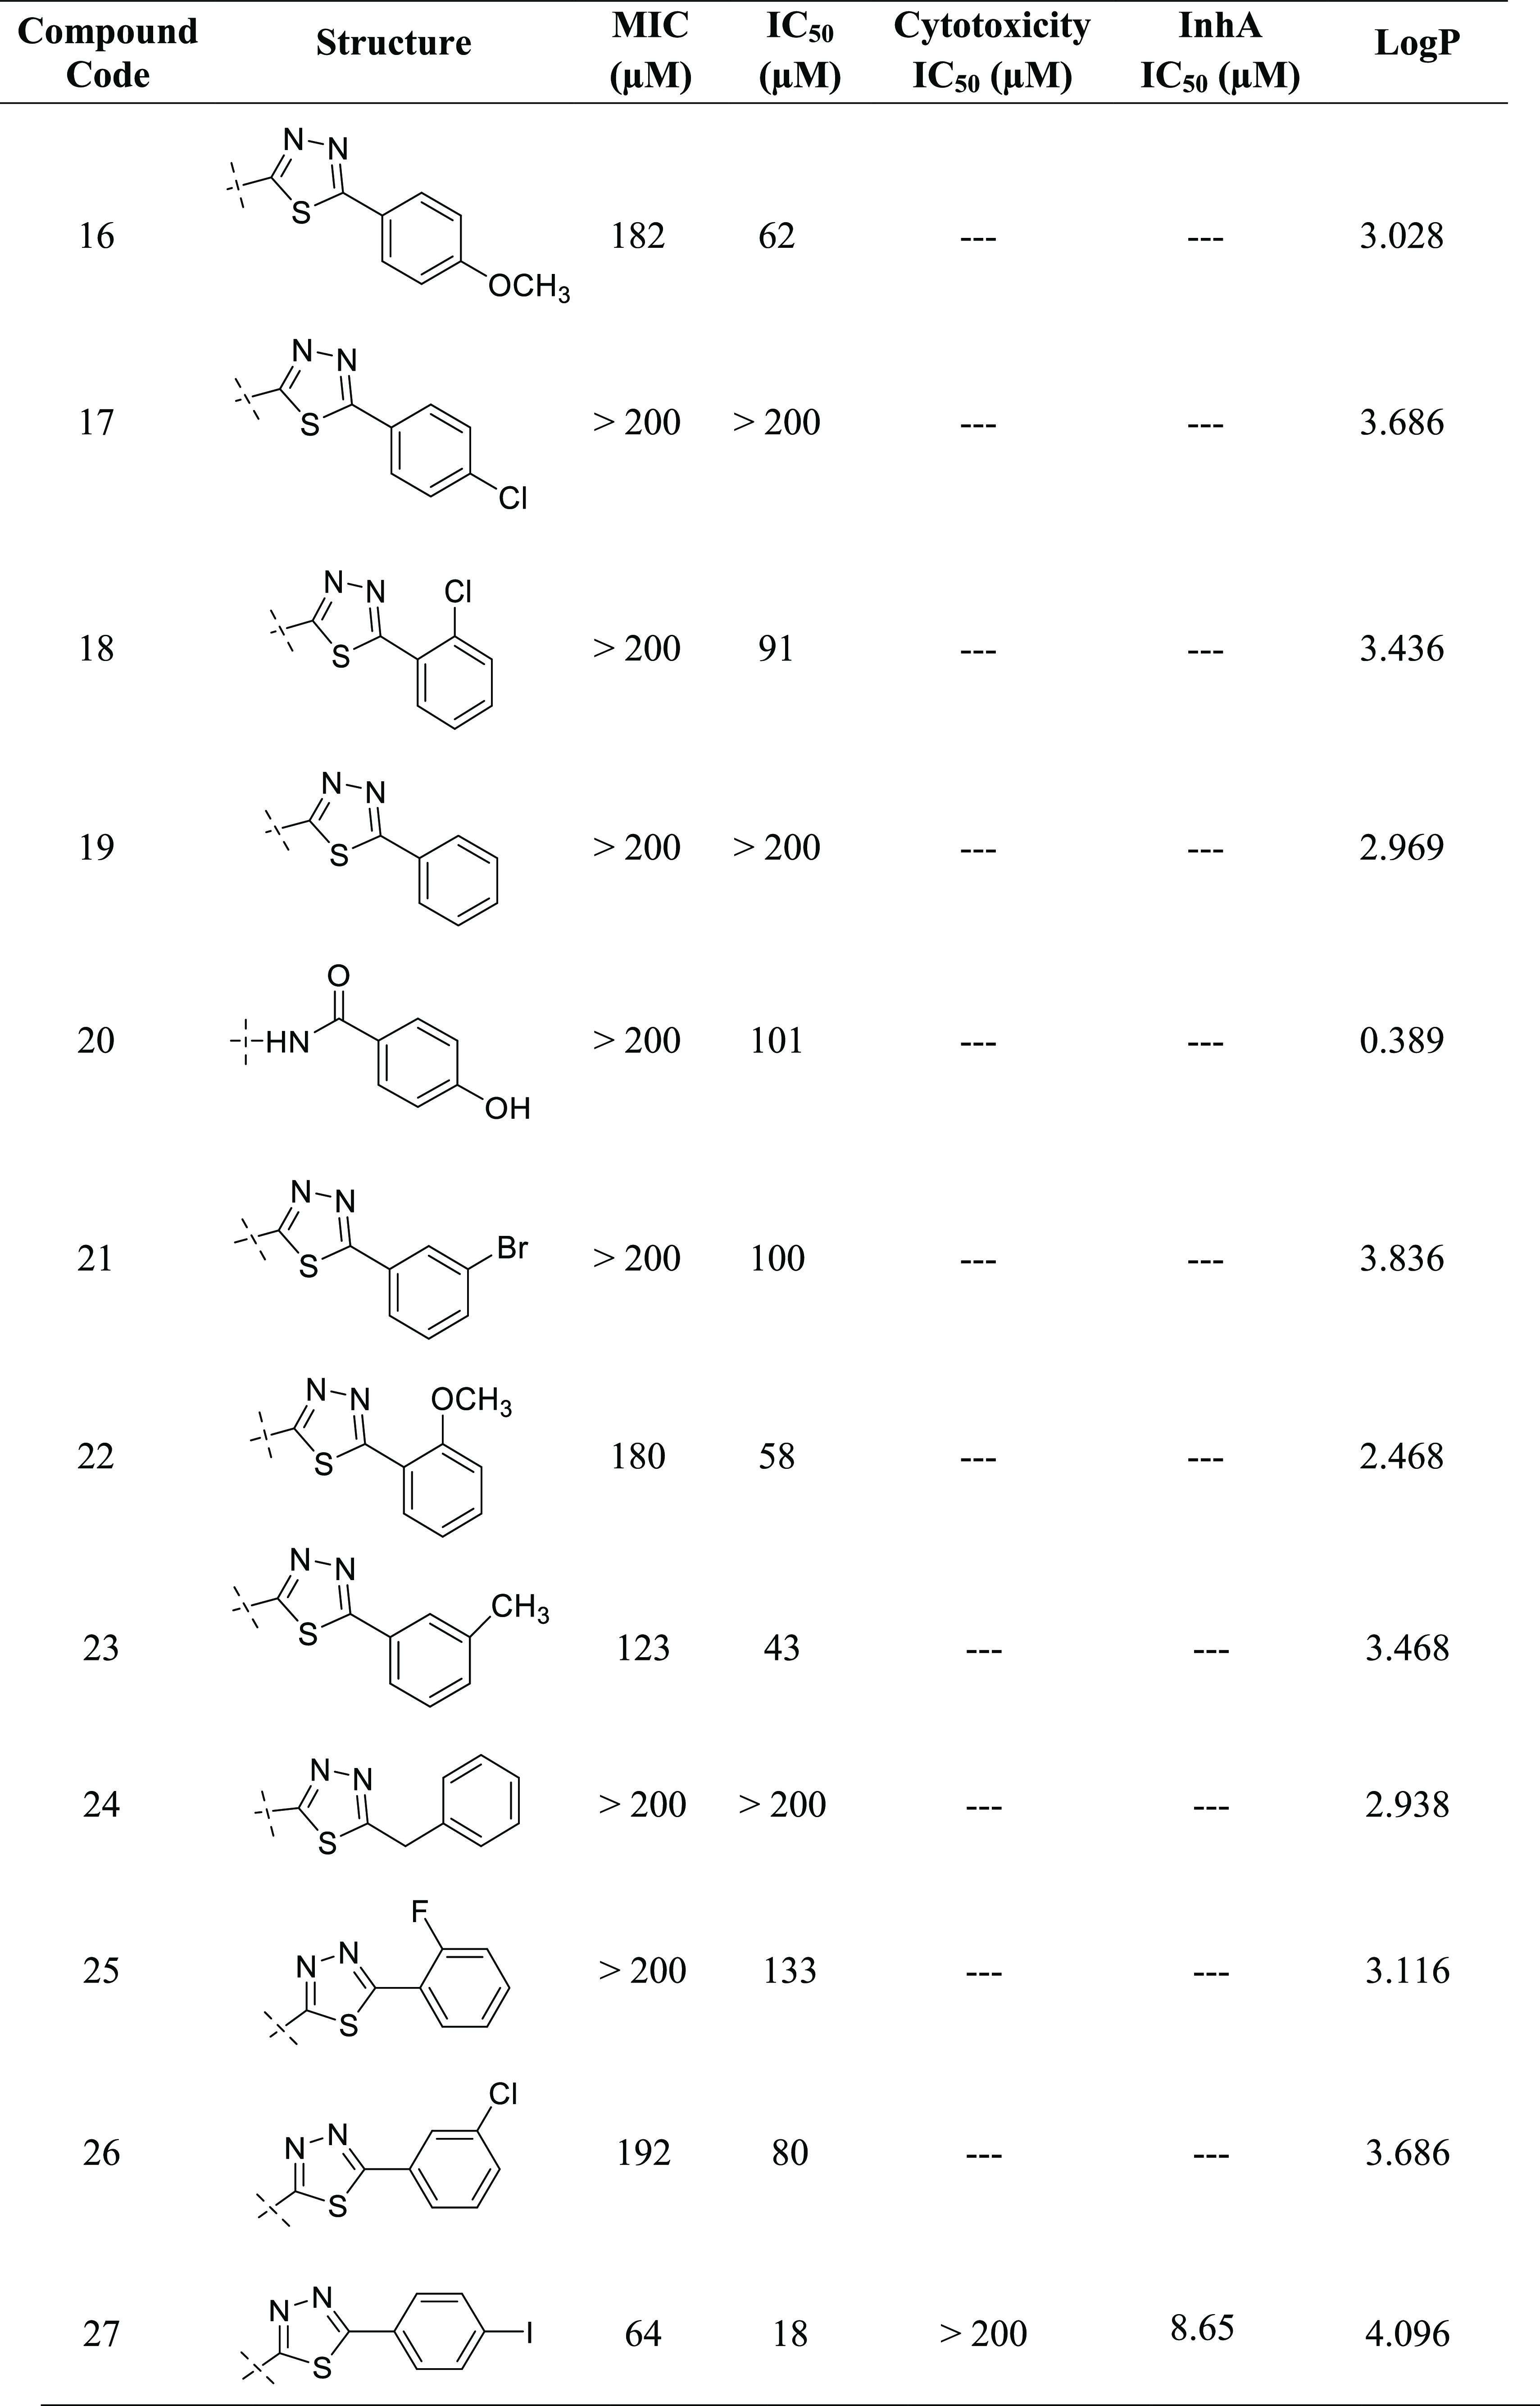
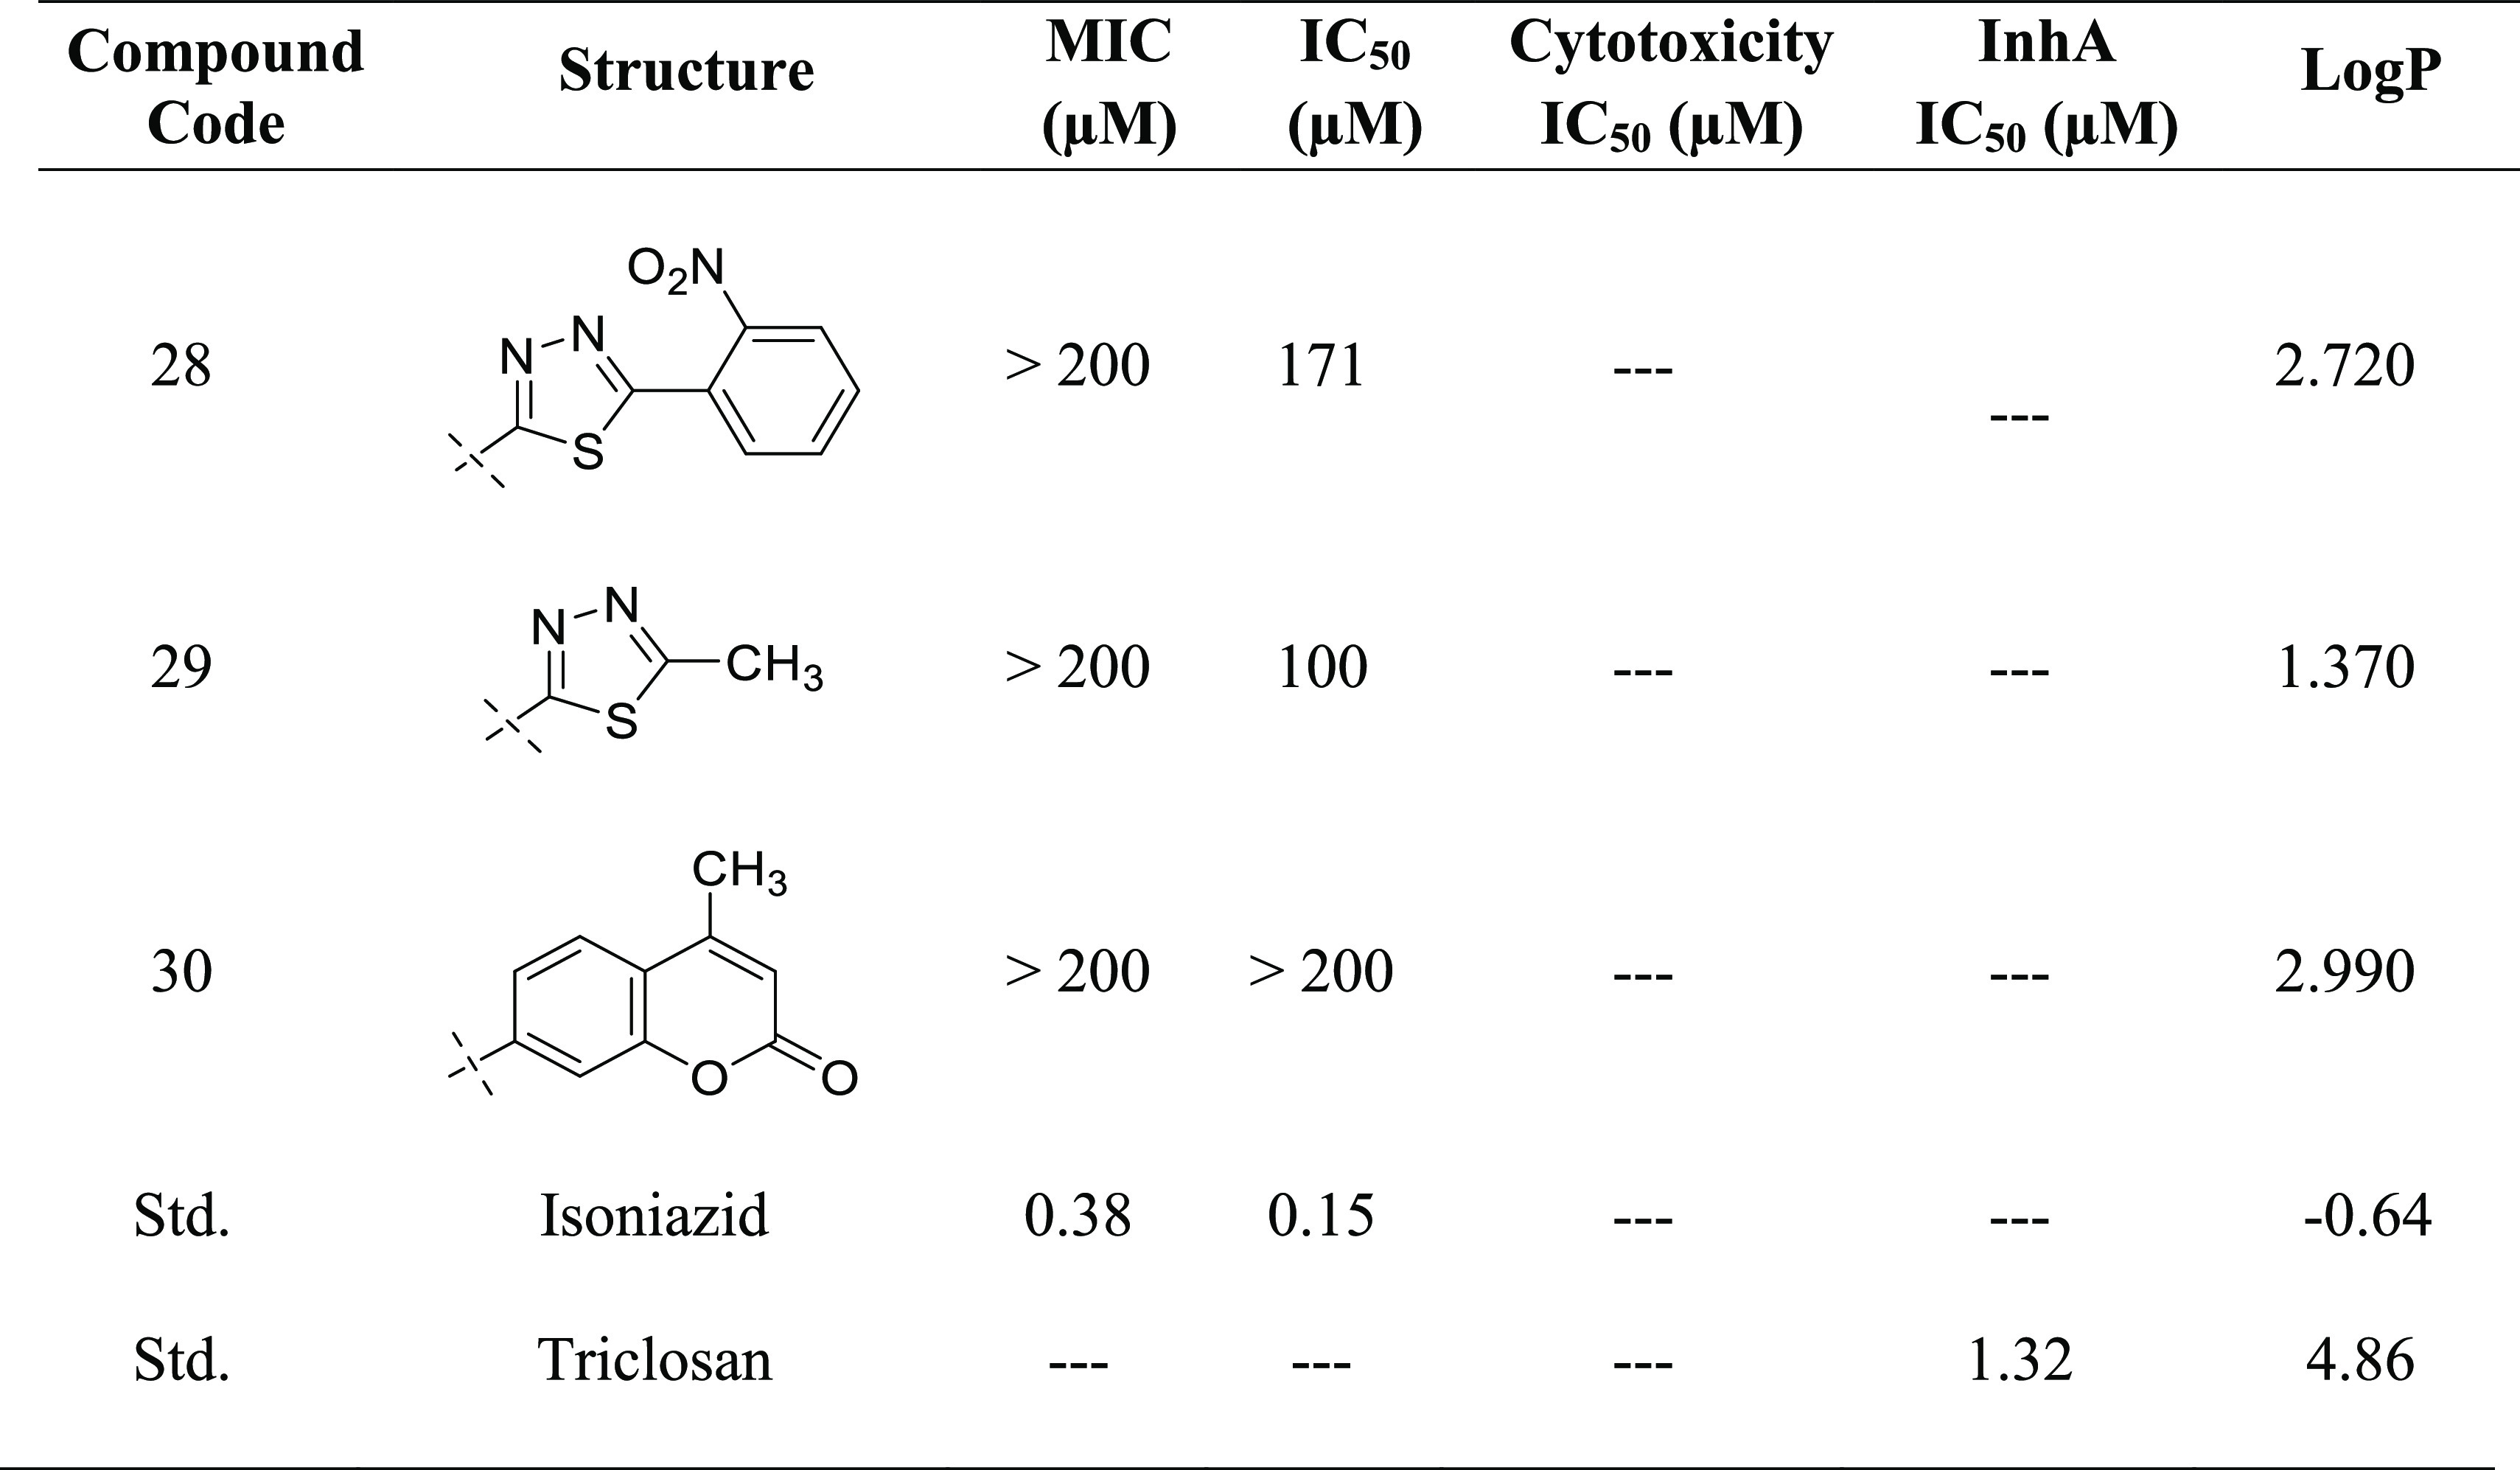
Figure 8.
Structure–activity relationship of isoindoline-1,3-diones (2–30).
2.4. In Vitro Cytotoxicity Evaluation
The cytotoxic effects of potent compounds were determined by assessing THP-1 cell viability after 3 days in the presence of test compounds. Table 5 shows the cytotoxicity data of compounds 5–8 and 27. All of the tested compounds had an IC50 value greater than 150 μM.24−26
2.5. InhA Inhibitory Activity
To determine the InhA inhibitory activity of potent compound 27, an enzyme assay was carried (Table 5). The assay was carried out utilizing 2-trans-dodecenoyl-CoA as a substrate, and the % inhibition was measured taking into consideration the conversion of NADH into its oxidized form NAD+ at 340 nm. Triclosan, a well-known InhA inhibitor, has been used as a reference. The IC50 value of potent compound 27 was found to be 8.65 μM compared to Triclosan (1.32 μM).
2.6. Docking Study
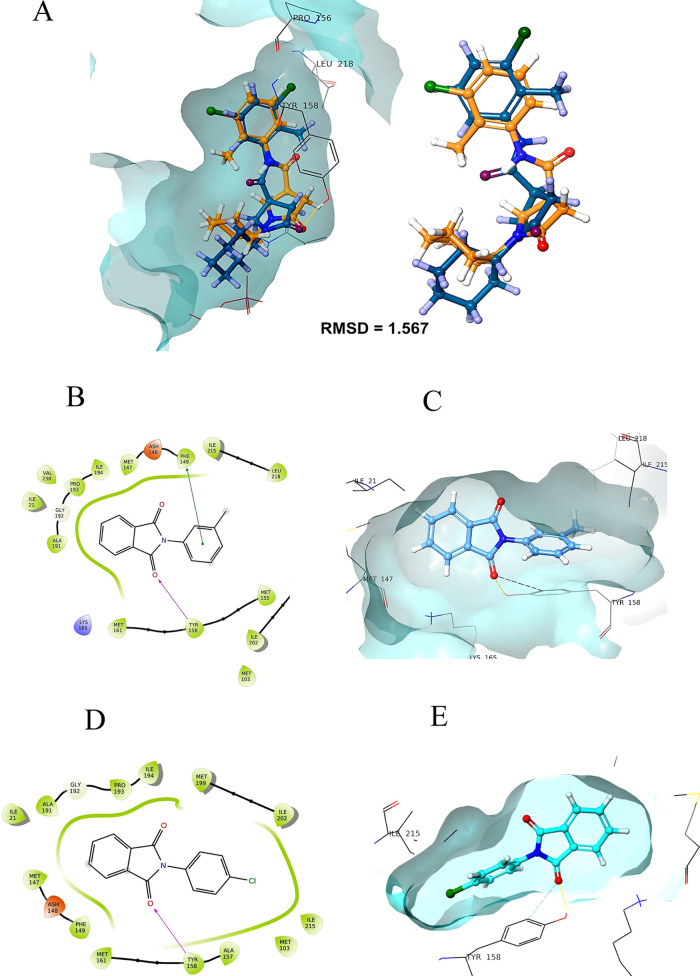
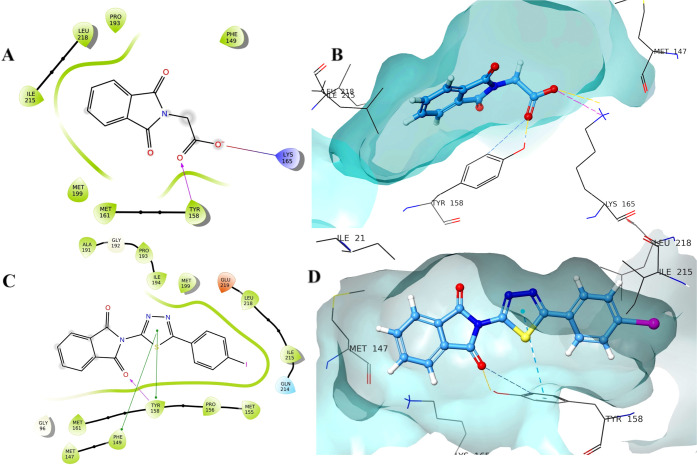
Molecular modeling was used to investigate how the synthesized compounds bind to the active site of 2-trans-enoyl-acyl carrier protein reductase (InhA, PDB entry 2H7I) using the Schrodinger Glide module. It is one of the major enzymes engaged in the fatty acid biosynthesis type II pathway of M. tuberculosis.27 The results of the in vitro study encouraged us to carry out molecular docking studies to recognize the binding interaction of the synthesized compounds within the active site of InhA (Table 6). Docking validation has been first performed by redocking the co-crystalized structure into the active site of the InhA and measuring the root-mean-square deviation (RMSD) of the native co-crystalized ligand with redocked co-crystalized ligand, which was found to be 1.567 (Figure 9A). Overlay images of the docking validation are given in Figure 9A. Docking results demonstrated that synthesized compounds formed the crucial hydrogen-bond interaction with the isoindoline-1,3-dione via carbonyl oxygen. Compound 5 formed a hydrophobic π–π interaction with Phe149, while compound 11 formed two hydrogen-bond interactions with Lys 165 and Tyr 158 (Figures 9B,C and 10A,B). The potent compound of the series (27) forms the hydrogen-bond interaction with the vital Tyr 158 residue via carbonyl oxygen, and the thiadiazol ring was involved in the hydrophobic π–π interaction with Phe 147 and Tyr 158 (Figure 1010C,D). Important residues within the 5 Å periphery of the ligands were Leu 218, Ile 215, Ile 194, Pro 193, Gly 192, Ala 191, Met 161, Tyr 158, Met 155, Phe 149, Asp 148, Met 147, and Met 103.
Table 6. Docking Score of the Synthesized Compounds by the XP-Docking Protocol and Amino Acid Interactions within a Circumference of 5 Å.
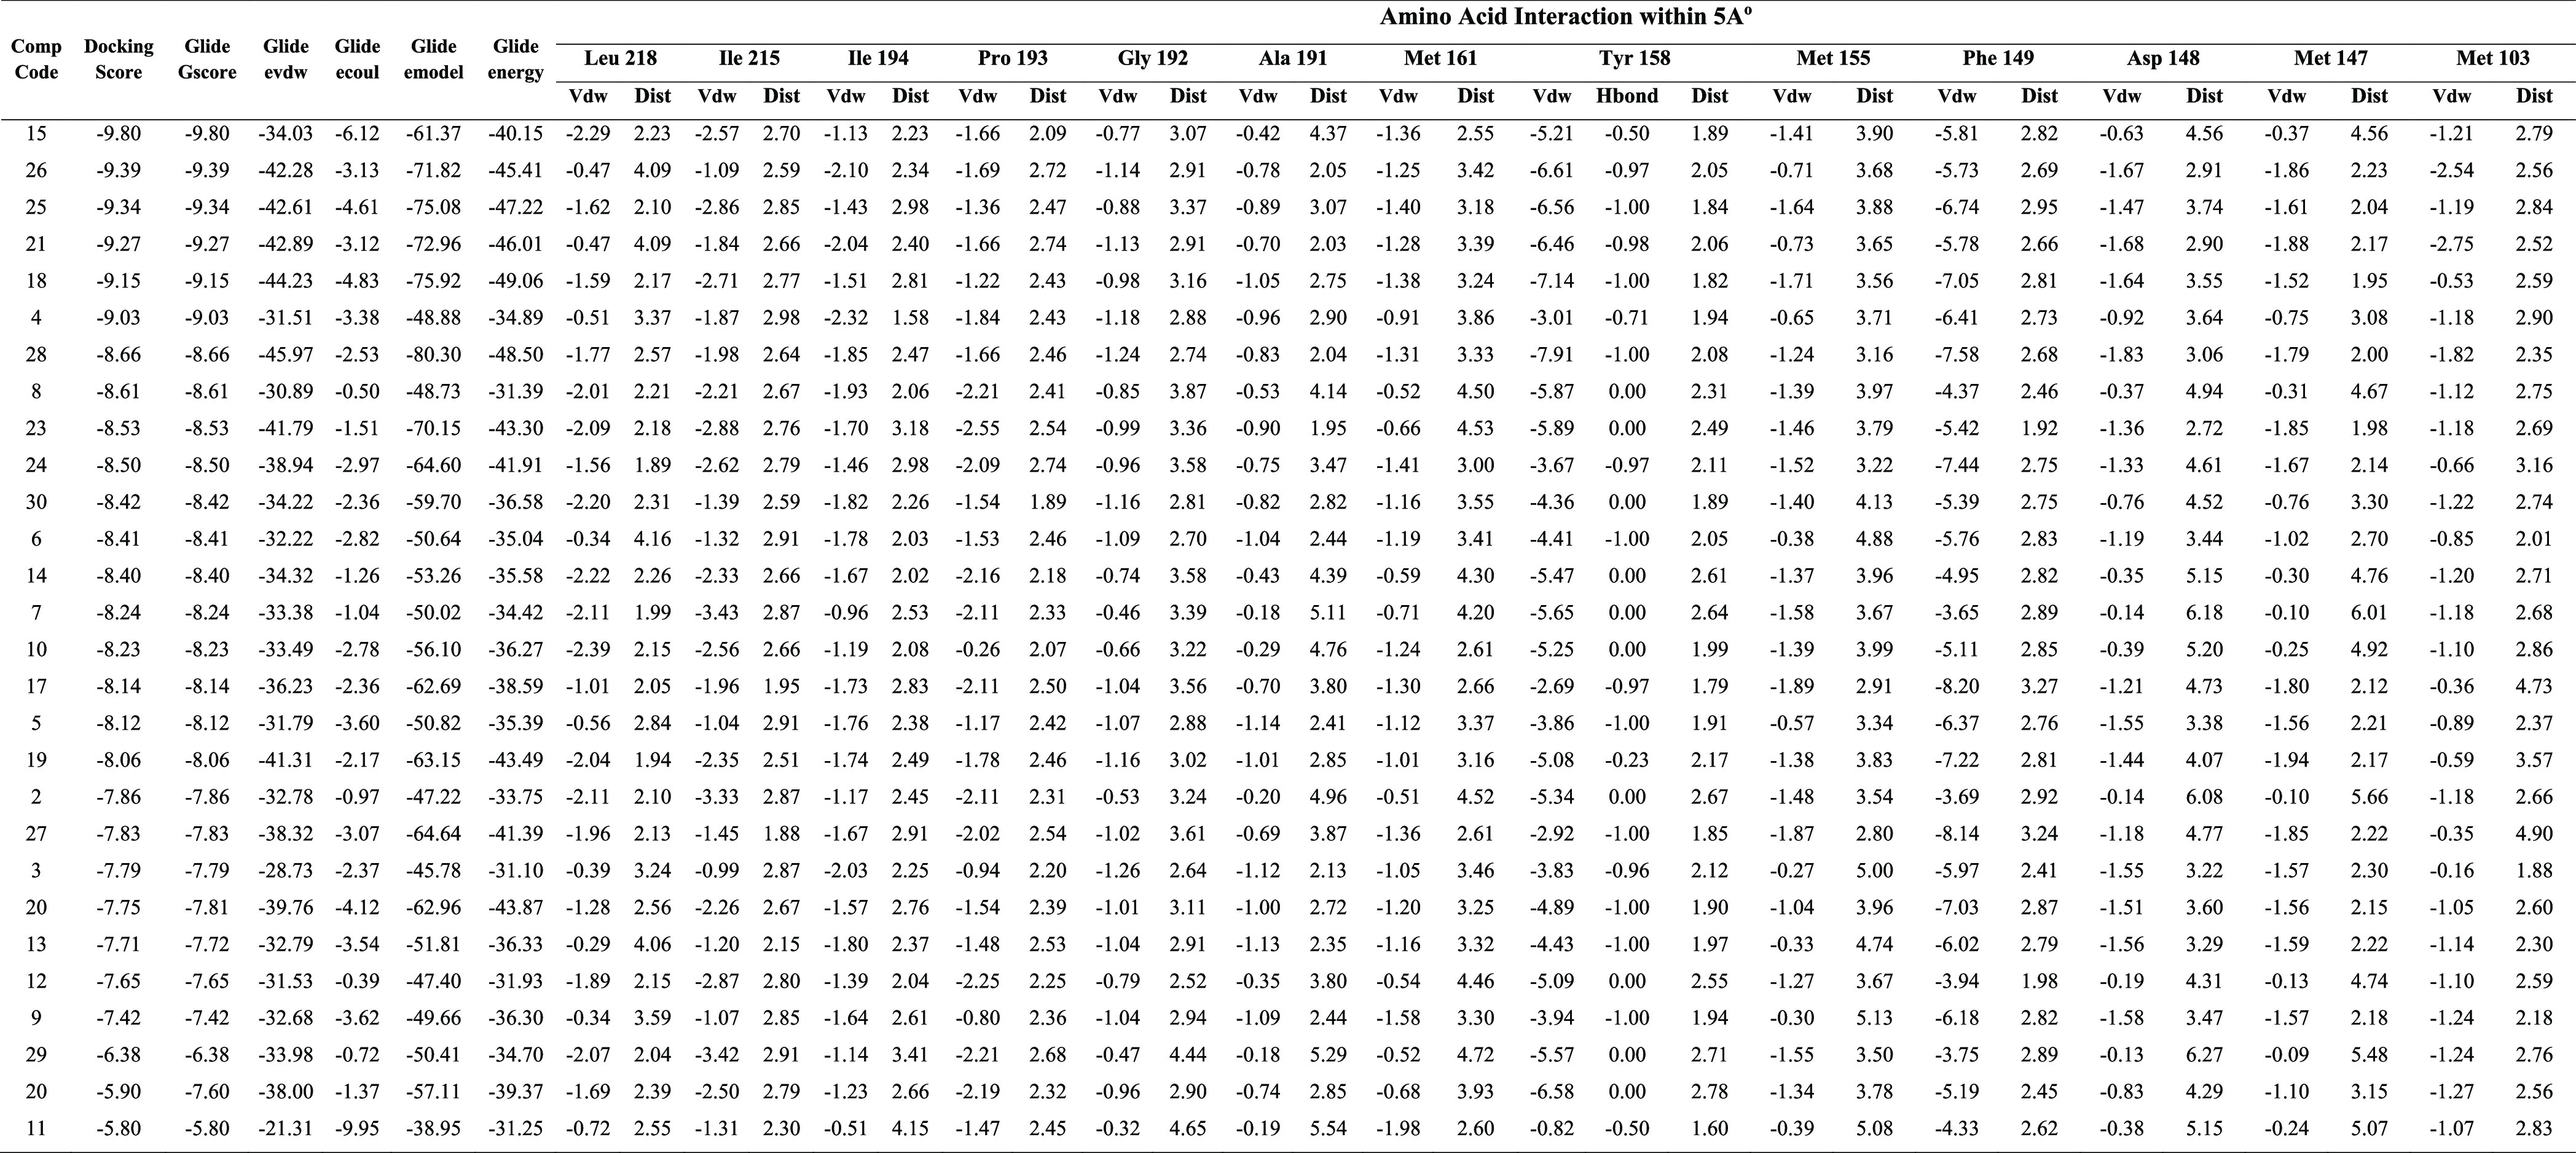
Figure 9.
(A) Docking validation; (B, C) binding pose of compound 5 with InhA; (D, E) binding interaction of compound 6 with InhA.
Figure 10.
(A, B) Binding pose of compound 11 with InhA; (C, D) binding interaction of compound 27 with InhA.
Based on the default parameters of the Prime MMGBSA modules implemented in Schrödinger, binding free energies (ΔG bind) of protein–ligand complexes were calculated using the Glide pose viewer file. To determine the relative binding affinity of ligands to receptors, MMGBSA calculations are used; the lower the value, the stronger the binding affinity (Table 7).28 Among the synthesized compounds, compound 18 (ΔG bind = −78.48 kcal/mol), compound 25 (ΔG bind = −75.42 kcal/mol), compound 26 (ΔG bind = −74.37 kcal/mol), compound 21 (ΔG bind = −73.75 kcal/mol), compound 28 (ΔG bind = −70.77 kcal/mol), compound 30 (ΔG bind = −66.21 kcal/mol), compound 17 (ΔG bind = −65.71 kcal/mol), and compound 27 (ΔG bind = −65.10 kcal/mol) had significant affinity with the enzyme.
Table 7. Binding Free Energies of the Synthesized Compounds (2–30) by MMGBSA.
| compound code | MMGBSA ΔG bind | MMGBSA ΔG bind Coulomb | MMGBSA ΔG bind covalent | MMGBSA ΔG bind Hbond | MMGBSA ΔG bind Lipo | MMGBSA ΔG bind packing | MMGBSA ΔG bind solv GB | MMGBSA ΔG bind vdW |
|---|---|---|---|---|---|---|---|---|
| 18 | –78.48 | –13.55 | –1.99 | –0.63 | –30.35 | –3.32 | 16.42 | –45.07 |
| 25 | –75.42 | –13.55 | –0.77 | –0.62 | –28.24 | –3.27 | 16.34 | –45.3 |
| 26 | –74.37 | –11.2 | –0.71 | –0.64 | –29.34 | –2.68 | 15.26 | –45.06 |
| 21 | –73.75 | –11.36 | –0.75 | –0.64 | –27.03 | –2.67 | 14.78 | –46.09 |
| 28 | –70.77 | –6.24 | 0.98 | –0.63 | –27.27 | –3 | 11.65 | –46.25 |
| 30 | –66.21 | –12.59 | 1.28 | –0.85 | –27.22 | –3.58 | 19.34 | –42.58 |
| 17 | –65.71 | –4.21 | 0.52 | –0.54 | –27.64 | –4.69 | 11.14 | –40.29 |
| 27 | –65.10 | –3.93 | 0.91 | –0.51 | –25.64 | –4.71 | 11.57 | –42.79 |
| 4 | –64.72 | –4.9 | 0.94 | –0.86 | –26.11 | –3.86 | 12.55 | –42.47 |
| 23 | –64.45 | –3.67 | 1.23 | –0.09 | –26.66 | –2.99 | 15.27 | –47.53 |
| 24 | –63 | –4.53 | –0.15 | –0.72 | –27.66 | –3.46 | 14.69 | –41.18 |
| 4 | –59.11 | –7.02 | 4.38 | –0.53 | –22.85 | –2.95 | 9.24 | –39.37 |
| 10 | –58.78 | –3.63 | 2.04 | –0.67 | –23.15 | –3.06 | 10.54 | –40.83 |
| 6 | –57.92 | –6.77 | 3.65 | –0.56 | –22.39 | –2.63 | 9.98 | –39.21 |
| 5 | –57.1 | –8.39 | 3.4 | –0.56 | –23.1 | –2.49 | 13.31 | –39.25 |
| 7 | –56.53 | –6.14 | 1.83 | 0 | –24.53 | –3.06 | 13.6 | –38.24 |
| 15 | –56.03 | 3.09 | 1.28 | –1.02 | –23.04 | –3.07 | 8.91 | –42.18 |
| 13 | –55.86 | –11.42 | 2.54 | –0.56 | –20.69 | –2.45 | 14.22 | –37.5 |
| 9 | –55.55 | –12.67 | 0.84 | –0.56 | –20.51 | –2.63 | 14.47 | –34.48 |
| 3 | –53.02 | –8.63 | 0.51 | –0.52 | –21.74 | –1.82 | 14.08 | –34.9 |
| 29 | –52.32 | –3.99 | –0.24 | –0.1 | –19.59 | –2.97 | 11.27 | –36.69 |
| 8 | –51.96 | –2.48 | 2.07 | 0 | –23.39 | –3.04 | 14.21 | –39.34 |
| 20 | –51.9 | –5.62 | 4.03 | –0.98 | –22.19 | –2.39 | 19.7 | –44.46 |
| 14 | –51.55 | –3.33 | 0.79 | –0.05 | –21.48 | –2.94 | 14.95 | –39.49 |
| 2 | –50.73 | –9.72 | –0.71 | 0 | –21.6 | –2.19 | 13.4 | –29.91 |
| 12 | –50.36 | –5.54 | –0.96 | 0 | –21.56 | –2.21 | 12.39 | –32.49 |
| 20 | –35.46 | –7.72 | 3.65 | –0.98 | –21.93 | –2.33 | 39.39 | –45.54 |
| 11 | –35.18 | –0.9 | 0.91 | –0.79 | –13.81 | –2.57 | 9.13 | –27.15 |
| 20 | –29.33 | –37.99 | 9.63 | –0.55 | –15.9 | –2.02 | 64.12 | –46.62 |
2.7. DFT Reactivity
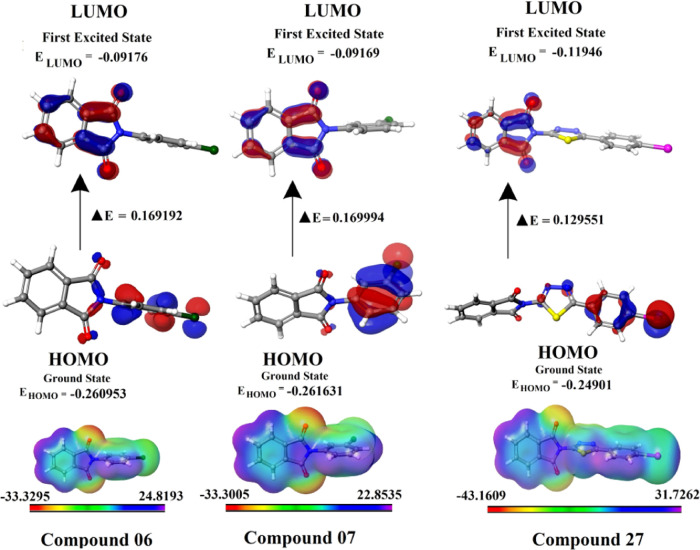
Molecular boundary orbitals play a crucial role in a chemical reaction, and many chemical reactions occur by taking or giving electrons. An electron orbital with the highest energy is called a highest occupied molecular orbital (HOMO), while an electron orbital with the lowest energy is called a lowest unoccupied molecular orbital (LUMO). An electron that is being received by a molecule will fill the lowest-energy empty molecule orbital (LUMO). The lower the energy of this LUMO, the easier it is to receive the electron.29 In the same way, when the electron needs to be given, it will be given from the highest energy filled molecule orbital (HOMO). The higher the energy of the molecule orbital, the higher the tendency for electrons to be given.30 The energy gap between the HOMO and LUMO is a measure of the chemical stability, which is majorly responsible for the chemical and spectroscopic properties of the molecules. An increased HOMO–LUMO energy gap results in a harder and more stable molecule, which is less reactive.31 The compounds 15 (ΔE: 0.040554 eV), 11 (ΔE: 0.082927 eV), 27 (ΔE: 0.129551 eV), 23 (ΔE: 0.149055 eV), 17 (ΔE: 0.151557 eV), 24 (ΔE: 0.152711 eV), 19 (ΔE: 0.152772 eV), and 21 (ΔE: 0.154999 eV) had less energy gap, which indicates their high reactivity and electron transfer capacity (Figure 11 and Table 8). Due to their better interaction with the target protein structure, ligands with high electron transfer capacities may be easier to bind to the protein.
Figure 11.
DFT-based frontier molecular orbital energies calculations of HOMO, LUMO, and maximum electrostatic potential (MESP).
Table 8. DFT-Based Frontier Molecular Orbital (FMO) Energy Calculations of the Synthesized Compounds (2–30).
| cmpd code | EHOMO (eV) | ELUMO (eV) | energy gap/ΔE (eV)a | IP (eV)b | EA (eV)c | χ (eV)d | η (eV)e | s (eV–1)f | μ (eV)g | ω (eV)h | MESP (kcal/mol) |
|---|---|---|---|---|---|---|---|---|---|---|---|
| 2 | –0.261021 | –0.090118 | 0.170903 | 0.261021 | 0.090118 | 0.1755695 | 0.0854515 | 5.851272359 | –0.1755695 | 0.180363419 | –34.07 to 24.26 |
| 4 | –0.264468 | –0.094366 | 0.170102 | 0.264468 | 0.094366 | 0.179417 | 0.085051 | 5.878825646 | –0.179417 | 0.189242101 | –31.72 to 25.6 |
| 5 | –0.253268 | –0.085429 | 0.167839 | 0.253268 | 0.085429 | 0.1693485 | 0.0839195 | 5.958090789 | –0.1693485 | 0.170871576 | –37.05 to 22.7 |
| 6 | –0.260953 | –0.091761 | 0.169192 | 0.260953 | 0.091761 | 0.176357 | 0.084596 | 5.910444938 | -0.176357 | 0.183825426 | –33.31 to 24.71 |
| 7 | –0.261631 | –0.091693 | 0.169938 | 0.261631 | 0.091693 | 0.176662 | 0.084969 | 5.884499053 | –0.176662 | 0.183652051 | –33.58 to 24.63 |
| 8 | –0.250107 | –0.084632 | 0.165475 | 0.250107 | 0.084632 | 0.1673695 | 0.0827375 | 6.043208944 | –0.1673695 | 0.16928569 | –32.94 to 23.09 |
| 9 | –0.249172 | –0.080643 | 0.168529 | 0.249172 | 0.080643 | 0.1649075 | 0.0842645 | 5.933696871 | –0.1649075 | 0.161363822 | –34.9 to 21.54 |
| 10 | –0.28238 | –0.100517 | 0.181863 | 0.28238 | 0.100517 | 0.1914485 | 0.0909315 | 5.498644584 | –0.1914485 | 0.201539225 | –31.71 to 26.35 |
| 17 | –0.251739 | –0.100182 | 0.151557 | 0.251739 | 0.100182 | 0.1759605 | 0.0757785 | 6.598177583 | –0.1759605 | 0.204293418 | –35.11 to 26.97 |
| 18 | –0.254641 | –0.098278 | 0.156363 | 0.254641 | 0.098278 | 0.1764595 | 0.0781815 | 6.395374865 | –0.1764595 | 0.199138896 | –39.44 to 26.19 |
| 19 | –0.250157 | –0.097385 | 0.152772 | 0.250157 | 0.097385 | 0.173771 | 0.076386 | 6.545702092 | –0.173771 | 0.19765638 | –37.38 to 26.06 |
| 20 | –0.243777 | –0.087886 | 0.155891 | 0.243777 | 0.087886 | 0.1658315 | 0.0779455 | 6.414738503 | –0.1658315 | 0.176405863 | –39.59 to 59.53 |
| 21 | –0.247944 | –0.092945 | 0.154999 | 0.247944 | 0.092945 | 0.1704445 | 0.0774995 | 6.451654527 | –0.1704445 | 0.187429129 | –34.83 to 25.14 |
| 23 | –0.245593 | –0.096538 | 0.149055 | 0.245593 | 0.096538 | 0.1710655 | 0.0745275 | 6.708932944 | –0.1710655 | 0.196326224 | –38.1 to 25.71 |
| 24 | –0.251974 | –0.099263 | 0.152711 | 0.251974 | 0.099263 | 0.1756185 | 0.0763555 | 6.548316755 | –0.1756185 | 0.201962253 | –45.97 to 26.72 |
| 26 | –0.258257 | –0.100378 | 0.157879 | 0.258257 | 0.100378 | 0.1793175 | 0.0789395 | 6.333964618 | –0.1793175 | 0.203667149 | –35.39 to 27.01 |
| 27 | –0.24901 | –0.119459 | 0.129551 | 0.24901 | 0.119459 | 0.1842345 | 0.0647755 | 7.71896782 | –0.1842345 | 0.261999915 | –43.36 to 31.93 |
| 28 | –0.265849 | –0.101121 | 0.164728 | 0.265849 | 0.101121 | 0.183485 | 0.082364 | 6.070613375 | –0.183485 | 0.204377794 | –39.21 to 28.86 |
| 29 | –0.27268 | –0.097511 | 0.175169 | 0.27268 | 0.097511 | 0.1850955 | 0.0875845 | 5.708772671 | –0.1850955 | 0.195584516 | –37.91 to 26 |
| 30 | –0.248783 | –0.09323 | 0.155553 | 0.248783 | 0.09323 | 0.1710065 | 0.0777765 | 6.428677043 | –0.1710065 | 0.187995237 | –41.41 to 26.31 |
| 11 | –0.049525 | 0.033402 | 0.082927 | 0.049525 | –0.033402 | 0.0080615 | 0.0414635 | 12.0587987 | –0.0080615 | 0.000783675 | –141.85 to 26.2 |
| 12 | –0.267635 | –0.084162 | 0.183473 | 0.267635 | 0.084162 | 0.1758985 | 0.0917365 | 5.450393246 | –0.1758985 | 0.168636706 | –36.44 to 22.05 |
| 13 | –0.263345 | –0.083954 | 0.179391 | 0.263345 | 0.083954 | 0.1736495 | 0.0896955 | 5.574415662 | –0.1736495 | 0.16809176 | –36.35 to 22.08 |
| 14 | –0.260984 | –0.083605 | 0.177379 | 0.260984 | 0.083605 | 0.1722945 | 0.0886895 | 5.637645945 | –0.1722945 | 0.167355745 | –32.49 to 23.62 |
| 15 | –0.042044 | –0.00149 | 0.040554 | 0.042044 | 0.00149 | 0.021767 | 0.020277 | 24.65848005 | –0.021767 | 0.011683244 | –145.89 to 13.7 |
Energy gap/ΔE = EHOMO – ELUMO.
Ionization potential (IP) = −EHOMO.
Electron affinity (EA) = −ELUMO.
Electronegativity (χ) = (IP + EA)/2.
Chemical hardness (η) = (IP – EA)/2.
Chemical softness (s) = 1/2η.
Chemical potential (μ) = −(IP + EA)/2.
Electrophilic index (ω) = μ2/2η.
2.8. Maximum Electrostatic Potential (MESP)
Maximum electrostatic potential (MESP) maps show the size, charge distribution, and shape of molecules and are known as “potential energy maps or molecular electrostatic potential surfaces”.32 It is an optical method that enables us to understand the charge, electronegativity, molecular polarity, and dipole moment of a compound, as well as provide information regarding the net electrostatic effect generated by the total charge distribution in the molecule. The electron density surface is a color-coded map.32−35 According to these maps, the red regions indicate nucleophilic regions with high electron densities and the green regions indicate electrophilic regions with low electron densities. An orange color has been observed around the carbonyl oxygens of the isoindoline-1,3-dione ring, indicating their nucleophilic nature. The docking study also reciprocated these results, where these carbonyl oxygens acted as hydrogen-bond acceptor, forming a crucial hydrogen bond with the Tyr 158 residue (Figure 11). The blue region around the 2-substitution on isoindoline-1,3-dione indicates their poor electron density (Figure 11), and proportionately, these groups were involved in the hydrophobic interaction with the Phe 149, Leu 218, Ile 215, Gln 214, Met 155, Pro 156, and Met 199 residues in the docking study (Figure 11).
2.9. Chemical Properties Calculation by DFT
HOMO and LUMO boundary orbital energies can be used to calculate chemical properties such as electron affinity (EA), ionization potential (IP), electronegativity (χ), chemical potential (μ), electrophilicity index (ω), softness (s), and hardness (η).32−35 Essentially, ionization potential (IP) is the amount of energy needed to remove an electron from a molecule during the gas phase. A gas-phase molecule’s electron affinity (EA) refers to the amount of energy that is increased when an electron is added. Molecules’ electron-releasing and -accepting capabilities are described by IP and EA values, respectively.32−35 The IPs of all of the synthesized compounds are higher than the EAs, which indicates that their electron-releasing tendency is higher than the electron-accepting one. Electronegativity is the ability of an atom in a molecule to attract electrons. The electronegativity value of all of the synthesized compounds were lower than the IP, which again proved that compounds were electron-releasing (donating)/nucleophilic in nature (Table 8).32−35 Charge transfer inhibition within a molecule is measured by chemical hardness, and molecules with high chemical hardness values cannot have a minimal or nonexistent charge transfer within them. In general, molecules with high energy gaps are hard, nonreactive, stable, and less polarizable, while soft molecules (with lower energy gaps) are highly polarizable.32−35Table 8 indicates that the chemical softness of the molecule is 100 times greater compared to the chemical hardness, which indicates that all of the synthesized compounds are soft in nature. Negative electronegativity, or electronic chemical potential (μ) of the molecule, refers to the tendency for electrons to depart from the equilibrium system. A molecule that has a high electronic chemical potential is less stable or more reactive.32−35 Among the synthesized compounds, compounds 11, 15, 9, 20, 8, and 5 had higher chemical potential compared with other compounds in the series (Table 8).
The electrophilicity index measures a species’ ability to accept electrons (ω).32−35 Comparison of the IP values (electron-releasing tendency) of all synthesized compounds with electrophilic index (electron-accepting tendency) indicates that the IPs of all synthesized compounds are higher than the electrophilic index and that compounds are more nucleophilic in nature (Table 8).
2.10. Molecular Dynamic (MD) Simulation Study
Since protein rigid crystal structure was used in molecular docking studies, molecular dynamic simulation was performed to explore the stability of the bound conformation of compound 27 within the binding cavity of InhA to investigate ligand–protein complex interactions in the dynamic behavior. We simulated the systems up to 100 ns to explore the compound 27–InhA complex conformational stability and its changes. In this study, a 100 ns period was employed, which is enough time for the configurations of InhA Cα atoms in complex with compound 27.
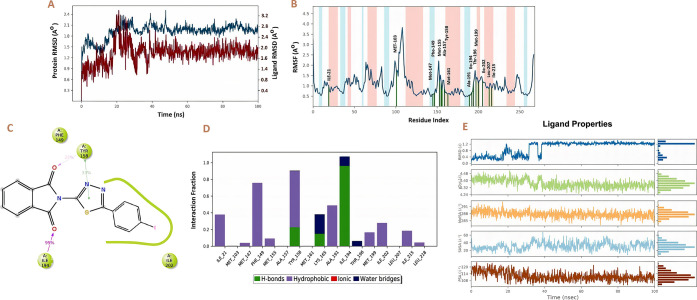
The RMSD values of the protein backbone were used to calculate the stability of the protein–ligand complex throughout the dynamic simulation, as shown in Figure 12A. It is anticipated that the lower RMSD value during the simulation reveals that the protein–ligand complex is more stable. In contrast, the higher the RMSD value, the less stable is the protein–ligand complex.37 The ligand RMSDs initially fluctuated between 20 and 30 ns due to the equilibration, after which the RMSD remained stable till the end of the simulation. It was observed that the protein had minor RMSD fluctuations during the 20–30 ns, followed by constant stability with an RMSD of 2.1 Å for the remaining time of simulation.
Figure 12.
(A) Protein (InhA) and ligand (compound 27) RMSD; (B) root-mean-square fluctuation (RMSF) of the InhA; (C) different interactions of compound 27 during 100 ns with InhA; (D) interaction fraction of different residues with compound 27 during 100 ns; and (E) ligand (compound 27) properties.
The “root-mean-square fluctuation (RMSF)” values for each amino acid residue in the protein backbone are illustrated in Figure 12B. In this graph, the peaks represent the fluctuation of each amino acid residue over the entire simulation. It implies that higher RMSF values represent higher residue flexibility, whereas lower RMSF values reflect less residue flexibility and better system stability. The α-helical and β-strand areas (secondary structural components) are depicted in red and blue, and loop area is present in the white in the background of the RMSF plot. The α-helical and β-strand are usually stiffer than the unstructured portion of the protein; hence, they fluctuate less than loop areas. A slight fluctuation of the residues in the active site and main chain fluctuated indicated that the conformational change was minimal, implying that the reported lead compound was firmly bound within the cavity of the target protein binding pocket.38 For 100 ns, the MD simulation of the compound 27–InhA complex was monitored and analyzed. As seen in Figure 12B, it is clear that there were no significant fluctuations in amino acid residues after the binding of compound 27 to the active site. The RMSF value of protein backbone residues in the catalytic domain is in the range of 0.5–3.5 Å. During the 100 ns time of simulation, compound 27 has contacted with the 15 amino acids of Ile 215, Leu 207, Ile 202, Met 199, Thr 196, Ile 194, Ala 191, Met 161, Tyr 158, Ala 157, Met 155, Phe 149, Met 147, Met 103, and Ile 21 (Figure 12B). Protein–ligand contract analysis shows that the residues Ile 194 exhibited 95% and Tyr 158 showed 22% hydrogen-bond interactions with the carbonyl oxygen of compound 27. Apart from this, Tyr 158 was also involved in the hydrophobic interaction with the 1,3,4-thiadiazole ring of compound 27 (Figure 12C,D).
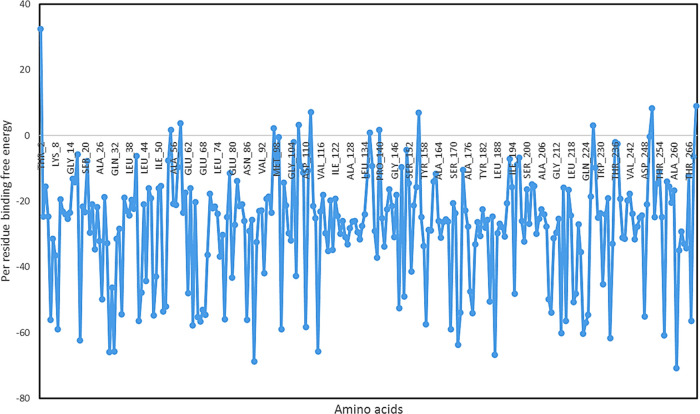
We have also analyzed the ligand properties of the simulated compound 27, and its RMSD was observed to be below 1.2 Å. Radius of gyration (RG) is a measure of the extendness of the ligand; after 40 ns, RG was stable and found to be less than 4.40 Å. Ligand has not formed any kind of intramolecular hydrogen bonding with the receptor during the 100 ns simulation. Molecular surface area (MolSA) corresponds to the van der Waals surface area, and it was found to be 288–291 Å2, indicating the polar nature of the ligand. Solvent-accessible surface area (SASA) is the area of a molecule that is accessible to water molecules, and it was observed to be between 40 and 50 Å2. The polar surface area (PSA) of a molecule is the solvent-accessible surface area contributed only by oxygen and nitrogen. It was found to be 114–120 Å2 due to the enrichment of the compound 27 with oxygen and nitrogen (Figure 12E). We have also calculated the per residue binding free energy when the ligand–receptor complex was stable during the simulation (at 99 ns frame), and Asp-261 (−70.85), Asp 89 (−70.85), Asn 187 (−70.85), Gln 30 (−70.85), Gln 32(−70.85), Asp 115 (−70.85), Asn 172 (−70.85), Asp 18 (−70.85), Asp 234 (−70.85), Asp 256 (−70.85), Asp 223 (−70.85), and Gln 214 (−70.85) had the lowest per residue energy, indicating their active involvement in the interaction with compound 27 (Figure 13).
Figure 13.
Per residue binding free energy of the InhA with compound 27.
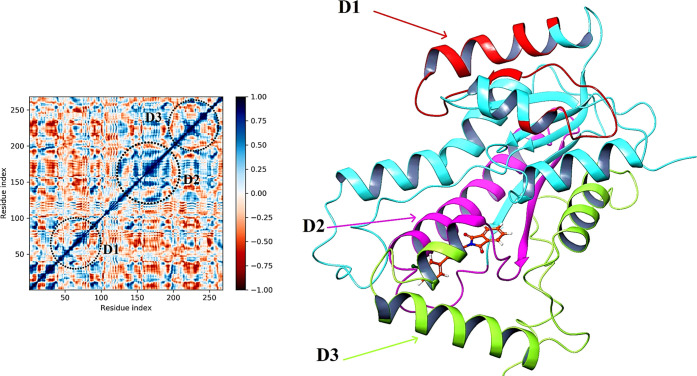
InhA macrodomain protein after binding with compound 27 is studied through the dynamic cross-correlation matrix (DCCM) analysis to determine the correlated mobility of structural domains. All pairwise correlation coefficient calculations were performed to calculate the DCCM. In the graphical representation, correlation values range from −1 to +1, and the colors reflect the intensity of the motion between residues, ranging from red to blue. Blue colors indicate a positive (+1/complete) correlation, white colors indicate no correlation, and red colors indicate a negative (−1/complete anti) correlation. Using the correlation scores on the central mean line (blue), we identified three separate blocks where amino acid movement was highly correlated.39
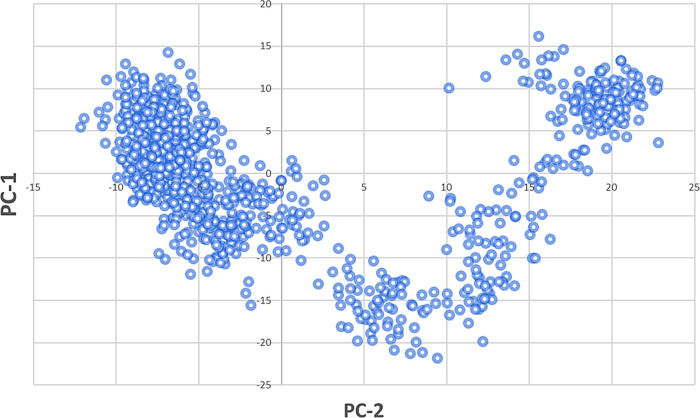
Domain D1 (InhA) has the highest cross-correlation of residues composed of 50–100 residues embedded into one helix, distinct β-sheets, and an extended loop (red), while domain D2 (InhA) contains 140–190 residues rooted in one helix, distinct β-sheets, and an extended loop (pink). The D3 domain extends from 220 to 250 residues, spanning the three helixes and one extended loop (green). These residues in D1, D2, and D3 domains are highly correlated and are in good agreement with the RMSF of the C-α backbone of macrodomain proteins in the compound 27-bound state, with moderate to fewer fluctuations of respective amino acid residues (Figure 14). The trajectory-derived MD simulations were also analyzed with principal component analysis (PCA) to study the conformational distribution during simulation time and the large-scale collective motions of the protein interacting with ligands.39 In all of the complexes, phase space projection of protein motion along PC1 and PC2 revealed a uniform distribution of conformations through the simulations (Figure 15).
Figure 14.
DCCM analysis of compound 27 (D1, D2, and D3 are highly correlated residues of the InhA).
Figure 15.
PCA of compound 27.
To perform the postdynamic MMGBSA analysis, the 10 frames of the MD simulation of compound 27 were produced at intervals of 10 ns each. Compound 27 shows a postdynamic binding free energy of −78.96 kcal/mol (ΔG bind average of 10 frames) (Table 9).
Table 9. Postsimulation Binding Free Energy Calculation of Compound 27.
| complex detail | MMGBSA ΔG bind | MMGBSA ΔG bind Coulomb | MMGBSA ΔG bind Hbond | MMGBSA ΔG bind Lipo | MMGBSA ΔG bind packing | MMGBSA ΔG bind vdW |
|---|---|---|---|---|---|---|
| at 10 ns | –87.78 | –17.009 | –0.974 | –29.699 | –4.086 | –52.885 |
| at 20 ns | –85.41 | –18.424 | –1.015 | –27.228 | –2.497 | –53.606 |
| at 30 ns | –77.70 | –10.923 | –0.685 | –28.180 | –4.794 | –51.507 |
| at 40 ns | –82.74 | –12.108 | –0.692 | –28.834 | –4.796 | –50.101 |
| at 50 ns | –69.77 | –9.402 | –0.465 | –25.391 | –4.264 | –45.616 |
| at 60 ns | –74.29 | –6.559 | –0.463 | –26.718 | –4.0120 | –48.644 |
| at 70 ns | –73.11 | –12.185 | –0.597 | –25.710 | –4.781 | –45.266 |
| at 80 ns | –77.25 | –10.276 | –0.640 | –25.762 | –3.735 | –49.196 |
| at 90 ns | –81.46 | –9.165 | –0.515 | –27.805 | –3.642 | –52.073 |
| at 100 ns | –80.123 | –10.553 | –0.578 | –26.822 | –4.312 | –50.787 |
| average | –78.9690 | –11.660 | –0.662 | –27.215 | –4.092 | –49.968 |
3. Conclusions
In conclusion, isoindoline-1,3-dione derivatives (2–30) were synthesized and evaluated for their antimycobacterial activity against the H37Rv strain. Among the synthesized compounds, compound 27 was the most potent compound of the series, with an IC50 value of 18 μM. The InhA inhibitory (IC50) activity of compound 27 was 8.65 μM in comparison to Triclosan (1.32 μM). We used the DFT/B3LYP method to correlate experimental IR, 1H NMR, and 13C NMR spectral data with theoretical quantum-mechanics-based computational ones, and a significant co-relationship was observed. SAR study suggests that 1,3,4-thiadiazols are more potent than the substituted anilines at the second position of the 2-isoindoline-1,3-dione. Iodophenyl was more potent than chloro-, bromo-, and fluorophenyl among the halo-phenyl-substituted 1,3,4-thiadiazols at the second position. A docking study demonstrated that synthesized compounds formed the crucial hydrogen-bond interaction with the Tyr 158 residue of the InhA enzyme.
The DFT study of the synthesized compounds explained the reactivity of the compounds, and compounds 15, 11, 27, 23, 17, 24, 19, and 21 had less energy gap, which indicates their high reactivity and electron transfer capacity. The MESP calculation has elaborated on the electrophilic and nucleophilic sites available on the compounds. An orange color has been observed around the carbonyl oxygens of the isoindoline-1,3-dione ring, indicating their nucleophilic nature. The docking study also reciprocated these results, where these carbonyl oxygens acted as a hydrogen-bond acceptor, forming a crucial hydrogen bond with the Tyr 158 residue. An MD simulation study of the compound 27–InhA complex indicated that the ligand remained stable in the InhA pocket for 100 ns. The stability of the compound 27–InhA complex was further validated by postdynamic MMGBSA, DCCM, and PCA, which validated the stability of the compound 27–InhA complex.
4. Experimental Section
Unless otherwise specified, all reagents used in the studies were of commercial analytical quality (Sigma-Aldrich and Spectrochem Pvt. Ltd.). All reactions’ progress was monitored through precoated silica gel GF254 thin-layer chromatography, and spots were visualized under UV light at 254 or 365 nm. Different solvent systems, hexane/ethyl acetate (6:4 and 7:3), toluene/ethyl acetate/formic acid (5:4:1 v/v/v) benzene/acetone (7:3 and 9:1 v/v), and chloroform/methanol (9:1 v/v), were used to run chromatography. The melting points of the synthesized compounds were determined using one-end open capillary tubes on an Analab Scientific Instruments melting-point apparatus. The NMR spectra were recorded in dimethyl sulfoxide (DMSO)-d6 at Chandigarh Punjab University using a Bruker Avance-II 400 NMR spectrometer running at 400 MHz with TMS as an internal standard. Chemical shifts are presented in ppm units relative to TMS. Clog P values were calculated using CHEMDRAW ultra 8.0 software.
4.1. General Procedure for the Synthesis of Isoindoline-1,3-dione Derivatives
Phthalic anhydride (0.1 mol) and the primary amino-containing compounds (0.1 mol) were mixed with 50–75 mL of glacial acetic acid. The mixture was refluxed for 3 h and diluted with water to obtain the title compounds. It is further recrystallized with ethanol, followed by column chromatography to get the pure product.
4.1.1. 2-(4-Fluorophenyl)isoindoline-1,3-dione (2)
Yield: 64%, mp: 132–136 °C; IR νmax (KBr pellets): 3058.14 (CH stretch), 1762.52 (C=O cyclic amide), 1219.05 (C–F) cm–1; 1H NMR (400 MHz, DMSO-d6): δ 7.40–8.10 (m, 8H, Ar–CH) ppm; 13C NMR (DMSO-d6) δ 167.45, 162.53, 133.34, 132.35, 130.53, 128.46, 123.23, 114.24 ppm; LCMS: purity: 100%; RT: 6.106 (254 λ); m/z: 241.00 [M+].
4.1.2. 2-(o-Tolyl)isoindoline-1,3-dione (3)
Yield: 74%, mp: 166–172 °C. IR νmax (KBr pellets): 3021.14 (Aro. CH stretch), 2881.34 (Ali. CH stretch), 1756.11 (C=O cyclic amide) cm–1; 1H NMR (400 MHz, DMSO-d6): δ 7.10–8.12 (m, 8H, Ar–CH), 2.42 (s, 3H, CH3) ppm; 13C NMR (DMSO-d6) 165.24, 136.54, 134.54, 132.42, 131.35, 130.46, 130.10, 129.53, 125.93, 122.83, 18.42 ppm; LCMS: purity: 100%; RT: 5.991 (254 λ); m/z: 237.9 [M+].
4.1.3. 2-(3-Chloro-4-fluorophenyl)isoindoline-1,3-dione (4)
Yield: 71%, mp: 182–188 °C. IR νmax (KBr pellets): 3033.16 (CH stretch), 1753 (C=O cyclic amide), 1053.17 (C–F), 596.02 (C–Cl) cm–1; 1H NMR (400 MHz, DMSO-d6): 7.20–8.12 (m, 7H, Ar–CH) ppm; 13C NMR (DMSO-d6) δ 168.23, 154.44, 136.34, 134.35, 130.17, 129.42, 126.45, 123.56, 120.93, 112.56 ppm; LCMS: purity: 100%; RT: 6.424 (254 λ); m/z: 275.1 [M+] and 277.5 [M + 2].
4.1.4. 2-(m-Tolyl)isoindoline-1,3-dione (5)
Yield: 66%, mp: 168–172 °C. IR νmax (KBr pellets): 3058.09 (Aro. CH stretch), 2845.23 (Ali. CH stretch), 1740.04 (C=O cyclic amide) cm–1; 1H NMR (400 MHz, DMSO-d6): 6.95–7.83 (m, 8H, Ar–CH), 2.41 (s, 3H, CH3) ppm; 13C NMR (DMSO-d6) δ 165.20, 138.36, 131.73, 132.56, 130.85, 129.25, 128.85, 125.14, 124.65, 122.68, 20.43 ppm; LCMS: purity: 100%; RT: 6.154 (254 λ); m/z: 237.8 [M+].
4.1.5. 2-(4-Chlorophenyl)isoindoline-1,3-dione (6)
Yield: 66%, mp: 190–194 °C. IR νmax (KBr pellets): 3050.08 (Aro. CH stretch), 1745.05 (C=O cyclic amide), 749.08 (C–Cl) cm–1; 1H NMR (400 MHz, DMSO-d6): 7.45–8.14 (m, 8H, Ar–CH); 13C NMR (DMSO-d6) δ 167.45, 137.45, 136.67, 135.34, 130.99, 130.12, 129.60, 125.67 ppm; LCMS: purity: 100%; RT: 6.349 (254 λ); m/z: 257.8 [M+] and 259.7 [M + 2].
4.1.6. 2-(3-Chlorophenyl)isoindoline-1,3-dione (7)
Yield: 62%, mp: 176–182 °C. Yield: 66%, mp: 190–194 C. IR νmax (KBr pellets): 3042.23 (CH stretch), 1749.11 (C=O cyclic amide), 785.88 (C–Cl) cm–1; 1H NMR (400 MHz, DMSO-d6): 7.120–8.21 (m, 8H, Ar–CH); 13C NMR (DMSO-d6) δ 167.53, 134.5, 133.76, 134.1, 133.2, 132.45, 130.3, 127.9, 126.2, 124.23 ppm; purity: 100%; RT: 6.351 (254 λ); m/z: 257.9 [M+] and 259.2 [M + 2].
4.1.7. 2-(4-Bromophenyl)isoindoline-1,3-dione (8)
Yield: 64%, mp: 252–254 °C. IR νmax (KBr pellets): 3142.06 (CH stretch), 1739.97 (C=O cyclic amide), 650.04 (C–Br) cm–1; 1H NMR (400 MHz, DMSO-d6): 7.12–8.18 (m, 8H, Ar–CH); 13C NMR (DMSO-d6) δ 168.87, 138.45, 136.24, 132.77, 130.12, 128.23, 126.73, 122.34 ppm; LCMS: purity: 100%; RT: 6.459 (254 λ); m/z: 302.4 [M+] and 304.9 [M + 2].
4.1.8. 2-(2-Boromophenyl)isoindoline-1,3-dione (9)
Yield: 67%, mp: 242–250 °C. IR νmax (KBr pellets): 3123.24 (CH stretch), 1723.34 (C=O cyclic amide), 665.04 (C–Br) cm–1; 1H NMR (400 MHz, DMSO-d6): 7.15–8.21 (m, 8H, Ar–CH); 13C NMR (DMSO-d6) δ 169.34, 142.55, 137.45, 134.24, 132.88, 131.38, 123.38, 125.73, 122.66 ppm; LCMS: purity: 100%; RT: 5.936 (254 λ); m/z: 302.9 [M+] and 304.6 [M + 2].
4.1.9. 2-(3-Nitrophenyl)isoindoline-1,3-dione (10)
Yield: 70%, mp: 278–284 °C. IR νmax (KBr pellets): 3058 (CH stretch), 1699 (C=O cyclic amide) cm–1; 1H NMR (400 MHz, DMSO-d6): 6.85–8.48 (m, 8H, Ar–CH); 13C NMR (DMSO-d6) δ 168.65, 148.15, 134.34, 134.22, 133.56, 132.24, 130.23, 123.73, 121.54, 118.75 ppm; LCMS: purity: 100%; RT: 5.960 (254 λ); m/z: 268.1 [M+].
4.1.10. 2-(1,3-Dioxoisoindolin-2-yl)acetic Acid (11)
Yield: 66%, mp: 204–206 °C. IR νmax (KBr pellets): IR νmax (KBr pellets): 3598.91 (OH stretch), 3123.59 (CH stretch), 1726.00 (C=O cyclic amide) cm–1; 1H NMR (400 MHz, DMSO-d6): 12.12 (s, 1H, COOH), 7.24–7.99 (m, 4H, Ar–H), 4.32 (s, 1H, Ali–CH2) ppm; 13C NMR (DMSO-d6) 170.32, 169.34, 138.76, 132.35, 126.42, 40.45 ppm; LCMS: purity: 100%; RT: 3.379 (254 λ); m/z: 205.1 [M+].
4.1.11. 2-(4-Methylpyridin-2-yl)isoindoline-1,3-dione (12)
Yield: 64%, mp: 172–184 °C. IR νmax (KBr pellets): 3051.13 (Aro. CH stretch), 2951.19 (Ali. CH stretch), 1755.95 (C=O) cm–1; 1H NMR (400 MHz, DMSO-d6): 7.34–8.16 (s, 7H, Ar–H), 2.31 (s, 3H, CH3) ppm; 13C NMR (DMSO-d6) 164.34, 151.51, 148.53, 147.23, 132.34, 130.23, 122.73, 121.06, 112.73, 21.73 ppm; LCMS: purity: 100%; RT: 4.726 (254 λ); m/z: 238.4 [M+].
4.1.12. 2-(5-Methylpyridin-2-yl)isoindoline-1,3-dione (13)
Yield: 67%, mp: 166–170 °C. IR νmax (KBr pellets): 3039.91 (CH stretch), 1736.38 (C=O) cm–1; 1H NMR (400 MHz, DMSO-d6): 7.83–8.24 (m, 7H, Ar–H), 2.39 (s, 3H, CH3) ppm; 13C NMR (DMSO-d6) 165.45, 152.48, 145.37, 137.54, 134.45, 132.12, 123.43, 123.50, 109.16, 18.40 ppm; LCMS: purity: 100%; RT: 4.853 (254 λ); m/z: 238.6 [M+].
4.1.13. 2-(5-Bromopyridin-2-yl)isoindoline-1,3-dione (14)
Yield: 70%, mp: 162–166 °C. IR νmax (KBr pellets): 3064.99 (CH stretch), 1718.63 (C=O), 715.61 (C–Br) cm–1; 1H NMR (400 MHz, DMSO-d6): 7.55–8.79 (7H, Ar–H) ppm; 13C NMR (DMSO-d6) 166.04, 150.08, 144.76, 141.20, 134.98, 131.26, 124.42, 123.70, 119.98 ppm; LCMS: purity: 100%; RT: 3.990 (254 λ); m/z: 303.1 [M+] and 305.2 [M + 2].
4.1.14. 5-(1,3-Dioxoisoindolin-2-yl)-2-methylbenzoic Acid (15)
Yield: 68%, mp: 240–248 °C. IR νmax (KBr pellets): 3592.95 (OH stretch), 3077.53 (CH stretch), 1722.95 (C=O) cm–1; 1H NMR (400 MHz, DMSO-d6): 11.12 (s, 1H, COOH), 6.98–8.30 (m, 7H, Ar–CH), 2.51 (s, 3H, CH3); 13C NMR (DMSO-d6) δ 172.53, 168.24, 138.34, 134.34, 132.43, 132.24, 131.39, 129.66, 129.10, 123.23, 119.83, 22.12 ppm; LCMS: purity: 100%; RT: 5.625 (254 λ); m/z: 283.0 [M+].
4.1.15. 2-(5-(4-Methoxyphenyl)-1,3,4-thiadiazol-2-yl)isoindoline-1,3-dione (16)
Yield: 69%, mp: 228–232 °C. IR νmax (KBr pellets): 2987.90 (Aro. CH stretch), 2836.42 (Ali. CH stretch), 1702 (C=O cyclic amide) cm;–11H NMR (400 MHz, DMSO-d6): 7.00–8.23 (m, 8H, Ar–CH), 3.84 (s, 1H, OCH3); 13C NMR (DMSO-d6) 175.64, 173.42, 168.23, 160.62, 134.34, 132.24, 122.73, 128.45, 125.85, 114.83, 55.89 ppm; LCMS: purity: 100%; RT: 6.048 (254 λ); m/z: 337.4 [M+].
4.1.16. 2-(5-(4-Chorophenyl)-1,3,4-thiadiazol-2-yl)isoindoline-1,3-dione (17)
Yield: 66%, mp: 272–280 °C. IR νmax (KBr pellets): 2924.18 (CH stretch), 1774.00 (C=O cyclic amide), 757.09 (C–Cl) cm–1; 1H NMR (400 MHz, DMSO-d6): 7.52–8.32 (m, 8H, Ar–CH); 13C NMR (DMSO-d6) 176.34, 174.63, 166.53, 135.42, 134.43, 132.24, 131.66, 124.73, 129.63, 128.29 ppm; LCMS: purity: 100%; RT: 6.550 (254 λ); m/z: 341.8 [M]+ and 343.7 [M + 2].
4.1.17. 2-(5-(2-Chorophenyl)-1,3,4-thiadiazol-2-yl)isoindoline-1,3-dione (18)
Yield: 68%, mp: 228–232 °C. IR νmax (KBr pellets): 3024.13 (CH stretch), 1778.32 (C=O cyclic amide), 748.20 (C–Cl) cm–1; 1H NMR (400 MHz, DMSO-d6): 7.30–8.24 (m, 8H, Ar–CH); 13C NMR (DMSO-d6) 176.89, 174.78, 167.35, 136.92, 134.34, 132.24, 132.34, 130.12, 129.34, 128.79, 127.38, 124.24 ppm; LCMS: purity: 100%; RT: 6.354 (254 λ); m/z: 341.7 [M+] and 343.9 [M + 2].
4.1.18. 2-((5-Phenyl)-1,3,4-thiadiazol-2-yl)isoindoline-1,3-dione (19)
Yield: 74%, mp: 216–220 °C. IR νmax (KBr pellets): 3152 (CH stretch), 1779.03 (C=O cyclic amide) cm–1; 1H NMR (400 MHz, DMSO-d6): ppm 7.23–8.19 (m, 9H, Ar–CH); 13C NMR (DMSO-d6), 174.12, 173.68, 166.24, 133.46, 133.65, 132.24, 130.12, 129.34, 128.23, 122.12 ppm; LCMS: purity: 95%; RT: 6.007 (254 λ); m/z: 307.5 [M+].
4.1.19. N-(1,3-Dioxoisoindoline-2-yl)-4-hydroxybenzamide (20)
Yield: 74%, mp: 288–299 °C. IR νmax (KBr pellets): 3455.45 (OH stretch), 3054.38 (CH stretch), 1725.77 (C=O cyclic amide) cm–1; 1H NMR (400 MHz, DMSO-d6): 11.21 (s, 1H, NH), 9.72 (s, 1H, OH), 6.80–8.01 (m, 8H, Ar–CH) ppm; 13C NMR (DMSO-d6) 169.43, 164.18, 160.92, 134.24, 132.75, 128.29, 124.65, 124.73, 116.12 ppm; LCMS: purity: 94%; RT: 1.575 (254 λ); m/z: 282.6 [M+].
4.1.20. 2-(5-(3-Bromophenyl)-1,3,4-thiadiazol-2-yl)isoindoline-1,3-dione (21)
Yield: 62%, mp: 292–294 °C. IR νmax (KBr pellets): 2924.18 (CH stretch), 1767.80 (C=O cyclic amide), 712.72 (C–Br) cm–1; 1H NMR (400 MHz, DMSO-d6): 7.43–8.25 (m, 8H, Ar–CH) ppm; 13C NMR (DMSO-d6) 177.35, 174.60, 168.32, 135.74, 134.34, 132.24, 133.61, 131.47, 129.49, 128.61, 124.73, 122.32 ppm; LCMS: purity: 100%; RT: 6.648 (254 λ); m/z: 386.7 [M+] and 388.5 [M + 2].
4.1.21. 2-(5-(2-Methoxyphenyl)-1,3,4-thiadiazol-2-yl)isoindoline-1,3-dione (22)
Yield: 69%, mp: 246–252 °C. IR νmax (KBr pellets): 3031.90 (CH stretch), 1752.86 (C=O cyclic amide), 1252.81 (C–O) cm–1; 1H NMR (400 MHz, DMSO-d6) ppm: 7.10–8.43 (m, 8H, Ar–CH), 3.92 (s, 1H, O–CH3); 13C NMR (DMSO-d6) 174.14, 173.10, 167.43, 157.43, 135.45, 132.67, 129.12, 128.56, 122.73, 122.16, 121.65, 115.56 ppm; LCMS: purity: 100%; RT: 6.042 (254 λ); m/z: 337.6 [M+].
4.1.22. 2-(5-(m-Tolyl)-1,3,4-thiadiazol-2-yl)isoindoline-1,3-dione (23)
Yield: 67%, mp: 148–150 °C. IR νmax (KBr pellets): 2923.22 (Aro. CH stretch), 2853.78 (Ali. CH stretch), 1767.80 (C=O cyclic amide) cm–1; 1H NMR (400 MHz, DMSO-d6) ppm: 7.08–8.18 (m, 8H, Ar–CH), 2.51 (s, 1H, CH3); 13C NMR (DMSO-d6) 172.43, 170.42, 165.12, 138.92, 132.34, 130.24, 133.34, 130.44, 129.51, 129.05, 127.93, 122.73,21.46 ppm; LCMS: purity: 100%; RT: 6.408 (254 λ); m/z: 321.6 [M+].
4.1.23. 2-(5-Benzyl--1,3,4-thiadiazol-2-yl)isoindoline-1,3-dione (24)
Yield: 71%, mp: 176–184 °C. IR νmax (KBr pellets): 3005 (Aro. CH stretch), 2854.74 (Ali. CH stretch), 1727.67 (C=O cyclic amide) cm–1; 1H NMR (400 MHz, DMSO-d6) ppm: 7.20–8.38 (m, 9H, Ar–CH), 3.86 (s, 1H, CH2); 13C NMR (DMSO-d6) 172.34, 166.53, 160.80, 136.62, 135.34, 132.24, 129.60, 128.76, 125.87, 122.73 ppm; LCMS: purity: 100%; RT: 5.817 (254 λ); m/z: 321.90 [M+].
4.1.24. 2-(5-(2-Fluorophenyl)-1,3,4-thiadiazol-2-yl)isoindoline-1,3-dione (25)
Yield: 75%, mp: 222–232 °C. IR νmax (KBr pellets): 3089.71 (CH stretch), 1748.67 (C=O cyclic amide), 1219.05 (C–F) cm–1; 1H NMR (400 MHz, DMSO-d6) 7.25–8.30 (m, 8H, Ar–CH) ppm; 13C NMR (DMSO-d6) 174.54, 173.35, 167.74, 158.33, 138.34, 134.24, 130.31, 129.41, 124.82, 123.68, 123.34, 114.34 ppm; LCMS: purity: 95%; RT: 6.143 (254 λ); m/z: 325.4 [M+].
4.1.25. 2-(5-(3-Chlorophenyl)-1,3,4-thiadiazol-2-yl)isoindoline-1,3-dione (26)
Yield: 73%, mp: 242–250 °C. IR νmax (KBr pellets): 3124.00 (CH stretch), 1756.32 (C=O cyclic amide), 755.23 (C–Cl) cm–1; 1H NMR (400 MHz, DMSO-d6): 7.12–8.19 (m, 8H, Ar–CH); 13C NMR (DMSO-d6) 175.46, 173.45, 168.24, 134.29, 134.48, 134.34, 132.24, 129.55, 129.12, 128.26, 127.45, 122.12 ppm; LCMS: purity: 97%; RT: 6.545 (254 λ); m/z: 341.8 [M+] and 343.9 [M + 2].
4.1.26. 2-(5-(4-Iodophenyl)-1,3,4-thiadiazol-2-yl)isoindoline-1,3-dione (27)
Yield: 78%, mp: 292–298 °C. IR νmax (KBr pellets): 2923.22 (CH stretch), 1749.91 (C=O cyclic amide), 693.43 (C–I) cm–1; 1H NMR (400 MHz, DMSO-d6): 7.38–8.43 (m, 8H, Ar–CH); 13C NMR (DMSO-d6) 176.34, 174.24, 167.12, 138.14, 134.34, 132.44, 132.24, 129.61, 123.78, 98.42 ppm; LCMS: purity: 100%; RT: 6.818 (254 λ); m/z: 433.4 [M+].
4.1.27. 2-(5-(2-Nitrophenyl)-1,3,4-thiadiazol-2-yl)isoindoline-1,3-dione (28)
Yield: 64%, mp: 232–238 °C. IR νmax (KBr pellets): 3096.82 (CH stretch), 1755.35 (C=O cyclic amide) cm–1; 1H NMR (400 MHz, DMSO-d6): 7.14–8.12 (m, 8H, Ar–CH) ppm; 13C NMR (DMSO-d6) 177.46, 174.35, 167.35, 146.92, 135.34, 134.54, 132.57, 131.63, 129.64, 128.54, 125.34,124.42 ppm; LCMS: purity: 94%; RT: 5.775 (254 λ); m/z: 352.4 [M+].
4.1.28. 2-(5-Methyl-1,3,4-thiadiazol-2-yl)isoindolin-1,3-dione (29)
Yield: 74%, mp: 220–226 °C. IR νmax (KBr pellets): IR νmax (KBr pellets): 2981.08 (Aro. CH stretch), 2869.21 (Ali. CH stretch), 1769 (C=O cyclic amide) cm–1; 1H (400 MHz, DMSO-d6): 7.61–8.14 (m, 4H, Ar–H), 2.42 (s, 3H, CH3) ppm; 13C NMR (DMSO-d6) 172.53, 166.64, 142.37, 136.46, 132.24, 122.73, 19.10 ppm; LCMS: purity: 100%; RT: 4.120 (254 λ); m/z: 245.3 [M+].
4.1.29. 2-(4-Methyl-2-oxo-2H-chromen-6-yl)isoindoline-1,3-dione (30)
Yield: 72%, mp: 302–308 °C. IR νmax (KBr pellets): IR νmax (KBr pellets): 3232.12 (Aro. CH stretch), 2935.20 (Ali. CH stretch), 1725.17 (C=O cyclic amide) cm–1; 1H NMR (400 MHz, DMSO-d6): 6.45–8.28 (m, 8H, Ar–H), 2.18 (s, 3H, CH3) ppm; 13C NMR (DMSO-d6) 167.53, 160.58, 152.57, 149.15, 136.34, 132.10, 129.54, 127.74, 122.23, 121.25, 116.94, 116.44, 112.65, 18.64 ppm; LCMS: purity: 100%; RT: 5.642 (254 λ); m/z: 305.9 [M+].
4.2. Geometry Optimization
The ground state (GS) of the tilted compound was optimized at the DFT level of theory using the hybrid functionals B3LYP in combination with the basis set 6-311**.40,41
4.3. DFT-Based Calculations of the Fourier Transform Infrared (FT-IR) and NMR Spectra
A wide range of molecular properties can be predicted with DFT calculations, including equilibrium structure, charge distribution, FT-IR, and NMR spectral correlation. The hybrid functional B3LYP/6-311** was used to derive the tilted compound’s (compound 14) FT-IR and NMR spectra. Using the GIAO approach, the predicted chemical shifts for 1H and 13C NMR have been calculated using the isotropic chemical shielding constants. The isotropic shielding constants were used to compute the isotropic chemical shifts, δcal, in relation to tetramethylsilane (TMS).17,18
4.4. Biological Activity
4.4.1. In Vitro Determination of Antimycobacterial Activity
The in vitro antimycobacterial activity of synthesized compounds was determined as per the previously reported procedures.24−26
4.4.2. Evaluation of In Vitro Cytotoxicity
The cytotoxicity of compounds was calculated by monitoring THP-1 cell viability after 3 days in the existence of test compounds, as described in the report.24−26
4.5. Docking Study
The molecular docking Glide module (Schrodinger, Inc.) has been used for ligand docking against the Mtb enoyl reductase (InhA). The X-ray crystallographic structure of InhA protein cognate with 1-cyclohexyl-5-oxo-N-phenylpyrrolidine-3-carboxamide was retrieved from the Protein Databank, with accession ID 2H7I. The retrieved protein structure was prepared using the “protein preparation wizard” panel. Using prime during the stages of preprocessing, bond ordering was assigned, missing hydrogen was added, disulfide bonds were formed, and missing side chains and loops were modified. In the final refinement stage, the OPLS3 force field has been used to reach complete energetic optimization, with the RMSD of heavy atoms set to 0.3 Å. All synthesized isoindoline-1,3-dione derivatives (2–30), three-dimensional (3D) structures with relevant chiralities, were prepared with the LigPrep panel. The ionization state of each ligand structure was established at a physiological pH of 7.2 ± 0.2. By centralizing the cognate ligand in the crystal structure and using the default box dimension, the active side grid was assigned. Finally, the molecular docking study was carried out using Schrodinger’s glide, in which the ready minimum-energy 3D structure of the ligands and the receptor grid file were loaded into Maestro’s work area and the ligands were docked using standard precision (SP) docking methodology.42,43
4.6. Binding Free Energy Calculation Using the Prime MMGBSA Approach
The Schrodinger software’s Prime module has been used to calculate the binding free energies of synthesized compounds in complex with Mtb InhA in terms of the MMGBSA method. The Prim measures the binding free energies of bound complexes using multiple nonpolar solvent-accessible surface area and executable van der Waals interactions, as well as advanced OPLS-2005 force field, nonpolar solvation, molecular mechanics, and polar solvation energies. A Glide pose viewer file of the docked complex was used for this calculation. The MMGBSA calculations are used to measure ligands’ relative binding affinity to the target receptor, and it infers that the stronger the binding affinity, the lower the value.42,43
4.7. Density Functional Theory (DFT) Calculations
DFT calculations were performed to determine the electronic molecular attributes, specifically the frontier molecular orbital (FMOs) density fields and molecular electrostatic maps, that can help to understand biological activity and molecular characteristics. The hybrid functional B3LYP/6-311G** level has been used to compute the HOMO and LUMO of the synthesized compounds.40,41 It also provides definitions of fundamental concepts about the stability and reactivity of molecular structures.40,41 In quantum-chemical calculations, the energies of the FMOs, HOMO, and LUMO are accessible to deliver information about electron affinity (EA), ionization potential (IP), electrophilicity index (ω), electronegativity (χ), softness (s), hardness (η), and chemical potential (μ) to extrapolate the relationships among energy, structure, and reactivity characteristics of target materials.40,41
The IP and EA were calculated as follows
where E stands for energy
The global reactivity descriptors were calculated using Koopman’s theorem,35 which is represented by the equations below
4.8. Molecular Dynamics Simulation
The best docked conformation of compound 27 in complex with Mtb InhA has been further evaluated for thermodynamic behavior and stability using molecular dynamics simulation (MD).45 The docked complex was solvated using a single point charge (SPC) as a water model. Proper counterions (Na+ and Cl–) and the orthorhombic cell were provided to achieve electroneutrality in the system using Desmond’s system builder.46 The prepared system was minimized with a maximum of 2000 iterations and a gradient convergence cutoff of 1 kJ/mol. Before running the MD simulation, a six-stage NPT (N = number of atoms, P = pressure, and T = temperature) ensemble default relaxation procedure was executed.47
The ensemble was then submitted to a 100 ns molecular dynamics simulation, with snapshots taken every 100 ps. Finally, the ligand–protein complex binding confirmation and stability from MD trajectories were analyzed using Desmond’s simulation interaction diagram (SID).47 The binding free energy of the receptor and ligand during simulation is computed by the python script thermal mmgbsa.py. The average binding free energy was calculated using the 0–100 ns MD simulation trajectory as input during the MMGBSA calculation.45−47
4.9. InhA Inhibition Assay
The InhA inhibition assay was performed as per the reported protocol.48 In short, stock solutions of compound 27 were formulated in DMSO so that the final concentration of this co-solvent was constant at 5% v/v for all kinetic reactions at a final volume of 1 mL. As previously described, kinetic assays were implemented employing trans-2-dodecenoyl-coenzyme A (DDCoA) and wild-type InhA. Reactions were performed at 25 °C in an aqueous buffer (30 mM PIPES and 150 mM NaCl pH 6.8) containing an additional 250 μM cofactor (NADH), a 50 μM substrate (DDCoA), and a compound tested. Reactions began with the addition of InhA (100 nM final) and NADH oxidation followed at 340 nm. Triclosan has been used as a positive control device.
Acknowledgments
The authors thank the Indian Council of Medical Research (ICMR)—Government of India (Grant ISRM/12 (11)/2019) for funding the project. N.D. is thankful to the University Grants Commission, New Delhi, for awarding the BSR Faculty Fellowship 2019 (F18-1/2011, BSR) and financial assistance.
Supporting Information Available
The Supporting Information is available free of charge at https://pubs.acs.org/doi/10.1021/acsomega.2c01981.
LCMS of compounds 2–11, 14, 15, 21, 24, and 30 and per residue binding free energy during 100 ns time (Table 1S) (PDF)
The authors declare no competing financial interest.
Supplementary Material
References
- World Health Organization. Tuberculosis. https://www.who.int/news-room/fact-sheets/detail/tuberculosis (accessed 2022-04-01).
- MacNeil A.; Glaziou P.; Sismanidis C.; Maloney S.; Floyd K. Global Epidemiology of Tuberculosis and Progress Toward Achieving Global Targets - 2017. Morb. Mortal. Wkly. Rep. 2019, 68, 263–266. 10.15585/mmwr.mm6811a3. [DOI] [PMC free article] [PubMed] [Google Scholar]
- Shinde Y.; Ahmad I.; Surana S.; Patel H. The Mur Enzymes Chink in the Armour of Mycobacterium tuberculosis cell wall. Eur. J. Med. Chem. 2021, 222, 113568 10.1016/j.ejmech.2021.113568. [DOI] [PubMed] [Google Scholar]
- Chakraborty S.; Rhee K. Y. Tuberculosis Drug Development: History and Evolution of the Mechanism-Based Paradigm. Cold Spring Harbor Perspect. Med. 2015, 5, a021147 10.1101/cshperspect.a021147. [DOI] [PMC free article] [PubMed] [Google Scholar]
- Sotgiu G.; Centis R.; D’ambrosio L.; Migliori G. B. Tuberculosis treatment and drug regimens. Cold Spring Harbor Perspect. Med. 2015, 5, a017822 10.1101/cshperspect.a017822. [DOI] [PMC free article] [PubMed] [Google Scholar]
- Andries K.; Verhasselt P.; Guillemont J.; Göhlmann H. W.; Neefs J. M.; Winkler H.; Van Gestel J.; Timmerman P.; Zhu M.; Lee E.; Williams P.; de Chaffoy D.; Huitric E.; Hoffner S.; Cambau E.; Truffot-Pernot C.; Lounis N.; Jarlier V. A diarylquinoline drug active on the ATP synthase of Mycobacterium tuberculosis. Science 2005, 307, 223–227. 10.1126/science.1106753. [DOI] [PubMed] [Google Scholar]
- Alffenaar J. W.; van Altena R.; Harmelink I. M.; Filguera P.; Molenaar E.; Wessels A. M.; van Soolingen D.; Kosterink J. G.; Uges D. R.; van der Werf T. S. Comparison of the pharmacokinetics of two dosage regimens of linezolid in multidrug-resistant and extensively drug-resistant tuberculosis patients. Clin. Pharmacokinet. 2010, 49, 559–565. 10.2165/11532080-000000000-00000. [DOI] [PubMed] [Google Scholar]
- Arentz M.; Pavlinac P.; Kimerling M. E.; Horne D. J.; Falzon D.; Schünemann H. J.; Royce S.; Dheda K.; Walson J. L. ART study group. Use of anti-retroviral therapy in tuberculosis patients on second-line anti-TB regimens: a systematic review. PLoS One 2012, 7, e47370 10.1371/journal.pone.0047370. [DOI] [PMC free article] [PubMed] [Google Scholar]
- Akgün H.; Karamelekoğlu I.; Berk B.; Kurnaz I.; Sarıbıyık G.; Oktem S.; Kocagöz T. Synthesis and antimycobacterial activity of some phthalimide derivatives. Bioorg. Med. Chem. 2012, 20, 4149–4154. 10.1016/j.bmc.2012.04.060. [DOI] [PubMed] [Google Scholar]
- Othman I. M. M.; Gad-Elkareem M. A. M.; El-Naggar M.; Nossier E. S.; Amr A. E. E. Novel phthalimide based analogues: design, synthesis, biological evaluation, and molecular docking studies. J. Enzyme Inhib. Med. Chem. 2019, 34, 1259–1270. 10.1080/14756366.2019.1637861. [DOI] [PMC free article] [PubMed] [Google Scholar]
- Arif R.; Pattan S. N.; Ansari I. A.; Shahid M.; Irfan M.; Alam S.; Abid M.; Rahisuddin Synthesis, molecular docking and DNA binding studies of phthalimide- based cop per(II) complex: In vitro antibacterial, hemolytic and antioxidant assessment. J. Mol. Struct. 2018, 1160, 142–153. 10.1016/j.molstruc.2018.02.008. [DOI] [Google Scholar]
- Orzeszko A.; Kamińska B.; Orzeszko G.; Starościak B. J. Synthesis and antimicrobial activity of new adamantane derivatives. Il Farmaco 2000, 55, 619–623. 10.1016/S0014-827X(00)00075-6. [DOI] [PubMed] [Google Scholar]
- Elumalai K.; Ali M. A.; Elumalai M.; Eluri K.; Srinivasan S.; Srinivasan S.; Mohanthic S. K. Synthesis, characterization and biological evaluation of acetazolamide, cycloserine and isoniazid condensed some novel phthalimide derivatives. Int. J. Chem. Anal. Sci. 2013, 4, 57–61. 10.1016/j.ijcas.2013.04.004. [DOI] [Google Scholar]
- Phatak P. S.; Bakale R. D.; Dhumal S. T.; Dahiwade L. K.; Choudhari P. B.; Krishna V. S.; Sriram D.; Haval K. P. Synthesis, antitubercular evaluation and molecular docking studies of phthalimide bearing 1,2,3-triazoles. Synth. Commun. 2019, 49, 2017–2028. 10.1080/00397911.2019.1614630. [DOI] [Google Scholar]
- Paraiso W. K.; Alea G. Synthesis and in vitro antimycobacterial activity determination of phthalimide derivatives. Manila J. Sci. 2013, 8, 27–34. [Google Scholar]
- Santos J. L.; Yamasaki P. R.; Chin C. M.; Takashi C. H.; Pavan F. R.; Leite C. Q. Synthesis and in vitro anti Mycobacterium tuberculosis activity of a series of phthalimide derivatives. Bioorg. Med. Chem. 2009, 17, 3795–3799. 10.1016/j.bmc.2009.04.042. [DOI] [PubMed] [Google Scholar]
- Jiang S.; Jin Y.; Yan R.; Wang Z. Detailed structural study of cyclic anticancer drug Lorlatinib: spectroscopic and stereostructure investigation (IR, ECD and NMR) using density functional theory approach. J. Mol. Struct. 2021, 1225, 129295 10.1016/j.molstruc.2020.129295. [DOI] [Google Scholar]
- Salihović M.; Pazalja M.; Halilovic S. S.; Veljovic E.; Mahmutovic-Dizdarevi I.; Roca S.; Novakovic I.; Trifunovic S. Synthesis, characterization, antimicrobial activity and DFT study of some novel Schiff bases. J. Mol. Struct. 2021, 1241, 130670 10.1016/j.molstruc.2021.130670. [DOI] [Google Scholar]
- Hesterkamp T.; Barker J.; Davenport A.; Whittaker M. Fragment based drug discovery using fluorescence correlation: spectroscopy techniques: challenges and solutions. Curr. Top. Med. Chem. 2007, 7, 1582–1591. 10.2174/156802607782341064. [DOI] [PubMed] [Google Scholar]
- Clark J.High Resolution Proton NMR Spectra. https://chem.libretexts.org/Bookshelves/Physical_and_Theoretical_Chemistry_Textbook_Maps/Supplemental_Modules_(Physical_and_Theoretical_Chemistry)/Spectroscopy/Magnetic_Resonance_Spectroscopies/Nuclear_Magnetic_Resonance/NMR%3A_Structural_Assignment/High_Resolution_Proton_NMR_Spectra (accessed 2022-04-01).
- Muthu S.; Porchelvi E. E. FTIR, FT-RAMAN, NMR, spectra, normal co-ordinate analysis, NBO, NLO and DFT calculation of N,N-diethyl-4-methylpiperazine-1-carboxamide molecule. Spectrochim. Acta, Part A 2013, 115, 275–286. 10.1016/j.saa.2013.06.011. [DOI] [PubMed] [Google Scholar]
- Muthu S.; Ramachandran G. Spectroscopic studies (FTIR, FT-Raman and UV-Visible), normal coordinate analysis, NBO analysis, first order hyper polarizability, HOMO and LUMO analysis of (1R)-N-(Prop-2-yn-1-yl)-2,3-dihydro-1H-inden-1-amine molecule by ab initio HF and density functional methods. Spectrochim. Acta, Part A 2014, 121, 394–403. 10.1016/j.saa.2013.10.093. [DOI] [PubMed] [Google Scholar]
- Mathammal R.; Monisha N. R.; Yasaswini S.; Krishnakumar V. Molecular structure, vibrational analysis (FT-IR, FT-Raman), NMR, UV, NBO and HOMO-LUMO analysis of N,N-Diphenyl Formamide based on DFT calculations. Spectrochim. Acta, Part A 2015, 139, 521–532. 10.1016/j.saa.2014.11.057. [DOI] [PubMed] [Google Scholar]
- Karunanidhi S.; Chandrasekaran B.; Karpoormath R.; Patel H. M.; Kayamba F.; Merugu S. R.; Kumar V.; Dhawan S.; Kushwaha B.; Mahlalela M. C. Novel thiomorpholine tethered isatin hydrazones as potential inhibitors of resistant Mycobacterium tuberculosis. Bioorg. Chem. 2021, 115, 105133 10.1016/j.bioorg.2021.105133. [DOI] [PubMed] [Google Scholar]
- Patel H. M.; Palkar M.; Karpoormath R. Exploring MDR-TB Inhibitory Potential of 4-Aminoquinazolines as Mycobacterium tuberculosisN-Acetylglucosamine-1-Phosphate Uridyltransferase (GlmUMTB) Inhibitors. Chem. Biodiversity 2020, 17, e2000237 10.1002/cbdv.202000237. [DOI] [PubMed] [Google Scholar]
- Patel H.; Chaudhari K.; Jain P.; Surana S. Synthesis and in vitro antitubercular activity of pyridine analouges against the resistant Mycobacterium tuberculosis. Bioorg. Chem. 2020, 102, 104099 10.1016/j.bioorg.2020.104099. [DOI] [PubMed] [Google Scholar]
- Takayama K.; Wang C.; Besra G. S. Pathway to synthesis and processing of mycolic acids in Mycobacterium tuberculosis. Clin. Microbiol. Rev. 2005, 18, 81–101. 10.1128/CMR.18.1.81-101.2005. [DOI] [PMC free article] [PubMed] [Google Scholar]
- Patel H.; Ahmad I.; Jadhav H.; Pawara R.; Lokwani D.; Surana S. Investigating the Impact of Different Acrylamide (Electrophilic Warhead) on Osimertinib’s Pharmacological Spectrum by Molecular Mechanic and Quantum Mechanic Approach. Comb. Chem. High Throughput Screening 2021, 25, 149–166. 10.2174/1386207323666201204125524. [DOI] [PubMed] [Google Scholar]
- Salihović M.; Pazalja M.; Halilovic S. S.; Veljovic E.; Mahmutovic-Dizdarevi I.; Roca S.; Novakovic I.; Trifunovic S. Synthesis, characterization, antimicrobial activity and DFT study of some novel Schiff bases. J. Mol. Struct. 2021, 1241, 130670 10.1016/j.molstruc.2021.130670. [DOI] [Google Scholar]
- Jiang S.; Jin Y.; Yan R.; Wang Z. Detailed structural study of cyclic anticancer drug Lorlatinib: spectroscopic and stereostructure investigation (IR, ECD and NMR) using density functional theory approach. J. Mol. Struct. 2021, 1225, 129295 10.1016/j.molstruc.2020.129295. [DOI] [Google Scholar]
- Salihović M.; Pazalja M.; Halilovic S. S.; Veljovic E.; Mahmutovic-Dizdarevi′ I.; Roca S.; Novakovic I.; Trifunovic S. Synthesis, characterization, antimicrobial activity and DFT study of some novel Schiff bases. J. Mol. Struct. 2021, 1241, 130670 10.1016/j.molstruc.2021.130670. [DOI] [Google Scholar]
- Khalid M.; Ullah M. A.; Adeel M.; Khan M. U.; Tahir M. N.; Braga A. A. C. Synthesis, crystal structure analysis, spectral IR, UV–Vis, NMR assessments, electronic and nonlinear optical properties of potent quinoline based derivatives: Interplay of experimental and DFT study. J. Saudi Chem. Soc. 2019, 23, 546–560. 10.1016/j.jscs.2018.09.006. [DOI] [Google Scholar]
- Qi L.; Li M. C.; Bai J. C.; Ren Y. H.; Ma H. X. In vitro antifungal activities, molecular docking, and DFT studies of 4-amine-3-hydrazino-5-mercapto-1,2,4-triazole derivatives. Bioorg. Med. Chem. Lett. 2021, 40, 127902 10.1016/j.bmcl.2021.127902. [DOI] [PubMed] [Google Scholar]
- Choudhary V. K.; Bhatt A. K.; Dash D.; Sharma N. DFT calculations on molecular structures, HOMO–LUMO study, reactivity descriptors and spectral analyses of newly synthesized diorganotin(IV) 2-chloridophenylacetohydroxamate complexes. J. Comput. Chem. 2019, 40, 2354–2363. 10.1002/jcc.26012. [DOI] [PubMed] [Google Scholar]
- Govindarajan M.; Karabacak M.; Periandy S.; Tanuja D. Spectroscopic (FT-IR, FT-Raman, UV and NMR) investigation and NLO, HOMO-LUMO, NBO analysis of organic 2,4,5-trichloroaniline. Spectrochim. Acta, Part A 2012, 97, 231–245. 10.1016/j.saa.2012.06.014. [DOI] [PubMed] [Google Scholar]
- Ahmad I.; Akand S. R.; Shaikh M.; Pawara R.; Manjula S. N.; Patel H. Synthesis, molecular modelling study of the methaqualone analogues as anti-convulsant agent with improved cognition activity and minimized neurotoxicity. J. Mol. Struct. 2022, 1251, 131972 10.1016/j.molstruc.2021.131972. [DOI] [Google Scholar]
- Pawara R.; Ahmad I.; Nayak D.; Wagh S.; Wadkar A.; Ansari A.; Belamkar S.; Surana S.; Kundu C. N.; Patil C.; Patel H. Novel, selective acrylamide linked quinazolines for the treatment of double mutant EGFR-L858R/T790M Non-Small-Cell lung cancer (NSCLC). Bioorg. Chem. 2021, 115, 105234 10.1016/j.bioorg.2021.105234. [DOI] [PubMed] [Google Scholar]
- Ayipo Y. O.; Yahaya S. N.; Babamale H. F.; Ahmad I.; Patel H.; Mordi M. N. β-Carboline alkaloids induce structural plasticity and inhibition of SARS-CoV-2 nsp3 macrodomain more potently than remdesivir metabolite GS-441524: computational approach. Turk. J. Biol. 2021, 45, 503–517. 10.3906/biy-2106-64. [DOI] [PMC free article] [PubMed] [Google Scholar]
- Momany F. A.; Appell M.; Willett J. L.; Bosma W. B. B3LYP/6-311++G** geometry-optimization study of pentahydrates of α- and β-d-glucopyranose. Carbohydr. Res. 2005, 340, 1638–1655. 10.1016/j.carres.2005.04.020. [DOI] [PubMed] [Google Scholar]
- Appell M.; Willett J. L.; Momany F. A. DFT study of alpha- and beta-D-mannopyranose at the B3LYP/6-311++G** level. Carbohydr. Res. 2005, 340, 459–468. 10.1016/j.carres.2004.12.010. [DOI] [PubMed] [Google Scholar]
- Pawara R.; Ahmad I.; Surana S.; Patel H. Computational identification of 2,4-disubstituted amino-pyrimidines as L858R/T790M-EGFR double mutant inhibitors using pharmacophore mapping, molecular docking, binding free energy calculation, DFT study and molecular dynamic simulation. In Silico Pharmacol. 2021, 9, 54 10.1007/s40203-021-00113-x. [DOI] [PMC free article] [PubMed] [Google Scholar]
- Ahmad I.; Jadhav H.; Shinde Y.; Jagtap V.; Girase R.; Patel H. Optimizing Bedaquiline for cardiotoxicity by structure based virtual screening, DFT analysis and molecular dynamic simulation studies to identify selective MDR-TB inhibitors. In Silico Pharmacol. 2021, 9, 23 10.1007/s40203-021-00086-x. [DOI] [PMC free article] [PubMed] [Google Scholar]
- Patel H.; Pawara R.; Pawara K.; Ahmed F.; Shirkhedkar A.; Surana S. A structural insight of bedaquiline for the cardiotoxicity and hepatotoxicity. Tuberculosis 2019, 117, 79–84. 10.1016/j.tube.2019.06.005. [DOI] [PubMed] [Google Scholar]
- Lee H. Y.; Cho D. Y.; Ahmad I.; Patel H. M.; Kim M. J.; Jung J. G.; Jeong E. H.; Haque M. A.; Cho K. M. Mining of a novel esterase (est3S) gene from a cow rumen metagenomic library with organosphosphorus insecticides degrading capability: Catalytic insights by site directed mutations, docking, and molecular dynamic simulations. Int. J. Biol. Macromol. 2021, 190, 441–455. 10.1016/j.ijbiomac.2021.08.224. [DOI] [PubMed] [Google Scholar]
- Ahmad I.; Kumar D.; Patel H. Computational investigation of phytochemicals from Withania somnifera (Indian ginseng/ashwagandha) as plausible inhibitors of GluN2B-containing NMDA receptors. J. Biomol. Struct. Dyn. 2021, 10, 1–13. 10.1080/07391102.2021.1905553. [DOI] [PubMed] [Google Scholar]
- Chollet A.; Mori G.; Menendez C.; Rodriguez F.; Fabing I.; Pasca M. R.; Madacki J.; Kordulakova J.; Constant P.; Quemard A.; Bernardes-Génisson V.; Lherbet C.; Baltas M. Design, synthesis and evaluation of new GEQ derivatives as inhibitors of InhA enzyme and Mycobacterium tuberculosis growth. Eur. J. Med. Chem. 2015, 101, 218–235. 10.1016/j.ejmech.2015.06.035. [DOI] [PubMed] [Google Scholar]
Associated Data
This section collects any data citations, data availability statements, or supplementary materials included in this article.


