
Figure 7.
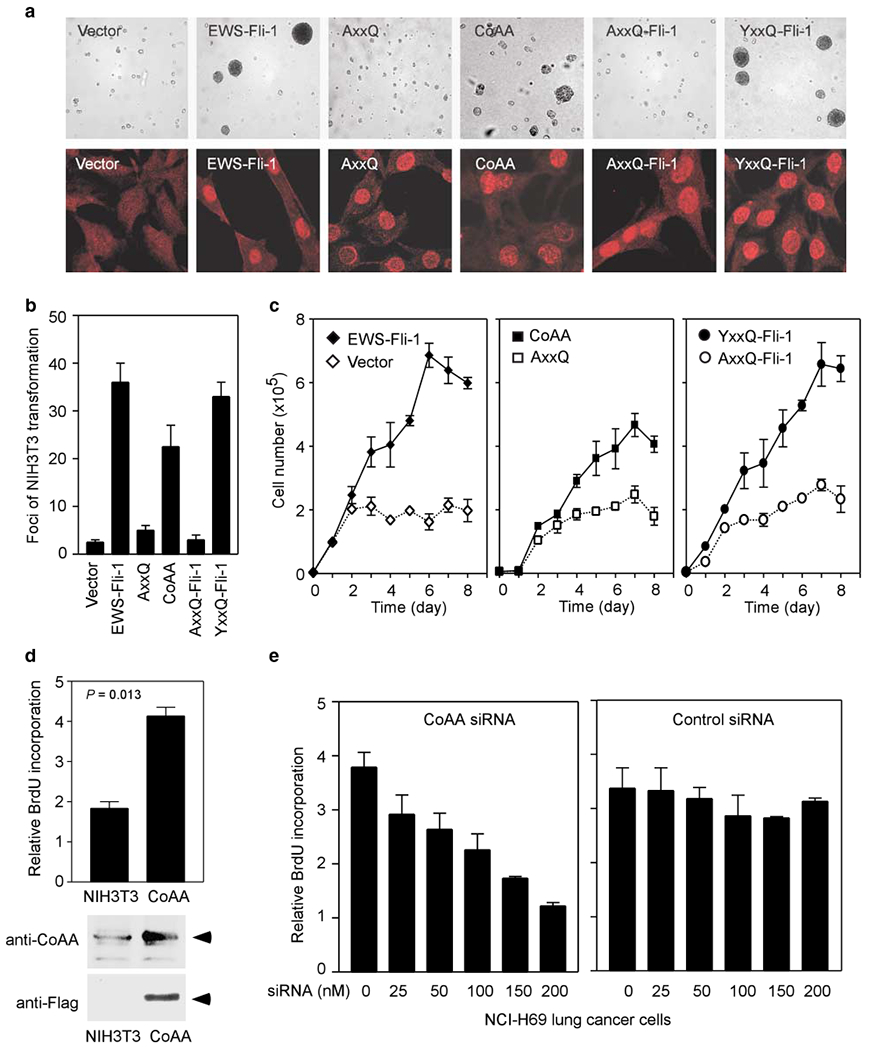
CoAA induces oncogenic transformation. (a) Anchorage-independent growth of NIH3T3 cells in soft agar. Cells were stably transfected with empty vector as control, or with expression plasmids for EWS-Fli-1, wild-type CoAA, AxxQ mutant, YxxQ-Fli-1 and AxxQ-Fli-1 (top panel). The protein expression levels were examined by immunofluorescent staining using an anti-FLAG antibody (lower panel). (b) Quantification results from a. The number of colonies was derived from two independent experiments. (c) Growth curves for stably transfected clones. Cells were plated into a 24-well plate in triplicate to analyse contact inhibition of transformed cells. Cell number was counted after trypsinizing every 24 h for 8 days. Data are shown as means of triplicate ±s.e. (d) Western blot analyses of endogenous CoAA in NIH3T3 cells and overexpressed CoAA in CoAA-transfected stable cells. Arrows indicate CoAA. Increased cell proliferation rate was measured by BrdU incorporation in CoAA-transfected NIH3T3 cells (top panel). (e) Decreased cell proliferation rate was measured by BrdU incorporation in NCI-H69 lung cancer cells treated with siRNA of CoAA. The increasing amounts of CoAA siRNA (left panel) and control siRNA (right panel) used are as indicated.