

Abstract
Background
Randomized trials demonstrate the cardioprotective effects of sodium‐glucose cotransporter 2 inhibitors (SGLT2i) and glucagon‐like peptide‐1 receptor agonists (GLP‐1RA). We evaluated their relative cardiovascular effectiveness in routine care populations with a broad spectrum of atherosclerotic cardiovascular diseases (CVDs) or heart failure (HF).
Methods and Results
We identified Medicare beneficiaries from 2013 to 2017, aged >65 years, initiating SGLT2i (n=24 747) or GLP‐1RA (n=22 596) after a 1‐year baseline. On the basis of diagnoses during baseline, we classified patients into: (1) no HF or CVD, (2) HF but no CVD, (3) no HF but CVD, and (4) both HF and CVD. We identified hospitalized HF and atherosclerotic CVD outcomes from drug initiation until treatment changes, death, or disenrollment. We estimated propensity score–weighted 2‐year risk ratios (RRs) and risk differences, accounting for measured confounding, informative censoring, and competing risk. In patients with no CVD or HF, SGLT2i reduced the hospitalized HF risk compared with GLP‐1RA (propensity score–weighted RR, 0.65; 95% CI, 0.43–0.96). The association was strongest in those who had HF but no CVD (RR, 0.48; 95% CI, 0.25–0.85). The combined myocardial infarction, stroke, and mortality outcome risk was slightly higher for SGLT2i compared with GLP‐1RA in those without CVD or HF (RR, 1.31; 95% CI, 1.09–1.56). The association was favorable toward SGLT2i in subgroups with a history of HF.
Conclusions
SGLT2i reduced the cardiovascular risk versus GLP‐1RA in patients with a history of HF but no CVD. Atherosclerotic CVD events were less frequent with GLP‐1RA in those without prior CVD or HF.
Keywords: glucagon‐like peptide‐1 receptor, heart failure, myocardial infarction, sodium‐glucose transporter 2 inhibitors, type 2 diabetes
Subject Categories: Diabetes, Type 2; Heart Failure; Myocardial Infarction; Cerebrovascular Disease/Stroke; Coronary Artery Disease
Nonstandard Abbreviations and Acronyms
- AT
as treated
- GLP‐1RA
glucagon‐like peptide‐1 receptor agonists
- HHF
hospitalization for heart failure
- IPCW
inverse probability of censoring weights
- IPTW
inverse probability of treatment weighting
- ITT
intent to treat
- MACE
major adverse cardiovascular event
- PS
propensity score
- SGLT2i
sodium‐glucose cotransporter‐2 inhibitors
Clinical Perspective
What Is New?
This study provides real‐world evidence from a large population‐based cohort study using federal insurance claims data (Medicare) on the head‐to‐head comparison of the cardioprotective glucose‐lowering agents, sodium‐glucose cotransporter 2 inhibitors and glucagon‐like peptide‐1 receptor agonists, with respect to heart failure, myocardial infarction, stroke, and mortality outcomes.
We specifically examined such comparison within specific populations of interest presenting with varying history of atherosclerotic cardiovascular disease and/or heart failure at baseline.
What Are the Clinical Implications?
Because our study was based on unselected older populations in routine clinical care who have a lower burden of established cardiovascular diseases, higher overall mean age, and higher burden of multimorbidity and frailty than clinical trial populations, our findings complement trial evidence, informing clinicians of the relevant subpopulations of interest who have varying risk for atherosclerotic cardiovascular disease and heart failure, and could benefit from particular cardioprotective glucose‐lowering agents.
Nearly 30% of Americans aged >65 years have diabetes, and the prevalence has been increasing steadily over the past decades. 1 Diabetes is a major risk factor for cardiovascular diseases (CVDs), with patients with type 2 diabetes having a higher risk of coronary artery disease, myocardial infarction (MI), stroke, heart failure (HF), and other cardiovascular events than patients without diabetes. 2 , 3 , 4 Patients with diabetes and CVD are also more likely to have recurrent attacks (eg, reinfarction) and mortality compared with counterparts without diabetes. 3 , 4 Therefore, optimizing cardiovascular morbidity and mortality has become a critical focus of the management of patients with diabetes. 5
Sodium‐glucose cotransporter 2 inhibitors (SGLT2i) were initially developed as glucose‐lowering medications that improve glycemia by inhibiting the reabsorption of glucose in the renal proximal tubules. 6 However, these medications have been shown to reduce the risk of cardiovascular events, in particular hospitalization for HF (HHF), in large‐scale, placebo‐controlled, randomized trials. 7 , 8 , 9 , 10 Another class of antihyperglycemic agents, glucagon‐like peptide‐1 receptor agonists (GLP‐1RA), has also demonstrated cardiovascular benefits in large‐scale randomized trials. 11 , 12 , 13 , 14 Relative to placebo, they lower the risk of the composite outcome of MI, stroke, and cardiovascular mortality, although their effects on HHF have not been fully defined. 11 , 12 , 13 , 14
Thus, recent guidelines endorsed the incorporation of newer agents with cardiovascular benefits (SGLT2i and GLP‐1RA) into routine clinical practice, and screening of patients who are at high risk of CVD. 5 , 15 There are, however, several barriers to implementing these guidelines in clinical practice. There are no large head‐to‐head trials comparing cardiovascular benefits of SGLT2i relative to GLP‐1RA, and most trial populations have a higher burden of established CVD or multiple cardiovascular risk factors, and a lower burden of multimorbidity and frailty compared with the patients in routine care. 7 , 8 , 9 , 16 It is therefore unknown whether real‐world populations will benefit from SGLT2i relative to GLP‐1RA and which subgroup of the population will benefit more from which agent, because populations in routine care typically have a broad spectrum of baseline CVD risk.
In addition, analyses of placebo‐controlled trials suggest that cardiovascular benefits of SGLT2i may be in part restricted to HF events, particularly in those with a history of HF. 17 This further stressed the importance of evaluating the comparative effectiveness of SGLT2i versus GLP‐1RA across the entire spectrum of major atherosclerotic CVD (MI, ischemic heart diseases, peripheral vascular diseases, and cerebrovascular diseases) and HF. Such real‐world evidence could help guide clinicians and policy makers in choosing the optimal antihyperglycemic agents in vulnerable older patients based on their observable clinical history of established atherosclerotic CVD and HF. We therefore aimed to estimate the relative effects of SGLT2i versus GLP‐1RA on the risk of (1) HHF, (2) the composite of MI, stroke, or mortality (major adverse cardiovascular events [MACEs]), and (3) the composite of MACE and HHF among older US Medicare beneficiaries, stratified by the clinical history of atherosclerotic CVD and HF.
Methods
As our study was based on routinely collected electronic health care data, informed consent was waived and the study protocol was approved by the Institutional Review Board at the University of North Carolina at Chapel Hill. Because of data user agreements with the Centers for Medicare and Medicaid Services, databases used in this study are not available to share, but are available to request from the Research Data Assistance Center.
Study Cohorts
We used an active comparator, new user study design identifying cohorts of new users of SGLT2i and GLP‐1RA among Medicare fee‐for‐service beneficiaries from 2012 to 2017 after requiring 1‐year washout period during which any SGLT2i or GLP‐1RA users were excluded (Figure 1 and Figure S1). 18 During this baseline period, we required patients to have continuous coverage in fee‐for‐service Medicare plans A (inpatient services), B (physician and outpatient services), and D (prescription drugs) and no evidence of end‐stage renal disease or chronic kidney disease (stage 4 or 5). We restricted our Medicare cohorts to those aged >65 years at the time of drug initiation. Medicare fee‐for‐service claims provide longitudinal health care data on prescription drug dispensing, and health care diagnoses and procedures in inpatient, outpatient, emergency, and institutional care settings for the services reimbursed by the Medicare plans.
Figure 1. Study design diagram.
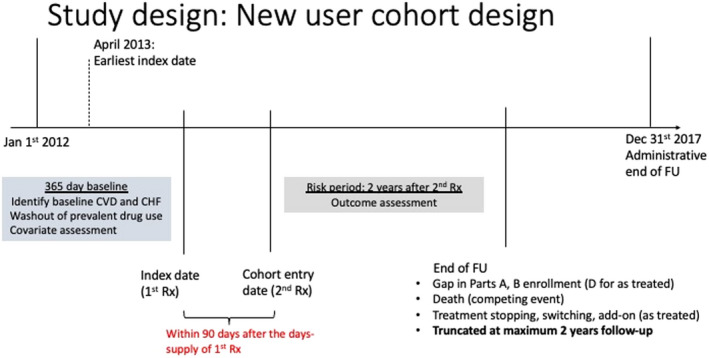
CHF indicates congestive heart failure; CVD, cardiovascular disease; FU, follow‐up; and Rx, prescription.
We then identified 4 nonoverlapping subgroups based on codes for HF and major atherosclerotic CVD during the 12 months before drug initiation (MI, ischemic heart disease, stroke, cerebrovascular diseases, cardiovascular revascularization procedures, peripheral arterial diseases, and revascularization) (Table S1): (1) no history of HF or CVD, (2) history of HF but no CVD, (3) history of CVD but no HF, and (4) history of both HF and CVD. We identified these baseline conditions using International Classification of Diseases, Ninth Revision, Clinical Modification (ICD‐9‐CM) and International Classification of Diseases, Tenth Revision, Clinical Modification (ICD‐10‐CM) diagnosis and procedure codes, Current Procedural Terminology (CPT) codes, and Healthcare Common Procedure Coding System following claims data‐based algorithms from prior validation studies. 19 , 20 , 21 , 22 , 23 , 24
Exposure Assessment
We identified new drug users using National Drug Codes from the prescription pharmacy claims from Medicare part D claims data. Exposure and comparator drug classes of interest include the following: SGLT2i (canagliflozin, dapagliflozin, and empagliflozin) and GLP‐1RA (exenatide, liraglutide, dulaglutide, and albiglutide) (Table S2). To reduce misclassification of pharmacy claims data attributable to patients not adhering to medications, we required beneficiaries to refill medications from the same drug class at least once during 90 days after drug initiation. The second prescription date is the index date from which follow‐up of the cohort began. 25
Outcomes
We identified outcomes using prior published algorithms that have been shown to have high reported specificity (93%–98%) or positive predictive value (>95%). 19 , 22 , 23 , 24 , 26 , 27 The primary outcomes are as follows: (1) HHF, (2) composite end point of inpatient MI, inpatient stroke, or all‐cause mortality (MACE outcome), and (3) the composite of MACE plus HHF. Because cardiovascular deaths account for ≈70% of diabetes‐related deaths in adults aged ≥65 years, we used all‐cause mortality as a proxy for cardiovascular mortality. 28 Secondary outcomes include individual components of the MACE outcome and MACE plus invasive cardiac procedures (stents, revascularization, and bypass surgery). We assumed death as a competing event for these cardiovascular outcomes (details below).
All outcomes were identified in an inpatient setting with ICD‐9‐CM or ICD‐10‐CM diagnosis codes in primary or secondary positions (Tables S3 through S5 for codes). We identified invasive cardiac procedures using standardized coding systems: Healthcare Common Procedure Coding System and CPT (Table S6). To prevent bias attributable to changes in coding practices (ICD‐9‐CM to ICD‐10‐CM transition after October 2015), we assessed trends in outcome codes over calendar time using various outcome definition algorithms following approaches outlined in literature. 29 Date of mortality was ascertained from the Medicare Master Beneficiary Summary File: National Death Index segment. Over 99% of dates of death reported in the Medicare Master Beneficiary Summary File have been validated using death certificate data according to the Research Data Assistance Center. 30
Negative Control Outcome
We used all‐cause cancer incidence and cataract surgery as negative control outcomes because these outcomes are not affected by SGLT2i or GLP‐1RA, and thus should have null association with the exposures if our confounding adjustment and analytical strategies are sufficient to reduce confounding (under the assumption of a similar confounding structure to primary outcomes). 31 In the analyses for cancer, we excluded patients with evidence of cancer or cancer‐related therapeutic procedures at baseline using a sensitive algorithm. 32 We repeated the analyses for primary cardiovascular outcomes in this population to ensure that we are comparing primary and control estimates in the same population. In identifying cancer outcomes, we used the claims‐based algorithm (at least 2 ICD‐9‐CM or ICD‐10‐CM diagnosis codes during 2 months after the first diagnosis) that has been shown to have near‐perfect specificity (>99%) across multiple cancer sites. 33 Similarly for cataract surgery outcome, we excluded patients with prevalent cataract surgery claims during the baseline period, and primary cardiovascular analyses were repeated in this population.
Risk Periods
Patients were at risk of the outcome starting from the index date (second prescription date) until the end of Medicare enrollment, death, administrative censoring (December 31, 2017), or treatment discontinuation or initiation of (including switching to or adding on) the comparison drug class (as‐treated [AT] or on‐treatment analyses). We also performed intent‐to‐treat (ITT) like analyses, in which we did not censor for treatment changes. Patients were followed up for a maximum of 2 years after the start of follow‐up to avoid follow‐up of patients long after they potentially discontinued their medications (median treatment duration in our cohort was ≈1 year). In sensitivity analyses, we extended the follow‐up to all‐available years (maximum, 5 years).
Covariate Assessment and Confounding Control
We identified potential confounders using ICD‐9‐CM/ICD‐10‐CM diagnosis and procedure codes, Healthcare Common Procedure Coding System, and CPT codes during the 1‐year baseline period, identifying conditions at high risk of cardiovascular morbidity and mortality: demographics, diabetes complications and proxies of diabetes severity (oral antihyperglycemic medications, short‐ and long‐term insulin, number of hyperglycemia diagnoses, number of noninsulin antihyperglycemic prescriptions, foot ulcers, hypoglycemia, retinopathy, neuropathy, and nephropathy), cardiovascular disorders and proxies of CVD severity, chronic comorbid disorders, Charlson/Elixhauser combined comorbidity scores, proxies of frailty (durable medical equipment claims, disability, or chronic debilitating conditions), socioeconomic status indicators (low‐income subsidy), proxies of smoking, smoking cessation, and alcohol, chronic disease medications use, and measures of health care use (including influenza vaccination, lipid tests, and hospital, emergency, or outpatient visits).
Statistical Analysis
Within each cardiovascular subgroup of interest, we estimated propensity scores (PSs), the probability of SGLT2i versus GLP‐1RA initiation, conditional on baseline covariates using logistic regression. We controlled measured confounding by inverse probability of treatment weighting (IPTW) by assigning weights of 1/PS and 1/(1‐PS) multiplied by the marginal proportion of SGLT2i and GLP‐1RA initiators to SGLT2i and GLP‐1RA cohorts, respectively. 34 , 35 This creates pseudopopulations within each subgroup in which each exposure arm has the same distribution of covariates in each respective subgroup and therefore all measured covariates were balanced across treatment arms. We assessed balance in covariate distributions by absolute standardized mean differences (Tables S7 through S11). 36
We accounted for potential informative censoring attributable to loss to follow‐up (treatment discontinuation in AT analyses and insurance disenrollment in ITT analyses), using inverse probability of censoring weights (IPCW). 37 First, we predicted the probability of not dropping out (ie, probability of not getting censored) at each quintile of the follow‐up time, conditional on baseline covariates (similar to those used in IPTW), and we pooled these probabilities over the follow‐up duration using pooled linear logistic regression. We then assigned weights of 1/probability of remaining uncensored through time t for observed times t, multiplied by the proportion of patients not lost to follow‐up to reduce variance. 37 The final weight is IPTW multiplied by IPCW to account for baseline confounding as well as potential informative censoring attributable to lost follow‐up.
We estimated 2‐year risks of outcomes of interest, risk differences, and risk ratios (RRs) for SGLT2i versus GLP‐1RA after weighting by IPTW and IPCW (Figures 2 and 3). The CIs were derived from 2.5th and 97.5th percentiles of estimates from 500 bootstrap resamples of the study population (random resampling with replacement). When estimating risks of cardiovascular outcomes in older Medicare patients, censoring those who died before having the outcome of interest, as commonly done in survival analyses, could bias the risks. 37 , 38 To avoid this, we used Aalen Johansen estimators to estimate risks. 35 We first estimated the overall survival function for 2 years and the hazard function for each event type (outcome of interest as well as death) in a population weighted by IPTW and IPCW. We then multiplied the hazard function of the outcome of interest at each event time by the overall survival at the previous time point to obtain the Aalen Johansen estimators. This estimator treated death as a competing risk, by setting the risk of patients to 0 after death. 39 Causal diagram (directed acyclic graph) summarizing the relationships between these censoring (treatment changes) and competing events (death) is presented in Figure S2. 39
Figure 2. Competing risk estimators (inverse probability of treatment and censoring weighted risk ratios) for the effect of sodium‐glucose cotransporter‐2 inhibitors (SGLT2i) vs glucagon‐like peptide‐1 receptor agonists (GLP‐1RA) on primary cardiovascular and mortality outcomes (as‐treated analyses).
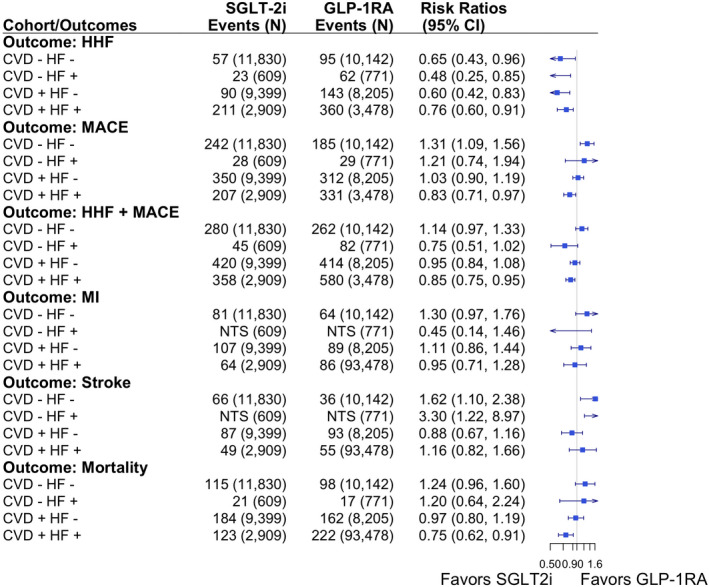
CVD indicates cardiovascular disease; HF, heart failure; HHF, hospitalization for HF; MACE, major adverse cardiovascular outcome; and MI, myocardial infarction.
Figure 3. Competing risk estimators (inverse probability of treatment and censoring weighted risk differences) for the effect of sodium‐glucose cotransporter‐2 inhibitors (SGLT2i) vs glucagon‐like peptide‐1 receptor agonists (GLP‐1RA) on primary cardiovascular and mortality outcomes (as‐treated analyses).
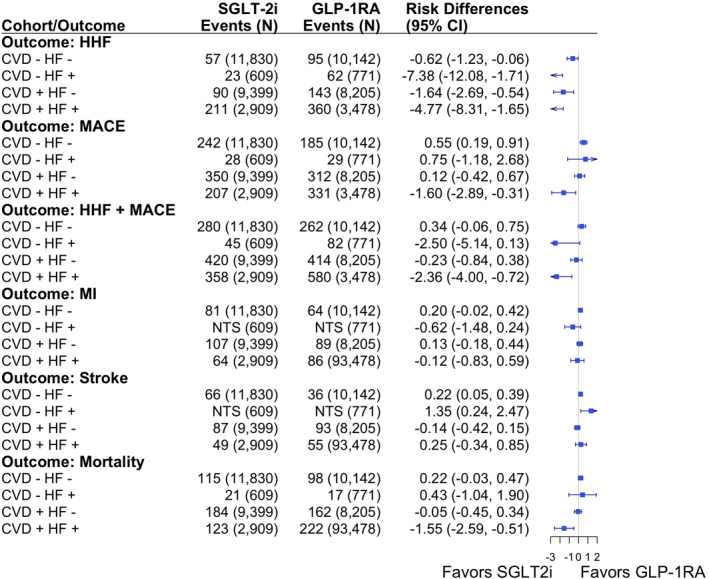
CVD indicates cardiovascular disease; HF, heart failure; HHF, hospitalization for HF; MACE, major adverse cardiovascular outcome; and MI, myocardial infarction.
For comparison, we also estimated risk differences and RRs by linear and log binomial regression models, respectively, instead of Aalen Johansen estimators, after applying IPTW and IPCW; and CIs were derived by robust variance estimators. We did not treat death as a censoring event in such analyses. We also reported cumulative risk curves as a function of the follow‐up time (adjusted for baseline confounding and informative censoring) for each analytic comparison of interest (Figures 4, 5, 6 and Figures S3 through S5).
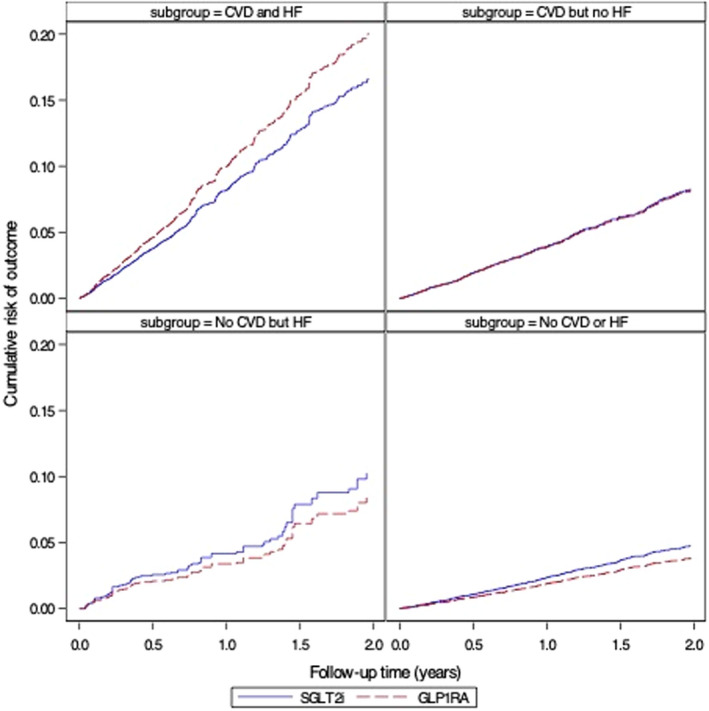
Figure 4. Cumulative risk of hospitalization for heart failure, stratified by baseline atherosclerotic cardiovascular diseases (CVDs) and heart failure (HF) (as‐treated analyses adjusted for baseline confounding and informative censoring).
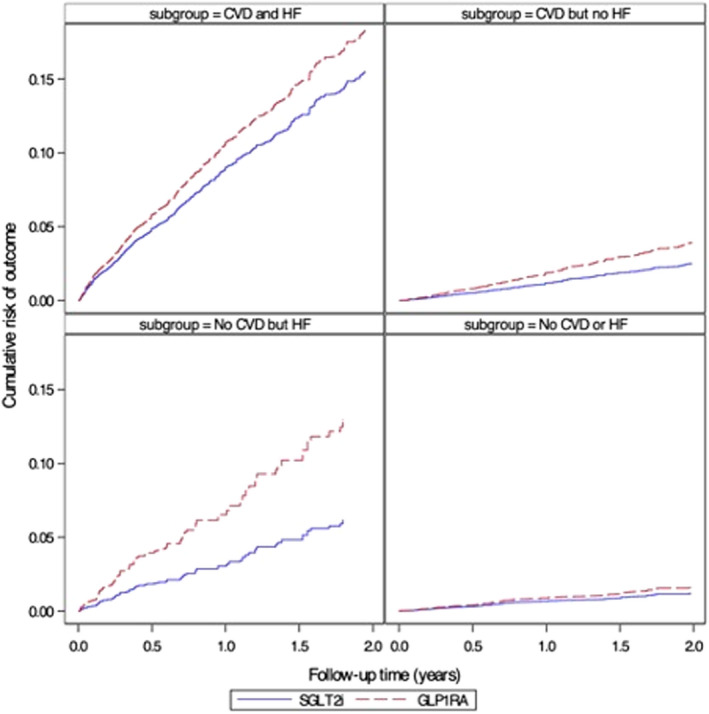
GLP‐1RA indicates glucagon‐like peptide‐1 receptor agonists; and SGLT2i, sodium‐glucose cotransporter‐2 inhibitors.
Figure 5. Cumulative risk of major adverse cardiovascular outcomes (myocardial infarction, stroke, and mortality), stratified by baseline atherosclerotic cardiovascular diseases (CVDs) and heart failure (HF) (as‐treated analyses adjusted for baseline confounding and informative censoring).
GLP‐1RA indicates glucagon‐like peptide‐1 receptor agonists; and SGLT2i, sodium‐glucose cotransporter‐2 inhibitors.
Figure 6. Cumulative risk of a composite of hospitalization for heart failure (HF) or major adverse cardiovascular outcomes (myocardial infarction, stroke, and mortality), stratified by baseline atherosclerotic cardiovascular diseases (CVDs) and HF (as‐treated analyses adjusted for baseline confounding and informative censoring).
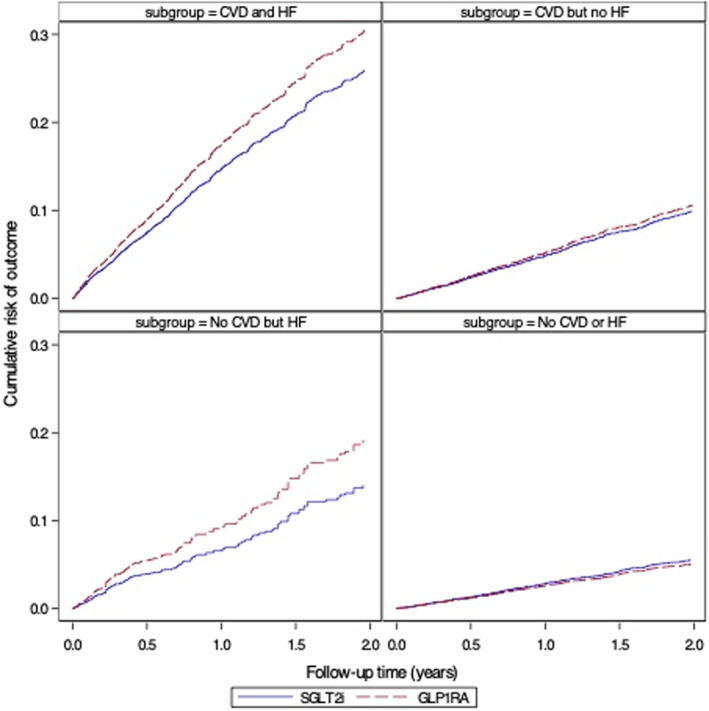
GLP‐1RA indicates glucagon‐like peptide‐1 receptor agonists; and SGLT2i, sodium‐glucose cotransporter‐2 inhibitors.
Sensitivity Analysis
We conducted several sensitivity analyses to assess the robustness of our claims‐based algorithms of outcomes and baseline subgroup definitions: (1) we excluded each of the following conditions from baseline CVD definition: peripheral arterial disease, nonspecific angina/ischemic heart disease, and cardiomyopathy; (2) we limited all codes for baseline CVD/HF conditions to inpatient settings only to increase the specificity of codes; (3) we varied our outcome definitions for HF by including rheumatic and hypertensive HF codes in addition to the primary congestive HF codes; (4) we varied our stroke definition by limiting to codes for ischemic stroke only; and (5) we included cardiovascular revascularization procedures (stents, bypass, and primary coronary intervention) to MACE outcome definitions. To check the distributions of HF events with preserved versus reduced ejection fractions, we predicted éjection fraction based on a selected set of covariates using the algorithm published by Desai et al. 40 To check the informative censoring, we allowed time‐varying covariates in censoring weight models by including codes for hyperglycemia (ketoacidosis, uncontrolled diabetes, or hyperosmolar nonketosis) and any hospitalization in 3‐monthly periods before the interval when treatment discontinuation or switching occurred. We extended the follow‐up to all‐available years (maximum, 5 years) and estimated the hazard ratios (HRs) using competing risk–adjusted Fine and Gray Cox models, truncating the weights at 1% and 99% to deal with large weights associated with long‐term follow‐up, as suggested by Cole and Hernan. 56 We also excluded patients with diagnosis dates for congestive HF and major CVD conditions during 2 months before drug initiation to reduce bias related to recurrent outcome events (similar to an exclusion criterion in EMPA‐REG OUTCOME [Empagliflozin Cardiovascular Outcome Event Trial in Type 2 Diabetes Mellitus PatientseRemoving Excess Glucose] trial). 8 We excluded earlier GLP‐1RA agents (exenatide) from analyses and compared the most commonly used agent in each class: SGLT2i (canagliflozin) versus GLP‐1RA (liraglutide). To assess the potential for differential detection bias, we evaluated the proportions of health‐seeking behaviors (flu shots and lipid tests) during the first 6 months following drug initiation among SGLT2i versus GLP‐1RA initiators.
Results
Our overall cohort included 24 747 SGLT2i and 22 596 GLP‐1RA initiators. Compared with GLP‐1RA initiators, SGLT2i initiators were slightly older (mean age, 73.4 versus 72.7 years), more likely to be men (50.9% versus 44.0%), and less likely to be White race (79.8% versus 82.5%). The prevalence of baseline HF was lower among SGLT2i versus GLP‐1RA initiators (12.6% versus 17.2%), whereas the prevalence of MI or cerebrovascular diseases was similar between the groups. The Charlson/Elixhauser combined comorbidity score was slightly lower among SGLT2i, with the mean (SD) of 1.9 (2.3) versus GLP‐1RA initiators: mean (SD) of 2.5 (2.6). In the Table, we present unweighted distributions of baseline characteristics in the overall study population. Distributions after weighting along with standardized mean difference statistics are presented in Tables S7 through S11.
Table .
Distributions of Baseline Characteristics in the Total Cohort Before PS Weighting
| Characteristic |
SGLT2i (N=24 747) |
GLP‐1RA (N=22 596) |
Total (N=47 343) |
Absolute standardized mean differences |
|---|---|---|---|---|
| Demographic characteristics | ||||
| Age, mean (SD), y | 73.4 (5.70) | 72.7 (5.43) | 73.1 (5.58) | 0.127 |
| Race or ethnicity | ||||
| White | 19 753 (79.8) | 18 643 (82.5) | 38 396 (81.1) | 0.069 |
| Black | 1865 (7.5) | 2104 (9.3) | 3969 (8.4) | 0.064 |
| Other * | 3129 (12.6) | 1849 (8.2) | 4978 (10.5) | 0.146 |
| Male sex | 12 601 (50.9) | 9937 (44.0) | 22 538 (47.6) | 0.139 |
| Low‐income subsidy, mean (SD) | 187.7 (414.74) | 216.3 (456.29) | 201.4 (435.30) | 0.066 |
| Measures of diabetes severity/complications | ||||
| Diabetes retinopathy | 3623 (14.6) | 3621 (16.0) | 7244 (15.3) | 0.038 |
| Diabetes nephropathy | 2835 (11.5) | 4204 (18.6) | 7039 (14.9) | 0.201 |
| Diabetes neuropathy | 6985 (28.2) | 7598 (33.6) | 14 583 (30.8) | 0.117 |
| Other diabetes complications | 11 158 (45.1) | 10 812 (47.8) | 21 970 (46.4) | 0.055 |
| No. of antihyperglycemic drugs | ||||
| 0 | 2139 (8.6) | 4036 (17.9) | 6175 (13.0) | 0.274 |
| 1 | 6799 (27.5) | 7109 (31.5) | 13 908 (29.4) | 0.088 |
| 2 | 9167 (37.0) | 7142 (31.6) | 16 309 (34.4) | 0.115 |
| 3 | 5698 (23.0) | 3708 (16.4) | 9406 (19.9) | 0.167 |
| ≥4 | 944 (3.8) | 601 (2.7) | 1545 (3.3) | 0.065 |
| No. of hyperglycemia diagnoses | ||||
| 0 | 10 991 (44.4) | 8858 (39.2) | 19 849 (41.9) | 0.106 |
| 1 | 3195 (12.9) | 2854 (12.6) | 6049 (12.8) | 0.008 |
| 2 | 1957 (7.9) | 1894 (8.4) | 3851 (8.1) | 0.017 |
| 3 | 2887 (11.7) | 2721 (12.0) | 5608 (11.8) | 0.012 |
| ≥4 | 5717 (23.1) | 6269 (27.7) | 11 986 (25.3) | 0.107 |
| Hypoglycemia | 565 (2.3) | 710 (3.1) | 1275 (2.7) | 0.053 |
| Foot ulcers | 733 (3.0) | 894 (4.0) | 1627 (3.4) | 0.054 |
| Cardiovascular disorders | ||||
| Angina | 1309 (5.3) | 1222 (5.4) | 2531 (5.3) | 0.005 |
| MI | 1574 (6.4) | 1629 (7.2) | 3203 (6.8) | 0.034 |
| Cardiac revascularization or bypass | 472 (1.9) | 476 (2.1) | 948 (2.0) | 0.014 |
| Atherosclerosis | 3148 (12.7) | 2946 (13.0) | 6094 (12.9) | 0.009 |
| Ischemic heart diseases | 8246 (33.3) | 7899 (35.0) | 16 145 (34.1) | 0.035 |
| Cerebrovascular diseases | 3763 (15.2) | 3523 (15.6) | 7286 (15.4) | 0.011 |
| Cardiomyopathy | 982 (4.0) | 1024 (4.5) | 2006 (4.2) | 0.028 |
| Congestive heart failure | 3123 (12.6) | 3884 (17.2) | 7007 (14.8) | 0.129 |
| Peripheral vascular diseases | 4341 (17.5) | 4422 (19.6) | 8763 (18.5) | 0.052 |
| Atrial fibrillation | 2947 (11.9) | 2940 (13.0) | 5887 (12.4) | 0.033 |
| Arrhythmia disorders | 3468 (14.0) | 3616 (16.0) | 7084 (15.0) | 0.056 |
| Cardiac arrest | 37 (0.1) | 38 (0.2) | 75 (0.2) | 0.005 |
| Defibrillator | 364 (1.5) | 435 (1.9) | 799 (1.7) | 0.035 |
| Comorbid conditions | ||||
| Combined comorbidity score, mean (SD) | 1.9 (2.32) | 2.5 (2.58) | 2.2 (2.46) | 0.224 |
| Anemia | 6364 (25.7) | 6245 (27.6) | 12 609 (26.6) | 0.043 |
| Alcohol disorders | 205 (0.8) | 174 (0.8) | 379 (0.8) | 0.007 |
| Asthma | 2389 (9.7) | 2806 (12.4) | 5195 (11.0) | 0.088 |
| Brain injury | 631 (2.5) | 720 (3.2) | 1351 (2.9) | 0.038 |
| Cancer (except for nonmelanoma skin) | 3129 (12.6) | 2721 (12.0) | 5850 (12.4) | 0.018 |
| Chronic lung disorders | 5835 (23.6) | 6385 (28.3) | 12 220 (25.8) | 0.107 |
| CKD (stage 1–3) | 3590 (14.5) | 5853 (25.9) | 9443 (19.9) | 0.287 |
| Coagulopathy | 816 (3.3) | 874 (3.9) | 1690 (3.6) | 0.031 |
| Connective tissue disorders | 878 (3.5) | 1018 (4.5) | 1896 (4.0) | 0.049 |
| Dementia | 588 (2.4) | 598 (2.6) | 1186 (2.5) | 0.017 |
| Deficiency anemia | 5927 (24.0) | 5715 (25.3) | 11 642 (24.6) | 0.031 |
| Depression | 3788 (15.3) | 4778 (21.1) | 8566 (18.1) | 0.152 |
| Difficulty walking | 3473 (14.0) | 3840 (17.0) | 7313 (15.4) | 0.082 |
| Dyslipidemia | 21 932 (88.6) | 19 651 (87.0) | 41 583 (87.8) | 0.051 |
| Endocrine disorders | 9833 (39.7) | 9788 (43.3) | 19 621 (41.4) | 0.073 |
| Edema | 2749 (11.1) | 3414 (15.1) | 6163 (13.0) | 0.119 |
| Electrolyte disorders | 2969 (12.0) | 3504 (15.5) | 6473 (13.7) | 0.102 |
| HIV | 47 (0.2) | 47 (0.2) | 94 (0.2) | 0.004 |
| Hematological disorders | 7362 (29.7) | 7283 (32.2) | 14 645 (30.9) | 0.054 |
| Hypertension | 14 167 (57.2) | 12 435 (55.0) | 26 602 (56.2) | 0.045 |
| Hypotension | 801 (3.2) | 900 (4.0) | 1701 (3.6) | 0.040 |
| Immune disorders | 365 (1.5) | 417 (1.8) | 782 (1.7) | 0.029 |
| Metabolic disorders | 22 084 (89.2) | 20 005 (88.5) | 42 089 (88.9) | 0.022 |
| Metastatic cancers | 265 (1.1) | 210 (0.9) | 475 (1.0) | 0.014 |
| Mild liver disorders | 1208 (4.9) | 1149 (5.1) | 2357 (5.0) | 0.009 |
| Moderate liver disorders | 142 (0.6) | 128 (0.6) | 270 (0.6) | 0.001 |
| Nutritional disorders | 7584 (30.6) | 7203 (31.9) | 14 787 (31.2) | 0.027 |
| Nervous system disorders | 11 445 (46.2) | 12 354 (54.7) | 23 799 (50.3) | 0.169 |
| Paraplegia | 226 (0.9) | 268 (1.2) | 494 (1.0) | 0.027 |
| Parkinsonism | 250 (1.0) | 276 (1.2) | 526 (1.1) | 0.020 |
| Pneumonia | 1162 (4.7) | 1389 (6.1) | 2551 (5.4) | 0.064 |
| Psychosis | 1129 (4.6) | 1287 (5.7) | 2416 (5.1) | 0.051 |
| Pulmonary circulation disorders | 623 (2.5) | 845 (3.7) | 1468 (3.1) | 0.070 |
| Rehabilitation | 1184 (4.8) | 1326 (5.9) | 2510 (5.3) | 0.048 |
| Renal disorders | 3650 (14.7) | 5927 (26.2) | 9577 (20.2) | 0.287 |
| Rheumatic disorders | 845 (3.4) | 823 (3.6) | 1668 (3.5) | 0.012 |
| Smoking and smoking cessation | 1309 (5.3) | 1204 (5.3) | 2513 (5.3) | 0.002 |
| Thromboembolism | 167 (0.7) | 151 (0.7) | 318 (0.7) | 0.001 |
| Vulvular disorders | 3061 (12.4) | 2931 (13.0) | 5992 (12.7) | 0.018 |
| Weight loss | 185 (0.7) | 190 (0.8) | 375 (0.8) | 0.011 |
| Durable medical equipment claims | ||||
| Ambulance | 2519 (10.2) | 2853 (12.6) | 5372 (11.3) | 0.077 |
| Hospital beds | 132 (0.5) | 174 (0.8) | 306 (0.6) | 0.029 |
| Home oxygen | 955 (3.9) | 1419 (6.3) | 2374 (5.0) | 0.111 |
| Wheelchairs | 275 (1.1) | 348 (1.5) | 623 (1.3) | 0.038 |
| History of medication use | ||||
| Metformin | 19 134 (77.3) | 14 824 (65.6) | 33 958 (71.7) | 0.262 |
| Short‐acting insulin | 2835 (11.5) | 4923 (21.8) | 7758 (16.4) | 0.280 |
| Long‐acting insulin | 6450 (26.1) | 9867 (43.7) | 16 317 (34.5) | 0.376 |
| Thiazolidinedione | 2810 (11.4) | 2219 (9.8) | 5029 (10.6) | 0.050 |
| Meglitinide | 728 (2.9) | 656 (2.9) | 1384 (2.9) | 0.002 |
| Sulphonylurea | 12 133 (49.0) | 9721 (43.0) | 21 854 (46.2) | 0.121 |
| DPP‐4i | 10 971 (44.3) | 7337 (32.5) | 18 308 (38.7) | 0.246 |
| Immunosuppressive drugs | 174 (0.7) | 217 (1.0) | 391 (0.8) | 0.028 |
| Steroids | 4084 (16.5) | 4060 (18.0) | 8144 (17.2) | 0.039 |
| ACEI | 10 964 (44.3) | 10 089 (44.6) | 21 053 (44.5) | 0.007 |
| ARB | 9094 (36.7) | 8338 (36.9) | 17 432 (36.8) | 0.003 |
| CCB | 8274 (33.4) | 7862 (34.8) | 16 136 (34.1) | 0.029 |
| BB | 13 125 (53.0) | 12 511 (55.4) | 25 636 (54.1) | 0.047 |
| NSAIDS | 7169 (29.0) | 6436 (28.5) | 13 605 (28.7) | 0.011 |
| Aspirin | 1134 (4.6) | 1366 (6.0) | 2500 (5.3) | 0.065 |
| Oral contraceptives | 475 (1.9) | 589 (2.6) | 1064 (2.2) | 0.046 |
| Estrogen | 1338 (5.4) | 1411 (6.2) | 2749 (5.8) | 0.036 |
| Loop diuretics | 4582 (18.5) | 6153 (27.2) | 10 735 (22.7) | 0.209 |
| Other diuretics | 9313 (37.6) | 9238 (40.9) | 18 551 (39.2) | 0.067 |
| Statin | 19 098 (77.2) | 17 360 (76.8) | 36 458 (77.0) | 0.008 |
| Measures of health care use | ||||
| HbA1C tests | ||||
| 0 | 1313 (5.3) | 1689 (7.5) | 3002 (6.3) | 0.089 |
| 1 | 3028 (12.2) | 2730 (12.1) | 5758 (12.2) | 0.005 |
| 2 | 5723 (23.1) | 4703 (20.8) | 10 426 (22.0) | 0.056 |
| 3 | 6956 (28.1) | 5921 (26.2) | 12 877 (27.2) | 0.043 |
| 4 | 4955 (20.0) | 4573 (20.2) | 9528 (20.1) | 0.005 |
| ≥5 | 2772 (11.2) | 2980 (13.2) | 5752 (12.1) | 0.061 |
| Flu shots | ||||
| 0 | 9441 (38.2) | 8670 (38.4) | 18 111 (38.3) | 0.005 |
| 1 | 12 361 (49.9) | 11 163 (49.4) | 23 524 (49.7) | 0.011 |
| 2 | 2056 (8.3) | 1900 (8.4) | 3956 (8.4) | 0.004 |
| ≥3 | 889 (3.6) | 863 (3.8) | 1752 (3.7) | 0.012 |
| Lipid tests | ||||
| 0 | 2964 (12.0) | 3504 (15.5) | 6468 (13.7) | 0.103 |
| 1 | 7262 (29.3) | 6838 (30.3) | 14 100 (29.8) | 0.020 |
| 2 | 6928 (28.0) | 5886 (26.0) | 12 814 (27.1) | 0.044 |
| 3 | 4325 (17.5) | 3546 (15.7) | 7871 (16.6) | 0.048 |
| ≥4 | 3268 (13.2) | 2822 (12.5) | 6090 (12.9) | 0.021 |
| No. of hospital admissions | ||||
| 0 | 21 249 (85.9) | 18 529 (82.0) | 39 778 (84.0) | 0.105 |
| 1 | 2486 (10.0) | 2774 (12.3) | 5260 (11.1) | 0.071 |
| ≥2 | 1012 (4.1) | 1293 (5.7) | 2305 (4.9) | 0.076 |
| No. of days of hospitalization | ||||
| 0 | 21 249 (85.9) | 18 529 (82.0) | 39 778 (84.0) | 0.105 |
| 1 | 1583 (6.4) | 1760 (7.8) | 3343 (7.1) | 0.054 |
| ≥2 | 1915 (7.7) | 2307 (10.2) | 4222 (8.9) | 0.087 |
| No. of emergency visits | ||||
| 0 | 17 646 (71.3) | 15 032 (66.5) | 32 678 (69.0) | 0.103 |
| 1 | 3903 (15.8) | 3831 (17.0) | 7734 (16.3) | 0.032 |
| 2 | 1619 (6.5) | 1794 (7.9) | 3413 (7.2) | 0.054 |
| ≥3 | 1579 (6.4) | 1939 (8.6) | 3518 (7.4) | 0.084 |
| No. of emergency visits attributable to diabetes | ||||
| 0 | 24 395 (98.6) | 22 194 (98.2) | 46 589 (98.4) | 0.028 |
| 1 | 296 (1.2) | 335 (1.5) | 631 (1.3) | 0.025 |
| ≥2 | 56 (0.2) | 67 (0.3) | 123 (0.3) | 0.014 |
| No. of outpatient visits | ||||
| 0 | 1047 (4.2) | 1276 (5.6) | 2323 (4.9) | 0.065 |
| 1 | 4446 (18.0) | 3564 (15.8) | 8010 (16.9) | 0.059 |
| 2 | 6491 (26.2) | 5147 (22.8) | 11 638 (24.6) | 0.080 |
| 3 | 5063 (20.5) | 4400 (19.5) | 9463 (20.0) | 0.025 |
| 4 | 3223 (13.0) | 3155 (14.0) | 6378 (13.5) | 0.027 |
| ≥5 | 4477 (18.1) | 5054 (22.4) | 9531 (20.1) | 0.107 |
| No. of outpatient visits attributable to diabetes | 11 172 (45.1) | 10 110 (44.7) | 21 282 (45.0) | 0.008 |
| No. of days between first and second scripts, mean (SD) | 47.5 (29.47) | 47.4 (27.76) | 47.4 (28.66) | 0.002 |
| Markers of diabetes and cardiovascular disease severity | ||||
| HbA1C <7% | 945 (3.8) | 868 (3.8) | 1813 (3.8) | 0.001 |
| HbA1C 7%–9% | 1982 (8.0) | 1762 (7.8) | 3744 (7.9) | 0.008 |
| HbA1C >9% | 1075 (4.3) | 1176 (5.2) | 2251 (4.8) | 0.040 |
| LDL <100 mg/dL | 861 (3.5) | 879 (3.9) | 1740 (3.7) | 0.022 |
| LDL 100–129 mg/dL | 202 (0.8) | 202 (0.9) | 404 (0.9) | 0.008 |
| LDL >130 mg/dL | 93 (0.4) | 115 (0.5) | 208 (0.4) | 0.020 |
| SBP <130 mm Hg | 167 (0.7) | 209 (0.9) | 376 (0.8) | 0.028 |
| SBP 130–139 mm Hg | 115 (0.5) | 125 (0.6) | 240 (0.5) | 0.012 |
| SBP ≥140 mm Hg | 118 (0.5) | 139 (0.6) | 257 (0.5) | 0.019 |
| DBP <80 mm Hg | 214 (0.9) | 275 (1.2) | 489 (1.0) | 0.035 |
| DBP 80–89 mm Hg | 118 (0.5) | 116 (0.5) | 234 (0.5) | 0.005 |
| DBP ≥90 mm Hg | 25 (0.1) | 31 (0.1) | 56 (0.1) | 0.010 |
Data are given as number (percentage), unless otherwise indicated. All covariates (except for the number of days between first and second prescriptions) are measured 12 months before the first prescription date. ACEI indicates angiotensin‐converting enzyme inhibitor; ARB, angiotensin receptor blocker; BB, β blocker; CCB, calcium channel blocker; CKD, chronic kidney disease; DBP, diastolic blood pressure; DPP‐4i, dipeptidyl peptidase‐4 inhibitor; GLP‐1RA, glucagon‐like peptide‐1 receptor agonists; HbA1C, hemoglobin A1C; LDL, low‐density lipoprotein; MI, myocardial infarction; PS, propensity score; SBP, systolic blood pressure; and SGLT2i, sodium‐glucose cotransporter 2 inhibitors.
American Indian or Alaskan Native, Asian, Hispanic or Latino, Native Hawaiian or other Pacific Islander, or unknown
There were 11 830 SGLT‐2i and 10 142 GLP‐1RA initiators who had no baseline HF or CVD. In AT analyses, we identified 57 and 95 HHF events, respectively, in this subgroup with the PS‐weighted RR of 0.65 (95% CI, 0.43–0.96) after accounting for informative censoring and competing risk attributable to mortality (Figure 2). In patients with baseline HF only but no CVD, this RR became much lower, 0.48 (95% CI, 0.25–0.85), based on 23 and 62 HF hospitalized events among 609 SGLT2i and 771 GLP‐1RA initiators, indicating greater benefit with SGLT2i. The RR in patients without HF but with CVD was approximately similar to the RR in patients without HF and without CVD: 0.60 (95% CI, 0.42–0.83), whereas the RR in patients with both HF and CVD was more attenuated toward the null: 0.76 (95% CI, 0.60–0.91). As expected, 2‐year mortality was highest in patients with HF and CVD: 5.5% among SGLT‐2i and 6.4% among GLP‐1RA initiators (Table S12). Approximately 45% to 50% of patients were censored because of treatment discontinuation, switching, or augmentation with the comparator drug before the maximum follow‐up period of 2 years (Table S13). ITT analyses produced similar patterns of estimates across subgroups, although in general slightly attenuated toward the null compared with AT (Table S14).
For analyses of MACE outcomes, we observed PS‐weighted RR of 1.31 (95% CI, 1.09–1.56) among patients with no history of HF or evidence of atherosclerotic CVD based on 242 and 185 events in SGLT2i and GLP‐1RA initiators, respectively. Estimates were similar among patients with HF but no CVD, with weighted RR: 1.21 (95% CI, 0.75–1.94). In the subgroup of patients with history of both HF and CVD, the PS‐weighted RR was 0.83 (95% CI, 0.71–0.97) based on the 207 and 331 events in SGLT2i and GLP‐1RA initiators. Risk differences produced similar patterns of estimates. The risk of MACE plus HHF outcome was lower among SGLT2i versus GLP‐1RA in patients with history of HF, with RRs ranging from 0.73 to 0.85, whereas the risk was similar between treatment groups in those with no history of HF: RRs ranged from 0.95 to 1.14 (Figure 2).
Using the Desai et al algorithm, 24.3% of HF outcome events were classified as HF with reduced ejection fraction, the rest being classified as HF with preserved ejection fraction. Negative control outcomes produced near‐null estimates, except in a group with a small number of events (Table S15). We reestimated RRs and risk differences for primary outcomes among patients with no prevalent cancers (ie, negative control outcome) at baseline, and estimates are similar (Tables S16 and S17). Varying the outcome definitions to define HHF, MACE, and stroke definitions produced similar estimates across all subgroups (Figures S6 through S8). Varying baseline CVD and HF definitions produced similar subgroup‐specific estimates to the primary analyses (Tables S18 through S20). Limiting baseline CVD codes to inpatient setting produced similar findings and so did allowing time‐varying covariates in censoring weight models and extending the follow‐up to all‐available years (Tables S21 through S23). Inclusion of cardiac revascularization procedures in the MACE definitions produced consistent estimates (Tables S24 and S25). Other sensitivity analyses, such as exclusion of prevalent HHF and MACE outcome dates within 2 months of drug initiation date and examining health care use patterns after drug initiation, produced findings that support the primary analysis (Tables S26 through S29). Analyses after excluding exenatide and comparison of cardiovascular outcomes between canagliflozin and liraglitude produced similar findings to the primary (Tables S30 and S31). The trends in outcome risk were stable over time, showing that ICD‐10‐CM transition in 2015 did not materially change the outcome incidence, consistent with prior published findings. 27 Inverse probability–weighted subdistribution HRs from Fine and Gray Cox model are also similar to 2‐year RRs (Table S29).
Discussion
In our large population‐based cohort study, we found evidence that SGLT2i initiators compared with GLP‐1RA had a lower risk of HHF in all subgroups (with or without HF and/or CVD) and, to a lesser extent, HHF+MACE particularly in those patients with HF with or without atherosclerotic CVD. The estimated effects on MACE are comparable but generally more favorable toward GLP‐1RA, except in a group with both CVD and HF. Our findings extend evidence from the large body of cardiovascular outcome trials documenting the CVD and HF benefits of SGLT2i and GLP‐1RA compared with placebo by examining the comparative effectiveness of the 2 classes. We believe these findings can help inform clinicians about the optimal choice of cardioprotective antihyperglycemic medications in patients with varying background CVDs.
Dapagliflozin is the first SGLT2i to be approved by the US Food and Drug Administration for treatment in patients with HF with reduced ejection fraction. 41 Analyses of placebo‐controlled, randomized trials suggest that protective effects of SGLT2i on HHF and MACE may be restricted to those with established HF with reduced ejection fraction, whereas benefits on stroke are uncertain. 42 In general, SGLT2i effects on HHF are more compelling than their effects on MACE outcomes, whereas GLP‐1RA effects seem to be stronger for MACE outcomes, with their effects on HHF inconsistent across trials. 7 , 8 , 9 , 11 , 12 , 13 Subgroup analyses from trials demonstrate MACE effects of GLP‐1RA more consistently among those with established CVD. 11 , 12 , 14 Prior meta‐analysis of clinical trial data suggested that the beneficial effects of SGLT2i (and, to a lesser extent, GLP‐1RA) on MACE relative to placebo are more uncertain in regional subgroup analysis in North America. 43 A nonexperimental study, based on US Medicare data, also reported findings similar to ours, although our subgroup definitions and analytical approaches are different. 44
Recently, the evidence from the empagliflozin trials suggested that it reduced the relative risk of HHF to a similar extent in patients with HF with reduced ejection fraction and in patients with HF with preserved ejection fraction. 46 , 47 Following these estimates, we would expect the same benefits of SGLT2i on HHF in patients with HF with reduced ejection fraction and HF with preserved ejection fraction. 46 , 47
Our findings are consistent with those from randomized trials and prior claims‐based studies, although prior studies have not as explicitly examined the head‐to‐head efficacy of SGLT2i and GLP‐1RA for cardiovascular events among subgroups defined by varying burden of prevalent CVD diagnoses. We estimated beneficial effects of SGLT2i over GLP‐1RA for HHF outcomes in all subgroups and for MACE and mortality among those with a history of both CVD and HF. On the other hand, GLP‐1RA were more favorable than SGLT2i for MACE outcomes and stroke, and to a lower extent for MI and mortality, in those without documented CVD or HF. For the composite of HHF+MACE, the risk difference is relatively large (>2%) to the benefit of SGLT2i for patients with HF with or without CVD; on the other hand, the risk difference is relatively small (<0.5%) and statistically not significant to the benefit of GLP‐1RA for patients without HF with or without CVD. In this study, we examined the 3‐way interaction of SGLT2i with history of HF and/or atherosclerotic CVD, with an aim to estimate the valid treatment effects and help guide treatment decision making among subpopulations of interest. While most trials have a median follow‐up of 3 years, our study is limited by real‐world drug use patterns because the median treatment duration in our Medicare population is 1 year. We allowed maximum follow‐up of up to 5 years in sensitivity analyses and both AT and ITT analyses supported our primary findings.
We used validated claims‐based algorithms to identify baseline subgroups. These validation algorithms vary in setting, sensitivity, and specificity but in general show high specificity (70%–95%) of codes for ischemic heart diseases, stroke, peripheral vascular diseases, and HF (see Tables S1, S3 through S6 for codes and their validity). 19 , 20 , 21 , 22 , 23 , 24 , 26 , 27 We varied the claims‐based conditions used to define subgroups in sensitivity analyses to study their impact on subgroup estimates; and findings were consistent with the primary estimates in our study (Tables S18 through S20). We also limited codes for these baseline conditions to inpatient settings only to better reflect prior validation studies and to increase the accuracy of codes; and these analyses (Tables S21) showed similar findings to primary analyses.
Our restriction of the study population to new users reduced the available sample size, yet it avoids immortal time and other time‐related biases by allowing us to anchor our follow‐up on the timing of drug initiation. 18 , 25 , 48 It allows us to emulate randomized clinical trials, because the initiation of drugs and the beginning of follow‐up were synchronized, while reducing biases associated with long‐term (prevalent) drug use, such as the healthy user/adherer bias and depletion of susceptibles. 48
Head‐to‐head comparison with alternative second‐line medications (SGLT2i and GLP‐1RA in this case) also reduced the potential for confounding by indication by limiting the study comparison to patients with similar indications and similar disease progression (underlying disease severity). 18 Remaining confounding should be minimized by using propensity score–based approaches that allow us to control for a wide range of covariates in various health care settings.
Nonetheless, our observational cohort study could still experience unmeasured or residual confounding attributable to diabetes or CVD severity, given the lack of clinically relevant biomarkers in claims data. We used the results from a prior claims‐based validation study to control for diabetes severity, by adjusting for the number of classes of antihyperglycemic medication use, microvascular or macrovascular complications (nephropathy, neuropathy, retinopathy, peripheral vascular complications, and amputation), hypoglycemia, and the number of hyperglycemia‐related diagnoses. The algorithm has been shown to balance risk factors related to diabetes severity in claims data. 49 We also controlled for conditions that have been shown in a prior study to predict HF severity. 40 Although we did not include hemoglobin A1C and lipid levels in our analyses, a subset (≈10%) of patients have Healthcare Common Procedure Coding System/CPT codes for categories of hemoglobin A1C, low‐density lipoproteins, and systolic and diastolic blood pressures. We measured their distributions across our treatment cohorts, and they were balanced before and after PS weighting (Table and Table S7). We also included markers of frailty following a prior algorithm to minimize concerns that older, frail patients might not be prescribed beneficial medications and have worse clinical outcomes. 50
We tailored confounding control in each subgroup by estimating PS separately and applied treatment and censoring weights in each subgroup. This approach allows us to control confounding and informative censoring attributable to treatment nonadherence separately within each subgroup, instead of assuming that PS estimated in the whole cohort could balance covariates within each subgroup. We conducted both ITT and AT analyses using both time‐fixed and time‐varying predictors of treatment nonadherence, allowing variable follow‐up times; and all sensitivity analyses supported our primary findings (Tables S14, S22, and S23). We also observed the similar distribution of baseline characteristics among patients who dropped out because of treatment changes versus those who did not, supporting our assumption that censoring of patients because of treatment nonadherence might not lead to selection bias (data not presented).
Because failure to deal with death as a competing event could result in overestimation of risks, especially in older, vulnerable populations, we used PS weighting approach using the Aalen Johansen estimator that allows us to estimate accurate risks without making the implausible assumption that death could be eliminated. 37 , 39 Yet, our analyses could be biased if the risk of death is higher in one treatment group versus another, especially in groups with evidence of both atherosclerotic CVDs and HF, where the risk of mortality is high. However, the proportion of patients who died without having the outcomes of interest is relatively similar across treatment groups, minimizing such concerns (Table S12).
We relied on outcome definitions using ICD‐9‐CM, ICD‐10‐CM, Healthcare Common Procedure Coding System, or CPT codes, with high specificity and positive predictive values that have been validated in Medicare or similar claims data, against electronic health records or population‐based cohort studies (eg, ARIC [Atherosclerosis Risk in Communities] study). 19 , 22 , 24 Highly specific definitions have been shown to minimize bias in RR attributable to outcome misclassification. 39 We only focused on the first hospitalization event following drug initiation, and our models did not account for recurrent events.
We also used negative control (falsifying) outcomes that are known to be not affected by either SGLT‐2i or GLP‐1RA, with the assumption that if the confounding structure is similar and our confounding control is sufficient, we should be able to observe null effects. Indeed, estimates for all‐cancer incidence were near null across subgroups (Table S15), supporting the strength of our study design and analytical approaches. 31 Cancer and cardiovascular outcomes share many risk factors; therefore, any deviations from the null estimate should reflect the insufficient confounding control in analyses of primary outcomes, apart from random variability. 31 Estimates for cataract surgery outcomes were also near null across subgroups, allowing us to estimate effects with higher precision than cancer outcomes (Table S15).
Our study provides evidence that complements cardiovascular outcome trials and recent observational studies. 45 , 52 , 53 , 54 Compared with trial populations, our Medicare fee‐for‐service populations have overall higher average age, higher burden of multimorbidity and frailty, and lower burden of established CVDs, and thus our estimates are more generalizable to older and vulnerable populations in routine care in the United States. The RCT‐DUPLICATE (Randomized Controlled Trials Duplicated Using Prospective Longitudinal Insurance Claims: Applying Techniques of Epidemiology) initiative, funded by the US Food and Drug Administration, is the systematic effort to replicate trial findings in real‐world data; and recent findings reported that agreement in findings between trials and real‐world evidence varies across studies. However, cardiovascular outcome studies on patients with diabetes using active comparators with similar indications and use patterns (as used in our study) were shown to produce estimates close to trial findings. 54 Another real‐world study using Medicare and commercial claims data aimed to predict Carolina trial findings reported the effect estimates of linagliptin versus glimepiride on MACE and 2 control (a positive and a negative) outcomes before the trial finished, and they were ultimately shown to be consistent with trial findings. 55
In conclusion, we observed variations in treatment effect estimates across patient subgroups defined by history of atherosclerotic CVD and HF. Well‐designed nonexperimental studies with validated claims‐based algorithms in routine clinical care settings could be useful to help guide clinicians and policy makers on the optimal choice of medications. Further studies on the topic could shed lights on the potential cardioprotective mechanism of these antihyperglycemic agents as well as support the optimal prescribing practices in older, vulnerable patients with varying underlying cardiovascular comorbidities.
Sources of Funding
This project is not funded. The database infrastructure used for this project was funded by the Department of Epidemiology, University of North Carolina at Chapel Hill, Gillings School of Global Public Health; the Cecil G. Sheps Center for Health Services Research, UNC; the Comparative Effectiveness Research Strategic Initiative of UNC’s Clinical and Translational Science Award (UL1TR002489); and the UNC School of Medicine.
Disclosures
Dr Stürmer receives investigator‐initiated research funding and support as Principal Investigator (R01 AG056479) from the National Institute on Aging, and as Co‐Investigator (R01 HL118255 and R01MD011680), National Institutes of Health. He also receives salary support as Director of Comparative Effectiveness Research, NC TraCS Institute, UNC Clinical and Translational Science Award (UL1TR002489), the Center for Pharmacoepidemiology (current members: GlaxoSmithKline, UCB BioSciences, Takeda, AbbVie, and Boehringer Ingelheim), from pharmaceutical companies (Novo Nordisk), and from a generous contribution from Dr Nancy A. Dreyer to the Department of Epidemiology, University of North Carolina at Chapel Hill. Dr Stürmer does not accept personal compensation of any kind from any pharmaceutical company. He owns stock in Novartis, Roche, and Novo Nordisk. Dr Buse’s contracted consulting fees and travel support for contracted activities are paid to the University of North Carolina by Adocia, AstraZeneca, Eli Lilly, Intarcia Therapeutics, MannKind, Novo Nordisk, Sanofi, Senseonics, and vTv Therapeutics; he reports grant support from AstraZeneca, Dexcom, Eli Lilly, Intarcia Therapeutics, Johnson & Johnson, Lexicon, NovaTarg, Novo Nordisk, Sanofi, Theracos, Tolerion, and vTv Therapeutics; he has received fees for consultation from Anji Pharmaceuticals, AstraZeneca, Boehringer Ingelheim, Cirius Therapeutics Inc, Eli Lilly, Fortress Biotech, Janssen, Mellitus Health, Moderna, Pendulum Therapeutics, Praetego, Stability Health, and Zealand Pharma; he holds stock/options in Mellitus Health, Pendulum Therapeutics, PhaseBio, Praetego, and Stability Health; and he is supported by grants from the National Institutes of Health, Patient Centered Outcomes Research Institute, Juvenile Diabetes Research Foundation International, and the American Diabetes Association. Dr Cavender has received research support from Amgen, AstraZeneca, Chiesi, GlaxoSmithKline, Novartis, CSL Behring, and Novo Nordisk; he has also received modest consulting fees from Amgen, AstraZeneca, Boehringer Ingelheim, Boston Scientific, Edwards Lifesciences, Merck, and Sanofi‐Aventis.
Supporting information
Tables S1–S31
Figures S1–S8
Acknowledgments
Dr Htoo contributed to study design, data collection, statistical analysis, data interpretation, and drafting of the manuscript. Dr Buse and Dr Stürmer contributed to study design, data interpretation, and critical review of the manuscript. Dr Edwards and Dr Wang contributed to statistical analysis, data interpretation, and critical review of the manuscript. Dr Cavender contributed to data interpretation and critical review of the manuscript. Dr Htoo is the guarantor of this work and, as such, had full access to all the data in the study and takes responsibility for the integrity of the data and the accuracy of the data analysis. All authors have given permission to be named in this manuscript.
Supplemental Material for this article is available at https://www.ahajournals.org/doi/suppl/10.1161/JAHA.121.022376
For Sources of Funding and Disclosures, see page 16.
References
- 1. Centers for Disease Control and Prevention National diabetes statistics report, 2020. 2020. Available at: https://www.cdc.gov/diabetes/pdfs/data/statistics/national‐diabetes‐statistics‐report.pdf. Accessed June 08, 2021.
- 2. Kannel WB, McGee DL. Diabetes and cardiovascular disease: the Framingham study. JAMA. 1979;241:2035–2038. doi: 10.1001/jama.1979.03290450033020 [DOI] [PubMed] [Google Scholar]
- 3. Sarwar N, Gao P, Seshasai SR, Gobin R, Kaptoge S, Di Angelantonio E, Ingelsson E, Lawlor DA, Selvin E, Stampfer M, et al. Diabetes mellitus, fasting blood glucose concentration, and risk of vascular disease: a collaborative meta‐analysis of 102 prospective studies. Lancet. 2010;375:2215–2222. doi: 10.1016/S0140-6736(10)60484-9 [DOI] [PMC free article] [PubMed] [Google Scholar]
- 4. The Emerging Risk Factors Collaboration . Association of cardiometabolic multimorbidity with mortality. JAMA. 2015;314:52–60. doi: 10.1001/jama.2015.7008 [DOI] [PMC free article] [PubMed] [Google Scholar]
- 5. Das SR, Everett BM, Birtcher KK, Brown JM, Januzzi JL, Kalyani RR, Kosiborod M, Magwire M, Morris PB, Neumiller JJ, et al. 2020 Expert consensus decision pathway on novel therapies for cardiovascular risk reduction in patients with type 2 diabetes: a report of the American College of Cardiology solution set oversight committee. J Am Coll Cardiol. 2020;76:1117–1145. doi: 10.1016/j.jacc.2020.05.037 [DOI] [PMC free article] [PubMed] [Google Scholar]
- 6. US Food and Drug Administration . Sodium‐glucose cotransporter‐2 (sglt2) inhibitors. 2020;2020. Available at: https://www.fda.gov/drugs/postmarket‐drug‐safety‐information‐patients‐and‐providers/sodium‐glucose‐cotransporter‐2‐sglt2‐inhibitors. Accessed June 08, 2021. [Google Scholar]
- 7. Zinman B, Wanner C, Lachin JM, Fitchett D, Bluhmki E, Hantel S, Mattheus M, Devins T, Johansen OE, Woerle HJ, et al. Empagliflozin, cardiovascular outcomes, and mortality in type 2 diabetes. N Engl J Med. 2015;373:2117–2128. doi: 10.1056/NEJMoa1504720 [DOI] [PubMed] [Google Scholar]
- 8. Neal B, Perkovic V, Mahaffey KW, de Zeeuw D, Fulcher G, Erondu N, Shaw W, Law G, Desai M, Matthews DR. Canagliflozin and cardiovascular and renal events in type 2 diabetes. N Engl J Med. 2017;377:644–657. doi: 10.1056/NEJMoa1611925 [DOI] [PubMed] [Google Scholar]
- 9. Wiviott SD, Raz I, Bonaca MP, Mosenzon O, Kato ET, Cahn A, Silverman MG, Zelniker TA, Kuder JF, Murphy SA, et al. Dapagliflozin and cardiovascular outcomes in type 2 diabetes. N Engl J Med. 2018;380:347–357. doi: 10.1056/NEJMoa1812389 [DOI] [PubMed] [Google Scholar]
- 10. McMurray JJV, Solomon SD, Inzucchi SE, Køber L, Kosiborod MN, Martinez FA, Ponikowski P, Sabatine MS, Anand IS, Bělohlávek J, et al. Dapagliflozin in patients with heart failure and reduced ejection fraction. N Engl J Med. 2019;381:1995–2008. doi: 10.1056/NEJMoa1911303 [DOI] [PubMed] [Google Scholar]
- 11. Marso SP, Bain SC, Consoli A, Eliaschewitz FG, Jódar E, Leiter LA, Lingvay I, Rosenstock J, Seufert J, Warren ML, et al. Semaglutide and cardiovascular outcomes in patients with type 2 diabetes. N Engl J Med. 2016;375:1834–1844. doi: 10.1056/NEJMoa1607141 [DOI] [PubMed] [Google Scholar]
- 12. Marso SP, Daniels GH, Brown‐Frandsen K, Kristensen P, Mann JFE, Nauck MA, Nissen SE, Pocock S, Poulter NR, Ravn LS, et al. Liraglutide and cardiovascular outcomes in type 2 diabetes. N Engl J Med. 2016;375:311–322. doi: 10.1056/NEJMoa1603827 [DOI] [PMC free article] [PubMed] [Google Scholar]
- 13. Holman RR, Bethel MA, Mentz RJ, Thompson VP, Lokhnygina Y, Buse JB, Chan JC, Choi J, Gustavson SM, Iqbal N, et al. Effects of once‐weekly exenatide on cardiovascular outcomes in type 2 diabetes. N Engl J Med. 2017;377:1228–1239. doi: 10.1056/NEJMoa1612917 [DOI] [PMC free article] [PubMed] [Google Scholar]
- 14. Gerstein HC, Colhoun HM, Dagenais GR, Diaz R, Lakshmanan M, Pais P, Probstfield J, Riesmeyer JS, Riddle MC, Rydén L, et al. Dulaglutide and cardiovascular outcomes in type 2 diabetes (rewind): a double‐blind, randomised placebo‐controlled trial. Lancet. 2019;394:121–130. doi: 10.1016/S0140-6736(19)31149-3 [DOI] [PubMed] [Google Scholar]
- 15. American Diabetes Association . 9. Pharmacologic approaches to glycemic treatment: standards of medical care in diabetes‐2020. Diabetes Care. 2020;43:S98–S110. [DOI] [PubMed] [Google Scholar]
- 16. Boye KS, Riddle MC, Gerstein HC, Mody R, Garcia‐Perez LE, Karanikas CA, Lage MJ, Riesmeyer JS, Lakshmanan MC. Generalizability of glucagon‐like peptide‐1 receptor agonist cardiovascular outcome trials to the overall type 2 diabetes population in the United States. Diabetes Obes Metab. 2019;21:1299–1304. doi: 10.1111/dom.13649 [DOI] [PMC free article] [PubMed] [Google Scholar]
- 17. Rådholm K, Figtree G, Perkovic V, Solomon SD, Mahaffey KW, de Zeeuw D, Fulcher G, Barrett TD, Shaw W, Desai M, et al. Canagliflozin and heart failure in type 2 diabetes mellitus. Circulation. 2018;138:458–468. doi: 10.1161/CIRCULATIONAHA.118.034222 [DOI] [PMC free article] [PubMed] [Google Scholar]
- 18. Lund JL, Richardson DB, Stürmer T. The active comparator, new user study design in pharmacoepidemiology: historical foundations and contemporary application. Curr Epidemiol Rep. 2015;2:221–228. doi: 10.1007/s40471-015-0053-5 [DOI] [PMC free article] [PubMed] [Google Scholar]
- 19. Kiyota Y, Schneeweiss S, Glynn RJ, Cannuscio CC, Avorn J, Solomon DH. Accuracy of Medicare claims‐based diagnosis of acute myocardial infarction: estimating positive predictive value on the basis of review of hospital records. Am Heart J. 2004;148:99–104. doi: 10.1016/j.ahj.2004.02.013 [DOI] [PubMed] [Google Scholar]
- 20. Fan J, Arruda‐Olson AM, Leibson CL, Smith C, Liu G, Bailey KR, Kullo IJ. Billing code algorithms to identify cases of peripheral artery disease from administrative data. J Am Med Inform Assoc. 2013;20:e349–e354. doi: 10.1136/amiajnl-2013-001827 [DOI] [PMC free article] [PubMed] [Google Scholar]
- 21. Loehr LR, Agarwal SK, Baggett C, Wruck LM, Chang PP, Solomon SD, Shahar E, Ni H, Rosamond WD, Heiss G. Classification of acute decompensated heart failure: an automated algorithm compared with a physician reviewer panel: the Atherosclerosis Risk in Communities study. Circ Heart Fail. 2013;6:719–726. doi: 10.1161/CIRCHEARTFAILURE.112.000195 [DOI] [PMC free article] [PubMed] [Google Scholar]
- 22. Jones SA, Gottesman RF, Shahar E, Wruck L, Rosamond WD. Validity of hospital discharge diagnosis codes for stroke: the Atherosclerosis Risk in Communities study. Stroke. 2014;45:3219–3225. doi: 10.1161/STROKEAHA.114.006316 [DOI] [PMC free article] [PubMed] [Google Scholar]
- 23. McCormick N, Lacaille D, Bhole V, Avina‐Zubieta JA. Validity of myocardial infarction diagnoses in administrative databases: a systematic review. PLoS One. 2014;9:e92286. doi: 10.1371/journal.pone.0092286 [DOI] [PMC free article] [PubMed] [Google Scholar]
- 24. Kucharska‐Newton AM, Heiss G, Ni H, Stearns SC, Puccinelli‐Ortega N, Wruck LM, Chambless L. Identification of heart failure events in Medicare claims: the Atherosclerosis Risk in Communities (ARIC) study. J Card Fail. 2016;22:48–55. doi: 10.1016/j.cardfail.2015.07.013 [DOI] [PMC free article] [PubMed] [Google Scholar]
- 25. Edwards JK, Htoo PT, Stürmer T. Keeping the demons at bay when handling time varying exposures: beyond avoiding immortal person time. Am J Epidemiol. 2019;188:1016–1022. doi: 10.1093/aje/kwz066 [DOI] [PMC free article] [PubMed] [Google Scholar]
- 26. Birman‐Deych E, Waterman AD, Yan Y, Nilasena DS, Radford MJ, Gage BF. Accuracy of ICD‐9‐CM codes for identifying cardiovascular and stroke risk factors. Med Care. 2005;43:480–485. doi: 10.1097/01.mlr.0000160417.39497.a9 [DOI] [PubMed] [Google Scholar]
- 27. McCormick N, Bhole V, Lacaille D, Avina‐Zubieta JA. Validity of diagnostic codes for acute stroke in administrative databases: a systematic review. PLoS One. 2015;10:e0135834. doi: 10.1371/journal.pone.0135834 [DOI] [PMC free article] [PubMed] [Google Scholar]
- 28. Centers for Disease Control and Prevention . National diabetes fact sheet: general information and national estimates on diabetes in the United States, 2007. 2008. Available at: https://www.cdc.gov/diabetes/resources‐publications/index.html?CDC_AA_refVal=https%3A%2F%2Fwww.cdc.gov%2Fdiabetes%2Fpubs%2Findex.html. Accessed June 08, 2021.
- 29. Panozzo CA, Woodworth TS, Welch EC, Huang T‐Y, Her QL, Haynes K, Rogers C, Menzin TJ, Ehrmann M, Freitas KE, et al. Early impact of the ICD‐10‐CM transition on selected health outcomes in 13 electronic health care databases in the United States. Pharmacoepidemiol Drug Saf. 2018;27:839–847. doi: 10.1002/pds.4563 [DOI] [PubMed] [Google Scholar]
- 30. Research Data Assistance Center (ResDAC) . Death information in the research identifiable Medicare data. 2020;2020. Available at: https://requests.resdac.org/articles/death‐information‐research‐identifiable‐medicare‐data. Accessed June 08, 2021. [Google Scholar]
- 31. Lipsitch M, Tchetgen Tchetgen E, Cohen T. Negative controls: a tool for detecting confounding and bias in observational studies. Epidemiology. 2010;21:383–388. doi: 10.1097/EDE.0b013e3181d61eeb [DOI] [PMC free article] [PubMed] [Google Scholar]
- 32. Chubak J, Pocobelli G, Weiss NS. Tradeoffs between accuracy measures for electronic health care data algorithms. J Clin Epidemiol. 2012;65:343–349.e342. doi: 10.1016/j.jclinepi.2011.09.002 [DOI] [PMC free article] [PubMed] [Google Scholar]
- 33. Setoguchi S, Solomon DH, Glynn RJ, Cook EF, Levin R, Schneeweiss S. Agreement of diagnosis and its date for hematologic malignancies and solid tumors between Medicare claims and cancer registry data. Cancer Causes Control. 2007;18:561–569. doi: 10.1007/s10552-007-0131-1 [DOI] [PubMed] [Google Scholar]
- 34. Rosenbaum PR, Rubin DB. The central role of the propensity score in observational studies for causal effects. Biometrika. 1983;70:41–55. doi: 10.1093/biomet/70.1.41 [DOI] [Google Scholar]
- 35. Robins J. A new approach to causal inference in mortality studies with a sustained exposure period—application to control of the healthy worker survivor effect. Math Model. 1986;7:1393–1512. doi: 10.1016/0270-0255(86)90088-6 [DOI] [Google Scholar]
- 36. Austin PC. An introduction to propensity score methods for reducing the effects of confounding in observational studies. Multivar Behav Res. 2011;46:399–424. doi: 10.1080/00273171.2011.568786 [DOI] [PMC free article] [PubMed] [Google Scholar]
- 37. Cole SR, Lau B, Eron JJ, Brookhart MA, Kitahata MM, Martin JN, Mathews WC, Mugavero MJ, CNICS Research Network . Estimation of the standardized risk difference and ratio in a competing risks framework: application to injection drug use and progression to aids after initiation of antiretroviral therapy. Am J Epidemiol. 2015;181:238–245. doi: 10.1093/aje/kwu122 [DOI] [PMC free article] [PubMed] [Google Scholar]
- 38. Young JG, Stensrud MJ, Tchetgen Tchetgen EJ, Hernán MA. A causal framework for classical statistical estimands in failure‐time settings with competing events. Stat Med. 2020;39:1199–1236. doi: 10.1002/sim.8471 [DOI] [PMC free article] [PubMed] [Google Scholar]
- 39. Lash TL, VanderWeele TJ, Haneuse S, Rothman KJ. Modern Epidemiology. Lippincott Williams & Wilkins; 2020. [Google Scholar]
- 40. Desai Rishi J, Lin Kueiyu J, Patorno E, Barberio J, Lee M, Levin R, Evers T, Wang Shirley V, Schneeweiss S. Development and preliminary validation of a Medicare claims–based model to predict left ventricular ejection fraction class in patients with heart failure. Circ Cardiovasc Qual Outcomes. 2018;11:e004700. doi: 10.1161/CIRCOUTCOMES.118.004700 [DOI] [PubMed] [Google Scholar]
- 41. Cole SR, Hernán MA. Constructing inverse probability weights for marginal structural models. Am J Epidemiol 2008;168:656–64. [DOI] [PMC free article] [PubMed] [Google Scholar]
- 42. US Food and Drug Administration FDA approves new treatment for a type of heart failure. 2020;2021. Available at: https://www.fda.gov/news‐events/press‐announcements/fda‐approves‐new‐treatment‐type‐heart‐failure. Accessed June 08, 2021.
- 43. Zhou Z, Lindley RI, Rådholm K, Jenkins B, Watson J, Perkovic V, Mahaffey KW, de Zeeuw D, Fulcher G, Shaw W, et al. Canagliflozin and stroke in type 2 diabetes mellitus. Stroke. 2019;50:396–404. doi: 10.1161/STROKEAHA.118.023009 [DOI] [PMC free article] [PubMed] [Google Scholar]
- 44. Qiu M, Ding L, Wei X, Wei W, Zhou H. Effects of glucagon‐like peptide 1 receptor agonists and sodium glucose cotransporter 2 inhibitors on major adverse cardiovascular events in type 2 diabetes by race, ethnicity, and region: a meta‐analysis. Medicine (Baltimore). 2020;99:e23489. doi: 10.1097/MD.0000000000023489 [DOI] [PMC free article] [PubMed] [Google Scholar]
- 45. Patorno E, Pawar A, Bessette LG, Kim DH, Dave C, Glynn RJ, Munshi MN, Schneeweiss S, Wexler DJ, Kim SC. Comparative effectiveness and safety of sodium–glucose cotransporter 2 inhibitors versus glucagon‐like peptide 1 receptor agonists in older adults. Diabetes Care. 2021;44:826–835. doi: 10.2337/dc20-1464 [DOI] [PMC free article] [PubMed] [Google Scholar]
- 46. Anker SD, Butler J, Filippatos G, Ferreira JP, Bocchi E, Böhm M, Brunner–La Rocca H‐P, Choi D‐J, Chopra V, Chuquiure‐Valenzuela E, et al. Empagliflozin in heart failure with a preserved ejection fraction. N Engl J Med. 2021;385:1451–1461. doi: 10.1056/NEJMoa2107038 [DOI] [PubMed] [Google Scholar]
- 47. Packer M, Anker SD, Butler J, Filippatos G, Pocock SJ, Carson P, Januzzi J, Verma S, Tsutsui H, Brueckmann M, et al. Cardiovascular and renal outcomes with empagliflozin in heart failure. N Engl J Med. 2020;383:1413–1424. doi: 10.1056/NEJMoa2022190 [DOI] [PubMed] [Google Scholar]
- 48. Ray WA. Evaluating medication effects outside of clinical trials: new‐user designs. Am J Epidemiol. 2003;158:915–920. doi: 10.1093/aje/kwg231 [DOI] [PubMed] [Google Scholar]
- 49. Hernán MA, Sauer BC, Hernández‐Díaz S, Platt R, Shrier I. Specifying a target trial prevents immortal time bias and other self‐inflicted injuries in observational analyses. J Clin Epidemiol. 2016;79:70–75. doi: 10.1016/j.jclinepi.2016.04.014 [DOI] [PMC free article] [PubMed] [Google Scholar]
- 50. Patorno E, Gopalakrishnan C, Franklin JM, Brodovicz KG, Masso‐Gonzalez E, Bartels DB, Liu J, Schneeweiss S. Claims‐based studies of oral glucose‐lowering medications can achieve balance in critical clinical variables only observed in electronic health records. Diabetes Obes Metab. 2018;20:974–984. doi: 10.1111/dom.13184 [DOI] [PMC free article] [PubMed] [Google Scholar]
- 51. Faurot KR, Jonsson Funk M, Pate V, Brookhart MA, Patrick A, Hanson LC, Castillo WC, Sturmer T. Using claims data to predict dependency in activities of daily living as a proxy for frailty. Pharmacoepidemiol Drug Saf. 2015;24:59–66. doi: 10.1002/pds.3719 [DOI] [PMC free article] [PubMed] [Google Scholar]
- 52. Kohsaka S, Lam CSP, Kim DJ, Cavender MA, Norhammar A, Jørgensen ME, Birkeland KI, Holl RW, Franch‐Nadal J, Tangri N, et al. Risk of cardiovascular events and death associated with initiation of sglt2 inhibitors compared with dpp‐4 inhibitors: an analysis from the CVD‐real 2 multinational cohort study. Lancet Diabetes Endocrinol. 2020;8:606–615. doi: 10.1016/S2213-8587(20)30130-3 [DOI] [PubMed] [Google Scholar]
- 53. Longato E, Di Camillo B, Sparacino G, Gubian L, Avogaro A, Fadini GP. Cardiovascular outcomes of type 2 diabetic patients treated with SGLT‐2 inhibitors versus GLP‐1 receptor agonists in real‐life. BMJ Open Diabetes Res Care. 2020;8:e001451. doi: 10.1136/bmjdrc-2020-001451 [DOI] [PMC free article] [PubMed] [Google Scholar]
- 54. Wei XB, Wei W, Ding LL, Liu SY. Comparison of the effects of 10 GLP‐1 RA and SGLT2 inhibitor interventions on cardiovascular, mortality, and kidney outcomes in type 2 diabetes: a network meta‐analysis of large randomized trials. Prim Care Diabetes. 2021;15:208–211. doi: 10.1136/bmjdrc-2020-001451 [DOI] [PubMed] [Google Scholar]
- 55. Franklin JM, Patorno E, Desai RJ, Glynn RJ, Martin D, Quinto K, Pawar A, Bessette LG, Lee H, Garry EM, et al. Emulating randomized clinical trials with nonrandomized real‐world evidence studies: first results from the RCT duplicate initiative. Circulation. 2021;143:1002–1013. doi: 10.1161/CIRCULATIONAHA.120.051718 [DOI] [PMC free article] [PubMed] [Google Scholar]
- 56. Patorno E, Schneeweiss S, Gopalakrishnan C, Martin D, Franklin JM. Using real‐world data to predict findings of an ongoing phase IV cardiovascular outcome trial: cardiovascular safety of linagliptin versus glimepiride. Diabetes Care. 2019;42:2204–2210. [DOI] [PMC free article] [PubMed] [Google Scholar]
Associated Data
This section collects any data citations, data availability statements, or supplementary materials included in this article.
Supplementary Materials
Tables S1–S31
Figures S1–S8