Abstract
Objectives:
Neoadjuvant chemotherapy (NAC) is the frequently used treatment option for locally advanced breast cancer (LABC). This study investigated the potential value of 18fluorine-fluorodeoxyglucose (18F-FDG) positron emission tomography/computed tomography (PET/CT) to estimate the pathological complete response (pCR) using maximum standardized uptake value (SUVmax) and change (ΔSUVmax) after 3-4 cycles of NAC. Additionally, it was established the relationship between PET/CT imaging findings and histopathological features in LABC patients whose treatment response was evaluated with interim PET/CT.
Methods:
Patients were evaluated with pretreatment and interim PET/CT scans and operated after on NAC. Data on the age of patients, menopausal status, tumor placement, histopathological and molecular subgroups were noted. SUVmax and ΔSUVmax of the primary tumor and axillary lymph node (ALN) were calculated from PET/CT review.
Results:
Pretherapy mean SUVmax of the primary tumor and ALNs were 8.13±4.25 and 7.22±3.58, respectively. The highest mean primary tumor ΔSUVmax and ALN ΔSUVmax values were observed to be human epidermal growth factor receptor 2 positivity (p<0.001). SUVmax-T, SUVmax-N, ΔSUVmax-T, and ΔSUVmax-N values were significantly correlated with the ki-67 index (p<0.001). ΔSUVmax-T and ΔSUVmax-N values of pCR (+) patients were statistically higher than the ΔSUVmax-T and ΔSUVmax-N values of pCR (-) patients (p<0.001).
Conclusion:
An earlier and more accurate response to NAC can be performed using interim 18F-FDG PET/CT imaging. ΔSUVmax levels of the breast tumor and ALNs may act as predictive for pCR in LABC patients receiving NAC.
Keywords: Neoadjuvant chemotherapy, 18F-fluorodeoxyglucose, positron emission tomography, breast cancer
Abstract
Amaç:
Neoadjuvan kemoterapi (NAK) lokal ileri meme kanseri (LİMK) tedavisinde sıklıkla başvurulan tedavi seçeneğidir. Bu çalışmada, LİMK tanısı ile NAK alan hastalarda bazal 18flor-florodeoksiglukoz (18F-FDG) pozitron emisyon tomografisi/bilgisayarlı tomografi (PET/BT), maksimum standart alım değerinin (SUVmaks) ve 3-4 kür NAK sonrası SUVmaks değişiminin (ΔSUVmaks) patolojik tam yanıtı (pTY) öngörmedeki potansiyel değerini belirlemek, ikincil olarak PET/BT ile ara tedavi yanıtı değerlendirilen LİMK hastalarında görüntüleme bulgularıyla histopatolojik özellikler arasındaki ilişkiyi değerlendirmek amaçlandı.
Yöntem:
Hastalar tedavi öncesi ve interim tedavi sonrası 18F-FDG PET/BT görüntüleme ile değerlendirildi ve NAK sonrası opere edildi. Hastaların yaşı, menopoz durumu, tümör lokalizasyonu, histopatolojik ve moleküler alt tipi ile ilgili veriler kaydedildi. PET/BT görüntülerinden primer tümör ve aksiller lenf nodları (ALN) için SUVmaks ve ΔSUVmaks hesaplandı.
Bulgular:
Primer tümör ve ALN’nin tedavi öncesi ortalama SUVmaks değerleri sırasıyla; 8,13±4,25 ve 7,22±3,58 idi. En yüksek ortalama primer tümör ΔSUVmaks ve ALN ΔSUVmaks değerlerinin insan epidermal büyüme faktör reseptörü 2 pozitifliğinde olduğu gözlendi (p<0,001). Ki-67 ile SUVmaks-T, SUVmaks-N, ΔSUVmaks -T ve ΔSUVmaks -N değerleri arasında korelasyon görüldü (p<0,001). PCR (+) hastalarında ΔSUVmaks -T ve ΔSUVmaks-N değerleri, pCR (-) hastalardan istatistiksel olarak daha yüksekti (p<0,001).
Sonuç:
İnterim 18F-FDG PET/BT görüntüleme ile daha erken ve daha doğru NAK yanıtı değerlendirilebilir. Primer tümör ve ALN ΔSUVmaks değerleri, NAK uygulanan LİMK hastalarında pTY için prediktör görev üstlenebilir.
Introduction
Breast cancer (BC) ranks first among women’s cancers in the world (1). Locally advanced breast cancer (LABC) is found in approximately one-third of patients at the time of diagnosis (2). The accepted multidisciplinary treatment approach in LABC includes preoperative neoadjuvant chemotherapy (NAC), followed by surgery and adjuvant systemic and local treatment steps (3). NAC is currently the first-line therapy for LABC and is increasingly preferred in early-stage patients. The advantages of NAC include enabling breast-conserving surgery (BCS) by shrinking the breast lesion, eliminating micrometastasis, evaluating drug resistance, and estimating the prognosis.
Positron emission tomography (PET) integrated with computed tomography (CT), is a hybrid modality that provides the three-dimensional distribution and quantitative volume of positron-emitting radionuclides in the human body, which has been widely used in the field of oncology in recent years (4). 18Fluorine-fluorodeoxyglucose (18F-FDG) is the most preferred radiopharmaceutical in oncological PET studies to demonstrate its increased glycolytic activity in cancer cells (5). Evaluation of treatment response and determination of chemosensitivity in the NAC patient group in the early period is important in terms of changing the treatment regimen, discontinuing unnecessary treatments and preventing possible drug toxicity and side effects.
18F-FDG PET/CT is a useful method for NAC response by evaluating decreased glucose metabolism in BC tissue. With the antitumor effect of chemotherapy, cellular glycolysis decreases before the appearance of shrinkage in the tumor (6). In this study, we aimed to evaluate the potential contribution of 18F-FDG PET/CT in predicting the pathological complete response (pCR) using maximum standardized uptake value (SUVmax) and change (ΔSUVmax) after 3-4 cycles of NAC in patients with LABC. Second, it was determined the relationship between PET/CT imaging findings and histopathological features in LABC patients whose treatment response was evaluated with interim PET/CT.
Materials and Methods
Patients
A total of 48 female patients [aged 29-68 years; mean ± standard deviation (SD): 49.4±9.5] diagnosed with LABC were evaluated retrospectively between October 2020 and September 2021 with 18F-FDG PET/CT imaging performed before and after interim NAC.
Each study participant signed the informed consent forms. The University of Health Sciences Turkey, Istanbul Training and Research Hospital, Clinical Research Ethics Committee approved (number: 2916, date: 10.09.2021) the study and Helsinki Declaration rules were followed to conduct this study.
18F-FDG PET/CT Imaging Protocol
Since the serum glucose level was below 150 mg/dL, 18F-FDG was injected intravenously at a dose of 3.7 MBq/kg. PET/CT imaging was obtained using a Discovery St PET/CT (General Electric, Milwaukee, WI, USA) scanner with routine imaging protocol. With the patient’s arms up, firstly CT scan was acquired with 2 mm section thickness in the craniocaudal direction between the vertex-upper thighs, and then a PET scan was received in 7-9 bed positions at the same interval, in the caudocranial direction.
Image Analysis
A semi-quantitative analysis method was used to evaluate PET/CT images by measuring the SUVmax for the primary breast tumor and axillary lymph nodes (ALNs) with increased 18F-FDG uptake on visual examination. Pre-treatment tumor SUVmax (SUVmax-T) and ALN SUVmax (SUVmax-N) values were calculated using the software with “region of interest” drawn on the most metabolically active areas on attenuation-corrected PET/CT images. SUVmax-T and SUVmax-N values were measured from the region of the first lesions in the interim scan. Also, ΔSUVmax (%) was calculated using the baseline and interim SUVmax values according to the formula: (interim SUVmax-baseline SUVmax) / (baseline SUVmax) x100.
Pathological Evaluation and Treatment Protocol
Patients were graded according to the modified Scarff-Bloom-Richardson classification. In immunohistochemical analysis, estrogen receptor (ER) and progesterone receptor (PR) status were scored and accepted as positive if high (10%). Furthermore, human epidermal growth factor receptor type-2 (HER2) was classified with scores of 0, 1+, 2+ intense, and 3+ based on the maximum staining intensity and stain distribution. 3+ score is accepted as HER2 positive. When the score was 2+, gene amplification of the fluorescent in situ hybridization method was used to determine HER2 positivity. Patients were classified into luminal A, luminal B, triple-negative, and HER2-positive molecular subtypes. The high ki-67 index represents the ≥15 values.
All patients included in the study received adriamycin 60 mg/m2 and cyclophosphamide 600 mg/m2 every 21 days for 3-4 cycles as a NAC protocol. After the interim evaluation PET/CT, NAC was continued with paclitaxel 80 mg/m2 every 7 days for 12 weeks. In addition, trastuzumab (4 mg/kg as a loading dose, followed by 2 mg/kg) and pertuzumab (840 mg as a loading dose, followed by 420 mg) were given intravenously to HER2-positive patients. All patients underwent surgery after NAC.
The pCR was determined for the primary tumor and ALNs from surgical materials based on the Miller-Payne system (6). The Miller-Payne system has 5 grades and grade 5 indicates the pCR in the tumor means no invasive carcinoma but ductal carcinoma in situ may be present, and grades 1-4 define the pathological response rates relative to the tumor reduction ratio. We classified patients’ pathological responses into two groups as pCR (+) vs pCR (-). For this study, Miller-Payne grade 5 responders were grouped as pCR (+), and partial responders or non-responders as pCR (-).
Statistical Analysis
Statistical analysis was performed by Macintosh Statistical Software (v27.0, IBM, Armonk, NY, USA) in this study. All descriptive data were expressed as mean, median, and SD. Mann-Whitney U and Kruskal-Wallis tests were used for variables with non-normal distribution. Comparison of numerical variables between groups was performed Student’s t-test. The relationship between ki-67 and SUV parameters was assessed by Pearson correlation analysis. p less than 0.05 was considered significant.
Results
Histopathology was invasive ductal carcinoma in 45 (93.75%) cases and invasive lobular carcinoma (ILC) in three (6.25%) cases. The tumor was in the right-sided breast in 26 (54.1%) patients and the left-sided breast in 22 (45.9%) patients. Of 48 patients, 14 (29.2%) were ER negative, 34 (70.8%) were ER positive, 17 (35.4%) were PR negative, 31 (64.6%) were PR positive. Nine (18.8%) of the patients were in luminal A, 25 (52%) were in luminal B, 8 (16.7%) were in the HER2 positive, and 6 (12.5%) were in the triple-negative molecular subgroup. ALN metastasis was negative in four (8.3%) patients at diagnosis. Sixteen patients (33.3%) were in clinical stage 2 and 33 (66.7%) were in stage 3 before treatment. The study patients and tumor characteristics are summarized in Table 1.
Table 1. Patients and characteristics of breast cancer.
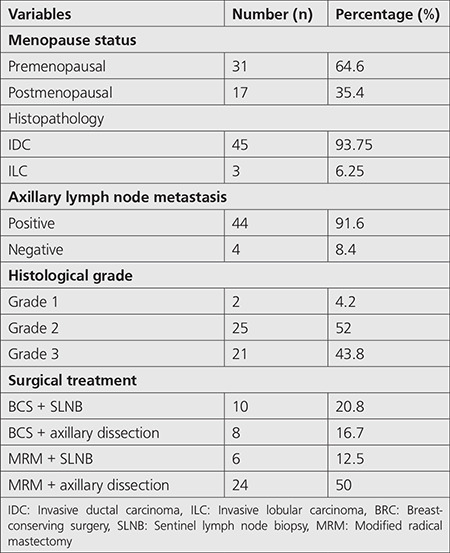
The mean diameter of the primary tumor was 4.75±3.04 cm, the mean ALN size was 2.2±1.3 cm, and the ki-67 index was 42.77%±26.46%. Mean SUVmax levels of baseline breast tumor and ALN metastases were calculated as 8.13±4.25 and 7.22±3.58, respectively. Tumor and ALN SUVmax and ΔSUVmax levels of the three patients with the initial diagnosis of ILC were 4.1±0.87 and 4.2±0.5, -42.40±21.27 and -41.51±18.05, respectively. The number of patients with pCR (+) for the primary tumor and ALN was 18 (37.5%) and 21 (47.7%), respectively. Total (breast & axilla) pCR (+) was obtained in 17 (35.4%) patients (Figure 1).
Figure 1.
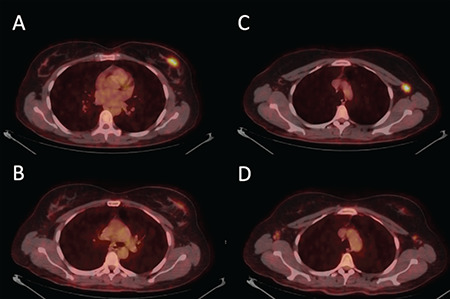
Thirty two-year-old woman with luminal B type invasive ductal left-sided breast cancer and axillary metastases achieved pCR at the end of NAC. Primary tumor SUVmax was 5.4 in baseline 18F-FDG PET/CT (A). SUVmax was measured as 3.4 in interim evaluation PET/CT (B). Before and after interim treatment values of SUVmax-N were measured as 6.1 (C) and 2.9 (D), respectively
18F-FDG: 18Fluorine-fluorodeoxyglucose, NAC: Neoadjuvant chemotherapy, SUVmax: Maximum-standardized uptake value, PET/CT: Positron emission tomography/computed tomography, pCR: Pathological complete response
Relationship Between Histopathologicalc Features, pCR, and 18F-FDG PET Analysis
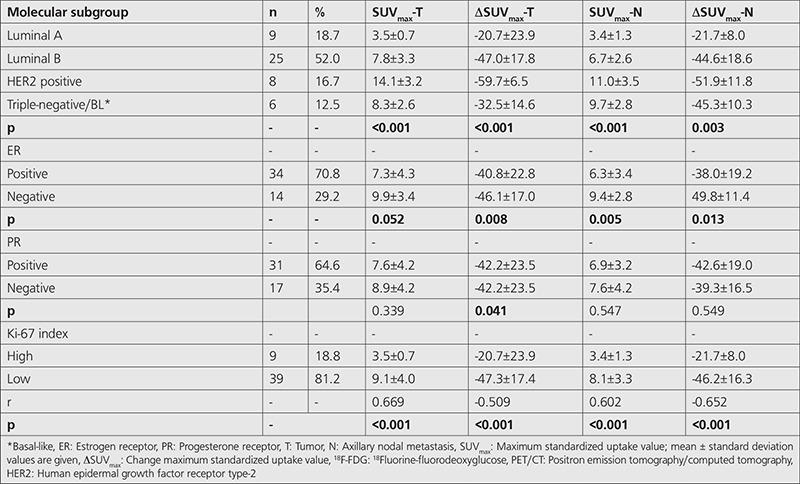
The mean baseline SUVmax-T was statistically lower in the luminal A than in the triple-negative, HER2 positive, and luminal B groups (p=0.046, p<0.001, p=0.008), respectively. The mean baseline SUVmax-T was statistically higher in HER2 positives than in the luminal B group (p=0.017). The highest mean ΔSUVmax-T and ΔSUVmax-N were seen in HER2 positivity (p<0.01), but there was no significant difference in SUVmax-T levels of the positive and triple-negative groups (p=0.297). Additionally, SUVmax-T, SUVmax-N, ΔSUVmax-T, and ΔSUVmax-N levels had a highly significant correlation with the ki-67 index (Table 2).
Table 2. Histopathological analysis and 18F-FDG PET/CT parameters.
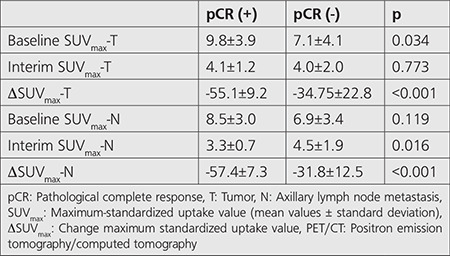
Significant differences were seen between the SUVmax levels of pCR (+) and pCR (-) patients. ΔSUVmax-T was significantly higher in the pCR (+) group for the primary tumor than in the pCR (-) group (p<0.001). For ALNs, interim SUVmax-N was lower in the pCR (+) group than in the pCR (-) group (p=0.016). In the evaluation of all groups, SUVmax-N levels of pCR (+) patients were statistically higher than the SUVmax-N values of pCR (-) patients (p<0.001). The relationship between PET/CT parameters and pCR is shown in Table 3.
Table 3. PET/CT parameters and pCR analysis.
Discussion
PET/CT imaging in oncology practice, to clinical and pathological factors, has the importance of being a non-invasive method that provides timely determination of the response to therapy. PET/CT has an advantage over anatomical screening tools in demonstrating the metabolic nature of cancer by calculating the metabolic PET parameters before and in the interim period of NAC (7). Studies have documented that 18F-FDG PET/CT images obtained interim, or at the end of NAC can estimate the response to therapy (8,9).
The value of radionuclide activity in breast lesions is related to tumor heterogeneity and molecular subgroups. Higher tracer accumulation has been found in negative ER status or triple-negative cases compared with positive ER status (10). In our study, it was shown that baseline SUVmax was higher in HER2 positive and triple-negative cases compared to luminal groups, which supports the published research (Figure 2). Also, studies showing a significant relation between SUVmax and the ki-67 levels or lymphatic and vascular invasion are available in the literature (11,12,13). Like studies on this subject, a statistically significant correlation was found between the ki-67 index and baseline SUVmax-T, SUVmax-N, ΔSUVmax-T, and ΔSUVmax-N.
Figure 2.
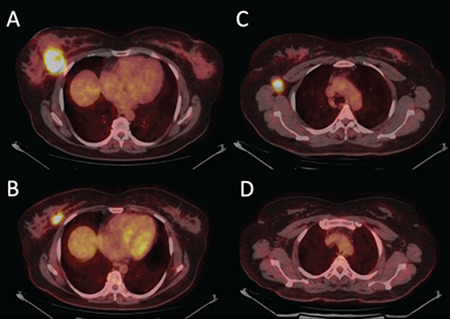
Fifty four-year-old patient with HER2 positive right-sided breast tumor and axillary metastases showed pCR in the axilla after NAC. Primary tumor SUVmax values were 11.0 and 4.9 in the fusion PET/CT images performed at baseline (A) and interim NAC (B). The partial metabolic response was detected in the primary tumor on interim treatment evaluation PET/CT. The baseline SUVmax-N value was 8.4 (C). The complete metabolic response was observed after NAC (D)
HER2: Human epidermal growth factor receptor type-2, pCR: Pathological complete response, NAC: Neoadjuvant chemotherapy, SUVmax: Maximum-standardized uptake value, PET/CT: Positron emission tomography/computed tomography
Significant differences were observed in SUVmax values of specific molecular subgroups. The highest ΔSUVmax-T was seen in the HER2 positive and luminal B groups, and the highest ΔSUVmax-N in the HER2-positive and triple-negative groups in the study (Figure 3). In research, the mean breast ΔSUVmax level was found to be -73%±32% in HER2 positivity with more intense uptake values for the total breast & axilla, and -52%±33% in HER2 negativity (14). Similarly, the highest ΔSUVmax-T and ΔSUVmax-N levels were found in HER2-positive patients in our study.
Figure 3.
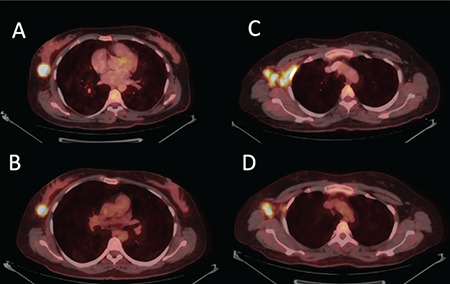
Forty one-year-old woman with triple-negative right-sided breast tumor and ALN metastases, whose pCR could not be obtained after NAC, had a primary tumor SUVmax value of 13.2 in the baseline PET/CT scan (A). SUVmax was measured as 11.8 in the interim evaluation (B). Under the partial metabolic response, the pre-treatment (C) and interim treatment (D) SUVmax-N were 12.3 and 8.5, respectively
ALN: Axillary lymph node, pCR: Pathological complete response, NAC: Neoadjuvant chemotherapy, SUVmax: Maximum-standardized uptake value, PET/CT: Positron emission tomography/computed tomography
The metabolic response of the primary malignancy to therapy is considered as a measure for assessing NAC response. Pathological CR is defined as the negativity of invasive cancer in the breast and axilla, which is seen in 10-40% of patients (15). In this study, pCR (+) was obtained in 35.4% of the patients and the most significant parameters for the pCR (+) were determined by ΔSUVmax-T and ΔSUVmax-N. Can et al. (16) investigated the prognostic role of PET/CT in the evaluation of newly diagnosed BC patients with ALN metastases, and reported pCR rates after neoadjuvant therapy as 37.2%, 42.2%, and 28.9% for breast, axilla, and breast & axilla, respectively. In a study evaluating the response to NAC with PET/CT in 32 BC patients, pCR was seen in 17 patients (43.8%) (17). Additionally, mean ΔSUVmax measured on PET/CT imaging after NAC was shown to be more prognostic in patients with pCR (+) (18). In another study of luminal group B cancers, the authors showed no difference between patients’ pathological responses for baseline SUVmax, but a higher ΔSUVmax-T was reported for pCR (+) (19).
BC comprises various subtypes in terms of tumor nature, therapy options, and clinical outcomes. The heterogeneous feature is also seen in the metabolic behavior of the tumor. In a prospective study evaluating triple-negative patients, the median baseline SUVmax-T did not differ significantly among the patients with and without pCR, while ΔSUVmax-T was found to be more significant in the patients with pCR (+) (20). In our study, the mean ΔSUVmax-T was higher in patients with pCR (+) groups than in patients with non-pCR. In another study, in which the metabolic and pathological response evaluation was performed separately for the breast and axilla with triple-negative and HER2 group patients, ΔSUVmax-T was determined as the strongest estimator of pCR in the primary tumor and ΔSUVmax-N was the most predictive of the total pCR (21).
Accurately revealing the response to NAC also affects surgical planning. The evaluation of response with anatomical imaging, which traditionally uses size-based criteria, has limitations. Anatomical and metabolic evaluation with PET/CT overcomes many of these limitations and plays an indispensable place in the assessment of NAC response in BC. Additionally, response to NAC in ALNs may affect the decision for axillary dissection. Colfry et al. (22) emphasized that axillary dissection may be unnecessary in LABC with complete response after NAC in their study, and they recommended its application, especially in unresponsive patients. In our study, pCR (+) was not established in 62.5% (30/48) of breast tumors and 52.2% (23/44) of axillary metastases after the NAC strategy. Only 17 cases (35.4%) achieved pCR (+) in both primary breast tumors and ALN metastases. Low 18F-FDG uptake was observed in primary breast tumor ± ALN metastases of patients who did not respond to treatment, and this situation was primarily evaluated about the histopathological type (ILC) of the tumor. Similarly, Schwarz-Dose et al. (23) found high response rates in HER2 positive patients at post-treatment examination and low pCR rates after NAC in tumors with low glucose metabolism.
Study Limitations
The heterogeneity and the limited number of the patient population, with its retrospective design, can be considered the limitations of our study, and this may have weakened some of the statistical analysis.
Conclusion
An earlier and more accurate response to NAC could be performed with interim 18F-FDG PET/CT imaging. PET/CT may also detect unresponsive patients in the early period and allow changes in treatment plans. Additionally, ΔSUVmax levels of primary tumor and ALN can be used to predict pCR in LABC patients receiving NAC.
Footnotes
Ethics
Ethics Committee Approval: The University of Health Sciences Turkey, Istanbul Training and Research Hospital, Clinical Research Ethics Committee approved (number: 2916, date: 10.09.2021) the study and Helsinki Declaration rules were followed to conduct this study.
Informed Consent: Each study participant signed the informed consent forms.
Peer-review: Externally peer-reviewed.
Authorship Contributions
Surgical and Medical Practices: G.T., Ö.Ö., G.A., Concept: G.T., Ö.Ö., G.A., Design: G.T., Ö.Ö., G.A., Data Collection or Processing: G.T., Ö.Ö., G.A., Analysis or Interpretation: G.T., Ö.Ö., G.A., Literature Search: G.T., Ö.Ö., G.A., Writing: G.T., Ö.Ö., G.A.
Conflict of Interest: No conflict of interest was declared by the authors.
Financial Disclosure: The authors declared that this study has received no financial support.
References
- 1.Bray F, Ferlay J, Soerjomataram I, Siegel RL, Torre LA, Jemal A. Global cancer statistics 2018: GLOBOCAN estimates of incidence and mortality worldwide for 36 cancers in 185 countries. CA Cancer J Clin. 2018;68:394–424. doi: 10.3322/caac.21492. [DOI] [PubMed] [Google Scholar]
- 2.Tryfonidis K, Senkus E, Cardoso MJ, Cardoso F. Management of locally advanced breast cancer-perspectives and future directions. Nat Rev Clin Oncol. 2015;12:147–162. doi: 10.1038/nrclinonc.2015.13. [DOI] [PubMed] [Google Scholar]
- 3.Heil J, Kuerer HM, Pfob A, Rauch G, Sinn HP, Golatta M, Liefers GJ, Vrancken Peeters MJ. Eliminating the breast cancer surgery paradigm after neoadjuvant systemic therapy: current evidence and future challenges. Ann Oncol. 2020;31:61–71. doi: 10.1016/j.annonc.2019.10.012. [DOI] [PubMed] [Google Scholar]
- 4.Becker J, Schwarzenböck SM, Krause BJ. FDG PET hybrid imaging. Recent Results Cancer Res. 2020;216:625–667. doi: 10.1007/978-3-030-42618-7_19. [DOI] [PubMed] [Google Scholar]
- 5.Hofman MS, Hicks RJ. How we read oncologic FDG PET/CT. Cancer Imaging. 2016;16:35. doi: 10.1186/s40644-016-0091-3. [DOI] [PMC free article] [PubMed] [Google Scholar]
- 6.Ogston KN, Miller ID, Payne S, Hutcheon AW, Sarkar TK, Smith I, Schofield A, Heys SD. A new histological grading system to assess response of breast cancers to primary chemotherapy: prognostic significance and survival. Breast. 2003;12:320–327. doi: 10.1016/s0960-9776(03)00106-1. [DOI] [PubMed] [Google Scholar]
- 7.Lei L, Wang X, Chen Z. PET/CT imaging for monitoring recurrence and evaluating response to treatment in breast cancer. Adv Clin Exp Med. 2016;25:377–382. doi: 10.17219/acem/29853. [DOI] [PubMed] [Google Scholar]
- 8.Akdeniz N, Kömek H, Küçüköner M, Kaplan MA, Urakçi Z, Oruç Z, Işikdoğan A. The role of basal 18F-FDG PET/CT maximum standard uptake value and maximum standard uptake change in predicting pathological response in breast cancer patients receiving neoadjuvant chemotherapy. Nucl Med Commun. 2021;42:315–324. doi: 10.1097/MNM.0000000000001332. [DOI] [PubMed] [Google Scholar]
- 9.Tian F, Shen G, Deng Y, Diao W, Jia Z. The accuracy of 18F-FDG PET/CT in predicting the pathological response to neoadjuvant chemotherapy in patients with breast cancer: a meta-analysis and systematic review. Eur Radiol. 2017;27:4786–4796. doi: 10.1007/s00330-017-4831-y. [DOI] [PubMed] [Google Scholar]
- 10.Arslan E, Çermik TF, Trabulus FDC, Talu ECK, Başaran Ş. Role of 18F-FDG PET/CT in evaluating molecular subtypes and clinicopathological features of primary breast cancer. Nucl Med Commun. 2018;39:680–690. doi: 10.1097/MNM.0000000000000856. [DOI] [PubMed] [Google Scholar]
- 11.Qu YH, Long N, Ran C, Sun J. The correlation of 18F-FDG PET/CT metabolic parameters, clinicopathological factors, and prognosis in breast cancer. Clin Transl Oncol. 2021;23:620–627. doi: 10.1007/s12094-020-02457-w. [DOI] [PubMed] [Google Scholar]
- 12.Erol M, Önner H, Eren Karanis Mİ. Evaluation of the histopathological features of early-stage invasive ductal breast carcinoma by 18fluoridefluorodeoxyglucose positron emission tomography/computed tomography. Mol Imaging Radionucl Ther. 2021;30:129–136. doi: 10.4274/mirt.galenos.2021.25582. [DOI] [PMC free article] [PubMed] [Google Scholar]
- 13.Surov A, Meyer HJ, Wienke A. Associations between PET parameters and expression of Ki-67 in breast cancer. Transl Oncol. 2019;12:375–380. doi: 10.1016/j.tranon.2018.11.005. [DOI] [PMC free article] [PubMed] [Google Scholar]
- 14.Cheng J, Wang Y, Mo M, Bao X, Zhang Y, Liu G, Zhang J, Geng D. 18F-fluorodeoxyglucose (FDG) PET/CT after two cycles of neoadjuvant therapy may predict response in HER2-negative, but not in HER2-positive breast cancer. Oncotarget. 2015;6:29388–29395. doi: 10.18632/oncotarget.5001. [DOI] [PMC free article] [PubMed] [Google Scholar]
- 15.von Minckwitz G, Untch M, Blohmer JU, Costa SD, Eidtmann H, Fasching PA, Gerber B, Eiermann W, Hilfrich J, Huober J, Jackisch C, Kaufmann M, Konecny GE, Denkert C, Nekljudova V, Mehta K, Loibl S. Definition and impact of pathologic complete response on prognosis after neoadjuvant chemotherapy in various intrinsic breast cancer subtypes. J Clin Oncol. 2012;30:1796–1804. doi: 10.1200/JCO.2011.38.8595. [DOI] [PubMed] [Google Scholar]
- 16.Can C, Akdeniz N, Kömek H, Gündoğan C, Urakçı Z, Işıkdoğan A. The prognostic role of baseline 18F-FDG PET/CT SUVmax and SUVmax change in patients with node-positive breast cancer receiving neoadjuvant chemotherapy. Rev Esp Med Nucl Imagen Mol (Engl Ed) 2022;41:3–10. doi: 10.1016/j.remnie.2021.04.003. [DOI] [PubMed] [Google Scholar]
- 17.Kitajima K, Miyoshi Y, Yamano T, Odawara S, Higuchi T, Yamakado K. Assessment of tumor response to neoadjuvant chemotherapy in patients with breast cancer using MRI and FDG-PET/CT-RECIST 1.1 vs. PERCIST 1.0. Nagoya J Med Sci. 2018;80:183–197. doi: 10.18999/nagjms.80.2.183. [DOI] [PMC free article] [PubMed] [Google Scholar]
- 18.Akimoto E, Kadoya T, Kajitani K, Emi A, Shigematsu H, Ohara M, Masumoto N, Okada M. Role of 18F-PET/CT in predicting prognosis of patients with breast cancer after neoadjuvant chemotherapy. Clin Breast Cancer. 2018;18:45–52. doi: 10.1016/j.clbc.2017.09.006. [DOI] [PubMed] [Google Scholar]
- 19.Pahk K, Kim S, Choe JG. Early prediction of pathological complete response in luminal B type neoadjuvant chemotherapy-treated breast cancer patients: comparison between interim 18F-FDG PET/CT and MRI. Nucl Med Commun. 2015;36:887–891. doi: 10.1097/MNM.0000000000000329. [DOI] [PubMed] [Google Scholar]
- 20.Humbert O, Riedinger JM, Charon-Barra C, Berriolo-Riedinger A, Desmoulins I, Lorgis V, Kanoun S, Coutant C, Fumoleau P, Cochet A, Brunotte F. Identification of biomarkers including 18FDG-PET/CT for early prediction of response to neoadjuvant chemotherapy in triple-negative breast cancer. Clin Cancer Res. 2015;21:5460–5468. doi: 10.1158/1078-0432.CCR-15-0384. [DOI] [PubMed] [Google Scholar]
- 21.van Ramshorst MS, Teixeira SC, Koolen BB, Pengel KE, Gilhuijs KG, Wesseling J, Rodenhuis S, Valdés Olmos RA, Rutgers EJ, Vogel WV, Sonke GS, Vrancken Peeters MT. Additional value of 18F-FDG PET/CT response evaluation in axillary nodes during neoadjuvant therapy for triple-negative and HER2-positive breast cancer. Cancer Imaging. 2017;17:15. doi: 10.1186/s40644-017-0117-5. [DOI] [PMC free article] [PubMed] [Google Scholar]
- 22.Colfry AJ 3rd, Zhang X, Fuhrman GM. Response to neoadjuvant chemotherapy in the breast predicts axillary nodal status. Am Surg. 2012;78:693–697. [PubMed] [Google Scholar]
- 23.Schwarz-Dose J, Untch M, Tiling R, Sassen S, Mahner S, Kahlert S, Harbeck N, Lebeau A, Brenner W, Schwaiger M, Jaenicke F, Avril N. Monitoring primary systemic therapy of large and locally advanced breast cancer by using sequential positron emission tomography imaging with [18F]fluorodeoxyglucose. J Clin Oncol. 2009;27:535–541. doi: 10.1200/JCO.2008.17.2650. [DOI] [PubMed] [Google Scholar]


