Abstract
Tree House Explorer (THEx) is a genome browser that integrates phylogenomic data and genomic annotations into a single interactive platform for combined analysis. THEx allows users to visualize genome-wide variation in evolutionary histories and genetic divergence on a chromosome-by-chromosome basis, with continuous sliding window comparisons to gene annotations, recombination rates, and other user-specified, highly customizable feature annotations. THEx provides a new platform for interactive phylogenomic data visualization to analyze and interpret the diverse evolutionary histories woven throughout genomes. Hosted on Conda, THEx integrates seamlessly into new or pre-existing workflows.
Keywords: bioinformatics, cats, genome browser, phylogenomics
Introduction
Massively parallel sequencing technologies have enabled researchers to collect large volumes of phylogenomic data for many species. Computer software designed to analyze these data has been available to users for over a decade. Still, the separation of phylogenetic and genomic visualization tools has remained a common challenge for evolutionary biologists. IGV, RDP4, and the UCSC Genome Browser are examples of essential tools for visualizing genome assembly and genome alignment data (Kent et al. 2002; Thorvaldsdottir et al. 2013; Martin et al. 2015). At the same time, Iroki, FigTree, iTOL (v5), and ETE (v3) are examples of programs used to visualize and manipulate large phylogenetic trees separately (Rambaut 2006; Huerta-Cepas et al. 2016; Moore et al. 2020; Letunic and Bork 2021). These examples have become indispensable for interrogating specific features of genomic and phylogenetic data separately, but only recently has there been a movement toward combined analysis.
Genomes are mosaics of evolutionary histories that reflect ancient signatures of species divergence, incomplete lineage sorting (ILS), and gene flow. Understanding how and why phylogenetic signal (the variation in evolutionary histories inferred across a genome) varies can yield powerful insights into evolutionary histories and adaptive evolution. By integrating diverse data types with local genealogies or locus trees (a phylogenetic tree inferred from a stretch of sequence along the genome that is not necessarily limited within the boundaries of a gene), one can more readily differentiate genetic variation that is consistent with the species tree from that stemming from natural selection, ILS, or gene flow (Figueiro et al. 2017; Edelman et al. 2019; Li et al. 2019; Small et al. 2020; Hennelly et al. 2021; Nelson et al. 2021). However, a tool has yet to be developed to simultaneously analyze phylogenetic signal variation with other chromosomal and gene-based annotations (i.e., a phylogenomic browser).
Here, we present Tree House Explorer (THEx), a genome browser designed to explore phylogenetic signals in parallel with chromosomal and gene-based annotations in an all-in-one application. THEx offers two different dashboards, Tree Viewer and Signal Tracer, that provide highly interactive and customizable graphing experiences that simplify the exploration of diverse phylogenetic histories and window-based calculations in an annotated genomic context. Exploring data from local and genome-wide views makes identifying complex divergence patterns straightforward. It offers a unique way to connect phylogenetic signal with underlying genomic data like recombination rate, gene annotations, divergence time estimates, or other window-based data types. By facilitating synchronous visualization of phylogenetic signal and additional data types, THEx allows users to visualize more complex, previously hidden genomic associations and place them in a genomic context. In addition to synchronous visualization, THEx enables users to download publication-ready figures in several different file types (i.e., .svg, .jpeg, .png).
THEx was developed using Python, Plotly’s open-source graphing library, and Dash, a web data analytical application framework. Deployed on Conda, THEx is easily integrated into pre-existing pipelines and removes the complexities of gathering required software dependencies and ensuring correct version compatibility. THEx was tested using 241 species whole-genome alignment and can comfortably analyze phylogenomic datasets containing hundreds of taxa on a local workstation (Genereux et al. 2020). Future development aims to improve its capabilities on large supercomputing clusters and servers. Documentation, example data sets, and tutorials can be found on the THEx GitHub page (https://github.com/harris-2374/THEx).
New Approaches
Overview
THEx comes with two dashboards, Tree Viewer and Signal Tracer, that provide complementary approaches to investigating phylogenomic data. Tree Viewer is designed to investigate how phylogenetic signal varies across the genome in relation to various genomic data types (e.g., recombination, protein-coding regions, etc.). Signal Tracer is similar in that it provides a platform to investigate window-based calculations, but its focus is on displaying information per taxon rather than per topology. This distinction is vital because the phylogenetic signal only shows general differences in the relationships among taxa, but does not provide specific information about what is different. Therefore, investigating information at a per-taxon level is important to understand the underlying reasons for changes in phylogenetic relationships. THEx development and testing utilized whole-genome phylogenetic data sets from different mammal species. However, THEx can use sequence data from any group of organisms from across the tree of life. Beginning with a multiple-sequence alignment in FASTA format, THEx can infer locus trees across non-overlapping sliding windows of any size and visualize the distribution of topologies along chromosomes. In addition to serving as a phylogenomics browser, THEx offers Linux and macOS users a custom companion toolkit called THExBuilder, which simplifies the generation and manipulation of THEx input files. THEx is straightforward to install and integrate into pre-existing data analysis pipelines. Overall, THEx takes the highly fragmented nature of phylogenomic analyses and simplifies the process by integrating phylogenetic signal and other chromosomal and gene-based data types (e.g., recombination rate, divergence time estimates, gene annotations, etc.) into a single browser for easy identification and interrogation of evolutionary distinct regions of the genome.
THExBuilder Command Line Interface
THExBuilder is a toolset that helps users go from multiple-sequence alignments in FASTA format to THEx input files as quickly as possible while also providing tools that make working with and manipulating input files a straightforward task. Invoked by the command ‘thexb’, Linux and macOS users are provided a command-line suite of tools and pipelines that aid in generating and manipulating input files for THEx. THExBuilder offers one possible approach to developing a Tree Viewer input file from a multiple-sequence alignment FASTA file, but it is possible to use other phylogenomic toolkits like CloudForest to generate the raw input data and then format the results into a Tree Viewer file (Wagner et al. 2021). THExBuilder also provides several additional tools that enable users to manipulate Tree Viewer input files. For example, THExBuilder allows users to root or re-root all phylogenetic trees within a Tree Viewer input file by altering the selection of the outgroup. This tool alleviates the need to modify the raw tree data and regenerate a new Tree Viewer input file. Another feature implemented within THExBuilder’s Tree Viewer pipeline is an improved phylogenetic tree binning algorithm called topobinner. Tree binning is a process in which a set of phylogenetic trees are grouped based on the relationships among taxa. Trees with identical relationships among taxa are grouped and ordered high to low based on the number of trees within each group. Topobinner is a user-friendly replacement for the legacy tree binning program, PhyBin (Newton and Newton 2013). It also provides a command to calculate raw divergence (p-distance) from a multiple-sequence alignment that can be viewed in a genomic context within Signal Tracer.
Tree Viewer and Signal Tracer Required and Optional Input Files
Tree Viewer requires two input files to run. The first is the Tree Viewer input file containing four required columns (Chromosome, Window, NewickTree, and TopologyID) (supplementary table 1, Supplementary Material online) and accepts tab-delimited (TXT, TSV), comma-delimited (CSV), or Excel files as inputs. The second required file is a bed file (.bed specifically) with columns (Chromosome, Start, Stop) (supplementary table 2, Supplementary Material online) that represent the lengths of the chromosomes or sequences within the Tree Viewer input file. These lengths estimate the number of windows per chromosome and other summary values. Although the file formats described here refer to chromosome-level data, users are not required to use chromosome-level data to run THEx. Users may also add additional window-based data types to the Tree Viewer input file, like recombination rate or divergence times, by inserting the values as a new column to the right of the four required columns. In addition, gene annotations or other general features can be loading a valid General Feature/Transfer Format (GFF/GTF) file into the session.
Signal Tracer requires a single input file with the columns (Chromosome, Position, Sample, Value) (supplementary table 3, Supplementary Material online). Like Tree Viewer, users can load gene annotations or other features by loading a valid GFF/GTF file into the session.
Tree Viewer Dashboard Interface
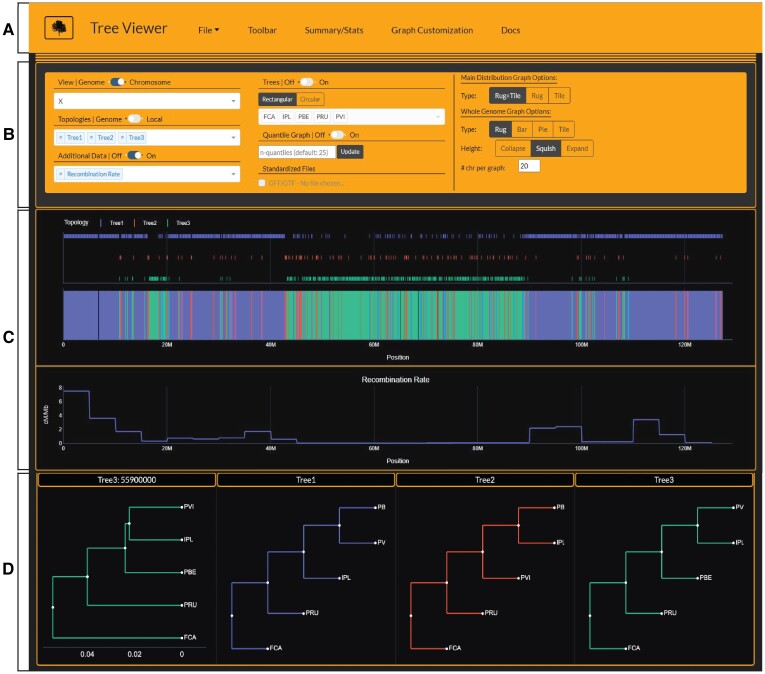
Tree Viewer integrates whole-genome phylogenetic signal with a variety of genomic data types (i.e., recombination rate, guanine-cytosine (GC)-content, number of parsimony informative sites, etc.) and annotations/features (i.e., gene annotations, intron/exon boundaries, etc.) provided in a standard GFF/GTF file. The dashboard is separated into two main sections; a navigation bar with collapsible menus (fig. 1A and A) and a multi-graph container (fig. 1C and D). The navigation bar contains five collapsible menus: an input/export menu, the main toolbar containing all data and graphing options, a summary-statistics menu, a graph customization menu, and a documentation section describing how to use the dashboard. Clicking Tree Viewer from the homepage will switch to the Tree Viewer dashboard and open a prompt for the user to select an input file. Once the user selects the required input files and clicks submit, the data is checked for errors or incorrect formatting. After completing these steps, the main toolbar is populated with the user-provided information.
Fig. 1.
Screenshot of Tree Viewer interface displaying data of the Asian leopard cat lineage generated by Li et al. (2019). The navigation bar at the top of the page (A) contains all access points to the input/export options, main graph toolbar, summary/statistics, graph customization, and documentation. (B) Shows the main toolbar where users control which graphs to display and what types of graphs to plot. (C) Is the main graph container that shows Asian leopard cat lineage phylogenetic signal on top and recombination rate in the row below. (D) Shows the user-selected tree topologies from the ‘Topologies’ dropdown that are displayed across all loaded graphs. The first tree in (D) depicts a user-selected tree topology with respective branch lengths chosen by clicking on a window on the main phylogenetic signal distribution (top graph in C). The other three tree topologies are basic representations of each selected topology with unit branch lengths. Domestic cat (FCA), Rusty-spotted cat (PRU), Flat-headed cat (IPL), Fishing cat (PVI), and Asian leopard cat (PBE).
Tree Viewer provides options to explore data in Whole Genome mode or Chromosome mode by toggling the switch in the main toolbar (fig. 1B). Whole-genome view offers an overview of the selected topologies across the entire genome. Results can be graphed as a rug plot, bar plot, pie chart, or one-dimensional tile plot faceted by chromosome (fig. 1 and supplementary figures 1–3, Supplementary Material online). Single-chromosome viewing mode enables users to zoom in and out of local regions on a chromosome to investigate discordance compared to additional data types selected in the ‘Additional Data’ dropdown. The first loaded graph shows the phylogenetic signal (variation in locus trees or gene trees) across the chosen chromosome. If additional data types are also loaded, their x-axis range will sync to the main distribution graph (top graph of fig. 1C), allowing the user to zoom and pan across the genome while simultaneously comparing multiple data types.
Users can load basic representations of selected tree topologies with unit branch lengths. Specific windows on the main distribution graph may be selected to view the topology with branch lengths if they are provided in the Newick trees within the Tree Viewer input file (fig. 1D). A dropdown menu under the ‘Trees’ toggle, enables users to prune trees to a select number of taxa for easier visualization of sub-trees when the original input contains hundreds of taxa. Users may also use the ‘File Pruning’ export option in the ‘File’ dropdown to prune trees to a specific set of taxa and re-bin the topologies, either within THEx (<10 taxa and genome < 2.5Gb) or, more efficiently, by performing this step externally using the command line and the topobinner script (>10 taxa and/or genome > 2.5Gb).
Signal Tracer Dashboard Interface
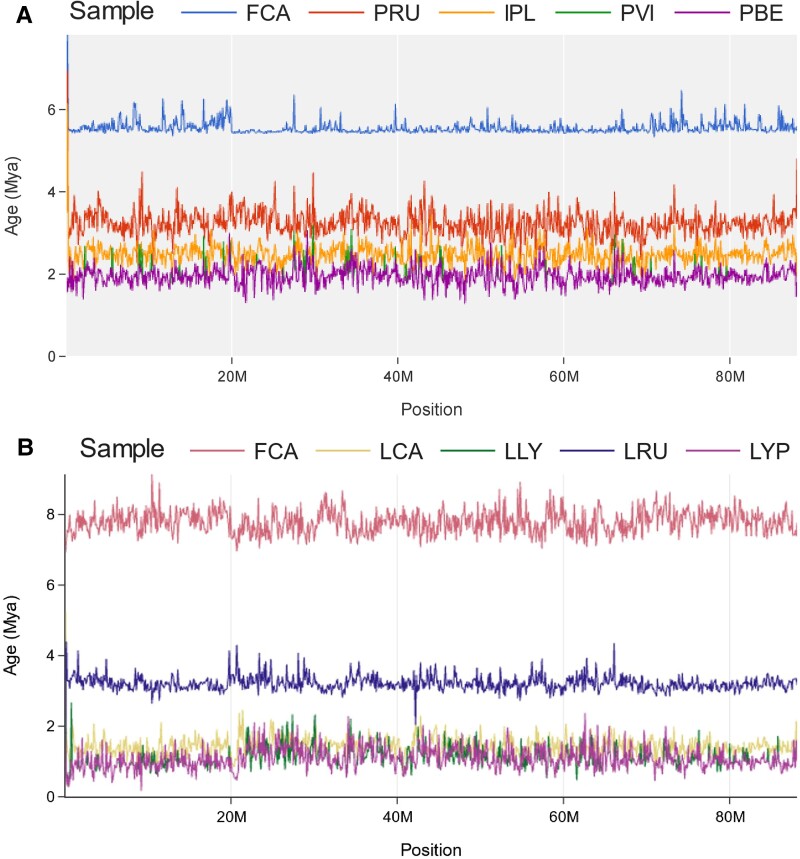
Signal Tracer is a dashboard that allows for intuitive, chromosome and gene-aware investigation of variation in window-based calculations like genetic distance, branch length, or divergence times at single chromosome and whole genome views. Compared to Tree Viewer, Signal Tracer visualizes values per taxon rather than per-topology. To illustrate the functionality of Signal Tracer, we utilized previously published phylogenomic datasets from the cat family Felidae (Li et al. 2019). We generated separate Tree Viewer input files of the species from the Lynx and Asian leopard cat lineages and extracted per-taxa branch length information from the locus trees inferred from continuous non-overlapping 100-kilobase (kb) windows produced by Li et al. (2019). By converting per-taxon branch length information into Signal Tracer's tab-delimited input file format, we illustrate how users can visualize divergence between samples linearly across chromosomes rather than comparing hundreds to thousands of independent phylogenetic trees (fig. 2). This allows for simultaneous visualization and interpretation of underlying variation in the context of genic and chromosomal features. This process can highlight interesting deviations in genetic divergence, which may not be entirely obvious when looking at tree topologies alone.
Fig. 2.
Signal Tracer plots of chromosome D2 for the Lynx (A) and Asian leopard cat (B) lineages with different themes and color palettes. Individual lines represent divergence time estimates (y-axis) of the Domestic cat (FCA), Canada lynx (LCA), Eurasian lynx (LLY), Iberian lynx (LYP), Bobcat (LRU), Rusty-spotted cat (PRU), Flat-headed cat (IPL), Fishing cat (PVI), and Asian leopard cat (PBE) across chromosome D2 (x-axis). Note that the traces for the Asian leopard cat (ALC) and Fishing cat (PVI) are nearly identical and overlap one another throughout the majority of the graph (A). The divergence of the Fishing cat can be seen by identifying deviations in the overlapping signal toward slightly older divergence time estimates.
For example, by comparing the branch lengths from phylogenies inferred for the Lynx (fig. 2A) and Asian leopard cat (fig. 2B) lineages, we see common patterns in the evolutionary history of the two lineages. In the Asian leopard cat lineage, we see clear delineations in divergence between the domestic cat (Felis catus—FCA), rusty-spotted cat (Prionailurus rubiginosus—PRU), and flat-headed cat (Prionailurus planiceps—IPL), with overlapping signal between the fishing cat (Prionailurus viverrinus—PVI) and Asian leopard cat (Prionailurus bengalensis—PBE). The convoluted mixing of signals is likely explained by recurrent ancient hybridization events, given their broad overlap in geographic range. Similar patterns of overlapping signal can also be seen within the Lynx lineage data set, specifically between the Iberian (Lynx pardinus—LYP) and Eurasian lynx (Lynx lynx—LLY), also best explained by rampant interspecific hybridization (Abascal et al. 2016; Li et al. 2019). These regions can be further explored in the context of phylogenetic variation in TreeViewer.
Shared Features across the THEx Dashboards
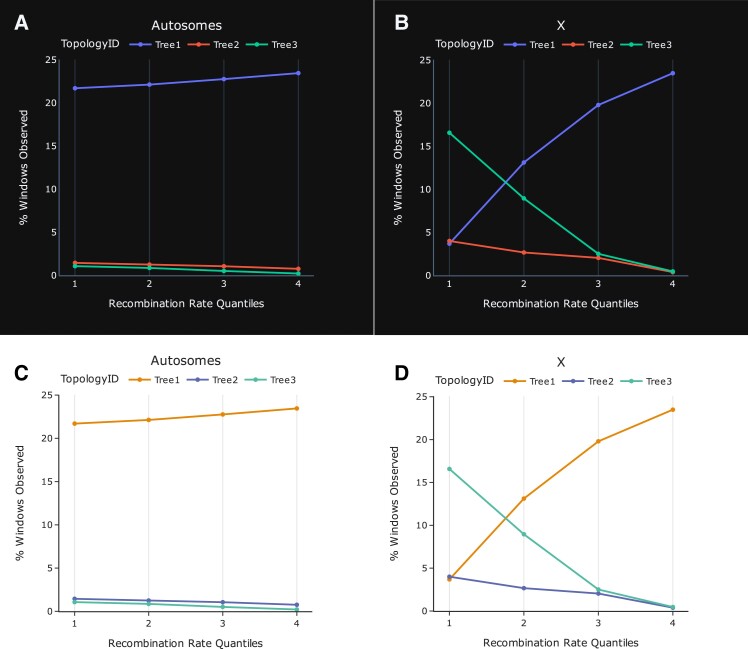
THEx offers several options for graph customization. A toolbar at the top of each dashboard provides different templates, color palettes, and graph attributes that allow users to change the graphs’ appearance (fig. 3). Graphs can also be directly edited, enabling users to customize titles and axis labels within the browser without changing the raw data files. These changes are saved when graphs are exported, producing publication-ready plots. Figure 3 demonstrates two of many possible themes and color combinations on graphs that compare recombination rate quantiles and topology frequencies between the autosomes and X of the Asian leopard cat lineage.
Fig. 3.
The frequency of three tree topologies and recombination rate (cM/Mb) sorted low to high and partitioned into quantiles across the autosomes and X, respectfully, shows an increase in the frequency of the true species tree (Tree 3) in low recombining regions of the X-chromosome. Paired graphs (A + B vs. C + D) demonstrate several graph template and color pallet combinations that can be interchanged on the fly within the graph customization menu of both Tree Viewer and Signal Tracer. These plots were produced using the Topology-Quantile tool under the Summary/Stats menu in Tree Viewer. All other tree topologies were excluded from these plots because their frequencies are lower than the three presented and do not show a correlation between tree topology frequency and recombination rate.
In addition to these customization options, each graph is highly interactive, allowing users to hide or highlight specific data traces on the graph by selecting specific topologies (Tree Viewer) or species (Signal Tracer) labels within the legend. Clicking trace labels once in the legend removes the data traces from the graph and can be quickly added back in by clicking the same trace label again. Users can also single out individual traces by double-clicking legend items. This provides flexibility to simplify complex graphs by removing the need to produce multiple graphs for the same dataset.
Tree Viewer and Signal Tracer offer a ‘Current View’ export option where users can download the underlying raw data from a specific genomic region. For example, a user zooms into a local region of a chromosome and finds an interesting divergent topology that aligns with a gene displayed from a loaded gene annotation (GFF/GTF) file. The user wishes to extract the information from the region being viewed from the Tree Viewer input file and gene annotation file. By clicking ‘File + Current View,’ Tree Viewer will extract all information across all loaded data files for the given region and provide a download prompt for new input files with only the information residing within the region currently being viewed. This feature offers an efficient way to subset data and extract only the desired local information without the need to parse through large, whole-genome data files separately.
Hardware Recommendations
Users can compile data sets with any number of taxa from across the tree of life or genome/sequence length. For example, we generated a 200 taxon, 4.0-gigabase (Gb) pseudo-alignment randomly partitioned into 45 chromosomes and split into 100-kb windows. THEx was capable of visualizing the Tree Viewer data set with a minimal increase in load time. To ensure adequate resources to simultaneously visualize multiple data sets, we recommend users utilize workstations with a minimum of 8GB RAM and maximize the power of their central processing unit (CPU) and graphics processing unit (GPU). Increasingly powerful CPUs and GPUs will increase performance and reduce the load time of graphs. Furthermore, testing has shown that THEx excels when paired with Apple's M1 chip, vastly reducing data transfer time between the back-end server and front-end display. In addition to hardware specifications, we recommend a widescreen monitor when visualizing data within THEx.
Results and Discussion
A growing number of studies (Edelman et al. 2019; Li et al. 2019; Small et al. 2020; Hennelly et al. 2021; Nelson et al. 2021) have demonstrated a strong correlation between specific genomic features, like recombination rate, and the distribution of phylogenetic signal across the genome. In particular, Li et al. (2019) showed that across the X chromosome of all eight felid lineages, regions of low recombination were directly correlated with phylogenetic signal representing the true species tree. The major challenge presented in these types of analyses is the highly fragmented nature of the visualization of phylogenomic signal and direct comparison to corresponding genomic data types, such as recombination. To demonstrate the power of the Tree Viewer dashboard within THEx, we re-analyzed the findings of Li et al. (2019) and extended some of their results by importing the raw data sets of the Asian leopard cat and Lynx lineages into a single genome browser. We utilize the Asian leopard cat data set to re-evaluate the distribution of signal for the true species tree across the X chromosome and identify novel signatures of Canada lynx-bobcat hybridization within the lynx data set.
Case Study 1: Phylogenetic Discordance across the X-Chromosome in the Asian Leopard Cat Lineage
We generated a Tree Viewer input file from the original Li et al. (2019) Asian leopard cat lineage provided in an Excel file. We organized the data into the required Tree Viewer input format described above (supplementary data 1, Supplementary Material online). Li et al. (2019) clustered/binned their topologies using the ‘–bin’ option in PhyBin that uses a Robinson-Foulds distance of 0.0 (Robinson and Foulds 1981; Newton and Newton 2013). We repeated the clustering/binning of tree topologies using PhyBin to validate the bins produced by Li et al. (2019). Since PhyBin is not hosted on Conda, we created an alternate approach, Topobinner, that emulates the binning procedure done by the PhyBin's ‘–bin’ option that is integrated into THExBuilder's Tree Viewer pipeline. We ran both PhyBin and Topobinner and verified that the ‘–topobinner’ option replicates the results from Li et al. (2019). We then added two additional data types; whole-genome recombination rates generated by Li et al. (2016) and divergence time estimates generated by Li et al. (2019). We initially investigated the phylogenetic signal from a whole-genome point of view as a rug plot, bar plot, pie chart, and 1-dimensional histogram faceted by chromosome, using Tree Viewer. We also explored the data per chromosome, allowing us to zoom down to small local regions.
By adding recombination rate information and divergence time estimates, we could directly visualize and compare the recombination rate landscape across the X chromosome with the phylogenetic signal (fig. 1). Through this comparison, we validated the previously published results of Li et al. (2019), which concluded that signal for the true species tree resides in low recombining regions of the genome. This result contrasts the most frequent tree topology identified across the genome and, more specifically, the autosomes. However, Li et al. (2019) concluded that the most frequent locus tree in the genome is likely a result of recurrent post-speciation gene flow and the ability of high recombining regions to unlink and retain deleterious alleles that would typically be removed by natural selection in low recombining regions. For example, a ∼40Mb recombination coldspot is found on the X chromosomes where ∼66% of the windows reflect the species tree (Tree 3). In comparison, only ∼17% of the windows in this region support the most frequent genome-wide locus tree that reflects a signature of gene flow (fig. 1C). Two smaller, multi-megabase regions of the X chromosome are similarly associated with low recombination and show the same trend of a large increase in the frequency of the species tree (fig. 1C and D). Furthermore, divergence time estimates from windows within the multi-megabase low recombining regions supporting the inferred species tree are older than those estimated from the most common genome wide topology, again supporting the conclusions of Li et al. (2019) (supplementary figure 4, Supplementary Material online).
Case Study 2: Signatures of Canada Lynx-Bobcat Hybridization Are Correlated with Decreased Divergence Time Estimates
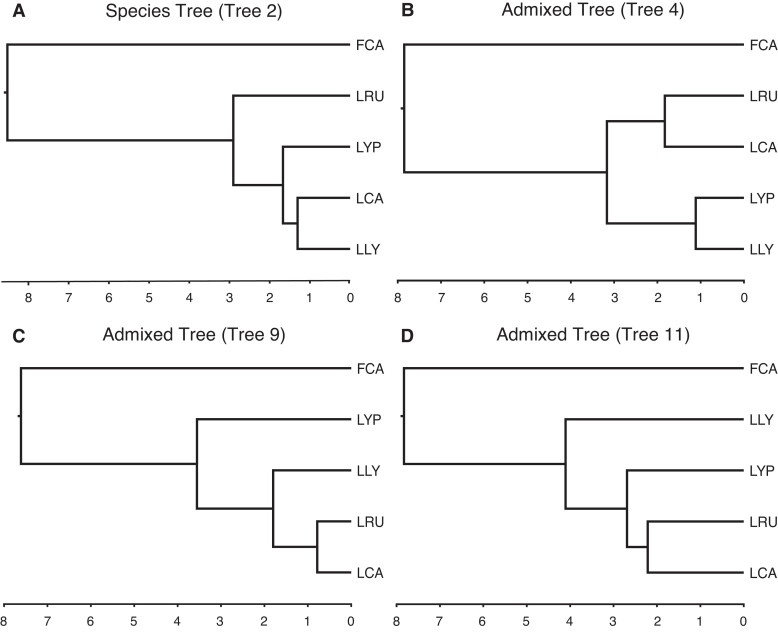
The Lynx lineage consists of four extant species: bobcat, Eurasian lynx, Iberian lynx, and Canada lynx (fig. 4A). The bobcat diverged from the common ancestor of the three lynx species approximately 3 million years ago and has a current geographic range that stretches from Central America to the southern border of Canada (Li et al. 2016, 2019). Previous studies have shown that the geographic range of the bobcat has been expanding northward into southern Canada, increasingly overlapping the geographic range of the Canada lynx. Several studies have also documented interspecific hybridization between the Canada lynx and bobcat along the US-Canada border (Schwartz et al. 2004; Homyack et al. 2008; Koen et al. 2014). Throughout the past several million years, climate change during interglacial periods likely has contributed to the contraction of the southern boundary of the Canada lynx range, facilitating the expansion of the bobcat into Canada (Koen et al. 2014). Although rare, they are naturally occurring Canada lynx-bobcat hybrids identified at the edge of the Canada lynx’s southern range in Maine, Minnesota, and New Brunswick (Homyack et al. 2008; Koen et al. 2014).
Fig. 4.
Time trees of the Lynx species tree (A) and Canada lynx-bobcat admixed topologies (B–D) with the Domestic Cat as the outgroup. Admixed trees (trees 4, 9, and 11) represent tree topologies consistent with the hypothesis of Canada lynx-bobcat hybridization. Domestic cat (FCA), Canada lynx (LCA), Eurasian lynx (LLY), Iberian lynx (LYP), Bobcat (LRU).
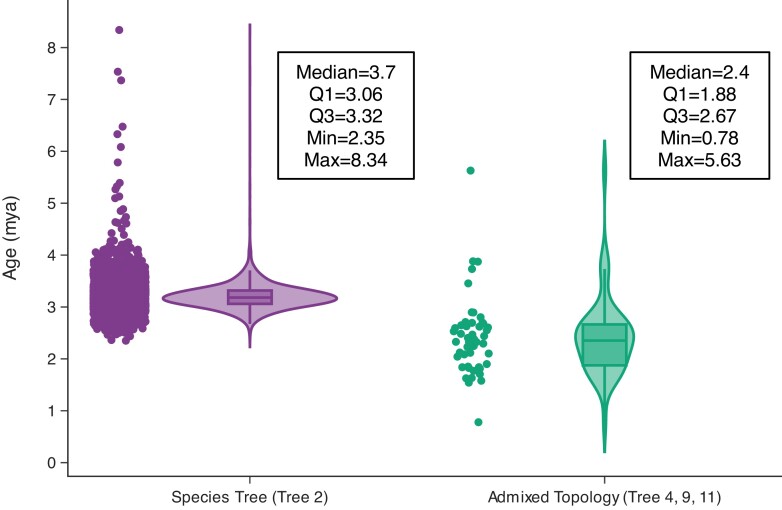
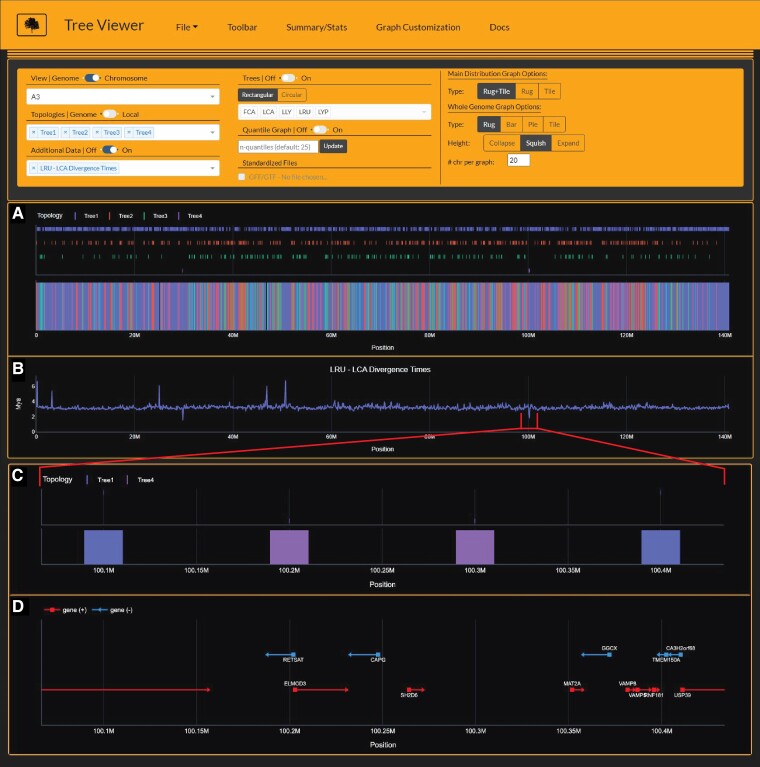
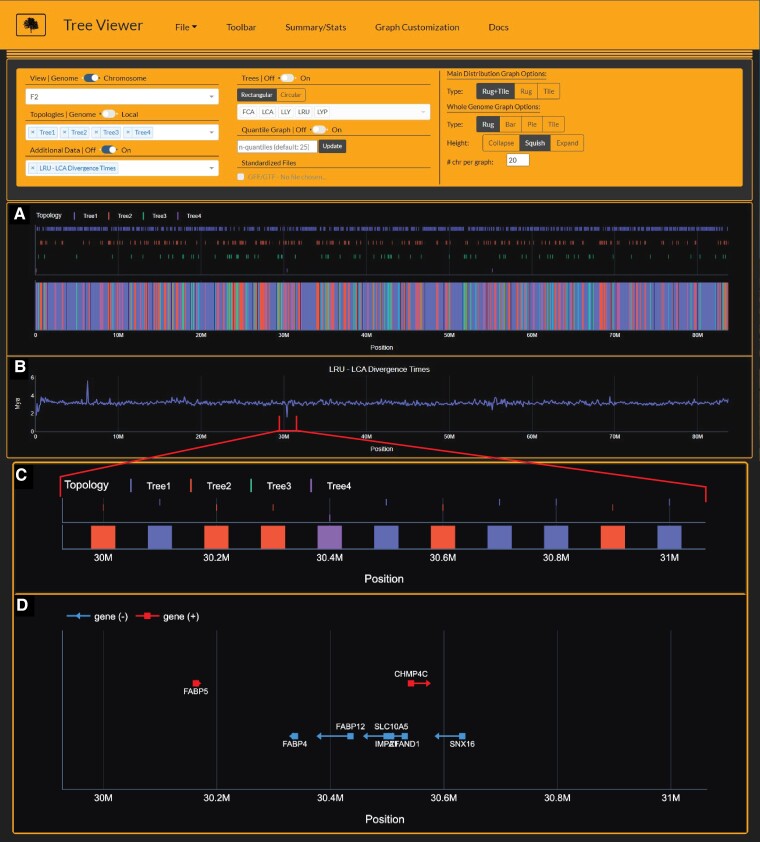
To investigate potential signals of adaptive introgression that may have accompanied past northward range expansions of the bobcat during warmer, interglacial periods, we generated a Tree Viewer input file from the Lynx lineage data set from Li et al. (2019) and added divergence time estimates to the input file (supplementary data 2, Supplementary Material online). We identified 42 windows (0.17%) with significantly lower (> 2 standard deviations from the mean) divergence time estimates and tree topologies that support post-speciation gene flow between the Canada lynx and bobcat (determined using Tree Viewer) (fig. 4B–D, fig. 5). A Gene Ontology (GO) enrichment analysis of the 74 loci with identifiable orthologs from the 42 outlier windows identified ‘fatty-acid binding’ as an overrepresented molecular function (P-value = 3.20 × 10⁻⁶ and false discovery rate = 1.39 × 10⁻²), supporting our hypothesis of adaptive introgression between the Canada lynx and bobcat (Ashburner et al. 2000; Carbon et al. 2021). Three of these windows, located on chromosomes A3 and F2, windows 100.2–100.3Mb and 30.4Mb, respectively (figs. 6 and 7), contained genes involved in adipogenesis and fat storage, all potentially important for adaptation to increasingly colder environments. Spanning the two windows on chromosome A3, RETSAT (Retinol Saturase) is a protein-coding gene known to cause increased adiposity in retinol saturase-knockout mice (Moise et al. 2010). On chromosome F2, several members of the FABP gene family are contained within the window supporting Canada lynx-bobcat hybridization and are all involved in fatty acid uptake, transport, and metabolism (Chmurzynska 2006).
Fig. 5.
Divergence time estimates of bobcat and Canada lynx in windows with topologies reflecting the species tree (Tree 2) and admixed trees (Tree 4, 9, 11). Divergence times from admixed topologies reflect significantly more dispersed and younger estimates supporting post-speciation gene flow between the Canada lynx and bobcat.
Fig. 6.
Tree Viewer interface depicting Lynx lineage phylogenetic signal (A), divergence time estimates (B), and zoomed-in view of Canada lynx-bobcat hybrid window (C) and underlying gene annotations (D) on chromosome A3. Divergence time estimates (time-2) are time estimates for branch 2 for each window's respective tree topology. Importantly, time-2 estimates for Tree4 (Canada lynx-bobcat hybrid topology) indicate estimates for the bobcat, reflecting significantly younger divergence times at windows 29.8Mb, 100.2 Mb, and 100.3Mb (B). Gene annotations from windows 100.2 Mb and 100.3 Mb harbor RETSAT, a gene known to cause increased adiposity in retinol saturase-knockout mice (Moise et al. 2010).
Fig. 7.
Tree Viewer interface depicting Lynx lineage phylogenetic signal (A), divergence time estimates (B), and zoomed-in view of Canada lynx-bobcat hybrid window (C) and underlying gene annotations (D) on chromosome F2. Divergence time estimates (time-2) are time estimates for branch 2 for each window's respective tree topology. Importantly, time-2 estimates for Tree4 (Canada lynx-bobcat hybrid topology) indicate estimates for the bobcat, reflecting significantly younger divergence times at window 30.4 Mb (B). In addition, gene annotations from window 30.4 Mb and adjacent regions (D) harbor the FABP gene family members involved in fatty acid take-up (Chmurzynska 2006).
Compared to the Canada Lynx, the bobcat is smaller in stature and typically occupies warmer environments, and lacks adaptations for deep snow. Bobcats also have poorer thermoregulatory capabilities than Canada lynx (Gustafson 1984; Mautz and Pekins 1989). We speculate that introgressed Canada lynx alleles of RETSAT and the members of the FABP family may provide an adaptive advantage for bobcats at the northern edge of their range to store larger quantities of fat and metabolize it more efficiently during the extremely cold months where prey availability is reduced. Further investigation of the underlying sequence properties and evolutionary rates at the population genetic level and expression patterns of these candidate genes are necessary to validate functional changes that would conclusively support the process of adaptive introgression. Nonetheless, this exercise exemplifies how data visualization using Tree Viewer can accelerate the genotype-phenotype discovery process and provide biological insights overlooked using previous approaches.
Materials and Methods
THEx runs on Windows, macOS, and Linux operating systems and is hosted on Conda. Currently, THExBuilder only supports macOS and Linux as several pipeline dependencies lack support for Windows operating systems. Future development aims to resolve this limitation, enabling THExBuilder to run on all modern operating systems. Gevent, a coroutine-based Python networking library, provides the HTTP web service that communicates all data and user requests (interactions) to Plotly's data analytic web application framework, Dash. Custom Python scripting adds functionality to THEx that is not natively provided in Dash and expands the functionality of existing components natively offered in Dash. All data used to exemplify the uses of THEx herein are available in the example directory on the THEx GitHub (https://github.com/harris-2374/THEx).
For Case Study 2, we used the online Gene Ontology Resource (http://geneontology.org/) to conduct the GO enrichment analysis with 74 genes with identifiable orthologs residing within the 42 windows identified to have significantly younger divergence time estimates and support Canada lynx-bobcat hybridization (supplementary table 4, Supplementary Material online). The domestic cat (Felis catus) was chosen as the reference genome. We employed a Fisher’s exact test and calculated the false discovery rate to test for statistical significance.
Conclusion
THEx provides a novel and holistic approach to phylogenomic analyses that uniquely combines multiple data types to provide genomic context for the distribution of phylogenomic signal in a standalone application. THEx provides highly interactive graphing, making it easy to explore your data from a whole-genome, single chromosome, or local view. This approach facilitates a variety of analyses, including identification of the most probable species relationships, signatures of gene flow, or ILS, all in the context of genomic annotations. THEx utilizes simple input file structures to allow users to generate them with any number of programs like Microsoft Excel or custom scripting and is designed to accommodate beginner and advanced computational biologists. THExBuilder mitigates some of the more challenging aspects of input file creation and manipulation by providing a command-line suite of tools and pipelines. Together, THEx and THExBuilder provide a complete pipeline taking users from raw multiple-sequence alignments to phylogenomic analysis and integrated visualization, all within a single platform.
Supplementary Material
Supplementary data are available at Molecular Biology and Evolution online.
Supplementary Material
Acknowledgments
We thank Jonas Lescroart, Kasuni Daundasekara, and Heath Blackmon for their contributions during the beta phase of development. Their input significantly improved the interactability and overall content within THEx. We thank Gang Li for compiling z-transformed data and gene annotations. We also thank the Texas A&M High performance computing center for providing computational time to run and test the various tools and pipelines developed and implemented within THExBuilder. This work was supported by the U.S. National Science Foundation (award DEB-1753760 to W.J.M. and T.L.W.). A.J.H. was supported by the National Institutes of Health (T32 GM135115).
Contributor Information
Andrew J Harris, Veterinary Integrative Biosciences, Texas A&M University, College Station, TX, USA; Interdisciplinary Program in Genetics & Genomics, Texas A&M University, College Station, TX, USA.
Nicole M Foley, Veterinary Integrative Biosciences, Texas A&M University, College Station, TX, USA.
Tiffani L Williams, Department of Computer Science, University of Illinois at Urbana-Champaign, Urbana, IL, USA.
William J Murphy, Veterinary Integrative Biosciences, Texas A&M University, College Station, TX, USA; Interdisciplinary Program in Genetics & Genomics, Texas A&M University, College Station, TX, USA.
Data Availability
Tree House Explorer can be found on GitHub (https://github.com/harris-2374/THEx) along with all data used within this study. THEx can be installed through Conda following the installation directions on GitHub.
References
- Abascal F, Corvelo A, Cruz F, Villanueva-Canas JL, Vlasova A, Marcet-Houben M, Martinez-Cruz B, Cheng JY, Prieto P, Quesada V, et al. 2016. Extreme genomic erosion after recurrent demographic bottlenecks in the highly endangered Iberian Lynx. Genome Biol 17(1):251. [DOI] [PMC free article] [PubMed] [Google Scholar]
- Ashburner M, Ball CA, Blake JA, Botstein D, Butler H, Cherry JM, Davis AP, Dolinski K, Dwight SS, Eppig JT, et al. 2000. Gene ontology: tool for the unification of biology. Nature Genetics 25(1):25–29. [DOI] [PMC free article] [PubMed] [Google Scholar]
- Carbon S, Douglass E, Good BM, Unni DR, Harris NL, Mungall CJ, Basu S, Chisholm RL, Dodson RJ, Hartline E, et al. 2021. The gene ontology resource: enriching a gold mine. Nucleic Acids Research 49(D1):D325–D334. [DOI] [PMC free article] [PubMed] [Google Scholar]
- Chmurzyńska A. 2006. The multigene family of fatty acid-binding proteins (FABPs): function, structure and polymorphism. J Appl Genet 47(1):39–48. [DOI] [PubMed] [Google Scholar]
- Edelman NB, Frandsen PB, Miyagi M, Clavijo B, Davey J, Dikow RB, Garcia-Accinelli G, Van Belleghem SM, Patterson N, Neafsey DE, et al. 2019. Genomic architecture and introgression shape a butterfly radiation. Science 366(6465):594–599. [DOI] [PMC free article] [PubMed] [Google Scholar]
- Figueiro HV, Li G, Trindade FJ, Assis J, Pais F, Fernandes G, Santos SHD, Hughes GM, Komissarov A, Antunes A, et al. 2017. Genome-wide signatures of complex introgression and adaptive evolution in the big cats. Sci Adv 3(7):e1700299. [DOI] [PMC free article] [PubMed] [Google Scholar]
- Genereux DP, Serres A, Armstrong J, Johnson J, Marinescu VD, Muren E, Juan DV, Bejerano G, Casewell NR, Chemnick LG, et al. 2020. A comparative genomics multitool for scientific discovery and conservation. Nature 587(7833):240–245. [DOI] [PMC free article] [PubMed] [Google Scholar]
- Gustafson KA. 1984. The winter metabolism and bioenergetics of the bobcat in New York Ph.D. Thesis State University of New York.
- Hennelly LM, Habib B, Modi S, Rueness EK, Gaubert P, Sacks BN. 2021. Ancient divergence of Indian and Tibetan wolves revealed by recombination-aware phylogenomics. Mol Ecol 30:6687–6700. [DOI] [PubMed] [Google Scholar]
- Homyack JA, Vashon JH, Libby C, Lindquist EL, Loch S, McAlpine DF, Pilgrim KL, Schwartz MK. 2008. Canada lynx-bobcat (Lynx canadensis X L. rufus) hybrids at the southern periphery of lynx range in Maine, Minnesota and New Brunswick. American Midland Naturalist 159(2):504–508. [Google Scholar]
- Huerta-Cepas J, Serra F, Bork P. 2016. ETE 3: reconstruction, analysis, and visualization of phylogenomic data. Molecular Biology and Evolution 33(6):1635–1638. [DOI] [PMC free article] [PubMed] [Google Scholar]
- Kent WJ, Sugnet CW, Furey TS, Roskin KM, Pringle TH, Zahler AM, Haussler AD. 2002. The human genome browser at UCSC. Genome Research 12(6):996–1006. [DOI] [PMC free article] [PubMed] [Google Scholar]
- Koen EL, Bowman J, Lalor JL, Wilson PJ. 2014. Continental-scale assessment of the hybrid zone between bobcat And Canada lynx. Biological Conservation 178:107–115. [Google Scholar]
- Letunic I, Bork P. 2021. Interactive tree of life (iTOL) V5: an online tool for phylogenetic tree display and annotation. Nucleic Acids Res 49(W1):W293–W296. [DOI] [PMC free article] [PubMed] [Google Scholar]
- Li G, Davis BW, Eizirik E, Murphy WJ. 2016. Phylogenomic evidence for ancient hybridization in the genomes of living cats (felidae). Genome Research 26(1):1–11. [DOI] [PMC free article] [PubMed] [Google Scholar]
- Li G, Figueiro HV, Eizirik E, Murphy WJ. 2019. Recombination-aware phylogenomics reveals the structured genomic landscape of hybridizing cat species. Mol Biol Evol 36(10):2111–2126. [DOI] [PMC free article] [PubMed] [Google Scholar]
- Martin DP, Murrell B, Golden M, Khoosal A, Muhire B. 2015. RDP4: detection and analysis of recombination patterns in virus genomes. Virus Evolution 1(1):vev003. [DOI] [PMC free article] [PubMed] [Google Scholar]
- Mautz WW, Pekins PJ. 1989. Metabolic-rate of bobcats as influenced by seasonal temperatures. Journal of Wildlife Management 53(1):202–205. [Google Scholar]
- Moise AR, Lobo GP, Erokwu B, Wilson DL, Peck D, Alvarez S, Dominguez M, Alvarez R, Flask CA, de Lera AR, et al. 2010. Increased adiposity in the retinol saturase-knockout mouse. FASEB J 24(4):1261–1270. [DOI] [PMC free article] [PubMed] [Google Scholar]
- Moore RM, Harrison AO, McAllister SM, Polson SW, Wommack KE. 2020. Iroki: automatic customization and visualization of phylogenetic trees. PeerJ 8:e8584. [DOI] [PMC free article] [PubMed] [Google Scholar]
- Nelson TC, Stathos AM, Vanderpool DD, Finseth FR, Yuan YW, Fishman L. 2021. Ancient and recent introgression shape the evolutionary history of pollinator adaptation and speciation in a model monkeyflower radiation (Mimulus section Erythranthe). PLoS Genet 17(2):e1009095. [DOI] [PMC free article] [PubMed] [Google Scholar]
- Newton RR, Newton ILG. 2013. Phybin: binning trees by topology. PeerJ 1:e187. [DOI] [PMC free article] [PubMed] [Google Scholar]
- Rambaut A. 2006. FigTree 2006.http://tree.bio.ed.ac.uk/software/figtree/
- Robinson DF, Foulds LR. 1981. Comparison of phylogenetic trees. Mathematical Biosciences 53(1-2):131–147. [Google Scholar]
- Schwartz MK, Pilgrim KL, McKelvey KS, Lindquist EL, Claar JJ, Loch S, Ruggiero LF. 2004. Hybridization between Canada lynx and bobcats: genetic results and management implications. Conservation Genetics 5(3):349–355. [Google Scholar]
- Small ST, Labbe F, Lobo NF, Koekemoer LL, Sikaala CH, Neafsey DE, Hahn MW, Fontaine MC, Besansky NJ. 2020. Radiation with reticulation marks the origin of a major malaria vector. Proc Natl Acad Sci U S A 117(50):31583–31590. [DOI] [PMC free article] [PubMed] [Google Scholar]
- Thorvaldsdottir H, Robinson JT, Mesirov JP. 2013. Integrative genomics viewer (IGV): high-performance genomics data visualization and exploration. Brief Bioinform 14(2):178–192. [DOI] [PMC free article] [PubMed] [Google Scholar]
- Wagner R, Toups BS, Deng Z, Gallivan KA, Brown JM, Wilgenbusch JC. 2021. Investigating the genomic distribution of phylogenetic signal with CloudForest. Practice and Experience in Advanced Research Computing (PEARC’ 21); July 18–22, 2021; Boston, MA, USA. ACM, New York, NY, USA; 2021. 4 pages.
Associated Data
This section collects any data citations, data availability statements, or supplementary materials included in this article.
Supplementary Materials
Data Availability Statement
Tree House Explorer can be found on GitHub (https://github.com/harris-2374/THEx) along with all data used within this study. THEx can be installed through Conda following the installation directions on GitHub.


