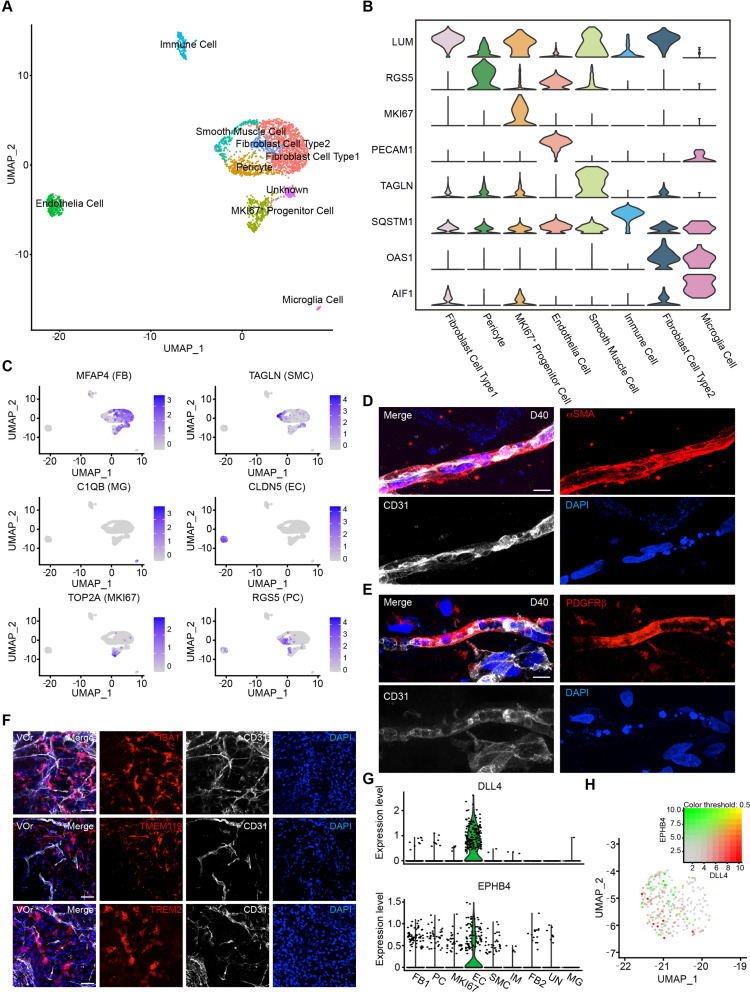
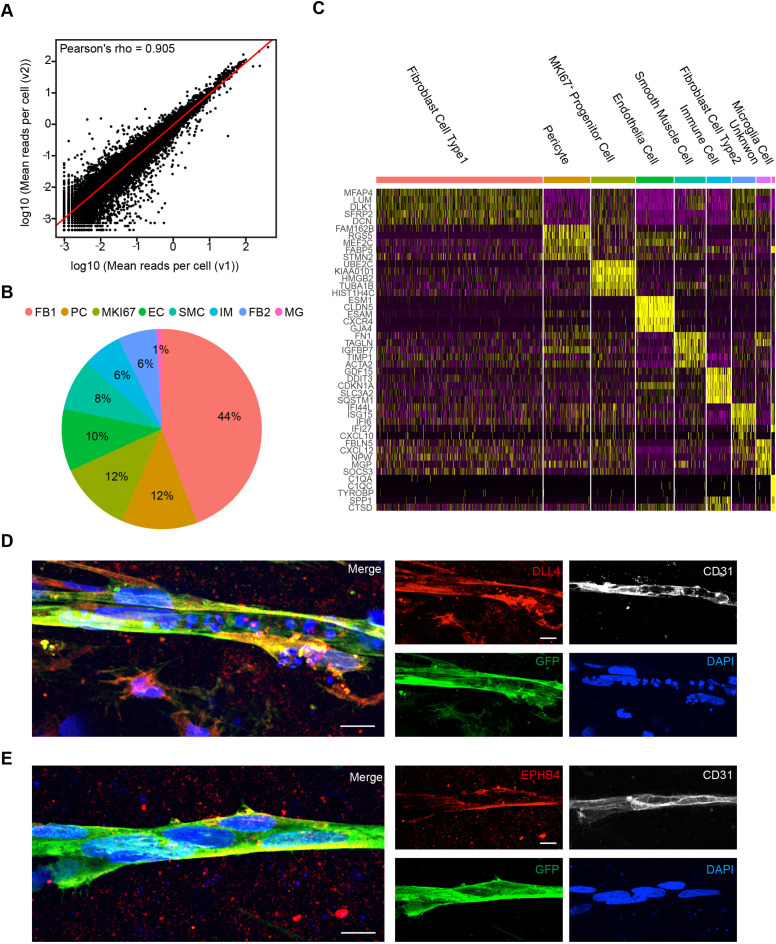
Figure 2. Single-cell transcriptomic analysis of vessel organoids (VOrs).
(A) UMAP plot showing the nine major cell types isolated from day (D) 40 VOrs. (B) Violin plots showing the expression value of the typical markers in each cluster. (C) Expression pattern of cell-type-specific markers in VOrs. Relative expression level is plotted from gray (low) to blue (high) colors. (D) Immunostaining of αSMA for representing the smooth muscle cells in VOrs. Scale bar, 10 μm. (E) Immunostaining of PDGFRβ for representing the pericytes in VOrs. Scale bar, 10 μm. (F) Immunostaining of microglia markers (IBA1, TREM2, TMEM119) and endothelial marker CD31 in VOrs at D40. Scale bar, 20 μm. (G) Violin plots showing the expression value of the venous marker EPHB4 and arterial marker DLL4 in endothelial cell (EC) clusters. (H) Expression pattern of arterial and venous markers in EC clusters. Relative expression level is plotted from gray to green (EPHB4) or red (DLL4) colors.


