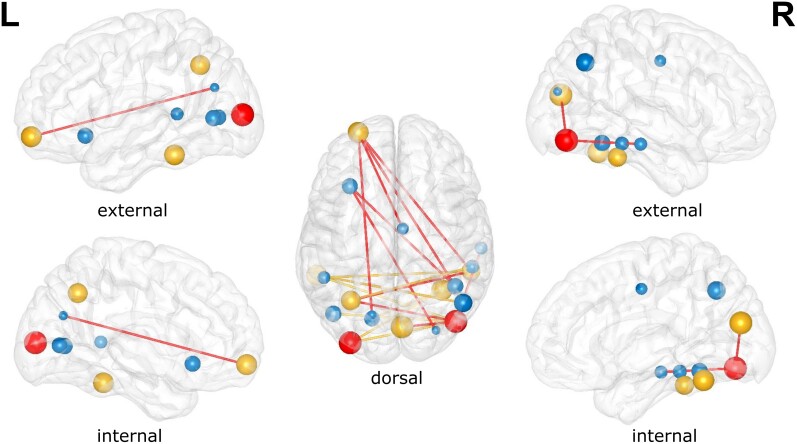
Figure 3.
Outcome of NBS analysis. All edges represent the differential topography between VH and NVH obtained with tth = 14. Red edges are obtained with tth = 15.4. Non-blue nodes have significantly different strength between groups (P < 0.05). Red nodes survive Holm–Bonferroni correction; these comprise the right inferior-occipital gyrus and sulcus and left middle occipital sulcus and lunatus sulcus. Sphere size is inversely proportional to node’s corresponding P-value from the node strength test.

