Abstract
Computed tomography (CT) and magnetic resonance imaging (MRI) have replaced conventional radiography in the study of many spinal conditions, it is essential to know when these techniques are indicated instead of or as complementary tests to radiography, which findings can be expected in different clinical settings, and their significance in the diagnosis of different spinal conditions. Proper use of CT and MRI in spinal disorders may facilitate diagnosis and management of spinal conditions. An adequate clinical approach, a good understanding of the pathological manifestations demonstrated by these imaging techniques and a comprehensive report based on a universally accepted nomenclature represent the indispensable tools to improve the diagnostic approach and the decision-making process in patients with spinal pain. Several guidelines are available to assist clinicians in ordering appropriate imaging techniques to achieve an accurate diagnosis and to ensure appropriate medical care that meets the efficacy and safety needs of patients. This article reviews the clinical indications of CT and MRI in different pathologic conditions affecting the spine, including congenital, traumatic, degenerative, inflammatory, infectious and tumor disorders, as well as their main imaging features. It is intended to be a pictorial guide to clinicians involved in the diagnosis and treatment of spinal disorders.
Keywords: Spine, computed tomography (CT), magnetic resonance imaging (MRI), back pain, spinal disorder, spinal diseases, osteoporotic fracture
Introduction
The widespread use of computed tomography (CT) and magnetic resonance imaging (MRI) for imaging spinal disorders has led to a decrease in the use of radiography as the first imaging modality in many clinical settings. Several guidelines are available to assist clinicians in ordering appropriate imaging techniques to achieve an accurate diagnosis and to ensure appropriate medical care that meets the efficacy and safety needs of patients (1-5).
When advanced imaging of the lumbar spine is required, MRI is often recommended over CT, due to the higher soft tissue contrast of the former and the use of ionizing radiation of the latter (6,7). Nevertheless, CT is still a useful technique for the study of bone structure and the follow-up of interventional procedures.
Because CT and MRI have replaced conventional radiography in the study of many spinal conditions, it is essential to know when these techniques are indicated instead of or as complementary tests to radiography, which findings can be expected in different clinical settings, and their significance in the diagnosis of different spinal conditions.
General indications for CT and MRI of the spine
The primary indications for CT of the spine mainly include the evaluation of congenital anomalies, alignment abnormalities, traumatic injuries, and postoperative evaluation, sometimes with the use of intrathecal contrast.
On the other hand, MRI is the technique of choice in patients with suspected spinal cord injury or compression, in the presence of warning signs such as cauda equina syndrome, neoplasia or infection, or in case of complicated low back pain (e.g., persistent for more than 6 weeks despite conservative treatment), either because the patient is a candidate for intervention or surgery or because there is no diagnostic certainty. Patients with recurrent pain after surgery should be studied using contrast-enhanced MRI (1-5).
CT and MRI in congenital conditions of the spine
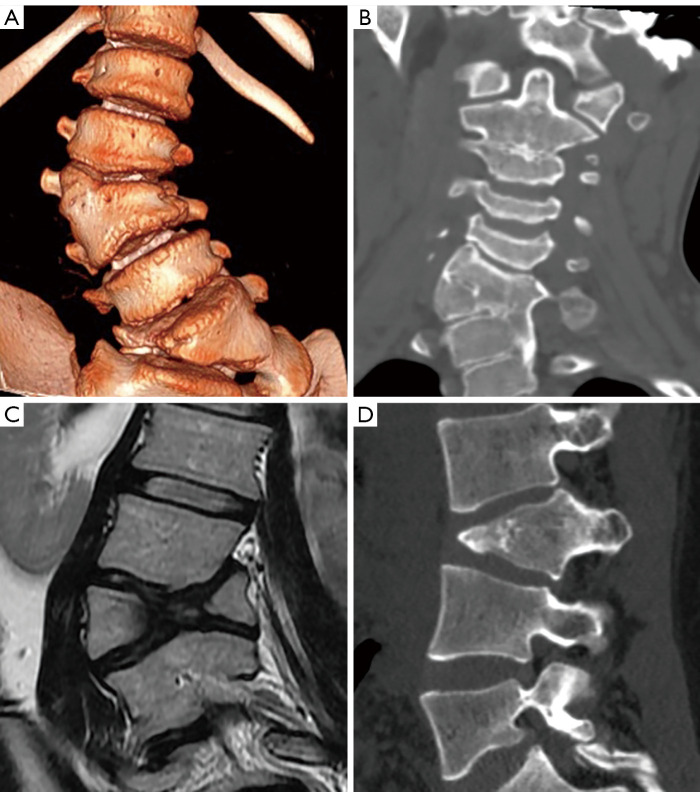
Congenital alterations of the spine can be simple, when there is no associated spinal deformity or they have little or no clinical significance, or complex, when they are associated with severe deformities. Morphologically, congenital alterations of the spine can be classified as secondary to defects involving vertebral formation, vertebral segmentation, or both (8,9). In the first case, all or part of the vertebra is not well formed/developed, leading to deformities such as agenesis, hemivertebrae, wedged or butterfly vertebrae. In the second case, the embryonic vertebrae do not separate, resulting in congenital vertebral block when complete, or unsegmented bar formation when incomplete (Figure 1).
Figure 1.
Congenital deformities. (A) Scoliosis secondary to a semi-segmented hemivertebra. (B) Klippel-Feil syndrome with formation and segmentation abnormalities. (C) Scoliosis secondary to asymmetric butterfly vertebra [from reference (10)]. (D) Kyphosis secondary to anterior failure of vertebral formation.
Congenital deformities can also be classified according to the pattern of curvature. Among patients with congenital spinal deformities, 80% had scoliosis, 14% had kyphoscoliosis, and 6% had pure kyphosis. Hemivertebra is the most common cause of congenital scoliosis followed by unilateral unsegmented bar. Segmented hemivertebra is the most frequent and dangerous form because, totally separated from its adjacent vertebrae, it grows and acts as a wedge that enlarges and leads to progressive scoliosis. A semi-segmented hemivertebra is synostosed to one of the neighbouring vertebrae, thus the potential of growing deformity is usually lower. Finally, incarcerated hemivertebrae are inserted in a niche of the spine with no significant disc spaces and, therefore, they show less growth potential and minor deformity (8) (Figure 1).
Anterior failure of vertebral body formation is the most common cause of congenital kyphosis or kyphoscoliosis, followed by segmentation failure and mixed abnormalities (8). It has been classified into posterolateral quadrant vertebra (35%), posterior hemivertebra (7%), butterfly vertebra (13%) and anterior wedge vertebrae (5%) (11) (Figure 1).
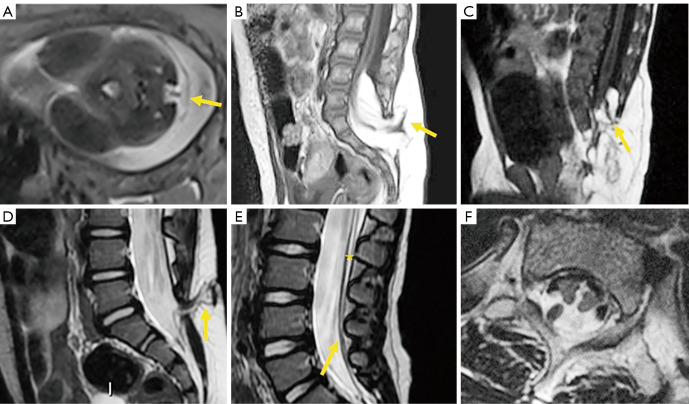
Vertebral malformations have also been classified according to the underlying embryopathy. When abnormalities occur in the early phase of notochord formation, the gastrulation phase in the first 2–3 weeks of embryo development, malformations may affect structures derived from the three germinal cell layers, including the neuroaxis and axial skeleton. Abnormalities during primary or secondary neurulation (3–6 weeks) can also contribute to these malformations. These congenital malformations of the spine and spinal cord are collectively referred to as spinal dysraphism. Depending on the presence or absence of overlying skin covering, spinal dysraphism is divided into open and closed types. Myelomeningocele account for 98% of open dysraphism in which both the neural placode and meningeal lining protrude through the bony and cutaneous defect in the midline. Closed spinal dysraphism can be further classified according to the presence or absence of a subcutaneous mass. In the presence of a subcutaneous mass, two main forms of closed dysraphism can be differentiated: lipomyelocele and lipomyelomeningocele. They can be differentiated based on the position of the neural placode-lipoma interface, which lies within and out of the limits of the spinal canal, respectively. When no subcutaneous mass is present, several simple dysraphic states can be distinguished, including intradural lipoma, filar lipoma, tight filum terminale, dermal sinus and persistent terminal ventricle. Finally, there are other complex dysraphic states such as dorsal enteric fistula, neuroenteric cyst, split notochord syndrome, split cord/diastematomyelia, caudal regression syndrome, and segmental spinal dysgenesis (12-14) (Figure 2).
Figure 2.
Spinal dysraphism. (A) Myelomeningocele in open dysraphism in intrauterine fetus showing the protruded placode (arrow). (B) Posterior closed dysraphism with lipomyelomeningocele. The lipoma/placode interface (arrow) is outside the spinal canal. (C) Lipomyelocele The lipoma/placode interface (arrow) is within the spinal canal. (D) Dermal sinus (arrow). (E) Tethered cord with filum terminale lipoma (*) and filar thickening (arrow). (F) Split cord/diastematomyelia.
Radiography is usually the first imaging method to study congenital vertebral anomalies and related deformities, allowing their classification, evaluation of severity, risk of deformity progression, and vertebral count (15). As the number of bone malformations increases, there is a higher incidence of cord anomalies ranging from 20% to 58% (9,15,16), being higher in the presence of combined failures of segmentation and formation. Deformities in the sacrococcygeal area present the highest rate of spinal cord anomalies (16). MRI is the appropriate technique for complete evaluation of intraspinal abnormalities, including the presence of Chiari malformation or syrinxes, anomalies of the conus medullaris, or tethered cord syndrome (TCS). Filar thickness >2 mm measured at the L5-S1 level is considered abnormal. Proximal to this level, the stretched filum may falsely appear of normal thickness (17,18). CT may also be useful in defining the anatomy of vertebral deformities in pre-surgical planning (19). The information provided by imaging methods should be accurate, reporting the correct type of malformation is fundamentally important in the decision-making process (8,18).
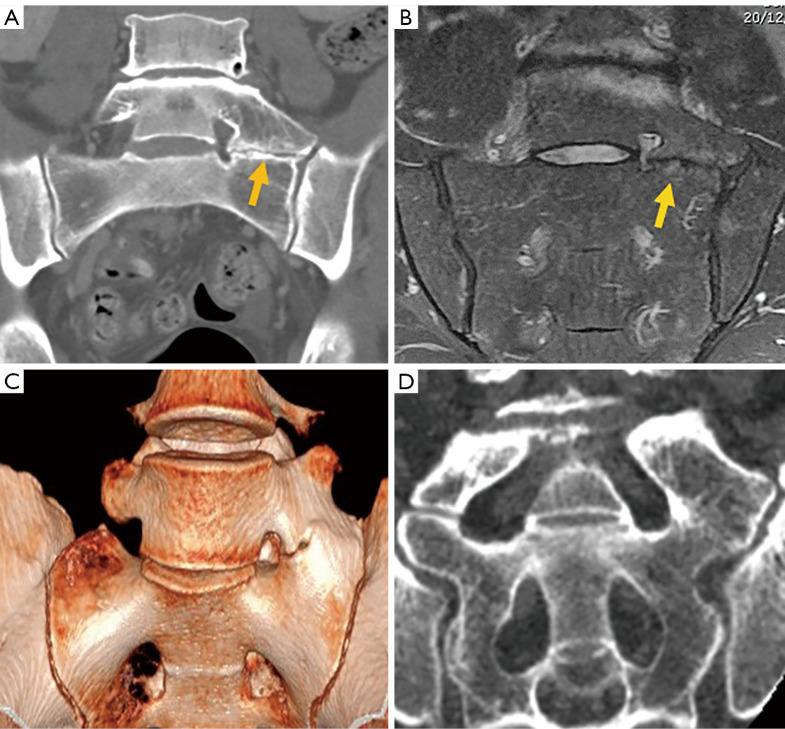
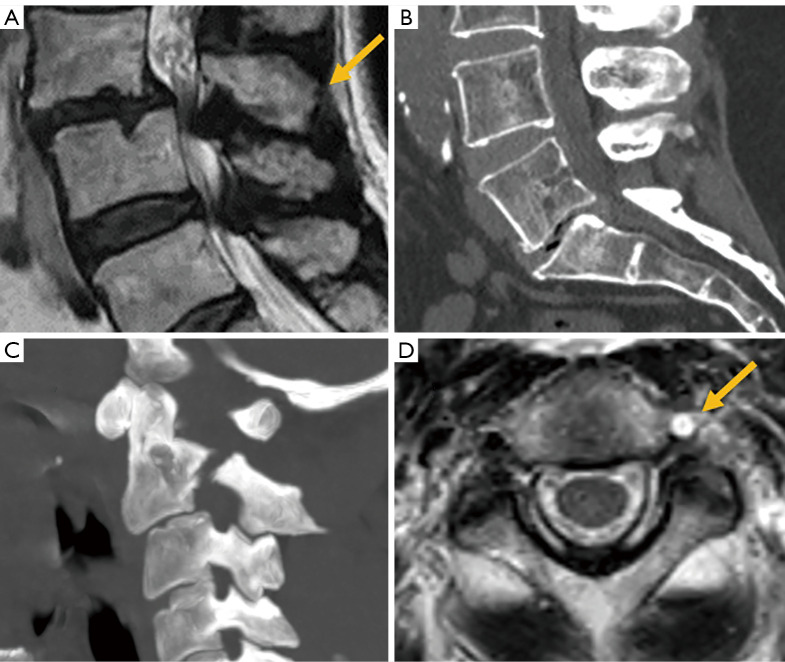
Among simple congenital abnormalities, transitional vertebra is considered a developmental variant secondary to failed segmentation. The estimated mean prevalence is 7.5% for sacralization and 5.5% for lumbarization (20), ranging from 9.9% to 28.6% (21). The Castellvi classification is the most widely used to categorize lumbosacral transitional anomalies: type I refers to unilateral or bilateral enlarged transverse processes, type II includes unilateral or bilateral pseudo-articulation between the transverse process and the sacrum, type III refers to unilateral or bilateral fusion of the transverse process with the sacrum, and type IV is when there is unilateral fusion and contralateral pseudo-articulation. Types II and IV, in which a dysplastic transverse processes articulates with the sacrum, show a positive correlation with the presence of low back pain due to mechanical stress, or extraforaminal nerve compression at the transitional level (22-24) (Figure 3). Nevertheless, a recent study suggests that Castellvi type III seems to be associated with prolonged low back pain (21). Many authors consider that degenerative findings more commonly occur in transitional vertebrae above the transitional level (21,25).
Figure 3.
Castellvi types of transitional vertebra in three cases. Type II on CT depicting the neo articulation (arrow) (A) and MRI (B) showing the subchondral edema (arrow). (C) Type III on 3D CT. (D) Type IV on coronal CT. CT, computed tomography; MRI, magnetic resonance imaging.
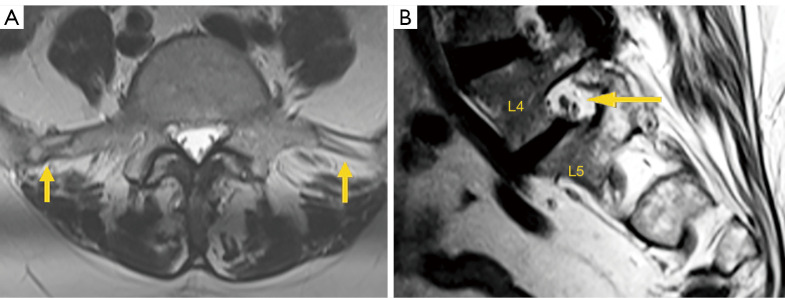
Differentiating lumbarization from sacralization on MRI may be challenging when a complete vertebral count of the entire spine cannot be performed. Several methods have been described to identify the level of the vertebral body. The iliolumbar ligament is present in 85.7% of cases and extends from the L5 transverse process to the iliac wing in 96% (26). Other anatomical landmarks, such as the level of the conus medullaris, right renal artery, superior mesenteric artery, aortic bifurcation, or iliac crest height, are considered less accurate (27,28). More recently, identification of the nerve root of L5, with no proximal branching, has demonstrated 98% accuracy to identify the L5 vertebral body (29) (Figure 4).
Figure 4.
Transitional vertebral. (A) Iliolumbar ligament at L5 (arrows). (B) Splitting pattern of L4 (arrow) compared to L5 nerve root.
Transitional anomalies can also be found at the cervicothoracic junction. Cervical ribs are the most frequent transitional abnormalities and have been described in association with lumbar sacralization. Another less known transitional anomaly is the elongation of the anterior tubercle of the cervical transverse process, which can lead to fusion of two vertebrae, typically C5 and C6 (30).
Traumatic pathologies
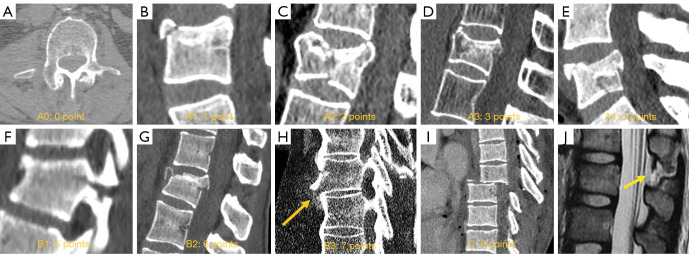
Conventional radiography has been largely superseded by CT for the assessment of traumatic spinal injury (2). The reported sensitivity values of the former are much lower compared to CT at the cervical and thoracolumbar spine, ranging from 36% to 65% in the former case (31,32), and from 49% to 82% in the latter (33-35). The most widely accepted classification system at present is mainly based on CT findings, either at the cervical (36) or thoracolumbar (37) level. The thoracolumbar fracture system scores include the morphology of the fracture (0–8 points) and the neurological status (0–4 points), but also other modifying variables such as the status of ligaments, which can tilt the balance between medical or surgical treatment. Three types of vertebral injuries based on morphological criteria have been described, with a total of 9 subgroups which are classified into three main categories: (I) compression injuries, (II) tension band injuries, and (III) translational injuries (Figure 5). The score strongly influences the therapeutic management. Injuries with a score of less than or equal to three points are treated non-surgically, those with more than five points are managed surgically, while both options are acceptable for scores of four and five points. Therefore, all B2, B3 and C type fractures must be managed surgically, unless there is a medical contraindication. Both surgical and non-surgical treatment can be applied to type A4 and B1 fractures. The remaining fracture subtypes can be managed conservatively, except when neurological or other clinical modifiers increase score severity (38). One of the modifiers included in this score is the status of the ligamentous complex, which adds 1 point when altered. Indirect signs of posterior ligamentous complex (PLC) injury include vertebral translation greater than 3.5 mm (39) and increased interspinous distance (40). Regarding the interspinous distance, variations of up to 7 mm can be normal, while 20% widening compared to adjacent levels is considered as an indirect sign of unstable PLC, that frequently results in surgical treatment (40).
Figure 5.
AO-Spine thoracolumbar fracture classification score. (A) A0. Apophyseal fracture. (B) A1. Compression fracture without involvement of the posterior wall. (C) A2. Split fracture without involvement of the posterior wall. (D) A3. Burst fracture with involvement of one endplate. (E) A4. Burst fracture with involvement of both endplates. (F) B1. Trans osseous fracture. (G) B2. Posterior tension band injury fracture. (H) B3. Anterior tension band injury fracture (arrow). (I) Fracture dislocation injury type C. (J) MRI showing flavum (arrow), interspinous and supraspinous ligamentum tear. AO, Arbeitsgemeinschaft für Osteosynthesefragen; MRI, magnetic resonance imaging.
MRI is primarily indicated when doubts about the most suitable treatment persist after CT evaluation of the fracture, as it allows quantification of spinal cord damage and assessment of the presence and severity of PLC injury (41). Ligament rupture on MRI is evidenced as a frank interruption of a normally dark ligament, which is replaced by fluid of high signal intensity on fluid sensitive MRI sequences. The accuracy of MRI has been reported to be higher for detecting injuries of the supraspinous ligament and ligamentum flavum, and slightly lower for injuries to the interspinous ligament and facet capsule (42) (Figure 5). The integrity of the PLC may imply a change in treatment strategy towards conservative therapy or minimally invasive surgery (43).
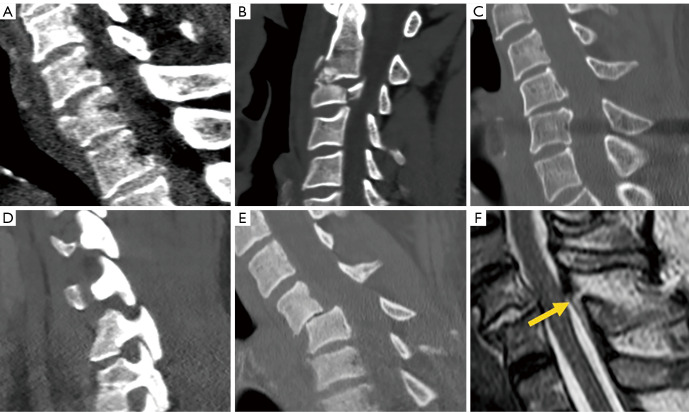
In terms of morphology, the classification is similar at the cervical and lumbar spine, except for subtle differences in individual scoring categories, and the fact that the ligaments are considered along with the disc complex, i.e., disco-ligamentous complex (DLC). Morphology score (0–4 points), DLC score (0–2 points) and neurologic status (0–4 points) are thus considered in the decision-making process; fractures with score ≤3 are managed conservatively and fractures with score ≥5 surgically, whereas in fractures with score 4 both options are acceptable (44) (Figure 6).
Figure 6.
AO-Spine subaxial fracture classification score. (A) Compression fracture; (B) burst fracture; (C) tension band injury fracture; (D) locked facets; (E) fracture dislocation; (F) sagittal T2 weighted images showing ligamentum flavum and supraspinous ligaments tear (arrow). AO, Arbeitsgemeinschaft für Osteosynthesefragen.
No morphometric abnormalities related to the trauma scores 0 point. Simple compression receives 1 point, whereas a burst fracture receives 2 points. Distraction injuries, including perched facets, receive 3 points. Rotation/translation injuries score 4 points (45).
The DLC consists of the intervertebral disc, anterior and posterior longitudinal ligaments, interspinous ligaments, facet capsules, and ligamentum flavum. Accordingly, DLC status can be scored as 0 (intact), 1 (indeterminate, isolated MRI signal change or isolated widening of the spinous process), and 2 (disrupted, widening of the disc, facet perch or locked) (46) (Figure 6).
Facet fractures are additionally classified as follows: F1 fractures when non-displaced fractures present with fragments smaller than 1 cm or less than 40% involvement of the lateral mass; F2 fractures are those that have the potential to be unstable (i.e., a fragment greater than 1 cm, involvement of more than 40% of the lateral mass, or presence of facet displacement). F3 fractures consist of a floating lateral mass that occurs when the fracture of the pedicle and lamina isolate the lateral mass from the vertebral body. Finally, F4 fractures include subluxation and/or facet lock. A ‘bilateral modifying factor’ applies when the same type of facet injury bilaterally affects the same vertebra.
Although the neurological status is usually assessed clinically, MRI allows correlating clinical neurological findings with the severity and extent of spinal cord damage. Therefore, MRI is useful in determining the exact location and extent of damage. Spinal cord injuries are classified into three types based on T2-weighted and/or T2*-gradient echo images: (I) represents cord hemorrhage, shows initial hypointensity on MRI and carries a poor prognosis; (II) represents cord edema, shows initial hyperintensity and bears the best prognosis; (III) is considered as a contusion or small central hemorrhage surrounded by edema, shows a mixed pattern, and has an intermediate prognosis (47) (Figure 7).
Figure 7.
Traumatic spinal cord injury. (A) Type I, hemorrhagic lesion; (B) Type II, edematous injury; (C) Type III, mixed injury.
Modifying factors at the cervical level include M1, which describes the existence of an incomplete injury to the PLC. M2 includes the presence of a critical disc herniation protruding posteriorly to a line that continues the posterior border of the vertebra below the level of the fracture. It should be noted that the incidence of disc herniation in the setting of spinal trauma is low, around 0.4% (48). M3 is a modifying factor that assesses the presence of a metabolic disease that stiffens the spine such as diffuse idiopathic skeletal hyperostosis (DISH), ankylosing spondylitis (AS), or ossifications of the posterior longitudinal ligament and ligamenta flava. Finally, the M4 factor considers the presence of signs of vertebral artery injury.
MRI is considered inferior to CT in the identification and characterization of cortical fractures, but superior in the identification of soft tissue injuries and trabecular fractures of the vertebral bodies. MRI is indicated if there is suspicion of myelopathy or ligament instability, or if a hematoma or disc herniation needs to be ruled out before proceeding with closed reduction of locked cervical facets. Myelopathy can be compressive due to acute traumatic herniation or the presence of a bony fragment or extramedullary hematoma. Epidural hematomas usually show an iso-hyperintense signal on T1 weighted images and hyperintensity on T2 weighted images. The incidence of epidural hematomas after trauma has been estimated at about 2.5%, although 59% of them were associated with cord compression (49,50). Diffusion tensor imaging (DTI) with measurement of the apparent diffusion coefficient (ADC) and fractional anisotropy (FA), as well as tractography, allow quantitative data to be obtained on the axonal integrity of the spinal cord in traumatized patients (51).
Low energy vertebral fractures
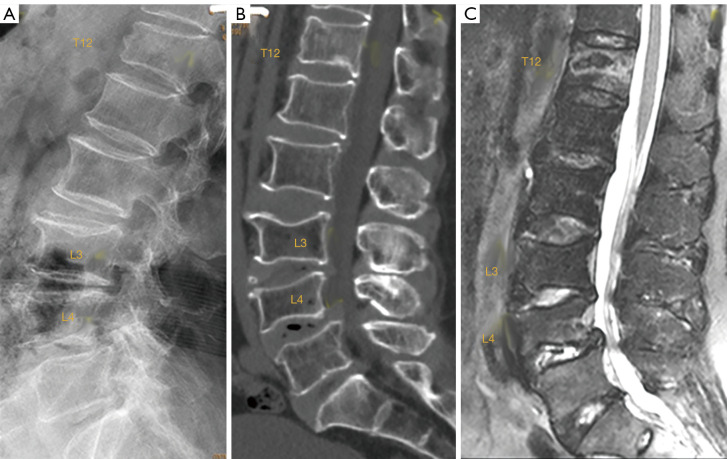
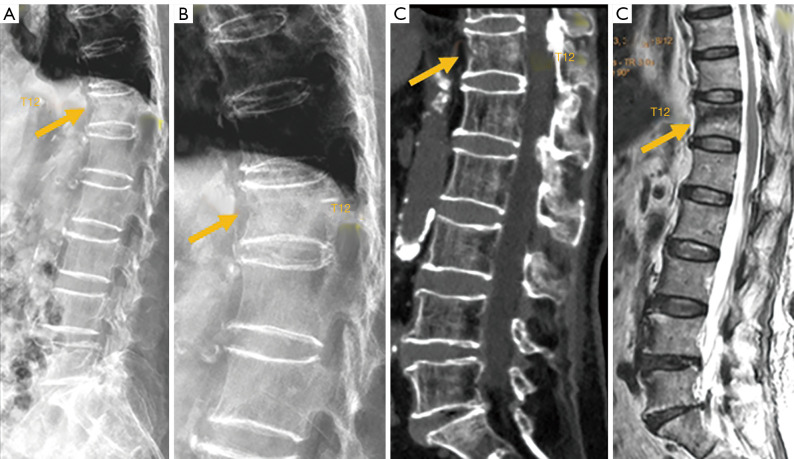
The development of a vertebral fracture following minor trauma is a hallmark of osteoporosis. These fractures can be characterized and quantified by radiography or CT, but MRI is the best option for detecting edema, which is considered a sign of acute or unstable chronic fracture. In addition, the morphological changes that allow the diagnosis of osteoporotic fractures may take time to develop. Therefore, non-visualization of a vertebral fracture on plain radiography in an osteoporotic patient does not exclude its presence. MRI can detect fractures without vertebral deformity. In elderly patients with spinal trauma, in addition to the traumatic fracture, attention should be paid to screen whether other chronic osteoporotic vertebral fractures (OVF) or deformities (OVD) exist (Figure 8). Trauma signs on radiographs can be very subtle, and particular attention should be paid to buckling of the anterior vertebral cortex (52) (Figure 9).
Figure 8.
Elderly patient with spine trauma. (A) Radiograph; (B) sagittally reconstructed CT; (C) sagittal T2 weighted fat suppressed MRI. A T12 traumatic fracture, L3 chronic osteoporotic upper endplate fracture, and L4 chronic osteoporotic deformity (i.e., fracture) are detected. For T12, on radiograph, attention should be paid to the anterior cortex fracture and vertebral height loss, while on MRI apparent abnormal high signal is noted. Conversely, L3 and L4 show deformity, but no abnormal high signal is noted on MRI. CT, computed tomography; MRI, magnetic resonance imaging.
Figure 9.
Subtle osteoporotic fracture after low energy trauma (arrow). (A) Radiograph; (B) radiograph magnified view for T12; (C) sagittally reconstructed CT; (D) T1 weighted MRI. On radiograph T12 vertebral anterior cortex buckling is noted. There is no apparent height loss of the vertebral body. CT confirms T12 fracture and vertebral anterior cortex break. MRI also confirms T12 fracture. CT, computed tomography; MRI, magnetic resonance imaging.
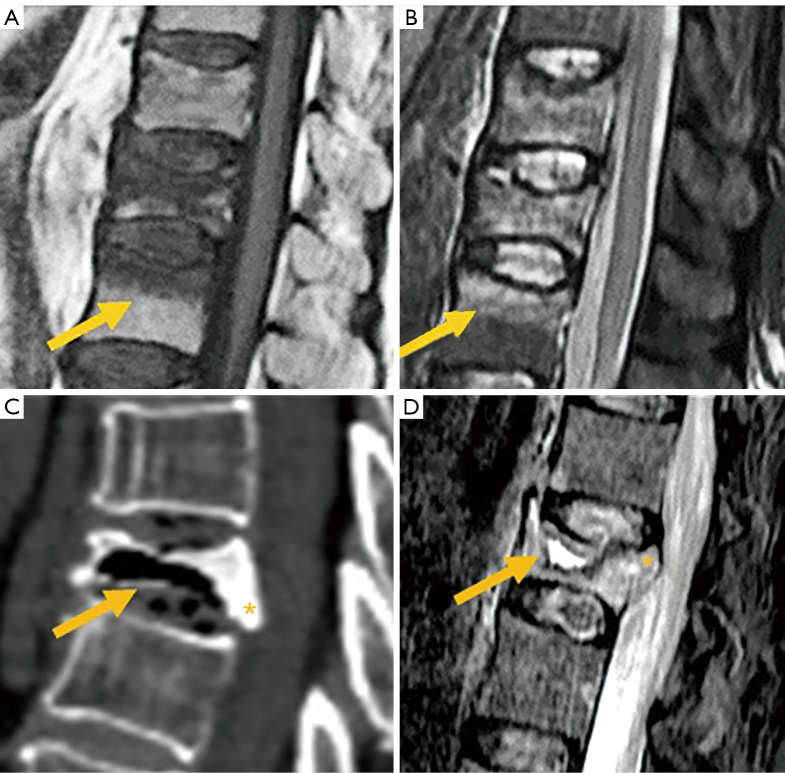
On MRI, changes in vertebral signal intensity depend on the age of the fracture (Figure 10). Acute fractures usually show a band-like pattern of bone edema, located subchondral to the vertebral platform, with preservation of the normal signal intensity in the rest of the vertebral body. The linear image of the fracture can often be identified within the area of subchondral edema. The margin between the edema and the normal bone marrow is usually regular and well defined. Bone marrow oedema (BMO) usually resolves within 1 to 3 months, provided the fracture stabilizes. If it remains unstable, the edema can become chronic and be associated with sclerotic changes (10).
Figure 10.
Osteoporotic fractures. Sagittal T1 (A) and STIR (B) showing the band like edema pattern (arrows). (C) Burst fracture with intravertebral vacuum cleft (arrow) and retropulsion of the posteroinferior margin (*). (D) Sagittal STIR with intravertebral liquid cleft (arrow) and retropulsion of posterosuperior margin (*). STIR, short tau inversion recovery.
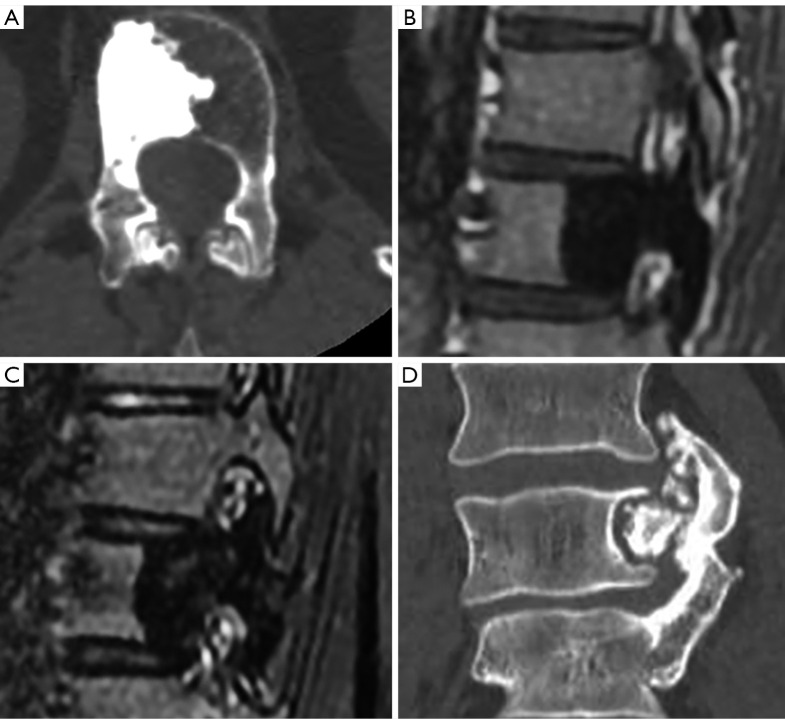
Fissures or cysts of air or fluid content may also form within the vertebral body. Their presence indicates intravertebral instability or lack of repair of the fracture site and are much more frequent in OVFs than in pathological fractures due to tumor involvement of the vertebral bodies (53,54). With the chronicity of the fracture, the fat signal from the vertebral bone marrow is recovered. Regarding morphology, the retropulsion of a bone fragment into the canal indicates a burst fracture and is considered a specific sign of benignity (Figure 10C,10D).
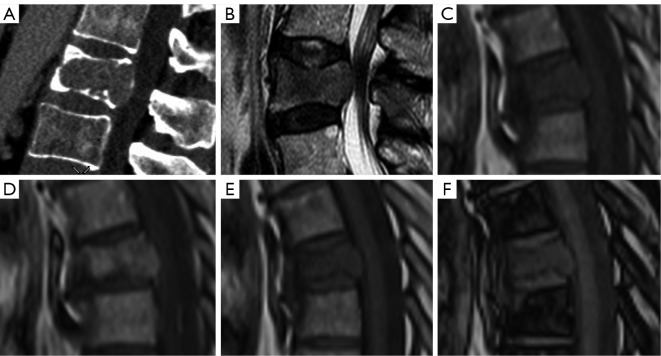
Finally, it should be noted that the age group with high prevalence of OVF also has a high prevalence of metastatic spinal tumors. Differentiating between OVD and metastatic deformity can be sometimes difficult using radiography alone. In such cases, MRI is the preferred imaging technique for differential diagnosis (10). Visualization of the convex posterior border of the vertebral body, extension into the posterior elements, and diffuse abnormal bone marrow signal are suggestive of pathologic fracture (55) (Figure 11).
Figure 11.
Pathologic fracture in several cases of metastatic lung cancer. Sagittal CT (A) and sagittal T2 weighted images (B) showing convex posterior border. Sagittal T1 weighted image without (C) and with (D) contrast in pathologic fracture. In phase (E) and out of phase (F) showing lack of fat in this metastatic vertebra, with a signal intensity out phase/phase ratio of 0.95. CT, computed tomography.
The role of contrast agents in the differentiation between benign and malignant fractures has also been discussed in the literature. At the intraosseous level, benign fractures exhibit a gadolinium enhancement pattern equivalent to that of the adjacent normal vertebrae, with T1 signal intensity analogous to the normal appearance of non-fractured vertebrae. Conversely, gadolinium enhancement in malignant fractures is usually more heterogeneous and intense than in the adjacent normal vertebrae. However, in acute benign fractures with significant edema, vertebral enhancement can be so intense that it can mimic malignancy (56).
In-phase and out-of-phase T1 weighted chemical shift images have also been advocated for this differential purpose. In in-phase images, water and fat contribute to the bone marrow signal. In out-phase images fat is subtracted from water, thus decreasing signal intensity. In the case of tumor infiltration, fat is replaced by neoplastic cells and, thus, this decrease in signal does not occur. A ratio of the out-of-phase to in-phase signal >0.8 is moderately sensitive and highly specific for malignancy (57) (Figure 11).
Degenerative pathologies
Degenerative pathology of the spine can affect several anatomical locations, including synovial joints, spinous processes, intervertebral discs, and ligaments and their insertions at the bone.
Synovial joints: atlanto-axial, facets, costovertebral and sacroiliac
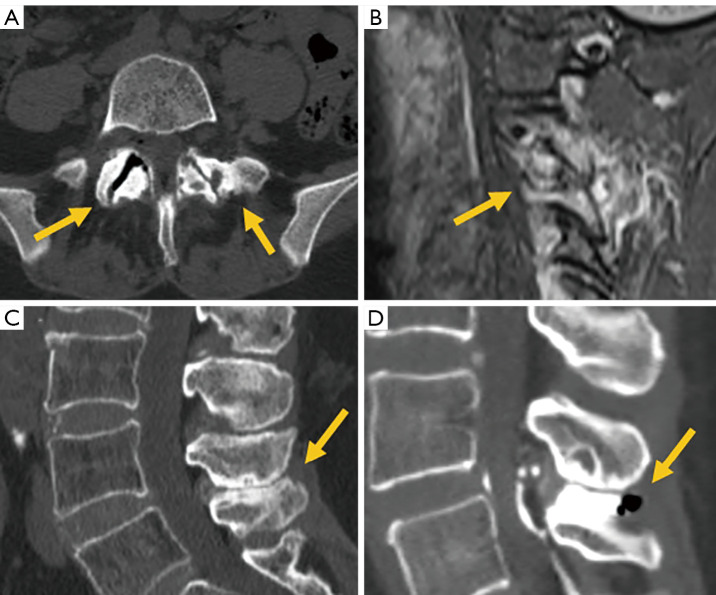
The facet joints constitute the outer wall of the vertebral foramen. Since they are synovial joints, degenerative signs of osteoarthritis include joint space narrowing, subchondral cysts and/or sclerosis, vacuum phenomenon, and osteophyte formation. MRI allows the detection of intra-articular effusion and edematous changes in bone and soft tissues (58). These findings have been associated with instability of the involved segment and the presence of symptoms (58-60), and they have been described in at least 14% of patients with low back pain (61,62). Some authors consider the facet joint effusion of more than 1 mm in recumbent MRI is an indication to perform standing or dynamic radiograph to check for occult spondylolisthesis or instability (63).
These features are important for decision-making, since facet joint osteoarthritis has been described in 64–67% of asymptomatic patients in CT, and in 3–18% of asymptomatic patients in MRI (64-67) (Figure 12).
Figure 12.
Osteoarthritis of the posterior elements. (A) Axial CT of facet joint osteoarthritis (arrows). (B) Sagittal STIR showing edema in cervical facet joint osteoarthritis (arrow). (C) Sagittal CT showing Baastrup’s disease (arrow). (D) Interspinous bursitis (arrow) demonstrated during injection with dye and steroids of the facets joint. CT, computed tomography; STIR, short tau inversion recovery.
Spinous processes (Baastrup’s disease)
Baastrup’s disease (kissing spine syndrome) refers to interspinous degenerative changes associated with hyper-lordosis and narrowing of the disc and facet joints interspace. The hallmark of the imaging findings is the close approximation and contact of adjacent spinous processes, with associated abnormalities including edema, bone cysts, sclerosis, flattening and enlargement of the articulating surfaces, bursitis and, occasionally, epidural cysts or midline epidural fibrotic masses (68). Interspinous bursitis and epidural cyst may communicate with the facet joints (Figure 12).
Intervertebral disc
MRI can accurately depict early or advanced changes of disc degeneration. Disc degeneration, whether physiological or pathological, is usually manifested by changes in signal intensity in the nucleus pulposus and annulus fibrosus. Fibrous transformation of the nucleus pulposus leads to formation of intranuclear clefts. It may be followed by varying degrees of loss of signal intensity in T2 weighted images and reduction in disc height. Several classifications have been published quantifying these changes into discrete, moderate, and severe (69,70). The Pfirrmann classification of disc degeneration was modified by Griffith for research purposes rather than clinical utility (71). Although these abnormalities are highly prevalent in asymptomatic subjects, mild changes are more common than moderate or severe changes (69,72).
Disc space narrowing is commonly considered a sign of disc degeneration. In common practice, applying both Pfirrmann 5-level grading and Griffith’s 8-level grading schemes, a higher degree of disc space narrowing leads to higher disc degeneration scores. However, osteoporosis is associated with vertebral height loss, particularly vertebral middle height loss, which allows the expansion of the disc vertically (73,74). It has been noted that lower lumbar bone mineral density (osteopenia and osteoporosis) is associated with a decrease in lumbar disc anterior height and posterior height; however, the middle height of the discs was increased (therefore the disc biconvexity index was increased) (74). Thus, an osteoporotic spine is less likely graded as having disc space narrowing, and thereof, less likely graded as having disc degeneration (or would likely being graded as a lesser degree of disc degeneration). Therefore, Pfirrmann criteria for lumbar spine degeneration is less applicable in elderly subjects, particularly elderly female subjects among whom osteoporosis is very common (75). Moreover, loss of the bright signal on T2 weighted images can also be due to natural aging, rather than disc degeneration alone. The classification of “degenerated disc” according to Pfirrmann et al. and Griffith et al. does not compel the reader to differentiate the pathologic degeneration from the normal consequence of aging. Moreover, there are two types of disc degeneration (76). ‘Endplate-driven’ disc degeneration involves endplate defects and inwards collapse of the annulus, which has a high heritability, mostly affects discs in the upper lumbar and thoracic spine, and often starts to develop before age 30 years. ‘Annulus-driven’ disc degeneration involves a radial fissure and/or a disc prolapse, has a low heritability, mostly affects discs in the lower lumbar spine, and develops progressively after age 30 years.
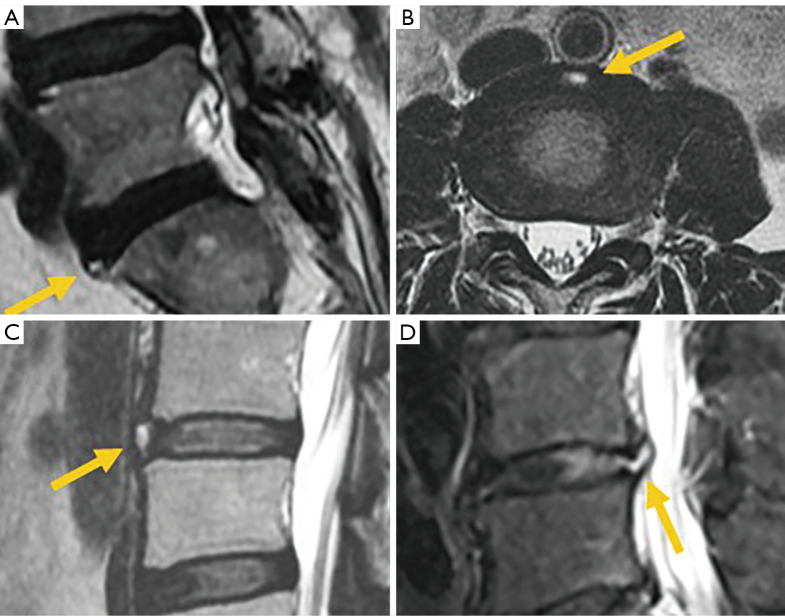
Degenerative changes in the annulus fibrosus usually manifest as high intensity zones (HIZ) on T2 weighted images and have been found to be a diagnostic sign of painful intervertebral disc disease with a positive predictive value ranging from 53% to 95% (72,77,78). They are secondary to tears or fissures of the annulus fibrosus, which are classified as concentric, rim or transverse, and radial. Radial fissures have been associated to discogenic pain (Figure 13) (79). Nevertheless, concentric, and transverse fissures have also been described in asymptomatic individuals, and their prevalence increases with age (70,80,81). Hyperintensity or contrast enhancement cannot be considered a sign of acuity because they may be apparent for long periods of time without being symptomatic all the time (80).
Figure 13.
Annular tears on T2 weighted images. Sagittal (A) and axial (B) of transverse tears (arrow). (C) Concentric and radial (D) tears (arrows).
Disc displacement is currently classified as bulging or disc herniation based on the nomenclature agreement of the joint task forces of the North American Spine Society, the American Society of Spine Radiology, and the American Society of Neuroradiology (Figure 14) (82).
Figure 14.
Disc displacement. (A) Diffuse bulge; (B) central protrusion; (C) right paracentral disc extrusion; (D) foraminal extrusion; (E) cranial migration of the disc extrusion; (F) sequestered fragment (arrow).
Disc bulging is defined as a disc protruding beyond the margins of the vertebral endplates by more than 25% of its circumference. It may be symmetric or asymmetric. It has been described in 15–81% of asymptomatic subjects (69,80).
A disc herniation is a focal protrusion of disc material affecting less than 25% of the disc circumference. Two types of herniations are considered. In the protrusion type, only a partial tear of the annulus fibrosus is present. On imaging, the base of the hernia is wider than the rest of dimensions of the protruded disc. In extrusion hernia, the whole thickness of the annulus fibrosus is torn. On imaging, the base of the extruded disc is smaller than the length of the extruded material. The prevalence of disc herniation in asymptomatic individuals is higher for the protrusion type (20–63%) than for the extrusion type (24%) (69,72,80,83,84).
The extruded disc may migrate upward or downward or lose contact with the parent disc as a sequestered fragment. Sequestration has not been described in asymptomatic subjects (72).
With respect to a transverse plane through the intervertebral disc, the location of lesions within the spinal canal can be described from medial to lateral as occupying the central area (including paracentral, more precisely, right central or left central), subarticular (including lateral recess), foraminal, extraforaminal and anterior. The term “paracentral”, although less precise than right or left central, is useful in clinical practice because the base of the herniation may affect the whole central area (82).
Discs may also herniate through the vertebral endplate (Schmorl’s nodes). In the acute presentation, they may be surrounded by edema and be symptomatic. In the chronic form, they are surrounded by fat or sclerotic bone (85,86).
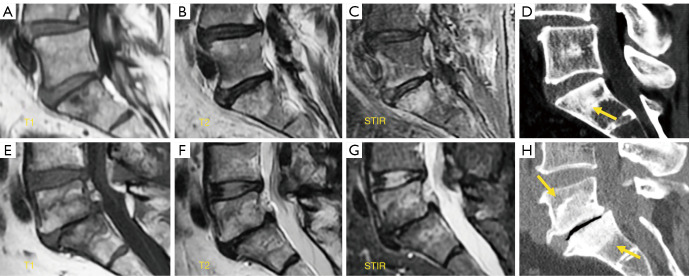
Vertebral endplate changes associated to degenerative disc disease have been described by Modic (Figure 15). Type I represents edema and can be stable, disappear or aggravate, or progress to type II. They manifest as hypointense on T1 weighted and hyperintense on fluid sensitive techniques. The positive predictive value for low back pain of type 1 Modic changes was 81% (87). Persistence or aggravation of Modic changes, associated loss of disc height and vertebral endplate irregularities are associated with persistence of pain. Modic I changes that regress or change to type II are associated with improvement of pain. Symptomatic Modic I changes tend to affect lower lumbar discs and have greater extension in height and backward in the vertebral endplate than asymptomatic Modic I changes which tend to be focally localized in the anterosuperior margin of the mid-column vertebral bodies. Posteriorly oriented Modic changes are more painful than anteriorly oriented Modic changes. Vertically larger Modic changes are more strongly associated with low back pain (88,89).
Figure 15.
Modic changes. Sagittal T1 weighted image (A), T2 weighted image (B) and STIR sequence image (C) of Modic type I changes. Sclerosis (arrow) detected at S1 on CT (D) is barely visible on MRI. Sagittal T1 weighted image (E), T2 weighted image (F) and STIR image sequence (G) of Modic type II changes. Sclerosis (arrows) conspicuous on CT (H) is barely suspected on MRI. STIR, short tau inversion recovery; CT, computed tomography; MRI, magnetic resonance imaging.
Type II Modic changes represent fat deposition and are usually considered stable, but sometimes can evolve to type I (90,91). They manifest as hyperintense on T1 and T2 sequences and hypointense on fat saturated images. Type III Modic changes represent subchondral sclerosis and are considered very rare (72), but this is probably due to the insensitivity of MRI to detect sclerotic bone (Figure 15). They manifest as low signal in all sequences. The prevalence of Modic changes increases with age and have been described in 0–13.5% of asymptomatic patients for Modic I and 3–25% for Modic II, respectively (72,80,84).
Ligaments and their insertions at the bone, resulting in DISH
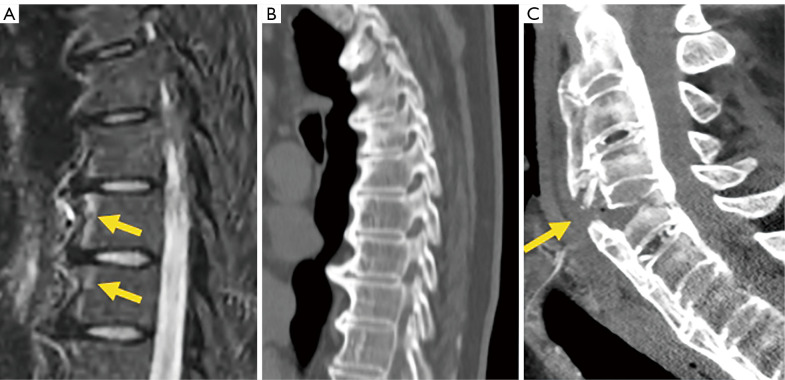
DISH is a systemic condition, with an estimated prevalence of approximately 10% in people >50 years of age. The radiographic criterion proposed by Resnik for its diagnosis is the presence of large bridging osteophytes in at least four adjacent thoracic vertebrae. Patients with DISH are often asymptomatic, although can manifest clinically with back pain and stiffness, neurologic compromise from spinal stenosis, and dysphagia or airway obstruction from large anterior cervical bridging osteophytes (92). Spinal stiffness in the final stages of the disease implies increased spinal vulnerability to low energy trauma (93). On the other hand, the diagnostic criteria proposed by Utsinger reduced the threshold for spinal involvement to two contiguous vertebral bodies, but involvement of peripheral entheses was included for early diagnosis (94) (Figure 16).
Figure 16.
DISH. (A) Sagittal STIR showing subligamentous edema (arrows). (B) Sagittal reformatted CT showing bridging osteophytes. (C) Sagittal CT of low energy cervical fracture in a patient with DISH (arrow). DISH, diffuse idiopathic skeletal hyperostosis; STIR, short tau inversion recovery; CT, computed tomography.
Spinal stenosis
Degenerative disorders may lead to degenerative spinal stenosis. It may coexist with or be affected by a pre-existing congenital or developmental stenosis. MRI allows differentiating the two forms of spinal stenosis by assessing the morphology of the central and lateral canal, as well characterizing, and quantifying its severity. It may also be useful in identifying other causes of spinal stenosis in which the osseous architecture is unremarkable, such as epidural lipomatosis (95).
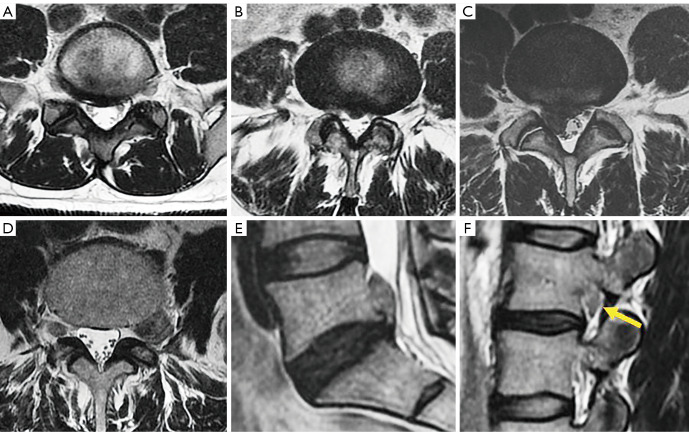
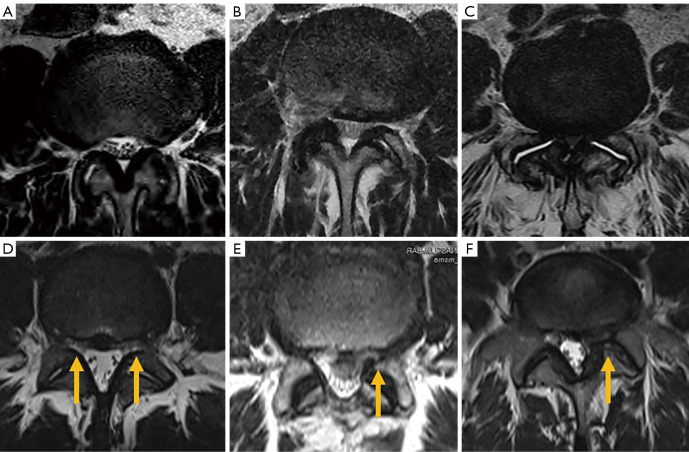
The criteria for defining developmental stenosis at lumbar level are not uniform in the literature (96), with the reported pathological values of sagittal diameter ranging from 9 to 14 mm at the lower lumbar level (97-101); however, the axial area of the thecal sac is considered a more effective parameter in the diagnosis of stenosis. In this regard, severe stenosis is defined by values <76 mm2, while values ranging from 76 to 100 mm2 indicate moderate stenosis (102). Park classified central stenosis based on nerve root aggregation of the cauda equina (103). According to this classification, grade 1 (mild stenosis) is present when the anterior cerebrospinal fluid (CSF) space is mildly obliterated with no nerve root aggregation. Grade 2 or moderate stenosis indicates cauda equina aggregation, while grade 3 implies severe stenosis, with the entire cauda equina appearing as a bundle (Figure 17).
Figure 17.
Lumbar canal stenosis. Axial T2 images of mild (A), moderate (B) and severe (C) central canal stenosis. (D) Mild bilateral lateral recess stenosis (arrows). Moderate (E) and severe (F) left foraminal stenosis (arrows).
In the lateral canal, stenosis may occur at the proximal entrance of the root (i.e., lateral recess), or at the exit (i.e., foramen). Nerve root involvement in the lateral recess ranges from contact of the disc with the nerve root to deviation and/or compression of the root between the disc and posterior osseous structures (101). Bartynski et al. (101) graded lateral recess stenosis as (104): grade 0, no stenosis; grade 1, mild stenosis with no repercussion on the nerve root; grade 2, moderate stenosis, with root flattening and partial obliteration of the CSF space; grade 3, severe stenosis in which there is severe root compression with complete obliteration of the CSF space.
According to Lee’s classification of foraminal stenosis, perineural fat obliteration in either vertical or transverse direction is considered mild stenosis, and obliteration in both the vertical and transverse axes implies moderate stenosis. Severe stenosis shows morphological changes or collapse of the nerve root (105). Wildermuth’s classification considers grade 1 foraminal stenosis when there is only deformity of the epidural fat, moderate (grade 2) stenosis when epidural fat only partially surrounds the nerve root, and severe or advanced (grade 3) stenosis when there is complete obliteration of the foraminal epidural fat (106). Several parameters of the compressed nerve root have been associated with good response to foraminal injections, including increased nerve T2 signal intensity (107) and perineural fat effacement >25%, described as the “melting sign” (108) (Figure 18).
Figure 18.
Lumbar foraminal stenosis. Sagittal T2 weighted images of mild (A), moderate (B) and severe (C) foraminal stenosis (arrow). (D) Axial intermediate weighted fat saturated image showing increased signal of L5 nerve root (arrow) in severe foraminal stenosis.
The estimated minimum sagittal diameter of the cervical spinal canal between C3 and C7 is 12 mm. Lower values increase the risk of degenerative spinal stenosis (109). In the foramen, uncovertebral arthrosis is the main cause of stenosis. Uncinate joints are found from C2-C3 to C6-C7, and they become hypertrophic because of the mechanical overload caused by disc impingement. Osteophytes may project into the foramen resulting in stenosis with radiculopathy (110).
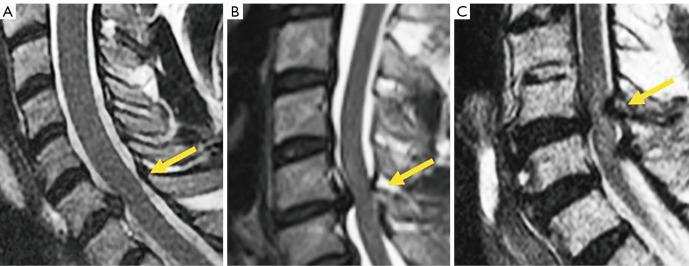
Central canal stenosis at the cervical level was classified by Kang et al. in 4 grades (111): grade 0, absence of stenosis; grade 1, obliteration of the subarachnoid space greater than 50% without deformity of the spinal cord; grade 2, central canal stenosis with spinal cord deformity but without altered signal intensity in the spinal cord; grade 3, central canal stenosis with signs of compressive myelopathy (hyperintense T2-weighted intramedullary signal) (Figure 19).
Figure 19.
Cervical canal stenosis. Sagittal T2 weighted of mild (A), moderate (B) and severe (C) central canal stenosis (arrow).
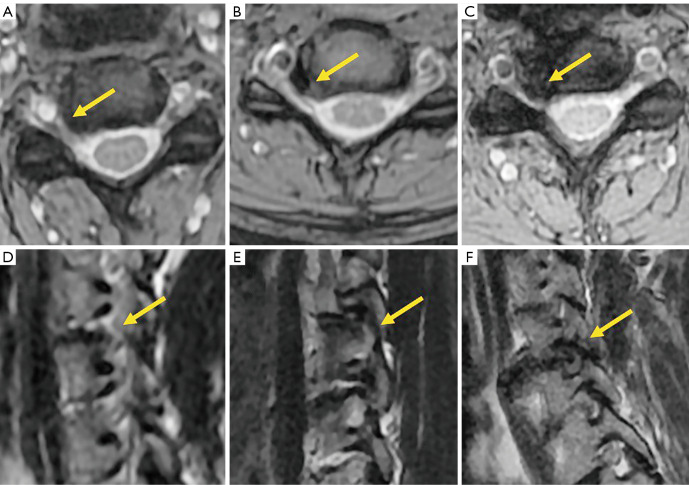
Grading of cervical foraminal stenosis in clinical practice on MRI must be based on both sagittal and axial images to get a complete picture of the neural foramen. Park et al. (112) classified stenosis severity based on oblique sagittal views, although these are not routinely performed and need to be reconstructed, while Kim et al. (113) graded foraminal stenosis based on morphometric measurements on axial images, which can be time consuming. Therefore, most clinicians grade foraminal stenosis based on subjective terms such as “mild”, “moderate” and “severe” (114) (Figure 20). In the Park’s classification system, mild foraminal stenosis shows partial perineural fat obliteration involving less than 50% of the nerve root circumference, moderate stenosis indicates perineural fat obliteration >50% of the nerve root circumference, and severe foraminal stenosis causes morphological changes in the nerve root (Figure 20). More severe grades are more likely related to clinical symptoms and are the target of treatment (115).
Figure 20.
Cervical foraminal stenosis. Axial T2* weighted images of mild (A), moderate (B) and severe (C) foraminal stenosis (arrow). Sagittal T2 weighted images of mild (D), moderate (E) and severe (F) foraminal stenosis (arrow).
Alignment abnormalities
Six types of spondylolistheses have been described: congenital or dysplastic, isthmic, traumatic, pathologic, iatrogenic, and degenerative (pseudospondylolysis) (116).
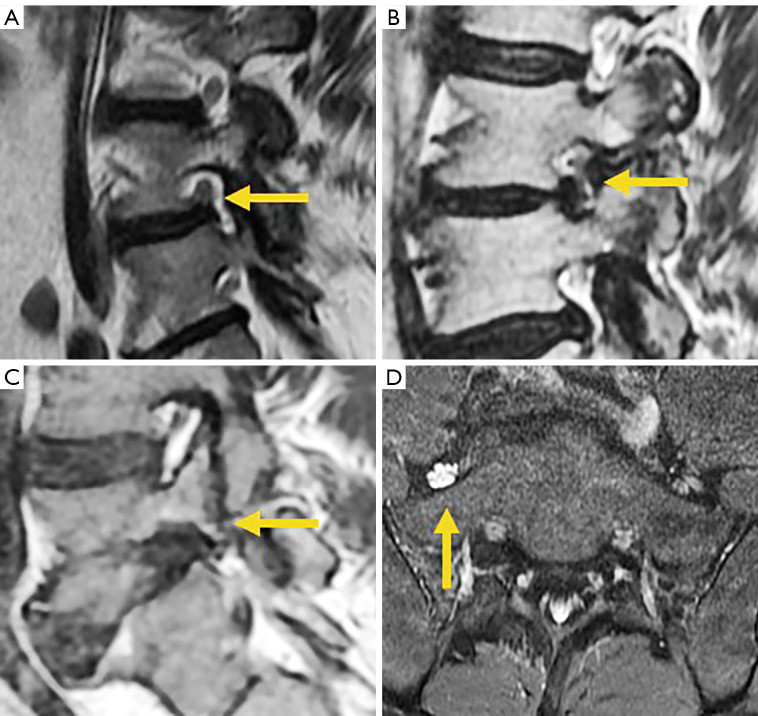
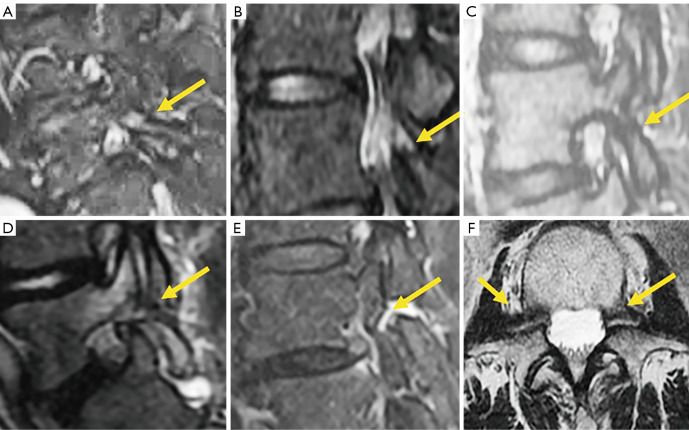
Isthmic spondylolisthesis is the most frequent type of spondylolisthesis in young people and is generally secondary to a stress fracture in a previously normal bone. Direct visualization of the fracture on sagittal MRI may be difficult due to the small size of the isthmus. The sensitivity and specificity of this technique has been reported to be 81% (95% CI: 54–94%) and 99% (95% CI: 98–100%), respectively. Therefore, due to the absence of radiation, MRI is considered the first imaging exam to investigate spondylolisthesis, with CT being reserved for non-diagnostic or inconclusive cases (117). The use of isotropic volumetric MRI sequences, such as 3D-T1-VIBE (a T1-weighted, 3D gradient-echo MR sequence), has demonstrated greater diagnostic accuracy compared to CT. MRI achieved 100% accuracy in detecting complete fractures. For incomplete fractures, MRI sensitivity, specificity, and precision were 96.7%, 92.0%, and 94.6%, respectively (118). Early diagnosis is very important in young patients because it facilitates early treatment increasing the healing rate. The degree of edema on fluid-sensitive sequences (e.g., T2 weighted MRI or short tau inversion recovery (STIR) sequence) is associated with the severity of the stress injury. The Hollenberg’s grading system includes 5 stages (119): grade 0 indicates a normal pars interarticularis with no MRI changes; grade 1 involves signal abnormalities in the pars interarticularis without fracture; grade 2 is defined by the presence of edema with incomplete fracture; grade 3 indicates the presence of complete fracture with edema; and grade 4 involves complete fracture without signal alterations, indicating chronic non-union. Other authors have added grade 0a, which implies cortical thickening with sclerosis but with no edema, as well as grade 2a, which indicates incomplete fracture without edema, probably denoting a healing fracture (Figure 21) (120). MRI is not particularly useful in follow-up because bone edema may persist in spite of clinical resolution of spondylolysis. It is also inferior to CT in the assessment of bony repair (121).
Figure 21.
MRI of spondylolysis. (A) Sagittal STIR image of grade 1 spondylolysis showing edema without pars interarticularis defect (arrow). (B) Grade 2 spondylolysis, partial defect with edema (arrow). (C) Grade 2A spondylolysis, partial defect without edema (arrow). (D) Grade 3 spondylolysis, complete defect with edema (arrow). (E) Grade 4 spondylolysis, chronic defect without edema (arrow). (F) Bilateral pedicle spondylolysis (arrow). MRI, magnetic resonance imaging; STIR, short tau inversion recovery.
An indirect sign of L5 spondylolysis, even without spondylolisthesis, is the presence of epidural fat between the posterior dural layer and the anterior part of the spinous process of the vertebra in a median sagittal image, secondary to enlargement of the central canal. According to Sherif et al. (122), the specificity and sensitivity of this indirect sign are 96.7% and 78.8%, respectively. When spondylolisthesis develops there is usually widening of the central canal and narrowing of both foramina (Figure 22).
Figure 22.
MRI Indirect signs of spondylolysis and spondylolisthesis. (A) Epidural fat interposition between the thecal sac and the L5 spinous process in spondylolysis without spondylolisthesis. (B) Widening of the central canal (arrow) and foraminal stenosis (arrow) (C) in spondylolysis with spondylolisthesis. MRI, magnetic resonance imaging.
The second most common site of neural arch injury after the pars interarticularis is the vertebral pedicle. It may be associated with unilateral spondylolysis but has been also described without associated spondylolysis in some young athletes or even in osteoporotic patients (123).
Degenerative spondylolisthesis is secondary to facet and disc degeneration while the neural arch remains intact. As a result, the spinous process is anteriorly displaced along with the vertebral body, and the central canal usually becomes stenosed (Figure 23). It is the most frequent cause of spondylolisthesis in the elderly (124). A high proportion of degenerative spondylolisthesis can be asymptomatic and have no clinical consequence (125).
Figure 23.
Alignment abnormalities in three patients. (A) Sagittal T2 weighted image of a patient with degenerative spondylolisthesis with narrowing of the central canal and anterior shifting of the spinous process (arrow). (B) Sagittal CT with retrolisthesis of L5. (C) CT with MIP reconstruction in Hangman’s fracture. (D) Axial T2 of a hyperintense vertebral artery (arrow) secondary to arterial dissection in Hangman’s fracture. CT, computed tomography; MIP, maximum intensity projection.
Traumatic spondylolisthesis is a rare injury defined as any acute fracture or dislocation of the posterior elements associated with vertebral spondylolisthesis. When it occurs at the C2 level, it is known as “hangman’s fracture”, with radiological signs analogous to isthmic spondylolisthesis. Of note, vertebral artery dissection has been found to be associated to this fracture type. Therefore, it is recommended to rule out this complication in patients with hangman’s fracture and pay particular attention to the signal intensity of the vertebral artery in T2-weighted images, as loss of the normal flow-void signal is an indirect sign of artery dissection (126) (Figure 23).
Retrolisthesis is a manifestation of spondylolisthesis that consists of posterior shifting of a cephalad vertebra over a caudal vertebra. It is generally secondary to loss of disc material caused by intervertebral osteochondrosis or acute herniation of the nucleus pulposus (116).
Alterations in the spinal curvature
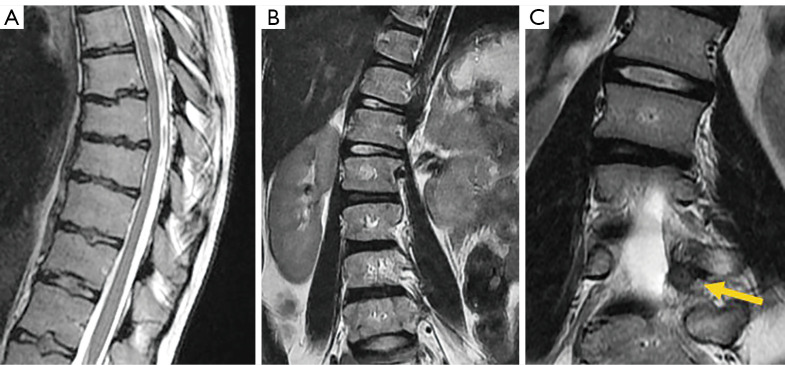
Scheuermann’s disease or idiopathic kyphosis accounts for 90% of cases of juvenile kyphosis. Diagnostic criteria for this condition are kyphosis >45° and at least one vertebra with wedging >5°. Irregular endplates and Schmorl’s nodes are associated findings (127) (Figure 24).
Figure 24.
Alterations in spinal curvature. (A) Sagittal T2 weighted image of a case with Scheuermann’s disease. (B) Coronal T2 weighted image of a case with neuromuscular scoliosis in Rett syndrome. (C) Coronal T2 weighted image of a patient with scoliosis secondary to osteoid osteoma (arrow).
Scoliosis is defined as a lateral curvature of the spine >10° as measured by the Cobb method on a standing radiograph (128). Scoliosis can be classified as congenital, neuromuscular, degenerative, or idiopathic, the latter being the most common, usually painless, and diagnosed after excluding other potential etiologies.
MRI is indicated in children under 10 years of age who develop scoliosis (infantile and juvenile forms) because of its frequent association with neural axis anomalies (129). In general, tomographic imaging techniques are not indicated in adolescent idiopathic scoliosis (11 to 17 years), the most common type, except when painful or unusual symptoms are present, such as headache or neurological involvement (130). Presurgical screening in these patients has demonstrated a prevalence of neurological axis abnormalities of 7.9–12.6% (131-133). Bony causes of scoliosis include benign tumors such as osteoid osteoma or osteoblastoma (134) (Figure 24).
Inflammatory pathologies
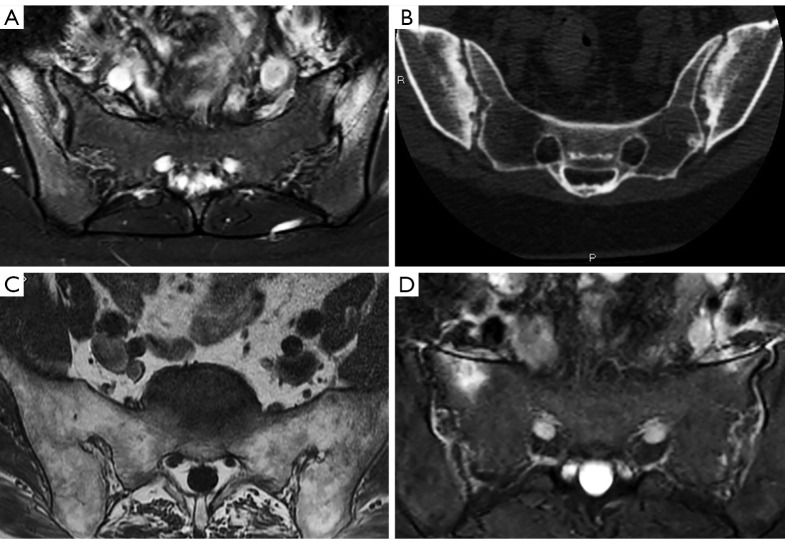
Radiography is still useful as initial examination to rule out structural damage of the spine in suspected inflammatory spondyloarthritis (135). The main drawback of radiography is the lack of sensitivity in detecting early non-structural changes, such as BMO, synovitis, enthesitis, capsulitis, and intra-articular effusion, that may be indicative of active inflammatory changes. MRI is the dominant technique to depict early active changes (136). In fact, MRI can demonstrate signs of active sacroiliitis years before radiographic findings become evident (137).
Some authors differentiate between early non-radiographic AS, when no imaging abnormalities are seen on radiographs with or without inflammatory changes on MRI, and late radiographic AS, when signs of structural sacroiliitis are present on radiographs according to the New York classification criteria (138,139). These structural changes include erosions, sclerosis, bone fatty infiltration, fat deposition in an erosion cavity, and bone bridging or ankylosis, with being CT, the most accurate technique to depict most structural changes (137). CT findings of structural changes had a 58% sensitivity and 69% specificity for discerning which patients reported pain relief from an anesthetic injection (137) (Figure 25).
Figure 25.
Sacroiliitis in four patients. (A) Axial STIR in active inflammatory spondyloarthropathy. (B) CT showing structural changes at the sacroiliac joints. (C) T2 weighted image of a patient with chronic sacroiliitis with fused joints. (D) Axial STIR sequence image of a patient with post-partum subchondral edema at both iliac wings. STIR, short tau inversion recovery; CT, computed tomography.
Currently, the Assessment in Spondyloarthritis International Society (ASAS) classification criteria for AS are the most widely used. These criteria cover patients with and without radiographic sacroiliitis and include a clinical and an imaging arm. Imaging findings consistent with sacroiliitis are the key criterion on the imaging arm and include definite radiographic sacroiliitis according to the modified New York criteria (NYC) or active sacroiliitis on MRI (138,140,141). The required MRI feature for sacroiliitis is the presence of BMO on either two consecutive slices, or multiple lesions on a single slice. Inflammation must be clearly present and in a typical anatomical location (subchondral bone) (142).
The two arms altogether have 82.9% sensitivity and 84.4% specificity and, for the ‘imaging arm’ alone, the reported sensitivity was 66.2% and specificity 97.3% (143,144). Of note, imaging cannot be assessed in isolation and needs to be interpreted in the light of clinical presentation and results of laboratory investigations. It must be considered that BMO can be present in asymptomatic individuals, may be related to sport activities and be present in other conditions like osteoarthritis or the post-partum period (135) (Figure 25).
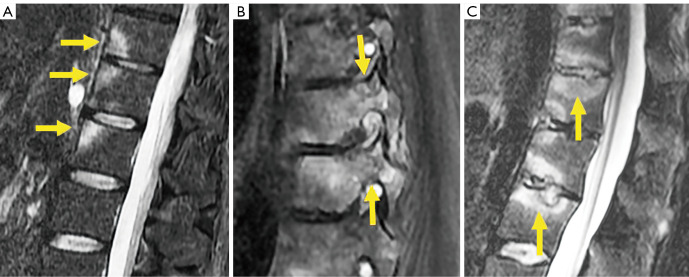
Regarding spinal lesions, a new consensus will replace the previous agreement of the ASAS group (145,146). Vertebral corner BMO and corner fat lesions, known as Romanus lesions, were recorded if present on 2 slices; facet joint, lateral, and posterior inflammatory lesions were recorded if present on a single slice. The presence of ≥2 vertebral corner BMO had 90–95% specificity for axial spondyloarthropathy (147). Inflammatory changes in the vertebral endplate are known as Andersson lesions. Two theories about its pathogenesis consider that it may be either part of the inflammatory process of the disease or a pseudoarthrosis after minor trauma. It is important to differentiate them because the former may be treated medically and the latter usually require surgical management (147) (Figure 26).
Figure 26.
Spinal involvement in axial spondyloarthropathy. Sagittal STIR images showing Romanus lesions (arrows) (A), costovertebral joints inflammation (arrows) (B), and Andersson lesions (arrows) (C). STIR, short tau inversion recovery.
Infectious pathologies
In suspected spinal infection, MRI is the preferred imaging technique due to its high sensitivity and specificity, which has been proved to be superior to radiographs and bone scans (148-151). MRI can detect osteomyelitis as early as 3–5 days after onset of infection with reported sensitivity, specificity, and accuracy values of 96%, 92% and 94%, respectively (149,152). In addition, it can detect the very earliest sign of spondylodiscitis, namely subtle subchondral endplate edema changes (153). Edema or fluid in the psoas musculature, termed MRI psoas sign, is another finding consistent with early spondylodiscitis, with sensitivity and specificity values around 92% (154,155). MRI can localize the sites of infection, such as disc, vertebral bodies, facet joints, paravertebral musculature, epidural space, meninges, or spinal cord. Intravenous gadolinium contrast administration helps to delineate abscess formation. Hyperparathyroidism, neuropathic arthropathy, acute Schmorl’s nodes, synovitis, acne, pustulosis, hyperostosis, osteitis (SAPHO) syndrome, AS, Modic changes type I and tumors are non-infectious mimics that may resemble pyogenic spondylodiscitis (136,156,157).
Extension to paravertebral soft tissues or the epidural space can be in the form of a phlegmon, which shows homogeneous enhancement with no significant pus collection, or forming a liquid abscess that shows peripheral enhancement delimiting a fluid collection (156). Abscess usually shows high signal on diffusion weighted images and low ADC value indicating restricted diffusion (157).
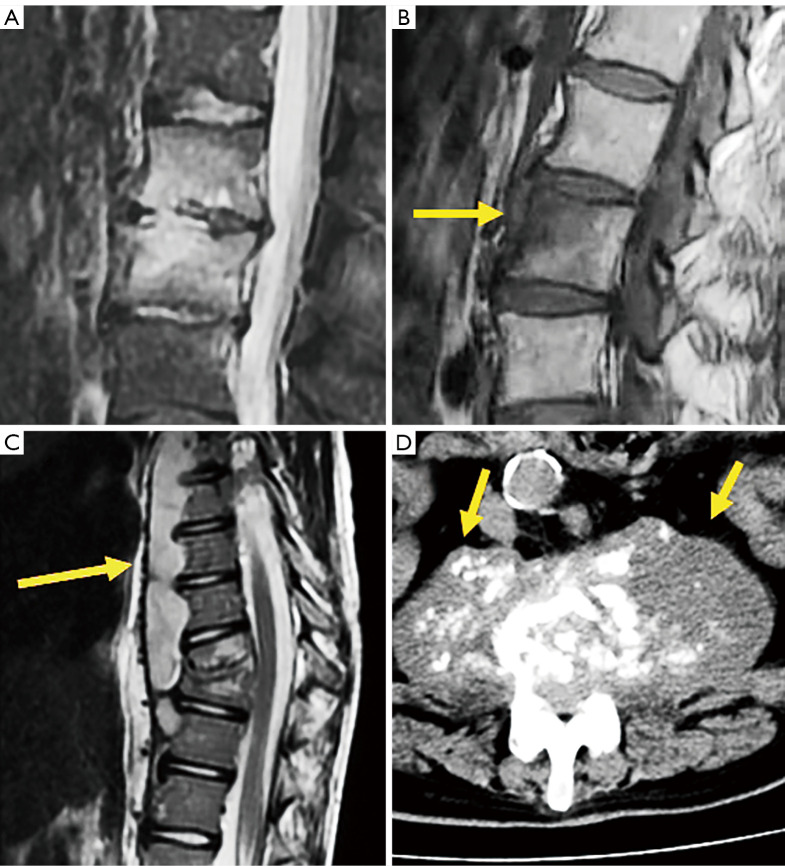
The evolution of pyogenic infections is much faster compared with tuberculosis due to the release of proteolytic enzymes in the former group. Tuberculosis usually exhibits a more chronic pattern, and radiographic changes take longer to become apparent, usually between 8–12 weeks (158). Subligamentous spread of tuberculosis can occur before spreading to the intervertebral space. In this case, erosion or scalloping of the anterior vertebral wall can be detected on radiographs (159) (Figure 27). Some findings that favor the diagnosis of tuberculosis include larger collections, cold abscesses adjacent to the affected spine, thoracolumbar junction, no/scarce involvement of the disc space, skip lesions involving multiple locations due to subligamentous spread and whole vertebral body or posterior involvement (160,161) (Figure 27).
Figure 27.
Infectious pathology of the spine. (A) Sagittal STIR image of a case of pseudomonas discitis. (B) Sagittal T1 weighted image of a case of brucella osteomyelitis (arrow). (C) Sagittal T2 weighted image of a case of tuberculous prevertebral subligamentous abscess (arrow). (D) Axial CT of a case of chronic bilateral psoas abscess showing muscle enlargement with fluid collection and small calcifications (arrows). STIR, short tau inversion recovery; CT, computed tomography.
Brucellosis is an endemic zoonotic disease that may affect the spinal column with a chronic course mimicking another disease, including spondylosis. It may present with a typical pattern of discitis, but most often shows inflammatory changes of the vertebral body (162) (Figure 27).
Tumor pathologies
Spinal tumors can be metastatic, primary benign or primary malignant. Approximately 90% of them are metastatic and 20% present with canal invasion and/ or cord compression (163). Due to the overlapping of bony structures of the spine, conventional radiography is often insufficient and further characterization with CT or MRI is needed (164). MRI is usually the most useful method for evaluating spinal tumors and has superior contrast to localize disease in various compartments (intramedullary, intradural-extramedullary, extradural, intraosseous, paravertebral). Regarding primary bone tumors it has shown higher diagnostic accuracy than CT and radiography (165). Regarding bone metastases, MRI has shown better diagnostic performance than SPECT, positron emission tomography (PET) or CT (166,167). In myeloma, MRI has shown greater sensitivity than 18F-FDG-PET in staging, but inferior for evaluating response to treatment that is detected earlier on 18F-FDG-PET whereas it takes approximately 9–12 months for lesions to resolve on MRI (168,169).
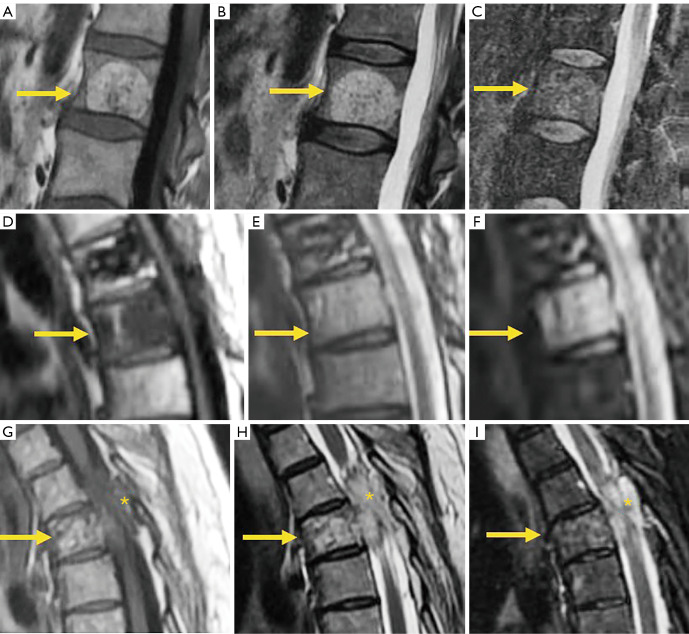
Hemangiomas is the most frequent benign tumor lesions seen in the spine with an incidence ranging from 10% to 27% and related to increasing age (170,171). CT is more sensitive than radiography revealing a classic “corduroy cloth” on sagittal images or the polka dot sign on axial images (171,172). Typical hemangiomas are generally non-symptomatic and appear as hyperintense on T1 and T2 weighted MRI, due to the predominance of fatty tissue that is suppressed with fat suppression techniques (173). Hyperintensity is typically greater than that of fat on T2 images because of the water content, thereby differentiating hemangiomas from focal fat deposition (173). Atypical hemangiomas show iso-hypointense signal on T1 weighted sequences and hyperintense signal on T2 weighted and fat suppression sequences with variable extent of enhancement after gadolinium administration. CT can show the typical osseous remodelling of hemangiomas and the typical signs described above in up to 80% of the cases (174). Aggressive vertebral hemangiomas consist of a very rare subset of vertebral hemangiomas that enlarge, disrupting the cortex and extending to the soft tissues, even resulting in neural compression (170). Due to its aggressive appearance the final diagnosis may require CT guided biopsy (175) (Figure 28).
Figure 28.
Vertebral hemangioma. Sagittal T1 weighted image (A), T2 weighted image (B), and STIR sequence image (C) of typical hemangioma (arrows), hyperintense on T1 and T2 due to fat content, remaining hyperintense on STIR only the vascular content. Sagittal T1 weighted image (D), T2 weighted image (E), and STIR image sequence (F) of atypical hemangioma (arrows), hypointense on T1 due to predominance of vascular component and scarce fat content. Sagittal T1 weighted image (G), T2 weighted image (H), and STIR image sequence (I) of aggressive hemangioma (arrows) extending to the spinal canal (*). STIR, short tau inversion recovery.
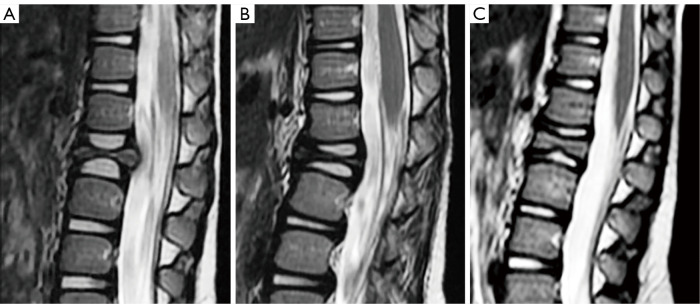
Other benign osteolytic tumors or pseudo-tumors involving the spine include eosinophilic granuloma (EG), osteoid osteoma, osteoblastoma, giant cell tumor (GCT), and aneurysmatic bone cyst (ABC). Extreme collapse of the vertebral body, vertebra plana or coin-on-edge vertebra is a typical feature of EG, a benign tumor-like disorder characterized by clonal proliferation of Langerhans cells. Spinal EG account for up to 15% of all EGs and most lesions affect children between 3 and 12 years. With healing, a reconstruction of the vertebra occurs and re-establishes an almost normal appearance (176) (Figure 29).
Figure 29.
Eosinophilic granuloma. (A) Initial sagittal T2 weighted image that evolved to severe collapse of the vertebral body in 2 months (B). (C) Partial vertebral height recovery at 3 years follow-up.
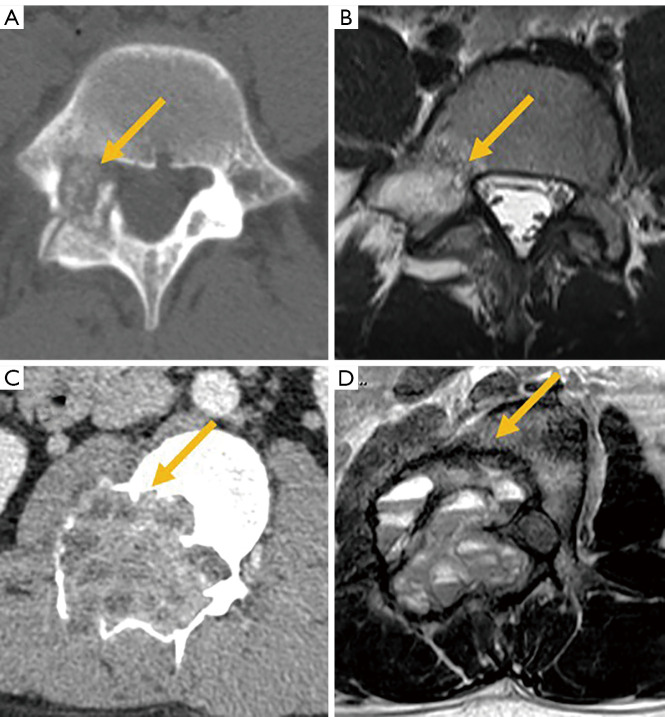
Osteoid osteoma and osteoblastoma share imaging and pathological features. The size of the radiolucent nidus is the only criterium to differentiate them, with osteoblastomas nidus greater than 2 cm and showing a more aggressive expansion pattern. Both show surrounding sclerosis and an edema pattern on MRI that may simulate a more sinister condition. GCT and ABC usually present as osteolytic expansile lesions that may have fluid-fluid levels. GCT is more frequent at the sacrum, while ABC tends to affect the posterior elements (176,177) (Figure 30).
Figure 30.
Osteolytic lesions of the spine. (A) Axial CT image of osteoblastoma showing the osteolytic lesion (arrow), and (B) edema pattern on MRI (arrow). (C) CT of aneurysmal bone cyst (arrow). (D) T2 weighted image showing fluid-fluid levels in the same case (arrow). CT, computed tomography; MRI, magnetic resonance imaging.
Benign sclerotic tumors or pseudotumors include bone island (enostosis), sclerosis secondary to osteoid osteoma, or healed benign lesions such as cysts or fibromas. Bone island, or enostoma, is often considered a variant of normality. It appears when compact bone develops within bone marrow and typically shows an irregula and spiculated margin surrounded by normal trabecular bone. MRI shows low signal on T1 and T2 weighted images with no enhancement after contrast injection. Sometimes, it may be difficult to differentiate enostoma from malignant osteoblastic lesions. Biopsy should be considered if the lesion increases in diameter by more than 25% within 6 months or 50% within 1 year (172,176-178) (Figure 31).
Figure 31.
Benign tumors of the spine. (A) Axial CT image of enostoma; (B) sagittal T1 and STIR (C) images of enostoma; (D) coronal reformatted CT image of osteochondroma. CT, computed tomography; STIR, short tau inversion recovery.
Osteochondroma is a benign developmental exophytic lesion rather than an actual tumor. Spinal osteochondromas account for 1–4% and 9% of all solitary and multiple osteochondromas, respectively. Radiographically, osteochondroma is a bone exostosis protruding from the bone and showing varying degrees of chondroid calcification of the cartilaginous cap (176,178,179) (Figure 31).
Regarding primary malignant tumors, metastases, lymphoma, and multiple myeloma (MM) are the most frequent. Chordoma, plasmacytoma, osteosarcoma and primary lymphoma of the bone are rare. Osteosarcoma often presents with osteoid calcification of the tumor matrix, with marked mineralization originating in the vertebral body that may manifest as an “ivory vertebra”. This sclerotic vertebra can also be seen in bone lymphoma (164).
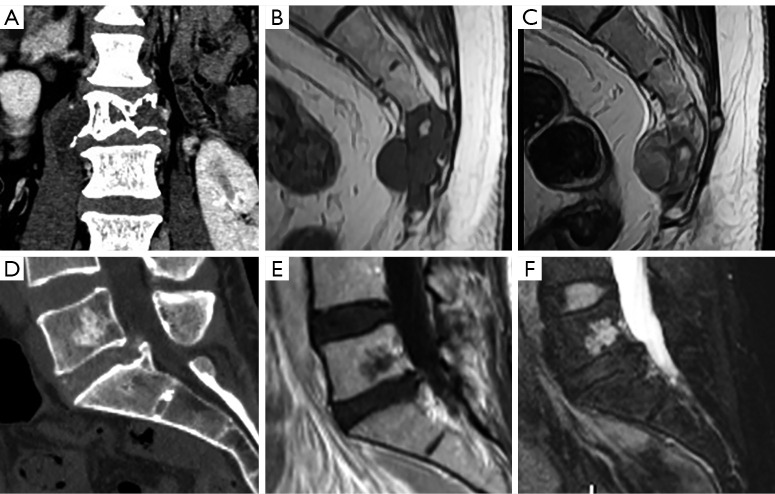
Chordomas usually present with an osteolytic pattern and soft tissue mass. They usually appear in the sacrococcygeal region (50% of cases), followed by the spheno-occipital region (35%) and the vertebral bodies (15%). It should be differentiated from benign notochordal tumors that are contained within the vertebral bones, and usually behave as hypointense on T1 weighted images, hyperintense on T2 weighted images, with no significant contrast enhancement. They tend to be smaller (<30 mm) and mostly sclerotic (179). These may be managed by radiological surveillance, while for chordomas or atypical lesions, biopsy and/or surgical removal must be considered (180) (Figure 32).
Figure 32.
Notochordal tumors. (A) Coronal reformatted CT of a lumbar chordoma. (B) Sagittal T1 without and with contrast (C) of a sacral chordoma. Sagittal reformatted CT (D), T1 (E), and STIR images (F) of a benign notochordal tumor. CT, computed tomography; STIR, short tau inversion recovery.
Metastatic bone lesions can manifest on CT with an osteolytic, osteoblastic, or mixed pattern. Focal lytic metastases demonstrate decreased T1 weighted signal relative to the muscle or disc, and increased T2 weighted signal compared to normal bone marrow. Blastic lesions show decreased T1 weighted and T2 weighted signal. Enhancement after contrast administration is variable (181) (Figure 33).
Figure 33.
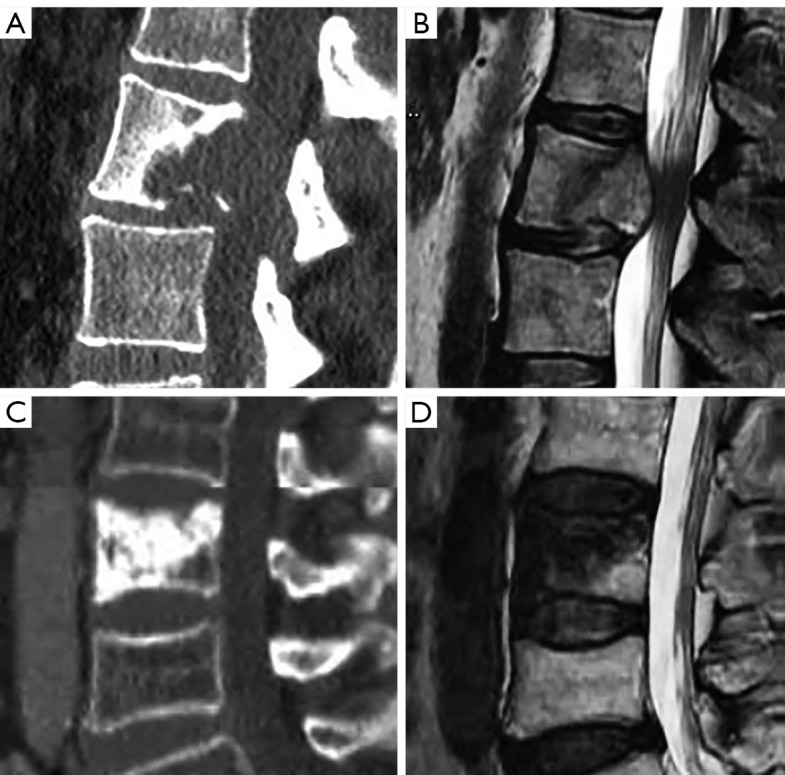
Spinal metastases. (A) Sagittal CT reformation and Sagittal T2 weighted images (B) in a case of osteolytic lung cancer metastasis. (C) Sagittal CT reformation and sagittal T2 weighted image (D) in a case of osteoblastic breast carcinoma metastasis demonstrating increased density on CT scan and hypointensity on MRI. CT, computed tomography; MRI, magnetic resonance imaging.
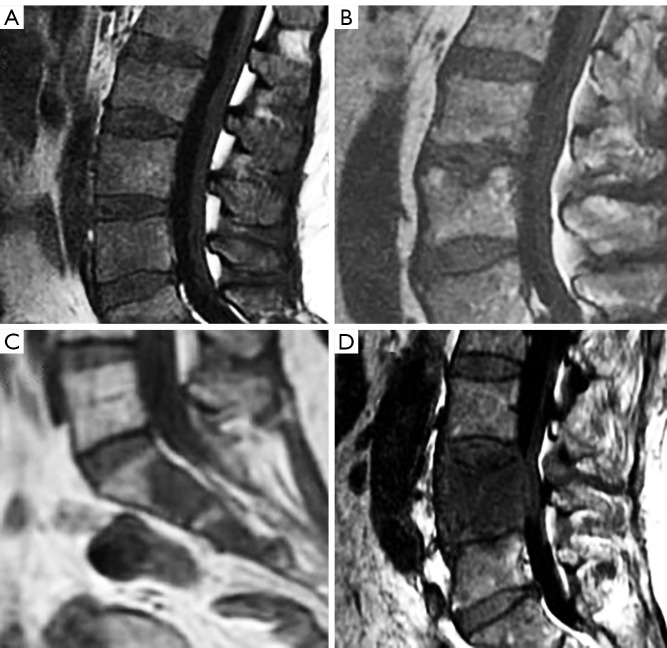
Infiltration patterns in MM may range from normal bone marrow appearance to focal infiltration, diffuse disease, ‘salt-and-pepper’ like involvement, or combined involvement (Figure 34) (181-183). MM lesions show high contrast-enhancement due to neo-angiogenesis, with steep and rapid first-pass enhancement followed by washout. High signal on high b-value images indicates bone marrow infiltration. Of note, normal red bone marrow, which is usually more pronounced in young individuals, tends to exhibit the same signal intensity changes compared to MM-infiltrated bone marrow. Contrast enhancement curves may vary, usually with a less steep wash-in and wash-out than in MM (183).
Figure 34.
Patterns of spinal involvement in myeloma. Sagittal T1 weighted imaging shows diffuse (A) and salt and pepper (B) infiltration. (C) Focal and combined (D) involvement of the spine.
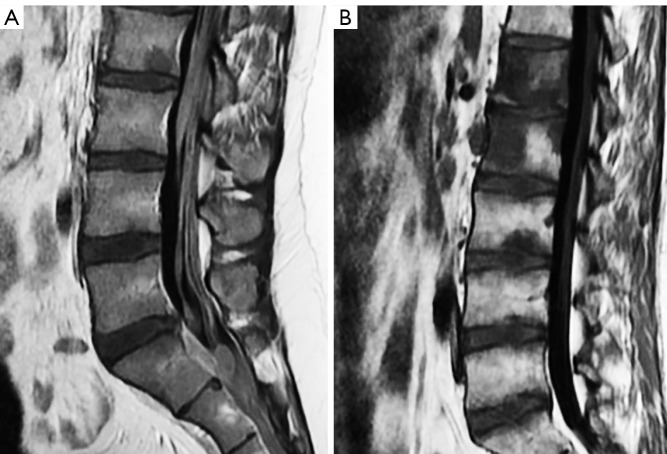
Leukemia and lymphoma may also present as bone marrow infiltrative disorders. A diffuse infiltrative pattern is most frequent in patient with leukemia and a focal/patchy pattern is more prevalent in patients with lymphoma (184) (Figure 35).
Figure 35.
Infiltrative pattern in hematologic malignancies. (A) Sagittal T1 in diffuse infiltrative pattern in leukemia. (B) Patchy infiltrative pattern in Hodgkin’s lymphoma.
Conclusions
Proper use of CT and MRI in spinal disorders may facilitate the diagnosis and management of spinal conditions. An adequate clinical approach, an expert understanding of the pathological manifestations demonstrated by these imaging techniques and a comprehensive report based on a universally accepted nomenclature represent the indispensable tools to improve the diagnostic approach and the decision-making process in patients with spinal pain.
Acknowledgments
Funding: None.
Ethical Statement: The authors are accountable for all aspects of the work in ensuring that questions related to the accuracy or integrity of any part of the work are appropriately investigated and resolved.
Open Access Statement: This is an Open Access article distributed in accordance with the Creative Commons Attribution-NonCommercial-NoDerivs 4.0 International License (CC BY-NC-ND 4.0), which permits the non-commercial replication and distribution of the article with the strict proviso that no changes or edits are made and the original work is properly cited (including links to both the formal publication through the relevant DOI and the license). See: https://creativecommons.org/licenses/by-nc-nd/4.0/.
Footnotes
Conflicts of Interest: All authors have completed the ICMJE uniform disclosure form (available at https://qims.amegroups.com/article/view/10.21037/qims-2022-04/coif). YXJW serves as the Editor-in-Chief of Quantitative Imaging in Medicine and Surgery. The other authors have no conflicts of interest to declare.
References
- 1.ACR-ASNR-SCBT-MR practice guidelines for the performance of magnetic resonance imaging (MRI) of the adult spine. American College of Radiology. 2018. Available online: https://www.acr.org/-/media/ACR/Files/Practice-Parameters/MR-Adult-Spine.pdf?la=en. Accessed on March 28, 2022.
- 2.Beckmann NM, West OC, Nunez D, Jr, Kirsch CFE, Aulino JM, Broder JS, Cassidy RC, Czuczman GJ, Demertzis JL, Johnson MM, Motamedi K, Reitman C, Shah LM, Than K, Ying-Kou Yung E, Beaman FD, Kransdorf MJ, Bykowski J. ACR Appropriateness Criteria® Suspected Spine Trauma. J Am Coll Radiol 2019;16:S264-85. 10.1016/j.jacr.2019.02.002 [DOI] [PubMed] [Google Scholar]
- 3.Patel ND, Broderick DF, Burns J, Deshmukh TK, Fries IB, Harvey HB, Holly L, Hunt CH, Jagadeesan BD, Kennedy TA, O'Toole JE, Perlmutter JS, Policeni B, Rosenow JM, Schroeder JW, Whitehead MT, Cornelius RS, Corey AS. ACR Appropriateness Criteria Low Back Pain. J Am Coll Radiol 2016;13:1069-78. 10.1016/j.jacr.2016.06.008 [DOI] [PubMed] [Google Scholar]
- 4.Booth TN, Iyer RS, Falcone RA, Jr, Hayes LL, Jones JY, Kadom N, Kulkarni AV, Myseros JS, Partap S, Reitman C, Robertson RL, Ryan ME, Saigal G, Soares BP, Tekes-Brady A, Trout AT, Zumberge NA, Coley BD, Palasis S. ACR Appropriateness Criteria® Back Pain-Child. J Am Coll Radiol 2017;14:S13-24. 10.1016/j.jacr.2017.01.039 [DOI] [PubMed] [Google Scholar]
- 5.Jenkins HJ, Downie AS, Maher CG, Moloney NA, Magnussen JS, Hancock MJ. Imaging for low back pain: is clinical use consistent with guidelines? A systematic review and meta-analysis. Spine J 2018;18:2266-77. 10.1016/j.spinee.2018.05.004 [DOI] [PubMed] [Google Scholar]
- 6.Needham G, Grimshaw J. EU Radiation Protection 118: Referral Guidelines For Imaging. European Commission. 2007. Available online: https://www.sergas.es/docs/profesional/boapraticaclinica/rp118.pdf
- 7.Tahvonen P, Oikarinen H, Pääkkö E, Karttunen A, Blanco Sequeiros R, Tervonen O. Justification of CT examinations in young adults and children can be improved by education, guideline implementation and increased MRI capacity. Br J Radiol 2013;86:20130337. 10.1259/bjr.20130337 [DOI] [PMC free article] [PubMed] [Google Scholar]
- 8.McMaster MJ. Spinal growth and congenital deformity of the spine. Spine (Phila Pa 1976) 2006;31:2284-7. 10.1097/01.brs.0000238975.90422.c4 [DOI] [PubMed] [Google Scholar]
- 9.Trenga AP, Singla A, Feger MA, Abel MF. Patterns of congenital bony spinal deformity and associated neural anomalies on X-ray and magnetic resonance imaging. J Child Orthop 2016;10:343-52. 10.1007/s11832-016-0752-6 [DOI] [PMC free article] [PubMed] [Google Scholar]
- 10.Wáng YXJ, Santiago FR, Deng M, Nogueira-Barbosa MH. Identifying osteoporotic vertebral endplate and cortex fractures. Quant Imaging Med Surg 2017;7:555-91. 10.21037/qims.2017.10.05 [DOI] [PMC free article] [PubMed] [Google Scholar]
- 11.McMaster MJ, Singh H. Natural history of congenital kyphosis and kyphoscoliosis. A study of one hundred and twelve patients. J Bone Joint Surg Am 1999;81:1367-83. 10.2106/00004623-199910000-00002 [DOI] [PubMed] [Google Scholar]
- 12.Chaturvedi A, Klionsky NB, Nadarajah U, Chaturvedi A, Meyers SP. Malformed vertebrae: a clinical and imaging review. Insights Imaging 2018;9:343-55. 10.1007/s13244-018-0598-1 [DOI] [PMC free article] [PubMed] [Google Scholar]
- 13.Rufener S, Ibrahim M, Parmar HA. Imaging of congenital spine and spinal cord malformations. Neuroimaging Clin N Am 2011;21:659-76, viii. 10.1016/j.nic.2011.05.011 [DOI] [PubMed] [Google Scholar]
- 14.Kumar J, Afsal M, Garg A. Imaging spectrum of spinal dysraphism on magnetic resonance: A pictorial review. World J Radiol 2017;9:178-90. 10.4329/wjr.v9.i4.178 [DOI] [PMC free article] [PubMed] [Google Scholar]
- 15.Jones JY, Saigal G, Palasis S, Booth TN, Hayes LL, Iyer RS, Kadom N, Kulkarni AV, Milla SS, Myseros JS, Reitman C, Robertson RL, Ryan ME, Schulz J, Soares BP, Tekes A, Trout AT, Karmazyn B. ACR Appropriateness Criteria® Scoliosis-Child. J Am Coll Radiol 2019;16:S244-51. 10.1016/j.jacr.2019.02.018 [DOI] [PubMed] [Google Scholar]
- 16.Belmont PJ, Jr, Kuklo TR, Taylor KF, Freedman BA, Prahinski JR, Kruse RW. Intraspinal anomalies associated with isolated congenital hemivertebra: the role of routine magnetic resonance imaging. J Bone Joint Surg Am 2004;86:1704-10. 10.2106/00004623-200408000-00014 [DOI] [PubMed] [Google Scholar]
- 17.Pinto FC, Fontes RB, Leonhardt Mde C, Amodio DT, Porro FF, Machado J. Anatomic study of the filum terminale and its correlations with the tethered cord syndrome. Neurosurgery 2002;51:725-9; discussion 729- 30. 10.1097/00006123-200209000-00019 [DOI] [PubMed] [Google Scholar]
- 18.Kumar I, Sachan A, Aggarwal P, Verma A, Shukla RC. Structured MRI reporting in spinal dysraphism. Acta Radiol 2020;61:1520-33. 10.1177/0284185120903445 [DOI] [PubMed] [Google Scholar]
- 19.Wu ZX, Huang LY, Sang HX, Ma ZS, Wan SY, Cui G, Lei W. Accuracy and safety assessment of pedicle screw placement using the rapid prototyping technique in severe congenital scoliosis. J Spinal Disord Tech 2011;24:444-50. 10.1097/BSD.0b013e318201be2a [DOI] [PubMed] [Google Scholar]
- 20.Bron JL, van Royen BJ, Wuisman PI. The clinical significance of lumbosacral transitional anomalies. Acta Orthop Belg 2007;73:687-95. [PubMed] [Google Scholar]
- 21.Hanhivaara J, Määttä JH, Karppinen J, Niinimäki J, Nevalainen MT. The Association of Lumbosacral Transitional Vertebrae with Low Back Pain and Lumbar Degenerative Findings in MRI: A Large Cohort Study. Spine (Phila Pa 1976) 2022;47:153-62. 10.1097/BRS.0000000000004244 [DOI] [PubMed] [Google Scholar]
- 22.Castellvi AE, Goldstein LA, Chan DP. Lumbosacral transitional vertebrae and their relationship with lumbar extradural defects. Spine (Phila Pa 1976) 1984;9:493-5. 10.1097/00007632-198407000-00014 [DOI] [PubMed] [Google Scholar]
- 23.Nardo L, Alizai H, Virayavanich W, Liu F, Hernandez A, Lynch JA, Nevitt MC, McCulloch CE, Lane NE, Link TM. Lumbosacral transitional vertebrae: association with low back pain. Radiology 2012;265:497-503. 10.1148/radiol.12112747 [DOI] [PMC free article] [PubMed] [Google Scholar]
- 24.Porter NA, Lalam RK, Tins BJ, Tyrrell PN, Singh J, Cassar-Pullicino VN. Prevalence of extraforaminal nerve root compression below lumbosacral transitional vertebrae. Skeletal Radiol 2014;43:55-60. 10.1007/s00256-013-1750-0 [DOI] [PubMed] [Google Scholar]
- 25.Elster AD. Bertolotti's syndrome revisited. Transitional vertebrae of the lumbar spine. Spine (Phila Pa 1976) 1989;14:1373-7. 10.1097/00007632-198912000-00015 [DOI] [PubMed] [Google Scholar]
- 26.Carrino JA, Campbell PD, Jr, Lin DC, Morrison WB, Schweitzer ME, Flanders AE, Eng J, Vaccaro AR. Effect of spinal segment variants on numbering vertebral levels at lumbar MR imaging. Radiology 2011;259:196-202. 10.1148/radiol.11081511 [DOI] [PubMed] [Google Scholar]
- 27.Farshad-Amacker NA, Aichmair A, Herzog RJ, Farshad M. Merits of different anatomical landmarks for correct numbering of the lumbar vertebrae in lumbosacral transitional anomalies. Eur Spine J 2015;24:600-8. 10.1007/s00586-014-3573-7 [DOI] [PubMed] [Google Scholar]
- 28.Tureli D, Ekinci G, Baltacioglu F. Is any landmark reliable in vertebral enumeration? A study of 3.0-Tesla lumbar MRI comparing skeletal, neural, and vascular markers. Clin Imaging 2014;38:792-6. 10.1016/j.clinimag.2014.05.001 [DOI] [PubMed] [Google Scholar]
- 29.Peckham ME, Hutchins TA, Stilwill SE, Mills MK, Morrissey BJ, Joiner EAR, Sanders RK, Stoddard GJ, Shah LM. Localizing the L5 Vertebra Using Nerve Morphology on MRI: An Accurate and Reliable Technique. AJNR Am J Neuroradiol 2017;38:2008-14. 10.3174/ajnr.A5311 [DOI] [PMC free article] [PubMed] [Google Scholar]
- 30.Ortega Herrera R, Ruiz Santiago F, Cañadillas Barea L, Galera L. Elongation of the anterior tubercle of the cervical vertebral transverse process. Radiologia 1999;41:531-3. [Google Scholar]
- 31.Bailitz J, Starr F, Beecroft M, Bankoff J, Roberts R, Bokhari F, Joseph K, Wiley D, Dennis A, Gilkey S, Erickson P, Raksin P, Nagy K. CT should replace three-view radiographs as the initial screening test in patients at high, moderate, and low risk for blunt cervical spine injury: a prospective comparison. J Trauma 2009;66:1605-9. 10.1097/TA.0b013e3181a5b0cc [DOI] [PubMed] [Google Scholar]
- 32.Griffen MM, Frykberg ER, Kerwin AJ, Schinco MA, Tepas JJ, Rowe K, Abboud J. Radiographic clearance of blunt cervical spine injury: plain radiograph or computed tomography scan? J Trauma 2003;55:222-6; discussion 226-7. 10.1097/01.TA.0000083332.93868.E2 [DOI] [PubMed] [Google Scholar]
- 33.Karul M, Bannas P, Schoennagel BP, Hoffmann A, Wedegaertner U, Adam G, Yamamura J. Fractures of the thoracic spine in patients with minor trauma: comparison of diagnostic accuracy and dose of biplane radiography and MDCT. Eur J Radiol 2013;82:1273-7. 10.1016/j.ejrad.2013.01.016 [DOI] [PubMed] [Google Scholar]
- 34.Rhea J, Sheridan R, Mullins M, Novelline R. Can chest and abdominal trauma CT eliminate the need for plain films of the spine? – Experience with 329 multiple trauma patients. Emerg Radiol 2001;8:99-104. 10.1007/PL00011886 [DOI] [Google Scholar]
- 35.Sheridan R, Peralta R, Rhea J, Ptak T, Novelline R. Reformatted visceral protocol helical computed tomographic scanning allows conventional radiographs of the thoracic and lumbar spine to be eliminated in the evaluation of blunt trauma patients. J Trauma 2003;55:665-9. 10.1097/01.TA.0000048094.38625.B5 [DOI] [PubMed] [Google Scholar]
- 36.Vaccaro AR, Koerner JD, Radcliff KE, Oner FC, Reinhold M, Schnake KJ, Kandziora F, Fehlings MG, Dvorak MF, Aarabi B, Rajasekaran S, Schroeder GD, Kepler CK, Vialle LR. AOSpine subaxial cervical spine injury classification system. Eur Spine J 2016;25:2173-84. 10.1007/s00586-015-3831-3 [DOI] [PubMed] [Google Scholar]
- 37.Vaccaro AR, Schroeder GD, Kepler CK, Cumhur Oner F, Vialle LR, Kandziora F, Koerner JD, Kurd MF, Reinhold M, Schnake KJ, Chapman J, Aarabi B, Fehlings MG, Dvorak MF. The surgical algorithm for the AOSpine thoracolumbar spine injury classification system. Eur Spine J 2016;25:1087-94. 10.1007/s00586-015-3982-2 [DOI] [PubMed] [Google Scholar]
- 38.Ruiz Santiago F, Tomás Muñoz P, Moya Sánchez E, Revelles Paniza M, Martínez Martínez A, Pérez Abela AL. Classifying thoracolumbar fractures: role of quantitative imaging. Quant Imaging Med Surg 2016;6:772-84. 10.21037/qims.2016.12.04 [DOI] [PMC free article] [PubMed] [Google Scholar]
- 39.Radcliff K, Su BW, Kepler CK, Rubin T, Shimer AL, Rihn JA, Harrop JA, Albert TJ, Vaccaro AR. Correlation of posterior ligamentous complex injury and neurological injury to loss of vertebral body height, kyphosis, and canal compromise. Spine (Phila Pa 1976) 2012;37:1142-50. 10.1097/BRS.0b013e318240fcd3 [DOI] [PubMed] [Google Scholar]
- 40.Neumann P, Wang Y, Kärrholm J, Malchau H, Nordwall A. Determination of inter-spinous process distance in the lumbar spine. Evaluation of reference population to facilitate detection of severe trauma. Eur Spine J 1999;8:272-8. 10.1007/s005860050172 [DOI] [PMC free article] [PubMed] [Google Scholar]
- 41.Rajasekaran S, Vaccaro AR, Kanna RM, Schroeder GD, Oner FC, Vialle L, Chapman J, Dvorak M, Fehlings M, Shetty AP, Schnake K, Maheshwaran A, Kandziora F. The value of CT and MRI in the classification and surgical decision-making among spine surgeons in thoracolumbar spinal injuries. Eur Spine J 2017;26:1463-9. 10.1007/s00586-016-4623-0 [DOI] [PubMed] [Google Scholar]
- 42.Pizones J, Izquierdo E, Alvarez P, Sánchez-Mariscal F, Zúñiga L, Chimeno P, Benza E, Castillo E. Impact of magnetic resonance imaging on decision making for thoracolumbar traumatic fracture diagnosis and treatment. Eur Spine J 2011;20 Suppl 3:390-6. 10.1007/s00586-011-1913-4 [DOI] [PMC free article] [PubMed] [Google Scholar]
- 43.Rajasekaran S, Kanna RM, Shetty AP. Management of thoracolumbar spine trauma: An overview. Indian J Orthop 2015;49:72-82. 10.4103/0019-5413.143914 [DOI] [PMC free article] [PubMed] [Google Scholar]
- 44.Spitnale MJ, Grabowski G. Classification in Brief: Subaxial Cervical Spine Injury Classification and Severity Score System. Clin Orthop Relat Res 2020;478:2390-8. 10.1097/CORR.0000000000001463 [DOI] [PMC free article] [PubMed] [Google Scholar]
- 45.Vaccaro AR, Hulbert RJ, Patel AA, Fisher C, Dvorak M, Lehman RA, Jr, Anderson P, Harrop J, Oner FC, Arnold P, Fehlings M, Hedlund R, Madrazo I, Rechtine G, Aarabi B, Shainline M, Spine Trauma Study Group . The subaxial cervical spine injury classification system: a novel approach to recognize the importance of morphology, neurology, and integrity of the disco-ligamentous complex. Spine (Phila Pa 1976) 2007;32:2365-74. 10.1097/BRS.0b013e3181557b92 [DOI] [PubMed] [Google Scholar]
- 46.Joaquim AF, Patel AA, Vaccaro AR. Cervical injuries scored according to the Subaxial Injury Classification system: An analysis of the literature. J Craniovertebr Junction Spine 2014;5:65-70. 10.4103/0974-8237.139200 [DOI] [PMC free article] [PubMed] [Google Scholar]
- 47.Bondurant FJ, Cotler HB, Kulkarni MV, McArdle CB, Harris JH, Jr. Acute spinal cord injury. A study using physical examination and magnetic resonance imaging. Spine (Phila Pa 1976) 1990;15:161-8. 10.1097/00007632-199003000-00002 [DOI] [PubMed] [Google Scholar]
- 48.Apple DF, Jr, McDonald AP, Smith RA. Identification of herniated nucleus pulposis in spinal cord injury. Paraplegia 1987;25:78-85. [DOI] [PubMed] [Google Scholar]
- 49.Ricart PA, Verma R, Fineberg SJ, Fink KY, Lucas PA, Lo Y, Asprinio DE, Amorosa LF. Post-traumatic cervical spine epidural hematoma: Incidence and risk factors. Injury 2017;48:2529-33. 10.1016/j.injury.2017.08.060 [DOI] [PubMed] [Google Scholar]
- 50.Pierce JL, Donahue JH, Nacey NC, Quirk CR, Perry MT, Faulconer N, Falkowski GA, Maldonado MD, Shaeffer CA, Shen FH. Spinal Hematomas: What a Radiologist Needs to Know. Radiographics 2018;38:1516-35. 10.1148/rg.2018180099 [DOI] [PubMed] [Google Scholar]
- 51.Vedantam A, Jirjis MB, Schmit BD, Wang MC, Ulmer JL, Kurpad SN. Diffusion tensor imaging of the spinal cord: insights from animal and human studies. Neurosurgery 2014;74:1-8; discussion 8; quiz 8. [DOI] [PMC free article] [PubMed]
- 52.Wáng YXJ, Che-Nordin N. Some radiographically 'occult' osteoporotic vertebral fractures can be evidential if we look carefully. Quant Imaging Med Surg 2019;9:1992-5. 10.21037/qims.2019.11.02 [DOI] [PMC free article] [PubMed] [Google Scholar]
- 53.Matzaroglou C, Georgiou CS, Panagopoulos A, Assimakopoulos K, Wilke HJ, Habermann B, Panos G, Kafchitsas K. Kümmell's Disease: Clarifying the Mechanisms and Patients' Inclusion Criteria. Open Orthop J 2014;8:288-97. 10.2174/1874325001408010288 [DOI] [PMC free article] [PubMed] [Google Scholar]
- 54.Venmans A, Klazen CA, Lohle PN, Mali WP, van Rooij WJ. Natural history of pain in patients with conservatively treated osteoporotic vertebral compression fractures: results from VERTOS II. AJNR Am J Neuroradiol 2012;33:519-21. 10.3174/ajnr.A2817 [DOI] [PMC free article] [PubMed] [Google Scholar]
- 55.Jung HS, Jee WH, McCauley TR, Ha KY, Choi KH. Discrimination of metastatic from acute osteoporotic compression spinal fractures with MR imaging. Radiographics 2003;23:179-87. 10.1148/rg.231025043 [DOI] [PubMed] [Google Scholar]
- 56.Mauch JT, Carr CM, Cloft H, Diehn FE. Review of the Imaging Features of Benign Osteoporotic and Malignant Vertebral Compression Fractures. AJNR Am J Neuroradiol 2018;39:1584-92. 10.3174/ajnr.A5528 [DOI] [PMC free article] [PubMed] [Google Scholar]
- 57.Erly WK, Oh ES, Outwater EK. The utility of in-phase/opposed-phase imaging in differentiating malignancy from acute benign compression fractures of the spine. AJNR Am J Neuroradiol 2006;27:1183-8. [PMC free article] [PubMed] [Google Scholar]
- 58.Borg B, Modic MT, Obuchowski N, Cheah G. Pedicle marrow signal hyperintensity on short tau inversion recovery- and t2-weighted images: prevalence and relationship to clinical symptoms. AJNR Am J Neuroradiol 2011;32:1624-31. 10.3174/ajnr.A2588 [DOI] [PMC free article] [PubMed] [Google Scholar]
- 59.Perolat R, Kastler A, Nicot B, Pellat JM, Tahon F, Attye A, Heck O, Boubagra K, Grand S, Krainik A. Facet joint syndrome: from diagnosis to interventional management. Insights Imaging 2018;9:773-89. 10.1007/s13244-018-0638-x [DOI] [PMC free article] [PubMed] [Google Scholar]
- 60.Lakadamyali H, Tarhan NC, Ergun T, Cakir B, Agildere AM. STIR sequence for depiction of degenerative changes in posterior stabilizing elements in patients with lower back pain. AJR Am J Roentgenol 2008;191:973-9. 10.2214/AJR.07.2829 [DOI] [PubMed] [Google Scholar]
- 61.Rihn JA, Lee JY, Khan M, Ulibarri JA, Tannoury C, Donaldson WF, 3rd, Kang JD. Does lumbar facet fluid detected on magnetic resonance imaging correlate with radiographic instability in patients with degenerative lumbar disease? Spine (Phila Pa 1976) 2007;32:1555-60. 10.1097/BRS.0b013e318067dc55 [DOI] [PubMed] [Google Scholar]
- 62.Friedrich KM, Nemec S, Peloschek P, Pinker K, Weber M, Trattnig S. The prevalence of lumbar facet joint edema in patients with low back pain. Skeletal Radiol 2007;36:755-60. 10.1007/s00256-007-0293-7 [DOI] [PubMed] [Google Scholar]
- 63.Chaput C, Padon D, Rush J, Lenehan E, Rahm M. The significance of increased fluid signal on magnetic resonance imaging in lumbar facets in relationship to degenerative spondylolisthesis. Spine (Phila Pa 1976) 2007;32:1883-7. 10.1097/BRS.0b013e318113271a [DOI] [PubMed] [Google Scholar]
- 64.Jensen MC, Brant-Zawadzki MN, Obuchowski N, Modic MT, Malkasian D, Ross JS. Magnetic resonance imaging of the lumbar spine in people without back pain. N Engl J Med 1994;331:69-73. 10.1056/NEJM199407143310201 [DOI] [PubMed] [Google Scholar]
- 65.Weishaupt D, Zanetti M, Hodler J, Boos N. MR imaging of the lumbar spine: prevalence of intervertebral disk extrusion and sequestration, nerve root compression, end plate abnormalities, and osteoarthritis of the facet joints in asymptomatic volunteers. Radiology 1998;209:661-6. 10.1148/radiology.209.3.9844656 [DOI] [PubMed] [Google Scholar]
- 66.Kalichman L, Li L, Kim DH, Guermazi A, Berkin V, O'Donnell CJ, Hoffmann U, Cole R, Hunter DJ. Facet joint osteoarthritis and low back pain in the community-based population. Spine (Phila Pa 1976) 2008;33:2560-5. 10.1097/BRS.0b013e318184ef95 [DOI] [PMC free article] [PubMed] [Google Scholar]
- 67.Suri P, Miyakoshi A, Hunter DJ, Jarvik JG, Rainville J, Guermazi A, Li L, Katz JN. Does lumbar spinal degeneration begin with the anterior structures? A study of the observed epidemiology in a community-based population. BMC Musculoskelet Disord 2011;12:202. 10.1186/1471-2474-12-202 [DOI] [PMC free article] [PubMed] [Google Scholar]
- 68.Filippiadis DK, Mazioti A, Argentos S, Anselmetti G, Papakonstantinou O, Kelekis N, Kelekis A. Baastrup's disease (kissing spines syndrome): a pictorial review. Insights Imaging 2015;6:123-8. 10.1007/s13244-014-0376-7 [DOI] [PMC free article] [PubMed] [Google Scholar]
- 69.Stadnik TW, Lee RR, Coen HL, Neirynck EC, Buisseret TS, Osteaux MJ. Annular tears and disk herniation: prevalence and contrast enhancement on MR images in the absence of low back pain or sciatica. Radiology 1998;206:49-55. 10.1148/radiology.206.1.9423651 [DOI] [PubMed] [Google Scholar]
- 70.Pfirrmann CW, Metzdorf A, Zanetti M, Hodler J, Boos N. Magnetic resonance classification of lumbar intervertebral disc degeneration. Spine (Phila Pa 1976) 2001;26:1873-8. 10.1097/00007632-200109010-00011 [DOI] [PubMed] [Google Scholar]
- 71.Griffith JF, Wang YX, Antonio GE, Choi KC, Yu A, Ahuja AT, Leung PC. Modified Pfirrmann grading system for lumbar intervertebral disc degeneration. Spine (Phila Pa 1976) 2007;32:E708-12. 10.1097/BRS.0b013e31815a59a0 [DOI] [PubMed] [Google Scholar]
- 72.Ract I, Meadeb JM, Mercy G, Cueff F, Husson JL, Guillin R. A review of the value of MRI signs in low back pain. Diagn Interv Imaging 2015;96:239-49. 10.1016/j.diii.2014.02.019 [DOI] [PubMed] [Google Scholar]
- 73.Ravault PP, Meunier P, Sambin P, Cret R, Bianchi GS. An early sign of spinal osteoprosis: enlargement of lumbar disc spaces. Rev Lyon Med 1969;18:603-13. [PubMed] [Google Scholar]
- 74.Kwok AW, Wang YX, Griffith JF, Deng M, Leung JC, Ahuja AT, Leung PC. Morphological changes of lumbar vertebral bodies and intervertebral discs associated with decrease in bone mineral density of the spine: a cross-sectional study in elderly subjects. Spine (Phila Pa 1976) 2012;37:E1415-21. 10.1097/BRS.0b013e31826f561e [DOI] [PubMed] [Google Scholar]
- 75.Wang YXJ. Several concerns on grading lumbar disc degeneration on MR image with Pfirrmann criteria. J Orthop Translat 2022;32:101-2. 10.1016/j.jot.2021.12.003 [DOI] [PMC free article] [PubMed] [Google Scholar]
- 76.Adams MA, Dolan P. Intervertebral disc degeneration: evidence for two distinct phenotypes. J Anat 2012;221:497-506. 10.1111/j.1469-7580.2012.01551.x [DOI] [PMC free article] [PubMed] [Google Scholar]
- 77.Aprill C, Bogduk N. High-intensity zone: a diagnostic sign of painful lumbar disc on magnetic resonance imaging. Br J Radiol 1992;65:361-9. 10.1259/0007-1285-65-773-361 [DOI] [PubMed] [Google Scholar]
- 78.Schellhas KP, Pollei SR, Gundry CR, Heithoff KB. Lumbar disc high-intensity zone. Correlation of magnetic resonance imaging and discography. Spine (Phila Pa 1976) 1996;21:79-86. 10.1097/00007632-199601010-00018 [DOI] [PubMed] [Google Scholar]
- 79.Bogduk N, Aprill C, Derby R. Lumbar discogenic pain: state-of-the-art review. Pain Med 2013;14:813-36. 10.1111/pme.12082 [DOI] [PubMed] [Google Scholar]
- 80.Chung CB, Vande Berg BC, Tavernier T, Cotten A, Laredo JD, Vallee C, Malghem J. End plate marrow changes in the asymptomatic lumbosacral spine: frequency, distribution and correlation with age and degenerative changes. Skeletal Radiol 2004;33:399-404. 10.1007/s00256-004-0780-z [DOI] [PubMed] [Google Scholar]
- 81.Munter FM, Wasserman BA, Wu HM, Yousem DM, Serial MR. Imaging of Annular Tears in Lumbar Intervertebral Disks. AJNR Am J Neuroradiol 2002;23:1105-9. [PMC free article] [PubMed] [Google Scholar]
- 82.Fardon DF, Williams AL, Dohring EJ, Murtagh FR, Gabriel Rothman SL, Sze GK. Lumbar disc nomenclature: version 2.0: Recommendations of the combined task forces of the North American Spine Society, the American Society of Spine Radiology and the American Society of Neuroradiology. Spine J 2014;14:2525-45. 10.1016/j.spinee.2014.04.022 [DOI] [PubMed] [Google Scholar]
- 83.Boden SD, Davis DO, Dina TS, Patronas NJ, Wiesel SW. Abnormal magnetic-resonance scans of the lumbar spine in asymptomatic subjects. A prospective investigation. J Bone Joint Surg Am 1990;72:403-8. 10.2106/00004623-199072030-00013 [DOI] [PubMed] [Google Scholar]
- 84.Weishaupt D, Zanetti M, Hodler J, Min K, Fuchs B, Pfirrmann CW, Boos N. Painful Lumbar Disk Derangement: Relevance of Endplate Abnormalities at MR Imaging. Radiology 2001;218:420-7. 10.1148/radiology.218.2.r01fe15420 [DOI] [PubMed] [Google Scholar]
- 85.Amoretti N, Guinebert S, Kastler A, Torre F, Andreani O, Foti P, Cornelis F, Theumann N, Hauger O. Symptomatic Schmorl's nodes: role of percutaneous vertebroplasty. Open study on 52 patients. Neuroradiology 2019;61:405-10. 10.1007/s00234-019-02171-7 [DOI] [PubMed] [Google Scholar]
- 86.Wu HT, Morrison WB, Schweitzer ME. Edematous Schmorl's nodes on thoracolumbar MR imaging: characteristic patterns and changes over time. Skeletal Radiol 2006;35:212-9. 10.1007/s00256-005-0068-y [DOI] [PubMed] [Google Scholar]
- 87.Luoma K, Vehmas T, Kerttula L, Grönblad M, Rinne E. Chronic low back pain in relation to Modic changes, bony endplate lesions, and disc degeneration in a prospective MRI study. Eur Spine J 2016;25:2873-81. 10.1007/s00586-016-4715-x [DOI] [PubMed] [Google Scholar]
- 88.Määttä JH, Karppinen J, Paananen M, Bow C, Luk KDK, Cheung KMC, Samartzis D. Refined Phenotyping of Modic Changes: Imaging Biomarkers of Prolonged Severe Low Back Pain and Disability. Medicine (Baltimore) 2016;95:e3495. 10.1097/MD.0000000000003495 [DOI] [PMC free article] [PubMed] [Google Scholar]
- 89.Wáng YXJ, Wu AM, Ruiz Santiago F, Nogueira-Barbosa MH. Informed appropriate imaging for low back pain management: A narrative review. J Orthop Translat 2018;15:21-34. 10.1016/j.jot.2018.07.009 [DOI] [PMC free article] [PubMed] [Google Scholar]
- 90.Kerttula L, Luoma K, Vehmas T, Grönblad M, Kääpä E. Modic type I change may predict rapid progressive, deforming disc degeneration: a prospective 1-year follow-up study. Eur Spine J 2012;21:1135-42. 10.1007/s00586-012-2147-9 [DOI] [PMC free article] [PubMed] [Google Scholar]
- 91.Kuisma M, Karppinen J, Niinimäki J, Kurunlahti M, Haapea M, Vanharanta H, Tervonen O. A three-year follow-up of lumbar spine endplate (Modic) changes. Spine (Phila Pa 1976) 2006;31:1714-8. 10.1097/01.brs.0000224167.18483.14 [DOI] [PubMed] [Google Scholar]
- 92.Le HV, Wick JB, Van BW, Klineberg EO. Diffuse Idiopathic Skeletal Hyperostosis of the Spine: Pathophysiology, Diagnosis, and Management. J Am Acad Orthop Surg 2021;29:1044-51. 10.5435/JAAOS-D-20-01344 [DOI] [PubMed] [Google Scholar]
- 93.Mader R, Verlaan JJ, Eshed I, Bruges-Armas J, Puttini PS, Atzeni F, Buskila D, Reinshtein E, Novofastovski I, Fawaz A, Kurt V, Baraliakos X. Diffuse idiopathic skeletal hyperostosis (DISH): where we are now and where to go next. RMD Open 2017;3:e000472. 10.1136/rmdopen-2017-000472 [DOI] [PMC free article] [PubMed] [Google Scholar]
- 94.Utsinger PD. Diffuse idiopathic skeletal hyperostosis. Clin Rheum Dis 1985;11:325-51. 10.1016/S0307-742X(21)00544-0 [DOI] [PubMed] [Google Scholar]
- 95.Venkatanarasimha N, Parrish RW. Case 148: Thoracic epidural lipomatosis. Radiology 2009;252:618-22. 10.1148/radiol.2522080365 [DOI] [PubMed] [Google Scholar]
- 96.Lai MKL, Cheung PWH, Cheung JPY. A systematic review of developmental lumbar spinal stenosis. Eur Spine J 2020;29:2173-87. 10.1007/s00586-020-06524-2 [DOI] [PubMed] [Google Scholar]
- 97.Cheung JP, Samartzis D, Shigematsu H, Cheung KM. Defining clinically relevant values for developmental spinal stenosis: a large-scale magnetic resonance imaging study. Spine (Phila Pa 1976) 2014;39:1067-76. 10.1097/BRS.0000000000000335 [DOI] [PubMed] [Google Scholar]
- 98.Chatha DS, Schweitzer ME. MRI criteria of developmental lumbar spinal stenosis revisited. Bull NYU Hosp Jt Dis 2011;69:303-7. [PubMed] [Google Scholar]
- 99.Postacchini F, Pezzeri G. CT scanning versus myelography in the diagnosis of lumbar stenosis. A preliminary report. Int Orthop 1981;5:209-15. 10.1007/BF00266685 [DOI] [PubMed] [Google Scholar]
- 100.Mrówka R, Pieniazek J. Developmental narrowing of the spinal canal in the lumbar region. Zentralbl Neurochir 1986;47:144-8. [PubMed] [Google Scholar]
- 101.Bartynski WS, Petropoulou KA. The MR imaging features and clinical correlates in low back pain-related syndromes. Magn Reson Imaging Clin N Am 2007;15:137-54, v. 10.1016/j.mric.2007.01.010 [DOI] [PubMed] [Google Scholar]
- 102.Sirvanci M, Bhatia M, Ganiyusufoglu KA, Duran C, Tezer M, Ozturk C, Aydogan M, Hamzaoglu A. Degenerative lumbar spinal stenosis: correlation with Oswestry Disability Index and MR imaging. Eur Spine J 2008;17:679-85. 10.1007/s00586-008-0646-5 [DOI] [PMC free article] [PubMed] [Google Scholar]
- 103.Park HJ, Kim SS, Lee YJ, Lee SY, Park NH, Choi YJ, Chung EC, Rho MH. Clinical correlation of a new practical MRI method for assessing central lumbar spinal stenosis. Br J Radiol 2013;86:20120180. 10.1259/bjr.20120180 [DOI] [PMC free article] [PubMed] [Google Scholar]
- 104.Bartynski WS, Lin L. Lumbar root compression in the lateral recess: MR imaging, conventional myelography, and CT myelography comparison with surgical confirmation. AJNR Am J Neuroradiol 2003;24:348-60. [PMC free article] [PubMed] [Google Scholar]
- 105.Lee S, Lee JW, Yeom JS, Kim KJ, Kim HJ, Chung SK, Kang HS. A practical MRI grading system for lumbar foraminal stenosis. AJR Am J Roentgenol 2010;194:1095-8. 10.2214/AJR.09.2772 [DOI] [PubMed] [Google Scholar]
- 106.Wildermuth S, Zanetti M, Duewell S, Schmid MR, Romanowski B, Benini A, Böni T, Hodler J. Lumbar spine: quantitative and qualitative assessment of positional (upright flexion and extension) MR imaging and myelography. Radiology 1998;207:391-8. 10.1148/radiology.207.2.9577486 [DOI] [PubMed] [Google Scholar]
- 107.Kim YH, Kim HJ, Seo J, Chai JW, Song HG, Choi YH, Kim DH. Spinal nerve signal intensity on Dixon T2-weighted water-only sequence: an important outcome predictor after lumbar transforaminal epidural injection. Eur Radiol 2021;31:9459-67. 10.1007/s00330-021-08119-x [DOI] [PubMed] [Google Scholar]
- 108.Farshad M, Sutter R, Hoch A. Severity of foraminal lumbar stenosis and the relation to clinical symptoms and response to periradicular infiltration-introduction of the "melting sign". Spine J 2018;18:294-9. 10.1016/j.spinee.2017.07.176 [DOI] [PubMed] [Google Scholar]
- 109.Cook C, Braga-Baiak A, Pietrobon R, Shah A, Neto AC, de Barros N. Observer agreement of spine stenosis on magnetic resonance imaging analysis of patients with cervical spine myelopathy. J Manipulative Physiol Ther 2008;31:271-6. 10.1016/j.jmpt.2008.03.006 [DOI] [PubMed] [Google Scholar]
- 110.Yilmazlar S, Kocaeli H, Uz A, Tekdemir I. Clinical importance of ligamentous and osseous structures in the cervical uncovertebral foraminal region. Clin Anat 2003;16:404-10. 10.1002/ca.10158 [DOI] [PubMed] [Google Scholar]
- 111.Kang Y, Lee JW, Koh YH, Hur S, Kim SJ, Chai JW, Kang HS. New MRI grading system for the cervical canal stenosis. AJR Am J Roentgenol 2011;197:W134-40. 10.2214/AJR.10.5560 [DOI] [PubMed] [Google Scholar]
- 112.Park HJ, Kim SS, Lee SY, Park NH, Chung EC, Rho MH, Kwon HJ, Kook SH. A practical MRI grading system for cervical foraminal stenosis based on oblique sagittal images. Br J Radiol 2013;86:20120515. 10.1259/bjr.20120515 [DOI] [PMC free article] [PubMed] [Google Scholar]
- 113.Kim S, Lee JW, Chai JW, Yoo HJ, Kang Y, Seo J, Ahn JM, Kang HS. A New MRI Grading System for Cervical Foraminal Stenosis Based on Axial T2-Weighted Images. Korean J Radiol 2015;16:1294-302. 10.3348/kjr.2015.16.6.1294 [DOI] [PMC free article] [PubMed] [Google Scholar]
- 114.Meacock J, Schramm M, Selvanathan S, Currie S, Stocken D, Jayne D, Thomson S. Systematic review of radiological cervical foraminal grading systems. Neuroradiology 2021;63:305-16. 10.1007/s00234-020-02596-5 [DOI] [PubMed] [Google Scholar]
- 115.Lee HD, Jeon CH, Chung NS, Yoon HS, Chung HW. Is the Severity of Cervical Foraminal Stenosis Related to the Severity and Sidedness of Symptoms? Healthcare (Basel) 2021;9:1743. 10.3390/healthcare9121743 [DOI] [PMC free article] [PubMed] [Google Scholar]
- 116.Gallucci M, Limbucci N, Paonessa A, Splendiani A. Degenerative disease of the spine. Neuroimaging Clin N Am 2007;17:87-103. 10.1016/j.nic.2007.01.002 [DOI] [PubMed] [Google Scholar]
- 117.Dhouib A, Tabard-Fougere A, Hanquinet S, Dayer R. Diagnostic accuracy of MR imaging for direct visualization of lumbar pars defect in children and young adults: a systematic review and meta-analysis. Eur Spine J 2018;27:1058-66. 10.1007/s00586-017-5305-2 [DOI] [PubMed] [Google Scholar]
- 118.Ang EC, Robertson AF, Malara FA, O'Shea T, Roebert JK, Schneider ME, Rotstein AH. Diagnostic accuracy of 3-T magnetic resonance imaging with 3D T1 VIBE versus computer tomography in pars stress fracture of the lumbar spine. Skeletal Radiol 2016;45:1533-40. 10.1007/s00256-016-2475-7 [DOI] [PubMed] [Google Scholar]
- 119.Hollenberg GM, Beattie PF, Meyers SP, Weinberg EP, Adams MJ. Stress reactions of the lumbar pars interarticularis: the development of a new MRI classification system. Spine (Phila Pa 1976) 2002;27:181-6. 10.1097/00007632-200201150-00012 [DOI] [PubMed] [Google Scholar]
- 120.Cheung KK, Dhawan RT, Wilson LF, Peirce NS, Rajeswaran G. Pars interarticularis injury in elite athletes - The role of imaging in diagnosis and management. Eur J Radiol 2018;108:28-42. 10.1016/j.ejrad.2018.08.029 [DOI] [PubMed] [Google Scholar]
- 121.Dunn AJ, Campbell RS, Mayor PE, Rees D. Radiological findings and healing patterns of incomplete stress fractures of the pars interarticularis. Skeletal Radiol 2008;37:443-50. 10.1007/s00256-008-0449-0 [DOI] [PubMed] [Google Scholar]
- 122.Sherif H, Mahfouz AE. Epidural fat interposition between dura mater and spinous process: a new sign for the diagnosis of spondylolysis on MR imaging of the lumbar spine. Eur Radiol 2004;14:970-3. 10.1007/s00330-004-2235-2 [DOI] [PubMed] [Google Scholar]
- 123.Schmid T, Heini P, Benneker L. A rare case of non-traumatic, multi-level, bilateral pedicle fractures of the lumbar spine in a 60-year-old patient. Eur Spine J 2017;26:197-201. 10.1007/s00586-017-5029-3 [DOI] [PubMed] [Google Scholar]
- 124.He LC, Wang YX, Gong JS, Griffith JF, Zeng XJ, Kwok AW, Leung JC, Kwok T, Ahuja AT, Leung PC. Prevalence and risk factors of lumbar spondylolisthesis in elderly Chinese men and women. Eur Radiol 2014;24:441-8. 10.1007/s00330-013-3041-5 [DOI] [PMC free article] [PubMed] [Google Scholar]
- 125.Wang YXJ, Káplár Z, Deng M, Leung JCS. Lumbar degenerative spondylolisthesis epidemiology: A systematic review with a focus on gender-specific and age-specific prevalence. J Orthop Translat 2016;11:39-52. 10.1016/j.jot.2016.11.001 [DOI] [PMC free article] [PubMed] [Google Scholar]
- 126.Gupta P, Kumar A, Gamangatti S. Mechanism and patterns of cervical spine fractures-dislocations in vertebral artery injury. J Craniovertebr Junction Spine 2012;3:11-5. 10.4103/0974-8237.110118 [DOI] [PMC free article] [PubMed] [Google Scholar]
- 127.Ruiz Santiago F, Moreno Gaya M, Suárez Boville I, López Milena G, Rodríguez Fernández, C Tristán Fernández J, Rodríguez Vacas J. Evolución clínica y radiológica de la cifosis juvenil. Rehabilitación 2003;37:11-6. 10.1016/S0048-7120(03)73327-1 [DOI] [Google Scholar]
- 128.Khanna G. Role of imaging in scoliosis. Pediatr Radiol 2009;39 Suppl 2:S247-51. 10.1007/s00247-008-1126-0 [DOI] [PubMed] [Google Scholar]
- 129.Dobbs MB, Lenke LG, Szymanski DA, Morcuende JA, Weinstein SL, Bridwell KH, Sponseller PD. Prevalence of neural axis abnormalities in patients with infantile idiopathic scoliosis. J Bone Joint Surg Am 2002;84:2230-4. 10.2106/00004623-200212000-00016 [DOI] [PubMed] [Google Scholar]
- 130.Davies A, Saifuddin A. Imaging of painful scoliosis. Skeletal Radiol 2009;38:207-23. 10.1007/s00256-008-0517-5 [DOI] [PubMed] [Google Scholar]
- 131.Johnson MA, Gohel S, Mitchell SL, Flynn JJM, Baldwin KD. Entire-spine Magnetic Resonance Imaging Findings and Costs in Children With Presumed Adolescent Idiopathic Scoliosis. J Pediatr Orthop 2021;41:585-90. 10.1097/BPO.0000000000001943 [DOI] [PubMed] [Google Scholar]
- 132.Swarup I, Silberman J, Blanco J, Widmann R. Incidence of Intraspinal and Extraspinal MRI Abnormalities in Patients With Adolescent Idiopathic Scoliosis. Spine Deform 2019;7:47-52. 10.1016/j.jspd.2018.06.006 [DOI] [PubMed] [Google Scholar]
- 133.de Oliveira RG, de Araújo AO, Gomes CR. Magnetic resonance imaging effectiveness in adolescent idiopathic scoliosis. Spine Deform 2021;9:67-73. 10.1007/s43390-020-00205-2 [DOI] [PubMed] [Google Scholar]
- 134.Ransford AO, Pozo JL, Hutton PA, Kirwan EO. The behaviour pattern of the scoliosis associated with osteoid osteoma or osteoblastoma of the spine. J Bone Joint Surg Br 1984;66:16-20. 10.1302/0301-620X.66B1.6693471 [DOI] [PubMed] [Google Scholar]
- 135.Jurik AG. Imaging the spine in arthritis-a pictorial review. Insights Imaging 2011;2:177-91. 10.1007/s13244-010-0061-4 [DOI] [PMC free article] [PubMed] [Google Scholar]
- 136.Caetano AP, Mascarenhas VV, Machado PM. Axial Spondyloarthritis: Mimics and Pitfalls of Imaging Assessment. Front Med (Lausanne) 2021;8:658538. 10.3389/fmed.2021.658538 [DOI] [PMC free article] [PubMed] [Google Scholar]
- 137.Haibel H, Rudwaleit M, Listing J, Heldmann F, Wong RL, Kupper H, Braun J, Sieper J. Efficacy of adalimumab in the treatment of axial spondylarthritis without radiographically defined sacroiliitis: results of a twelve-week randomized, double-blind, placebo-controlled trial followed by an open-label extension up to week fifty-two. Arthritis Rheum 2008;58:1981-91. 10.1002/art.23606 [DOI] [PubMed] [Google Scholar]
- 138.Rudwaleit M, van der Heijde D, Landewé R, Listing J, Akkoc N, Brandt J, et al. The development of Assessment of SpondyloArthritis international Society classification criteria for axial spondyloarthritis (part II): validation and final selection. Ann Rheum Dis 2009;68:777-83. 10.1136/ard.2009.108233 [DOI] [PubMed] [Google Scholar]
- 139.Malaviya AN, Rawat R, Agrawal N, Patil NS. The Nonradiographic Axial Spondyloarthritis, the Radiographic Axial Spondyloarthritis, and Ankylosing Spondylitis: The Tangled Skein of Rheumatology. Int J Rheumatol 2017;2017:1824794. 10.1155/2017/1824794 [DOI] [PMC free article] [PubMed] [Google Scholar]
- 140.Elgafy H, Semaan HB, Ebraheim NA, Coombs RJ. Computed tomography findings in patients with sacroiliac pain. Clin Orthop Relat Res 2001;(382):112-8. 10.1097/00003086-200101000-00017 [DOI] [PubMed] [Google Scholar]
- 141.Proft F, Poddubnyy D. Ankylosing spondylitis and axial spondyloarthritis: recent insights and impact of new classification criteria. Ther Adv Musculoskelet Dis 2018;10:129-39. 10.1177/1759720X18773726 [DOI] [PMC free article] [PubMed] [Google Scholar]
- 142.Rudwaleit M, Jurik AG, Hermann KG, Landewé R, van der Heijde D, Baraliakos X, Marzo-Ortega H, Ostergaard M, Braun J, Sieper J. Defining active sacroiliitis on magnetic resonance imaging (MRI) for classification of axial spondyloarthritis: a consensual approach by the ASAS/OMERACT MRI group. Ann Rheum Dis 2009;68:1520-7. 10.1136/ard.2009.110767 [DOI] [PubMed] [Google Scholar]
- 143.Rudwaleit M, Landewé R, van der Heijde D, Listing J, Brandt J, Braun J, et al. The development of Assessment of SpondyloArthritis international Society classification criteria for axial spondyloarthritis (part I): classification of paper patients by expert opinion including uncertainty appraisal. Ann Rheum Dis 2009;68:770-6. 10.1136/ard.2009.108217 [DOI] [PubMed] [Google Scholar]
- 144.Akgul O, Ozgocmen S. Classification criteria for spondyloarthropathies. World J Orthop 2011;2:107-15. 10.5312/wjo.v2.i12.107 [DOI] [PMC free article] [PubMed] [Google Scholar]
- 145.Maksymowych WP, Eshed I, Machado PM, Juhl Pedersen SJ, Weber U, De Hooge M, Sieper J, Wichuk S, Poddubnyy D, Rudwaleit M, Van der Heijde D, Landewé RBM, Lambert RG, Ǿstergaard M, Baraliakos X. Consensus definitions for MRI lesions in the spine of patients with axial spondyloarthritis: first analysis from the assessments in spondyloarthritis international society classification cohort (abstract). Ann Rheum Dis 2020;79:749-50. 10.1136/annrheumdis-2020-eular.6304 [DOI] [Google Scholar]
- 146.Hermann KG, Baraliakos X, van der Heijde DM, Jurik AG, Landewé R, Marzo-Ortega H, Østergaard M, Rudwaleit M, Sieper J, Braun J; Assessment in SpondyloArthritis international Society (ASAS). Descriptions of spinal MRI lesions and definition of a positive MRI of the spine in axial spondyloarthritis: a consensual approach by the ASAS/OMERACT MRI study group. Ann Rheum Dis 2012;71:1278-88. 10.1136/ard.2011.150680 [DOI] [PubMed] [Google Scholar]
- 147.Park YS, Kim JH, Ryu JA, Kim TH. The Andersson lesion in ankylosing spondylitis: distinguishing between the inflammatory and traumatic subtypes. J Bone Joint Surg Br 2011;93:961-6. 10.1302/0301-620X.93B7.26337 [DOI] [PubMed] [Google Scholar]
- 148.Hong SH, Choi JY, Lee JW, Kim NR, Choi JA, Kang HS. MR imaging assessment of the spine: infection or an imitation? Radiographics 2009;29:599-612. 10.1148/rg.292085137 [DOI] [PubMed] [Google Scholar]
- 149.Modic MT, Feiglin DH, Piraino DW, Boumphrey F, Weinstein MA, Duchesneau PM, Rehm S. Vertebral osteomyelitis: assessment using MR. Radiology 1985;157:157-66. 10.1148/radiology.157.1.3875878 [DOI] [PubMed] [Google Scholar]
- 150.Tali ET. Spinal infections. Eur J Radiol 2004;50:120-33. 10.1016/j.ejrad.2003.10.022 [DOI] [PubMed] [Google Scholar]
- 151.Dagirmanjian A, Schils J, McHenry M, Modic MT. MR imaging of vertebral osteomyelitis revisited. AJR Am J Roentgenol 1996;167:1539-43. 10.2214/ajr.167.6.8956593 [DOI] [PubMed] [Google Scholar]
- 152.Maiuri F, Iaconetta G, Gallicchio B, Manto A, Briganti F. Spondylodiscitis. Clinical and magnetic resonance diagnosis. Spine (Phila Pa 1976) 1997;22:1741-6. 10.1097/00007632-199708010-00012 [DOI] [PubMed] [Google Scholar]
- 153.Dunbar JA, Sandoe JA, Rao AS, Crimmins DW, Baig W, Rankine JJ. The MRI appearances of early vertebral osteomyelitis and discitis. Clin Radiol 2010;65:974-81. 10.1016/j.crad.2010.03.015 [DOI] [PubMed] [Google Scholar]
- 154.Ledbetter LN, Salzman KL, Shah LM. Imaging Psoas Sign in Lumbar Spinal Infections: Evaluation of Diagnostic Accuracy and Comparison with Established Imaging Characteristics. AJNR Am J Neuroradiol 2016;37:736-41. 10.3174/ajnr.A4571 [DOI] [PMC free article] [PubMed] [Google Scholar]
- 155.Tetsuka S, Suzuki T, Ogawa T, Hashimoto R, Kato H. Spinal Epidural Abscess: A Review Highlighting Early Diagnosis and Management. JMA J 2020;3:29-40. [DOI] [PMC free article] [PubMed] [Google Scholar]
- 156.Moritani T, Kim J, Capizzano AA, Kirby P, Kademian J, Sato Y. Pyogenic and non-pyogenic spinal infections: emphasis on diffusion-weighted imaging for the detection of abscesses and pus collections. Br J Radiol 2014;87:20140011. 10.1259/bjr.20140011 [DOI] [PMC free article] [PubMed] [Google Scholar]
- 157.Laur O, Mandell JC, Titelbaum DS, Cho C, Smith SE, Khurana B. Acute Nontraumatic Back Pain: Infections and Mimics. Radiographics 2019;39:287-8. 10.1148/rg.2019180077 [DOI] [PubMed] [Google Scholar]
- 158.Cheung WY, Luk KD. Pyogenic spondylitis. Int Orthop 2012;36:397-404. 10.1007/s00264-011-1384-6 [DOI] [PMC free article] [PubMed] [Google Scholar]
- 159.Teh J, Imam A, Watts C. Imaging of back pain. Imaging 2005;17:171-207. 10.1259/imaging/51081048 [DOI] [Google Scholar]
- 160.Diehn FE. Imaging of spine infection. Radiol Clin North Am 2012;50:777-98. 10.1016/j.rcl.2012.04.001 [DOI] [PubMed] [Google Scholar]
- 161.Afonso PD, Almeida A. Tuberculous spondilodiskitis: imaging features. Acta Med Port 2011;24:349-54. [PubMed] [Google Scholar]
- 162.Shen L, Jiang C, Jiang R, Fang W, Feng Q, Wang L, Wu C, Ma Z. Diagnosis and classification in MRI of brucellar spondylitis. Radiol Infect Dis 2017;4:102-7. 10.1016/j.jrid.2017.08.005 [DOI] [Google Scholar]
- 163.Mundy GR. Metastasis to bone: causes, consequences and therapeutic opportunities. Nat Rev Cancer 2002;2:584-93. 10.1038/nrc867 [DOI] [PubMed] [Google Scholar]
- 164.Rodallec MH, Feydy A, Larousserie F, Anract P, Campagna R, Babinet A, Zins M, Drapé JL. Diagnostic imaging of solitary tumors of the spine: what to do and say. Radiographics 2008;28:1019-41. 10.1148/rg.284075156 [DOI] [PubMed] [Google Scholar]
- 165.Yang L, Zhang S, Gu R, Peng C, Wu M. Imaging features of primary spinal osseous tumors and their value in clinical diagnosis. Oncol Lett 2019;17:1089-93. [DOI] [PMC free article] [PubMed] [Google Scholar]
- 166.Liu T, Wang S, Liu H, Meng B, Zhou F, He F, Shi X, Yang H. Detection of vertebral metastases: a meta-analysis comparing MRI, CT, PET, BS and BS with SPECT. J Cancer Res Clin Oncol 2017;143:457-65. 10.1007/s00432-016-2288-z [DOI] [PubMed] [Google Scholar]
- 167.Zhou J, Gou Z, Wu R, Yuan Y, Yu G, Zhao Y. Comparison of PSMA-PET/CT, choline-PET/CT, NaF-PET/CT, MRI, and bone scintigraphy in the diagnosis of bone metastases in patients with prostate cancer: a systematic review and meta-analysis. Skeletal Radiol 2019;48:1915-24. 10.1007/s00256-019-03230-z [DOI] [PubMed] [Google Scholar]
- 168.Lütje S, de Rooy JW, Croockewit S, Koedam E, Oyen WJ, Raymakers RA. Role of radiography, MRI and FDG-PET/CT in diagnosing, staging and therapeutical evaluation of patients with multiple myeloma. Ann Hematol 2009;88:1161-8. 10.1007/s00277-009-0829-0 [DOI] [PMC free article] [PubMed] [Google Scholar]
- 169.Mesguich C, Hulin C, Latrabe V, Asselineau J, Bordenave L, Perez P, Hindie E, Marit G. Prospective Comparison of 18F-Choline Positron Emission Tomography/Computed Tomography (PET/CT) and 18F-Fluorodeoxyglucose (FDG) PET/CT in the Initial Workup of Multiple Myeloma: Study Protocol of a Prospective Imaging Trial. JMIR Res Protoc 2020;9:e17850. 10.2196/17850 [DOI] [PMC free article] [PubMed] [Google Scholar]
- 170.Chen HI, Heuer GG, Zaghloul K, Simon SL, Weigele JB, Grady MS. Lumbar vertebral hemangioma presenting with the acute onset of neurological symptoms. Case report. J Neurosurg Spine 2007;7:80-5. 10.3171/SPI-07/07/080 [DOI] [PubMed] [Google Scholar]
- 171.Gaudino S, Martucci M, Colantonio R, Lozupone E, Visconti E, Leone A, Colosimo C. A systematic approach to vertebral hemangioma. Skeletal Radiol 2015;44:25-36. 10.1007/s00256-014-2035-y [DOI] [PubMed] [Google Scholar]
- 172.Price HI, Batnitzky S. The computed tomographic findings in benign diseases of the vertebral column. Crit Rev Diagn Imaging 1985;24:39-89. [PubMed] [Google Scholar]
- 173.Ross JS, Masaryk TJ, Modic MT, Carter JR, Mapstone T, Dengel FH. Vertebral hemangiomas: MR imaging. Radiology 1987;165:165-9. 10.1148/radiology.165.1.3628764 [DOI] [PubMed] [Google Scholar]
- 174.Cross JJ, Antoun NM, Laing RJ, Xuereb J. Imaging of compressive vertebral haemangiomas. Eur Radiol 2000;10:997-1002. 10.1007/s003300051051 [DOI] [PubMed] [Google Scholar]
- 175.Rimondi E, Rossi G, Bartalena T, Ciminari R, Alberghini M, Ruggieri P, Errani C, Angelini A, Calabrò T, Abati CN, Balladelli A, Tranfaglia C, Mavrogenis AF, Vanel D, Mercuri M. Percutaneous CT-guided biopsy of the musculoskeletal system: results of 2027 cases. Eur J Radiol 2011;77:34-42. 10.1016/j.ejrad.2010.06.055 [DOI] [PubMed] [Google Scholar]
- 176.Garcia DAL, Aivazoglou LU, Garcia LAL, Ferreira FBMD, França SM, Guimarães JB, Fernandes ADRC. Diagnostic Imaging of Primary Bone Tumors of the Spine. Curr Radiol Rep 2017;5:1-13. 10.1007/s40134-017-0220-1 [DOI] [Google Scholar]
- 177.Orguc S, Arkun R. Primary tumors of the spine. Semin Musculoskelet Radiol 2014;18:280-99. 10.1055/s-0034-1375570 [DOI] [PubMed] [Google Scholar]
- 178.Greenspan A, Steiner G, Knutzon R. Bone island (enostosis): clinical significance and radiologic and pathologic correlations. Skeletal Radiol 1991;20:85-90. 10.1007/BF00193816 [DOI] [PubMed] [Google Scholar]
- 179.Murphey MD, Choi JJ, Kransdorf MJ, Flemming DJ, Gannon FH. Imaging of osteochondroma: variants and complications with radiologic-pathologic correlation. Radiographics 2000;20:1407-34. 10.1148/radiographics.20.5.g00se171407 [DOI] [PubMed] [Google Scholar]
- 180.Usher I, Flanagan AM, Choi D. Systematic Review of Clinical, Radiologic, and Histologic Features of Benign Notochordal Cell Tumors: Implications for Patient Management. World Neurosurg 2019;130:13-23. 10.1016/j.wneu.2019.06.009 [DOI] [PubMed] [Google Scholar]
- 181.Hwang S, Panicek DM. Magnetic resonance imaging of bone marrow in oncology, Part 2. Skeletal Radiol 2007;36:1017-27. 10.1007/s00256-007-0308-4 [DOI] [PubMed] [Google Scholar]
- 182.Ruiz Santiago F, Láinez Ramos-Bossini AJ, Wáng YXJ, López Zúñiga D. The role of radiography in the study of spinal disorders. Quant Imaging Med Surg 2020;10:2322-55. 10.21037/qims-20-1014 [DOI] [PMC free article] [PubMed] [Google Scholar]
- 183.Dutoit JC, Verstraete KL. MRI in multiple myeloma: a pictorial review of diagnostic and post-treatment findings. Insights Imaging 2016;7:553-69. 10.1007/s13244-016-0492-7 [DOI] [PMC free article] [PubMed] [Google Scholar]
- 184.Nguyen JC, Davis KW, Arkader A, Guariento A, Sze A, Hong S, Jaramillo D. Pre-treatment MRI of leukaemia and lymphoma in children: are there differences in marrow replacement patterns on T1-weighted images? Eur Radiol 2021;31:7992-8000. 10.1007/s00330-021-07814-z [DOI] [PubMed] [Google Scholar]


