Abstract
Background:
Prostate cancer is an important cause of death worldwide. The number of years of life lost (YLL) due to prostate cancer is a metric of the toll of prostate cancer and using projections of demographic changes, can be used to measure future burden.
Methods:
Prostate cancer mortality data by country and world region was retrieved from the Global Cancer Observatory and the World Health Organization mortality dataset, and life expectancy was from the United Nations Department of Economic and Social Affairs. We estimated YLL as the difference between age at death in people with prostate cancer and remaining life expectancy for people of the same age in the general population. We also estimated the age-standardized YLL rates per 100 000 males over 50 and the average annual percentage change in YLL rates over the period 2000–2019 and the number of YLL for the year 2040 by applying population projections to the 2020 YLL rates.
Results:
In 2020, 3.5 million person-years of life were lost due to prostate cancer in males over 50, and 40% of YLL were in those aged over 75. Age-standardised rates varied greatly between and within regions. Over the last two decades, rates of YLL have increased in many Asian and African countries while they have decreased in northern American and European countries. Globally, YLL are anticipated to double by 2040 to reach 7.5 million, with the greatest increases in Africa, Asia, and Latin America and the Caribbean.
Conclusion:
There are wide variations in the burden of prostate cancer globally as measured by YLL. The burden of prostate cancer is projected to increase over time and appears to be highest in Sub-Saharan Africa, Eastern Europe, and Latin America and the Caribbean. It will be critical to plan and implement programs to reduce the burden of prostate cancer globally.
Keywords: years of life lost, mortality, epidemiology, prostate cancer
Introduction
Prostate cancer is the second most common cancer worldwide and the fifth leading cause of cancer mortality among men.1 In 2020, there were an estimated 1.4 million cases of prostate cancer diagnosed, accounting for 14% of cancers among men, and an estimated 375,000 men died from prostate cancer.2 By 2040, demographic changes will lead to a near doubling of prostate cancer cases and deaths worldwide.3
Prostate cancer incidence and mortality rates vary substantially around the world4. The lowest incidence and mortality rates are in Asia whereas the highest incidence rates are found in Northern and Western Europe, the Caribbean, Australia, New Zealand, and North America. The highest mortality rates are seen in the Caribbean, sub-Saharan Africa and Micronesia/Polynesia4. The reasons for these differences are complex and include differences in underlying risk, access to diagnosis and treatment. Routine testing for Prostate Specific Antigen (PSA) as a screening tool has been shown to be associated with increased incidence at the population level,4 however, the evidence of benefit of PSA testing for reducing mortality is equivocal5,6 and may vary with race, family history of cancer, and life expectancy.
Incidence and mortality are the most common metrics for measuring cancer burden. Typically expressed as age-standardised rates, these indicators make comparisons of the frequency of diagnosis and death between populations easier. Years of life lost (YLL) is another metric, typically expressed as a count, which can communicate the human toll of a given cause of death.7,8 The YLL metric is useful to quantify the extent to which prostate cancer shortens life, and it can be interpreted in terms of social and economic impact. As such, YLL is a powerful complement to incidence and mortality for health policy and planning globally.
To our knowledge, this is the first study to measure YLL due to prostate cancer at the national, regional, and global levels for the years 2020 and, using changes in demographic patterns, to project these to 2040. We also examined the trends in rates of YLL in males over 50 in 54 selected countries over the period 2000–2019.
Methods
For the year 2020, we obtained the estimated number of deaths due to prostate cancer by 5-year age bands from the Global Cancer Observatory (GCO; www.gco.iarc.fr/today) for 213 geographical areas including 185 countries/territories. The GCO uses projections and modeling to estimate 2020 deaths, the methods for which have previously been described.9
Country, region and global life expectancy estimates at five-year intervals (50, 55, 60…95) and five-year calendar bands spanning 2000 to 2040 were obtained from the United Nations Department of Economic and Social Affairs (UN-DESA - https://population.un.org/wpp/Download/Standard/Mortality/). As remaining life expectancy was available at five-year intervals (x=50, 55, 60…95), we interpolated remaining life expectancy for individual ages within each interval and applied the mean remaining life expectancy to each age group. Life expectancy estimates are available for 255 geographical areas, including 201 countries/territories. Both the number of prostate cancer deaths and life expectancy were available for 193 geographical areas including 184 countries/territories, which cover 73% of the global population aged 50 and over.
For the trends’ analyses, we gathered the historical annual number of deaths from prostate cancer by 5-year age band from the WHO mortality dataset (https://www.who.int/data/data-collection-tools/who-mortality-database), which includes national mortality data for 136 countries/territories. Eighty-nine countries had data on deaths from prostate cancer available for at least 15 years between 2000 and 2019. From those, we excluded 4 countries that had 2 consecutive years with missing information, 26 countries with less than 100 annual deaths from prostate cancer on average in adults aged 50 years or older, and another 5 countries without life expectancy estimates, leaving 54 countries for analysis (see list of countries in Supplementary Table 1).
We estimated the total YLL due to prostate cancer in males over 50 for the year 2020 at national, regional, and global levels. YLL is defined as the difference between age at death in people with prostate cancer and remaining life expectancy for people of the same age in the general population as shown in the below formula.8
Using previously described methods, we calculated the age-standardised rate of YLL to compare the toll of prostate cancer death across populations by controlling for differences in the age distribution across regions10. Rates were expressed per 100,000 men and age-standardized using the WHO 2000–2025 World Standard Population (https://www.who.int/healthinfo/paper31.pdf). YLL per death was calculated by dividing the total YLL by the total number of deaths in each region and/or age group. Results for the year 2020 are presented overall and stratified by age at death (50–64, 65–74 and 75 years or older).
We plotted trends in the rates of YLL by year and age group (50–64, 65–74 and 75 years or older), smoothed using loess regression. We also estimated the average annual percentage change (AAPC) in YLL rates, and its 95% confidence interval (95%CI) using age-adjusted quasi-Poisson regression models with a linear effect for year of death and an interaction term between year and age group to obtain AAPC for each age group. Quasi-Poisson models were used instead of Poisson models to account for over dispersion. Trends were considered significant if the 95% confidence interval around the AAPC did not include the value 0.
We predicted the number of YLL for the year 2040 for all world regions by applying the 5-year age-specific mortality rates in 2020 to the corresponding national population projections in 2040 obtained from the United Nations Population Division. We also obtained life expectancies by 5-year age group projected for the period 2035–2040 from the UN-DESA. In our projections, we considered only the effect of aging and population growth and assumed no change in the risk pattern of prostate cancer mortality between 2020 and 2040.
We performed data management and data analysis using R statistical software (version 3.4.0; R Development Core Team, 2017) and Stata (Stata/MP 16.1 for Windows, 2021).
The data that support the findings of this study are openly available at the links provided above. Data sets and codes used for the analysis will be made available upon request.
No ethical approval was required as no individually identifiable data were used.
Results
YLL in 2020, globally, regionally and nationally
Across 184 countries, an estimated 372,490 deaths due to prostate cancer occurred in 2020, amounting to nearly 3.5 million person-years of life lost in men aged 50 years or older (Table 1). Europe accounts for 29% of the global YLL due to prostate cancer, while holding just 15% of the global population of men aged 50 and older. By contrast, Asia accounts for 31% of global YLL and holds 63% of the global population of men aged 50 and older.
Table 1.
Life expectancy at age 50, number of deaths due to prostate cancer, number of years of life lost and rate (YLL per 100,000) by region. (Include countries in the appendix)
| Remaining life expectancy* | Deaths due to prostate cancer | Population (millions) | % of global population | PYLL | % of global PYLL | PYLL/100,000** | PYLL/death | |
|---|---|---|---|---|---|---|---|---|
| Aged 50+ | ||||||||
| WORLD | 25.4 | 372,490 | 898.8 | 100 | 3,469,605 | 100 | 367 | 9.3 |
| Africa | 21.7 | 46,682 | 70.8 | 8 | 435,409 | 13 | 686 | 9.3 |
| Asia | 25.0 | 119,080 | 556.5 | 62 | 1,071,416 | 31 | 195 | 9.0 |
| Europe | 26.6 | 107,805 | 132.2 | 15 | 1,002,716 | 29 | 597 | 9.3 |
| Latin America and the Caribbean | 26.5 | 57,062 | 70.6 | 8 | 562,186 | 16 | 735 | 9.9 |
| Northern America | 28.6 | 37,104 | 62.8 | 7 | 384,483 | 11 | 489 | 10.4 |
| Oceania | 29.6 | 4,757 | 5.9 | 1 | 44,928 | 1 | 595 | 9.4 |
| Between ages 50 and 64 | ||||||||
| WORLD | 25.4 | 39,293 | 572.0 | 100 | 762,149 | 100 | 139 | 19.4 |
| Africa | 21.7 | 9,503 | 49.8 | 9 | 157,192 | 21 | 338 | 16.5 |
| Asia | 25.0 | 11,944 | 365.7 | 64 | 225,978 | 30 | 66 | 18.9 |
| Europe | 26.6 | 8,723 | 73.4 | 13 | 177,525 | 23 | 235 | 20.4 |
| Latin America and the Caribbean | 26.5 | 5,301 | 44.9 | 8 | 108,556 | 14 | 251 | 20.5 |
| Northern America | 28.6 | 3,503 | 35.0 | 6 | 78,148 | 10 | 212 | 22.3 |
| Oceania | 29.6 | 319 | 3.3 | 1 | 7,316 | 1 | 219 | 22.9 |
| Between ages 65 and 74 | ||||||||
| WORLD | 14.3 | 102,521 | 216.1 | 100 | 1,289,444 | 100 | 596 | 12.6 |
| Africa | 11.6 | 17,298 | 15.3 | 7 | 175,327 | 14 | 1,151 | 10.1 |
| Asia | 13.7 | 34,496 | 131.3 | 61 | 414,039 | 32 | 317 | 12.0 |
| Europe | 15.6 | 26,304 | 34.6 | 16 | 361,160 | 28 | 1,026 | 13.7 |
| Latin America and the Caribbean | 15.4 | 14,431 | 16.4 | 8 | 196,508 | 15 | 1,189 | 13.6 |
| Northern America | 17.0 | 9,031 | 17.0 | 8 | 135,800 | 11 | 786 | 15.0 |
| Oceania | 17.4 | 961 | 1.5 | 1 | 14,560 | 1 | 928 | 15.2 |
| Aged 75+ | ||||||||
| WORLD | 8.7 | 230,676 | 110.7 | 100 | 1,418,012 | 100 | 1,281 | 6.1 |
| Africa | 6.7 | 19,881 | 5.8 | 5 | 102,890 | 7 | 1,779 | 5.2 |
| Asia | 8.2 | 72,640 | 59.6 | 54 | 431,400 | 30 | 726 | 5.9 |
| Europe | 9.6 | 72,778 | 24.2 | 22 | 464,031 | 33 | 1,881 | 6.4 |
| Latin America and the Caribbean | 9.7 | 37,330 | 9.3 | 8 | 257,122 | 18 | 2,744 | 6.9 |
| Northern America | 10.5 | 24,570 | 10.8 | 10 | 170,535 | 12 | 1,548 | 6.9 |
| Oceania | 10.5 | 3,477 | 1.0 | 1 | 23,051 | 2 | 2,211 | 6.6 |
At beginning of age range
PYLL per 100,000 age-standardized to the World Standard Population.
The overall age-standardized rate of YLL was 367 per 100,000 men aged 50 and older, spanning from 195 per 100,000 in Asia to 735 per 100,000 in Latin America and the Caribbean (Table 1). The variation in the rate of YLL within regions is evident in Figure 1. Country-specific YLL are provided in Supplementary Table 2. The rates of YLL in sub-Saharan Africa are among the highest globally (e.g., 1022 per 100,000 in Namibia) whereas the rates in Northern Africa are among the lowest (e.g., 188 per 100,000 in Egypt).
Figure 1.
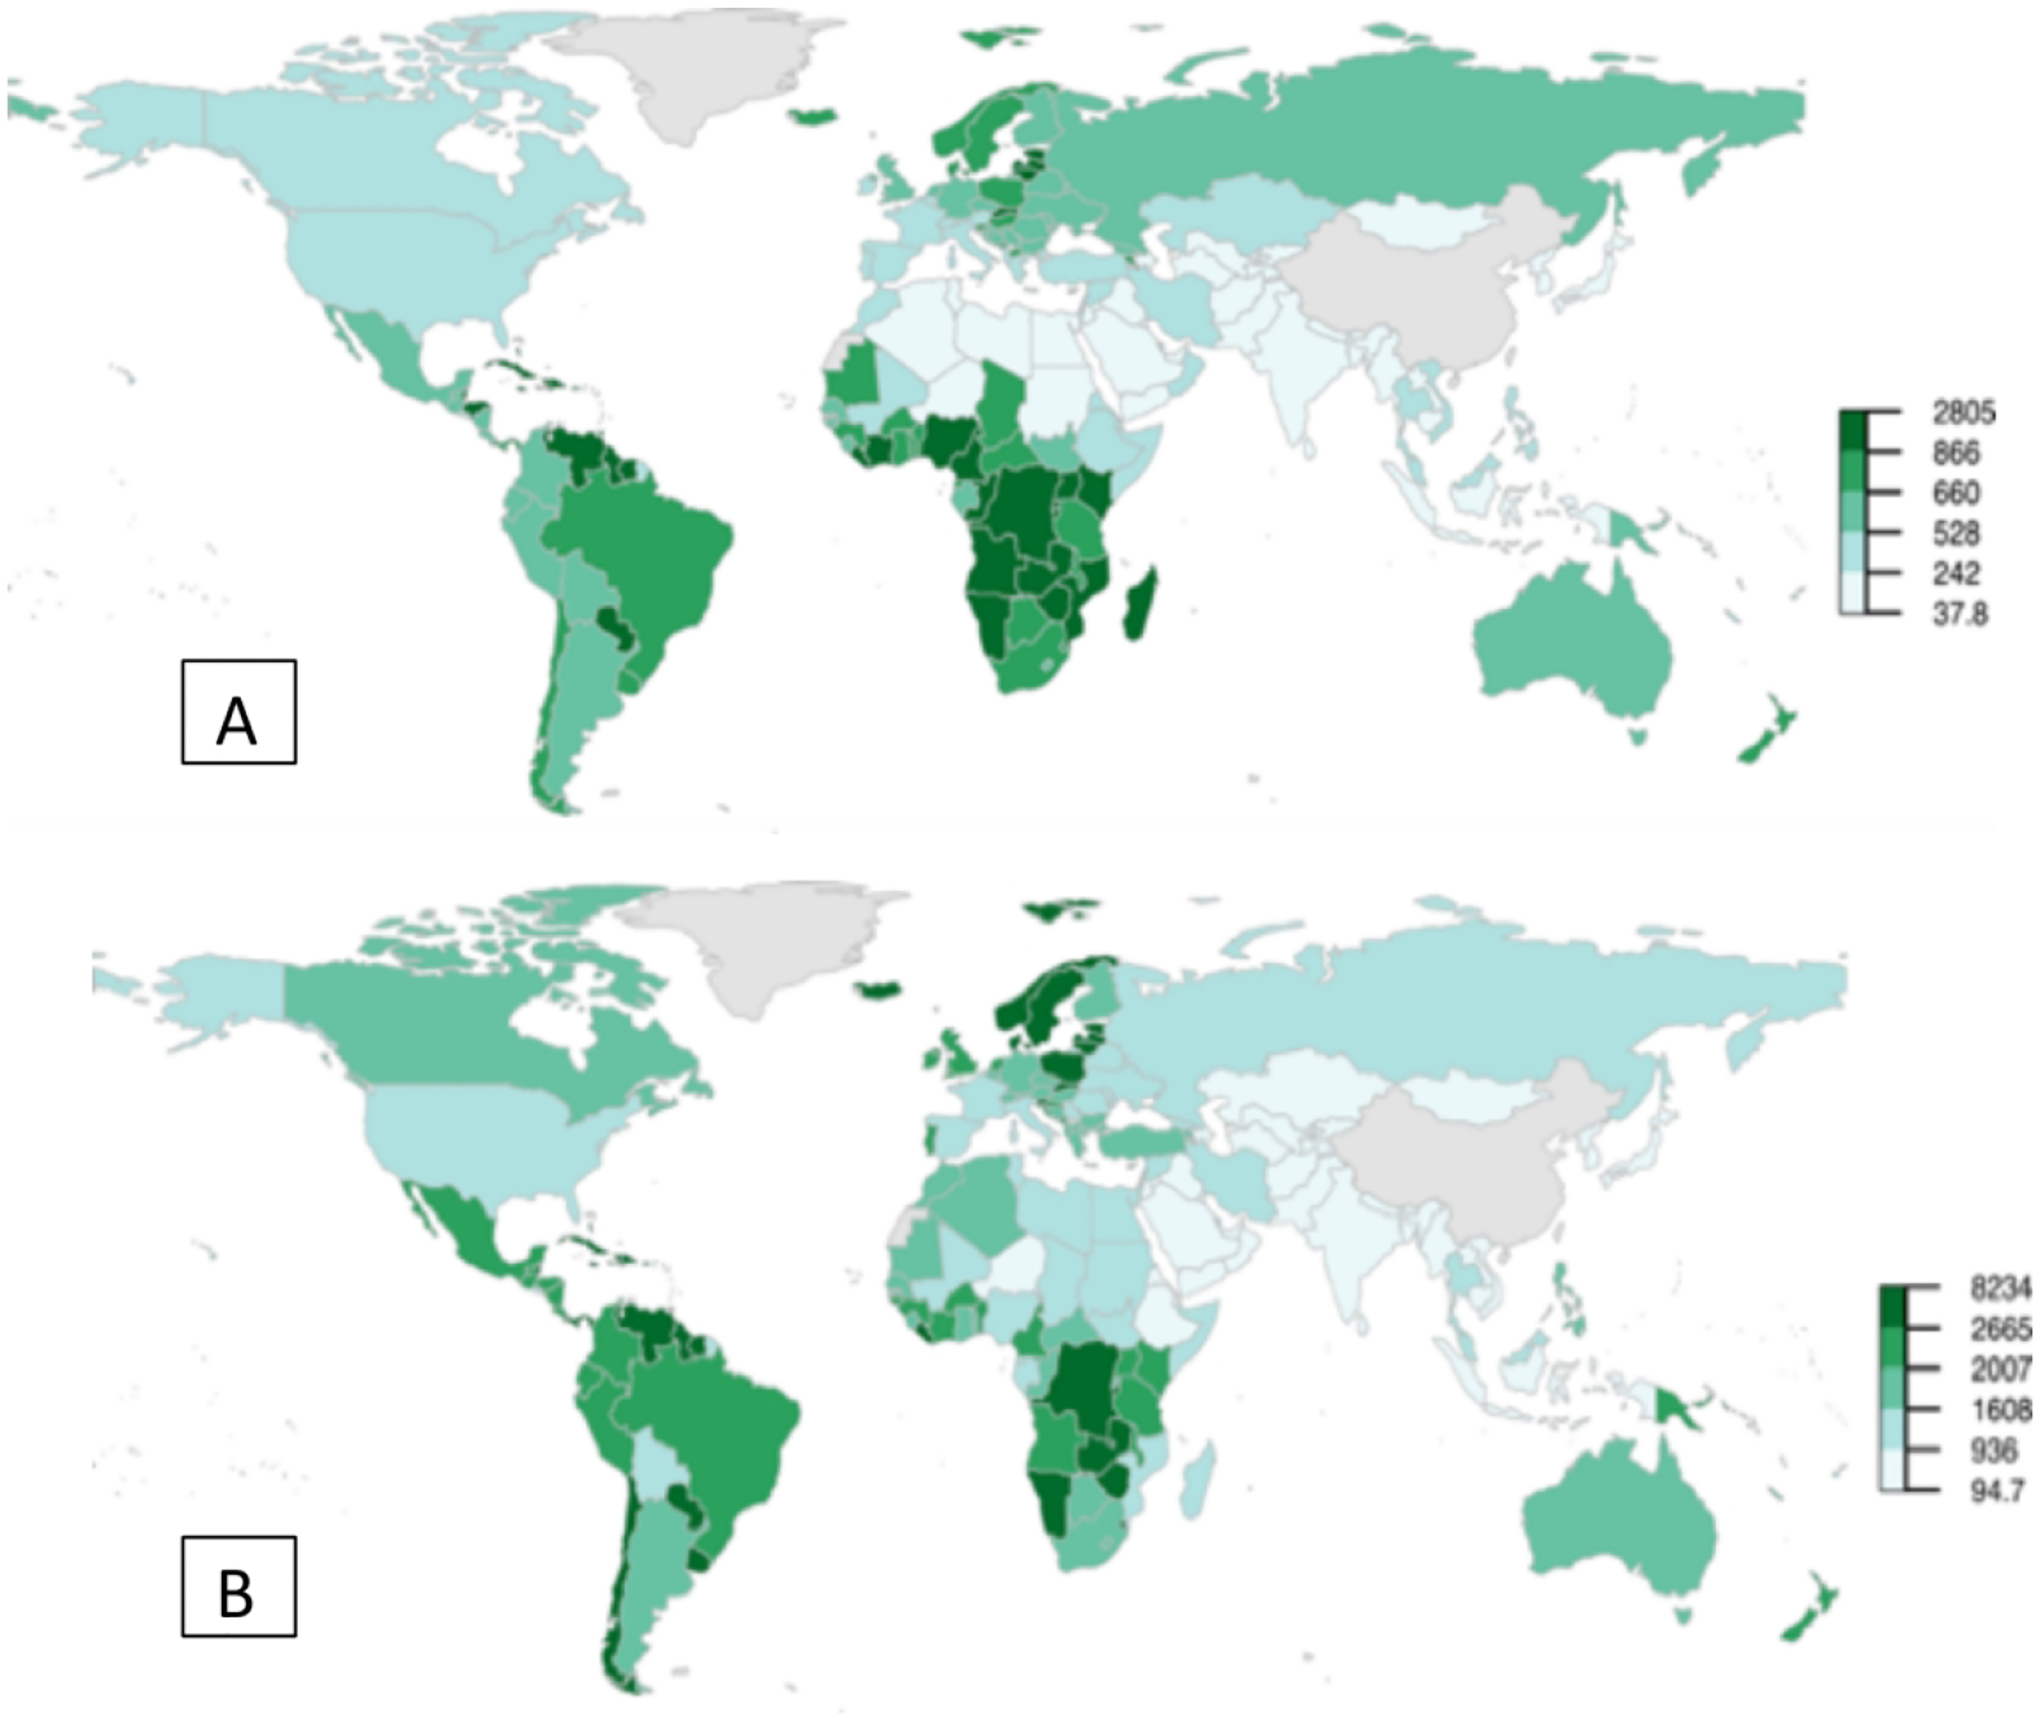
Age-standardized rate of PYLL per 100,000 by country, for the year 2020 among men (A) aged 50 and older and (B) aged 75 and older.
When stratified by age group at death, the highest rates of YLL among men aged 50 to 64 occurred in Africa (338/100,000 person-years) whereas the highest rates among those aged 65 to 74 and 75 and older were in Latin America and the Caribbean (1189 and 2744 per 100,000 respectively, Table 1). Asia consistently had the lowest rates of YLL across all age groups (from 66/100,000 in men aged 50–64 and 726/100,000 in men aged 75+).
Trends in YLL in selected countries
Overall, trends in YLL rates vary greatly across countries. Egypt, Morocco, Malaysia, and Thailand have relatively low YLL with upward trends (Figure 2). The sharpest increase in YLL rates was observed in Thailand (AAPC = 5.8% [95%CI: 4.9 to 6.7] in the 50–64 age group, 6.6% [5.7 to 7.6] in the 65–74 age group, and 7.0% [6.2 to 7.7] in the 75+ age group, Figure 3). In contrast, Israel, Canada, United States of America, Australia, New Zealand, France, Switzerland, and United Kingdom have relatively high YLL with downward trends (Figures 3 & 4). The greatest decrease in YLL rates was seen in Norway for the 50–64 age group (−3.8% [−4.8 to −2.8]), and the 65–74 age group (−3.2% [−4.0 to −2.5], Figure 4).
Figure 2.
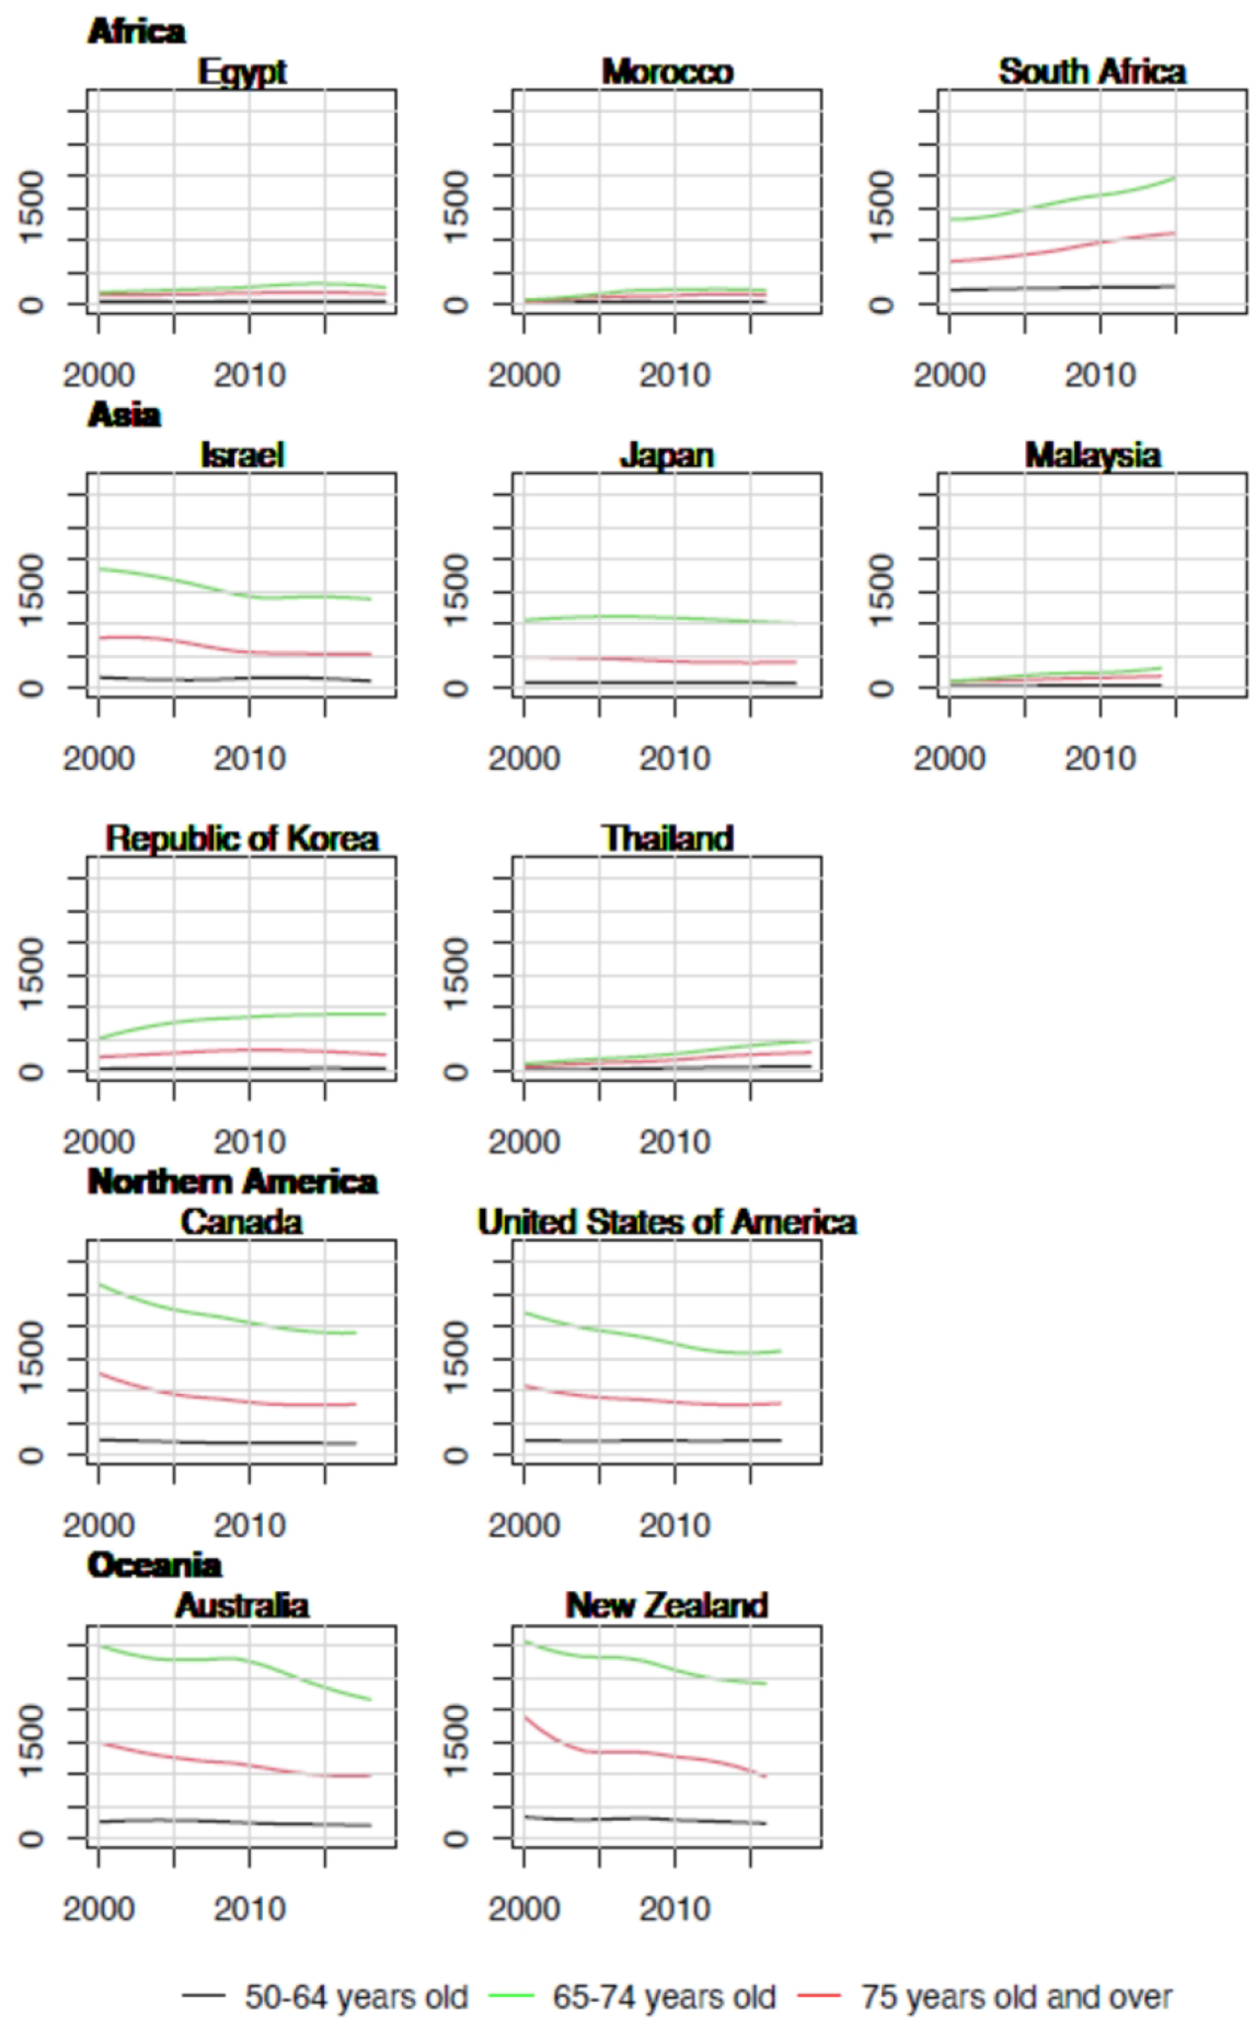
Trends in years of life lost per 100,000 by age group in selected countries in Africa, Asia, North America and Oceania, 2000–2019.
Figure 3.
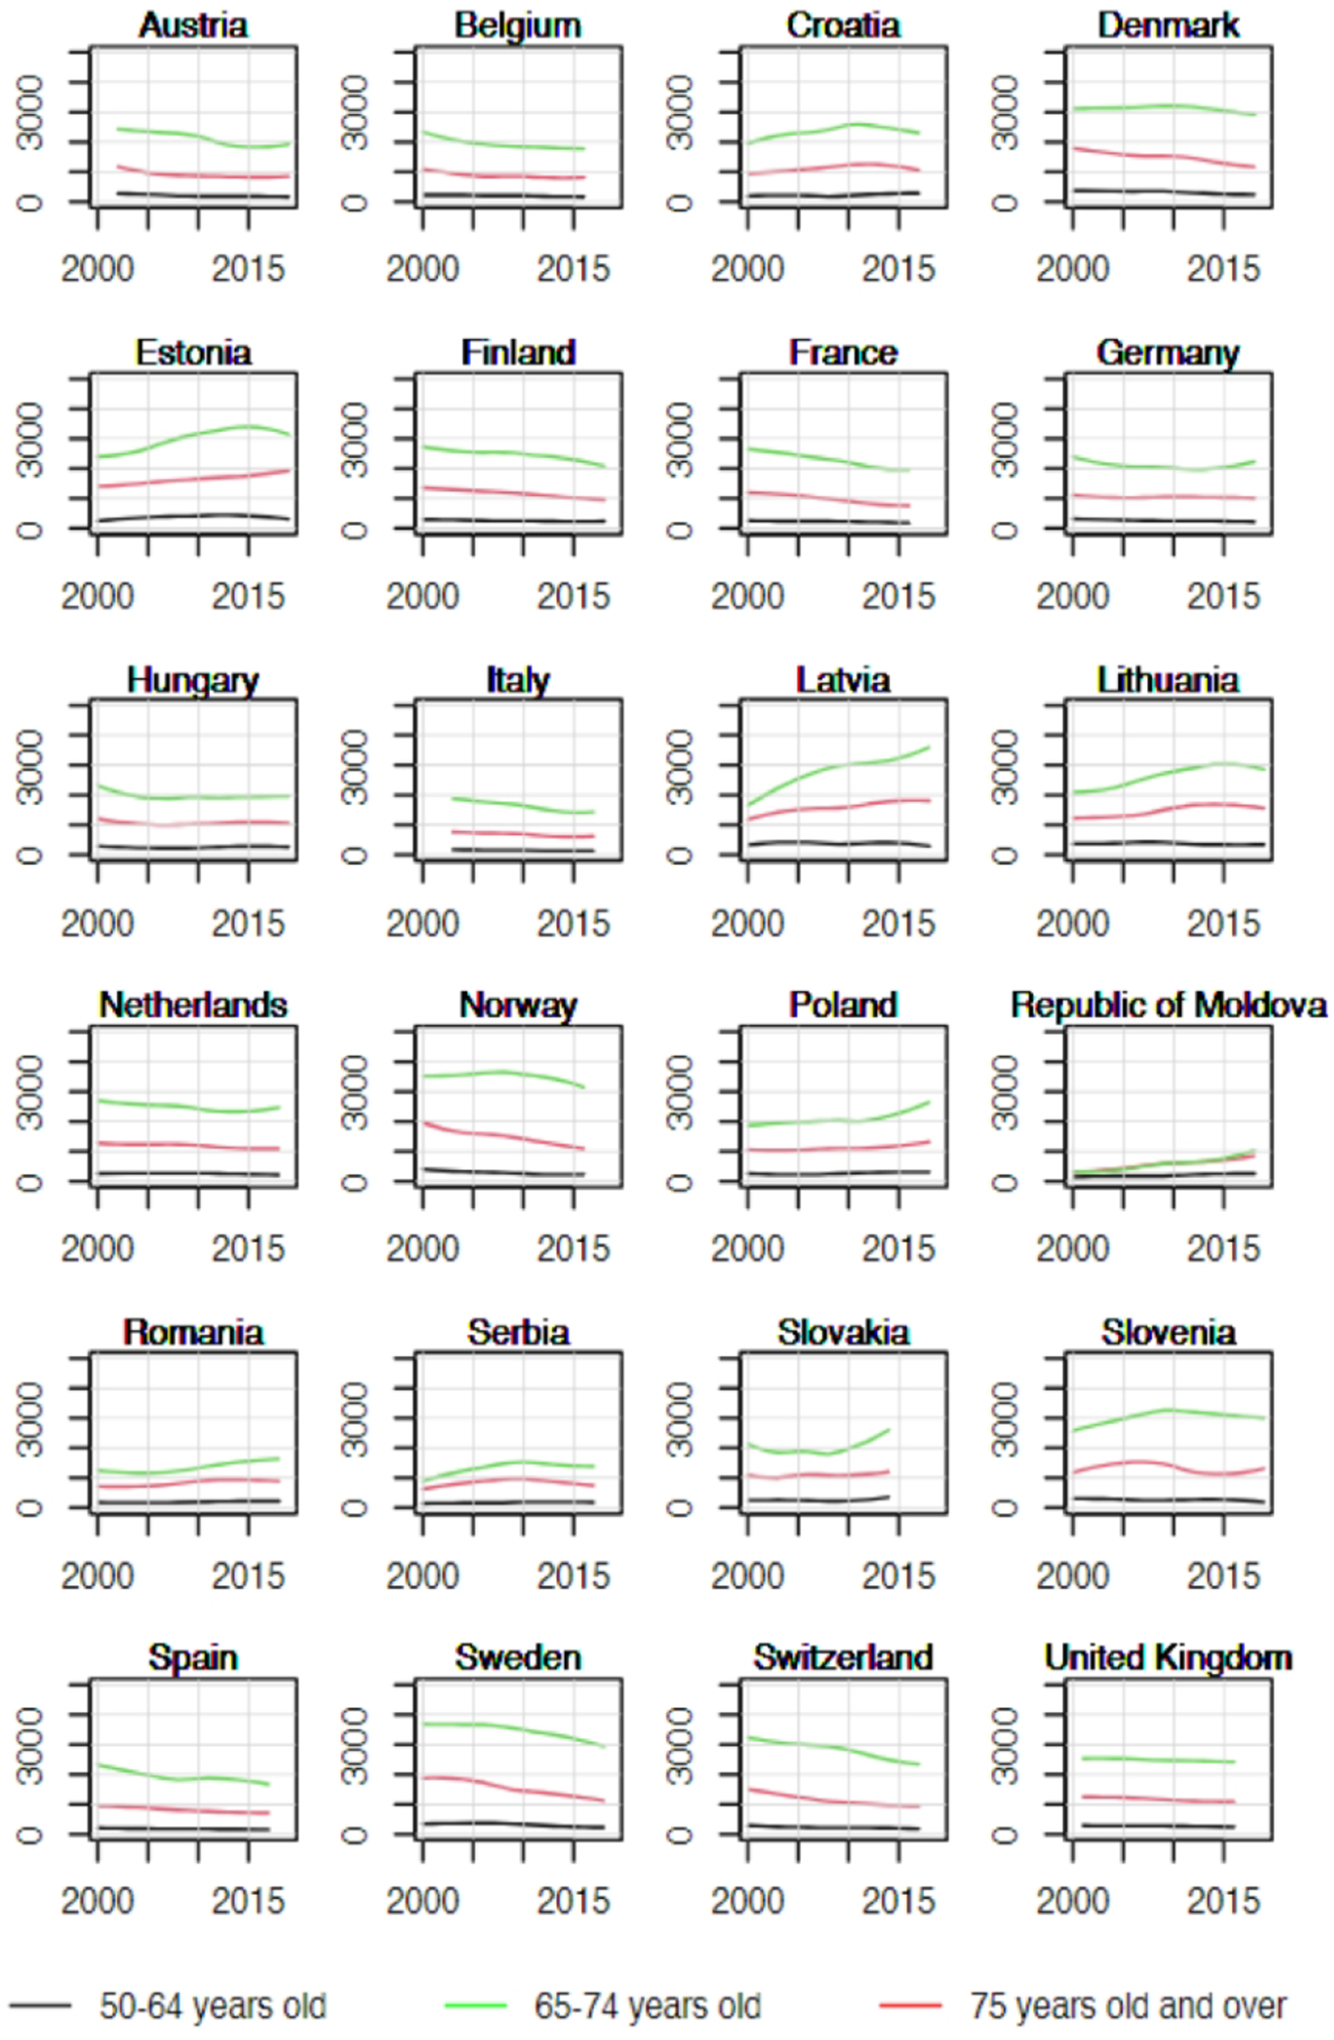
Trends in years of life lost per 100,000 by age group in selected countries in Europe, 2000–2019.
Figure 4.
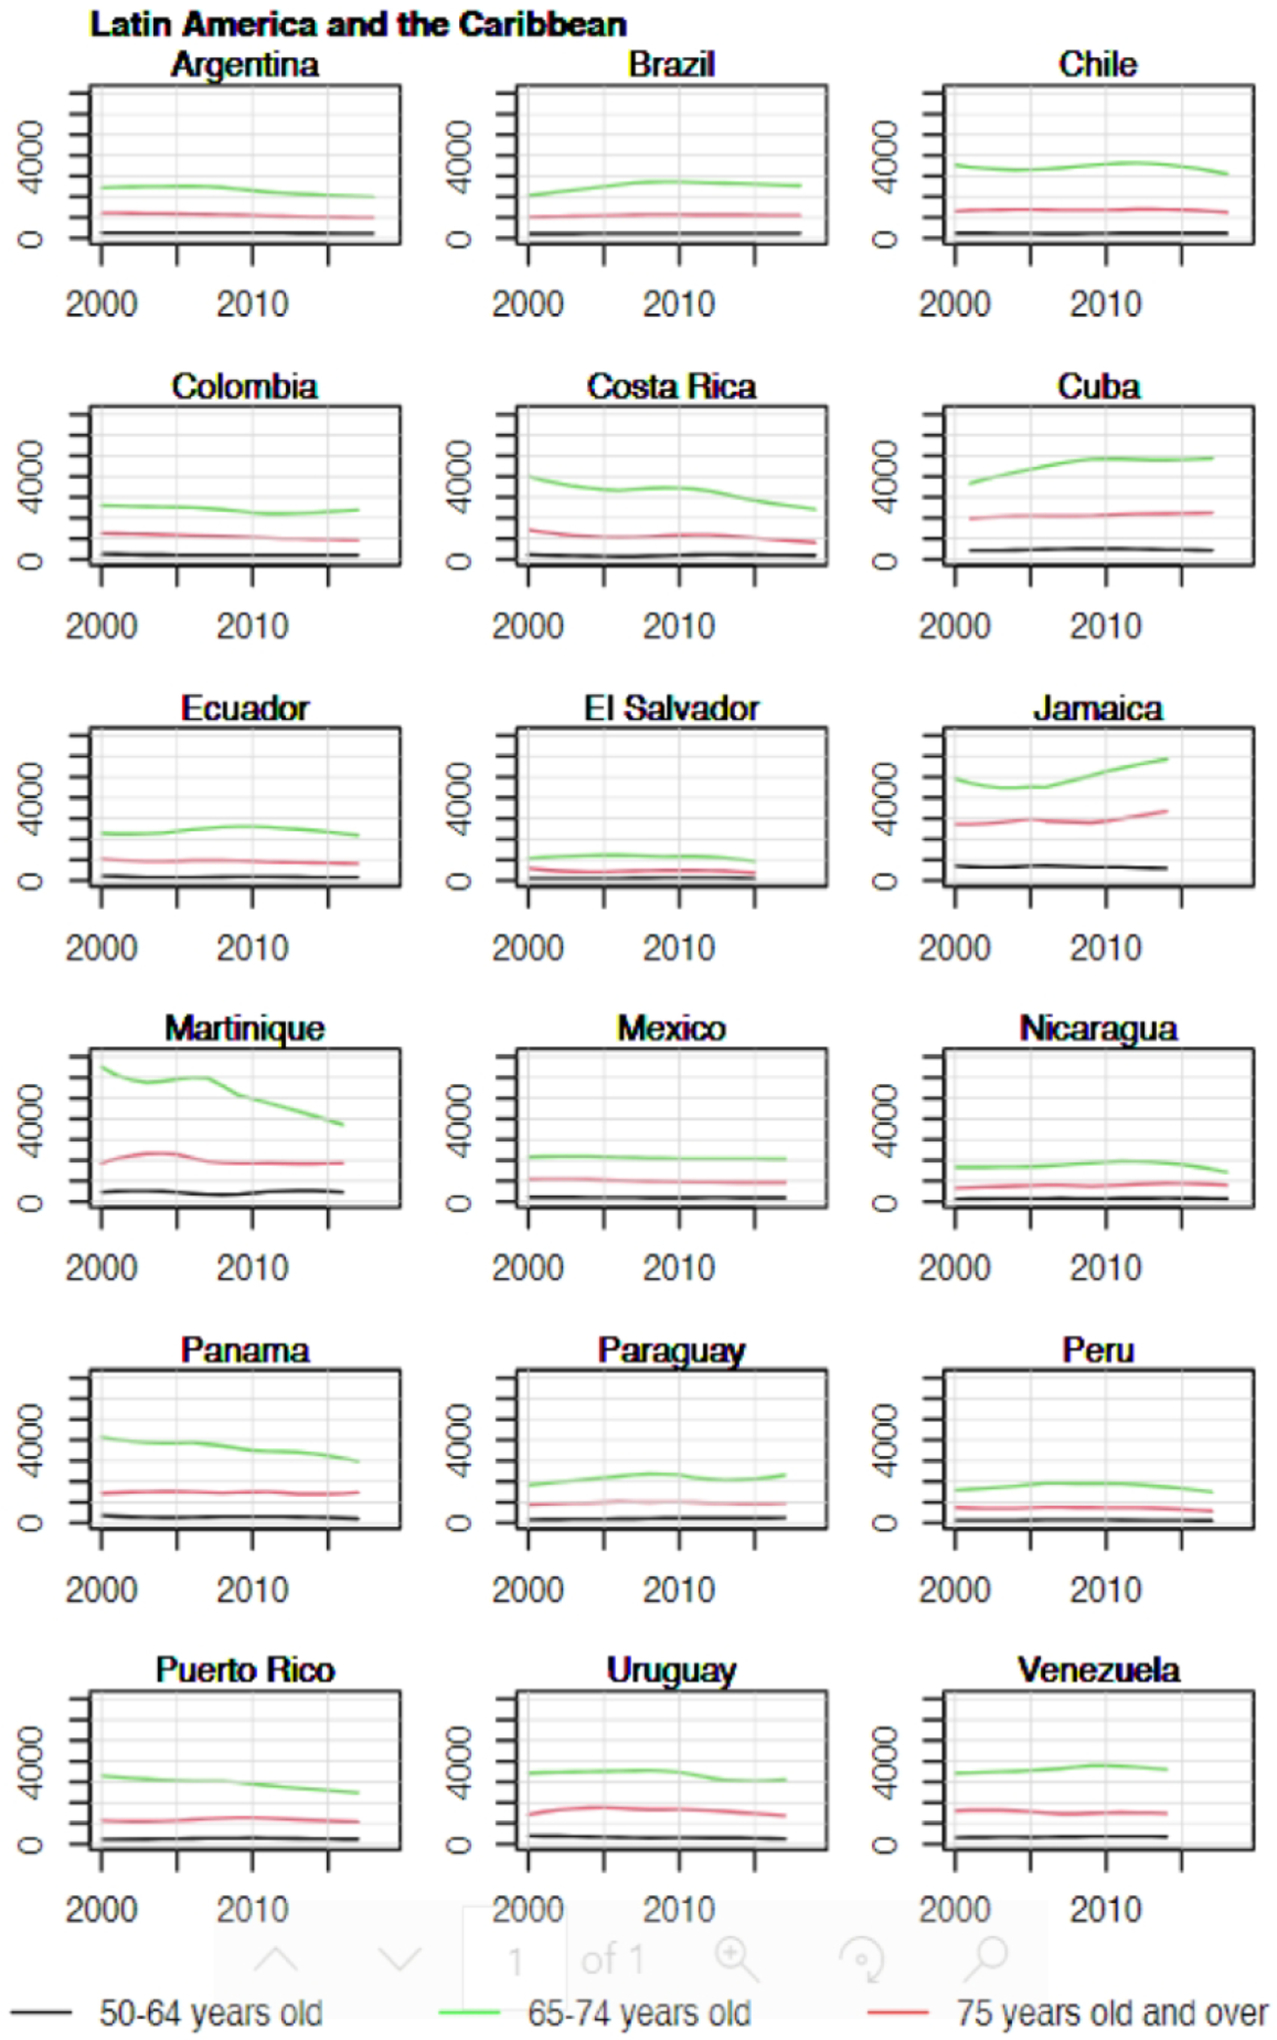
Trends in years of life lost per 100,000 by age group in selected countries in Latin America and the Caribbean, 2000–2019.
Since 2000, YLL rates are increasing in all age groups in all African countries, and most eastern European countries. In contrast, rates are declining at a rate of about 1.5–2% annually across all age groups in most other European countries, in North America and Oceania (Figure 5).
Figure 5.
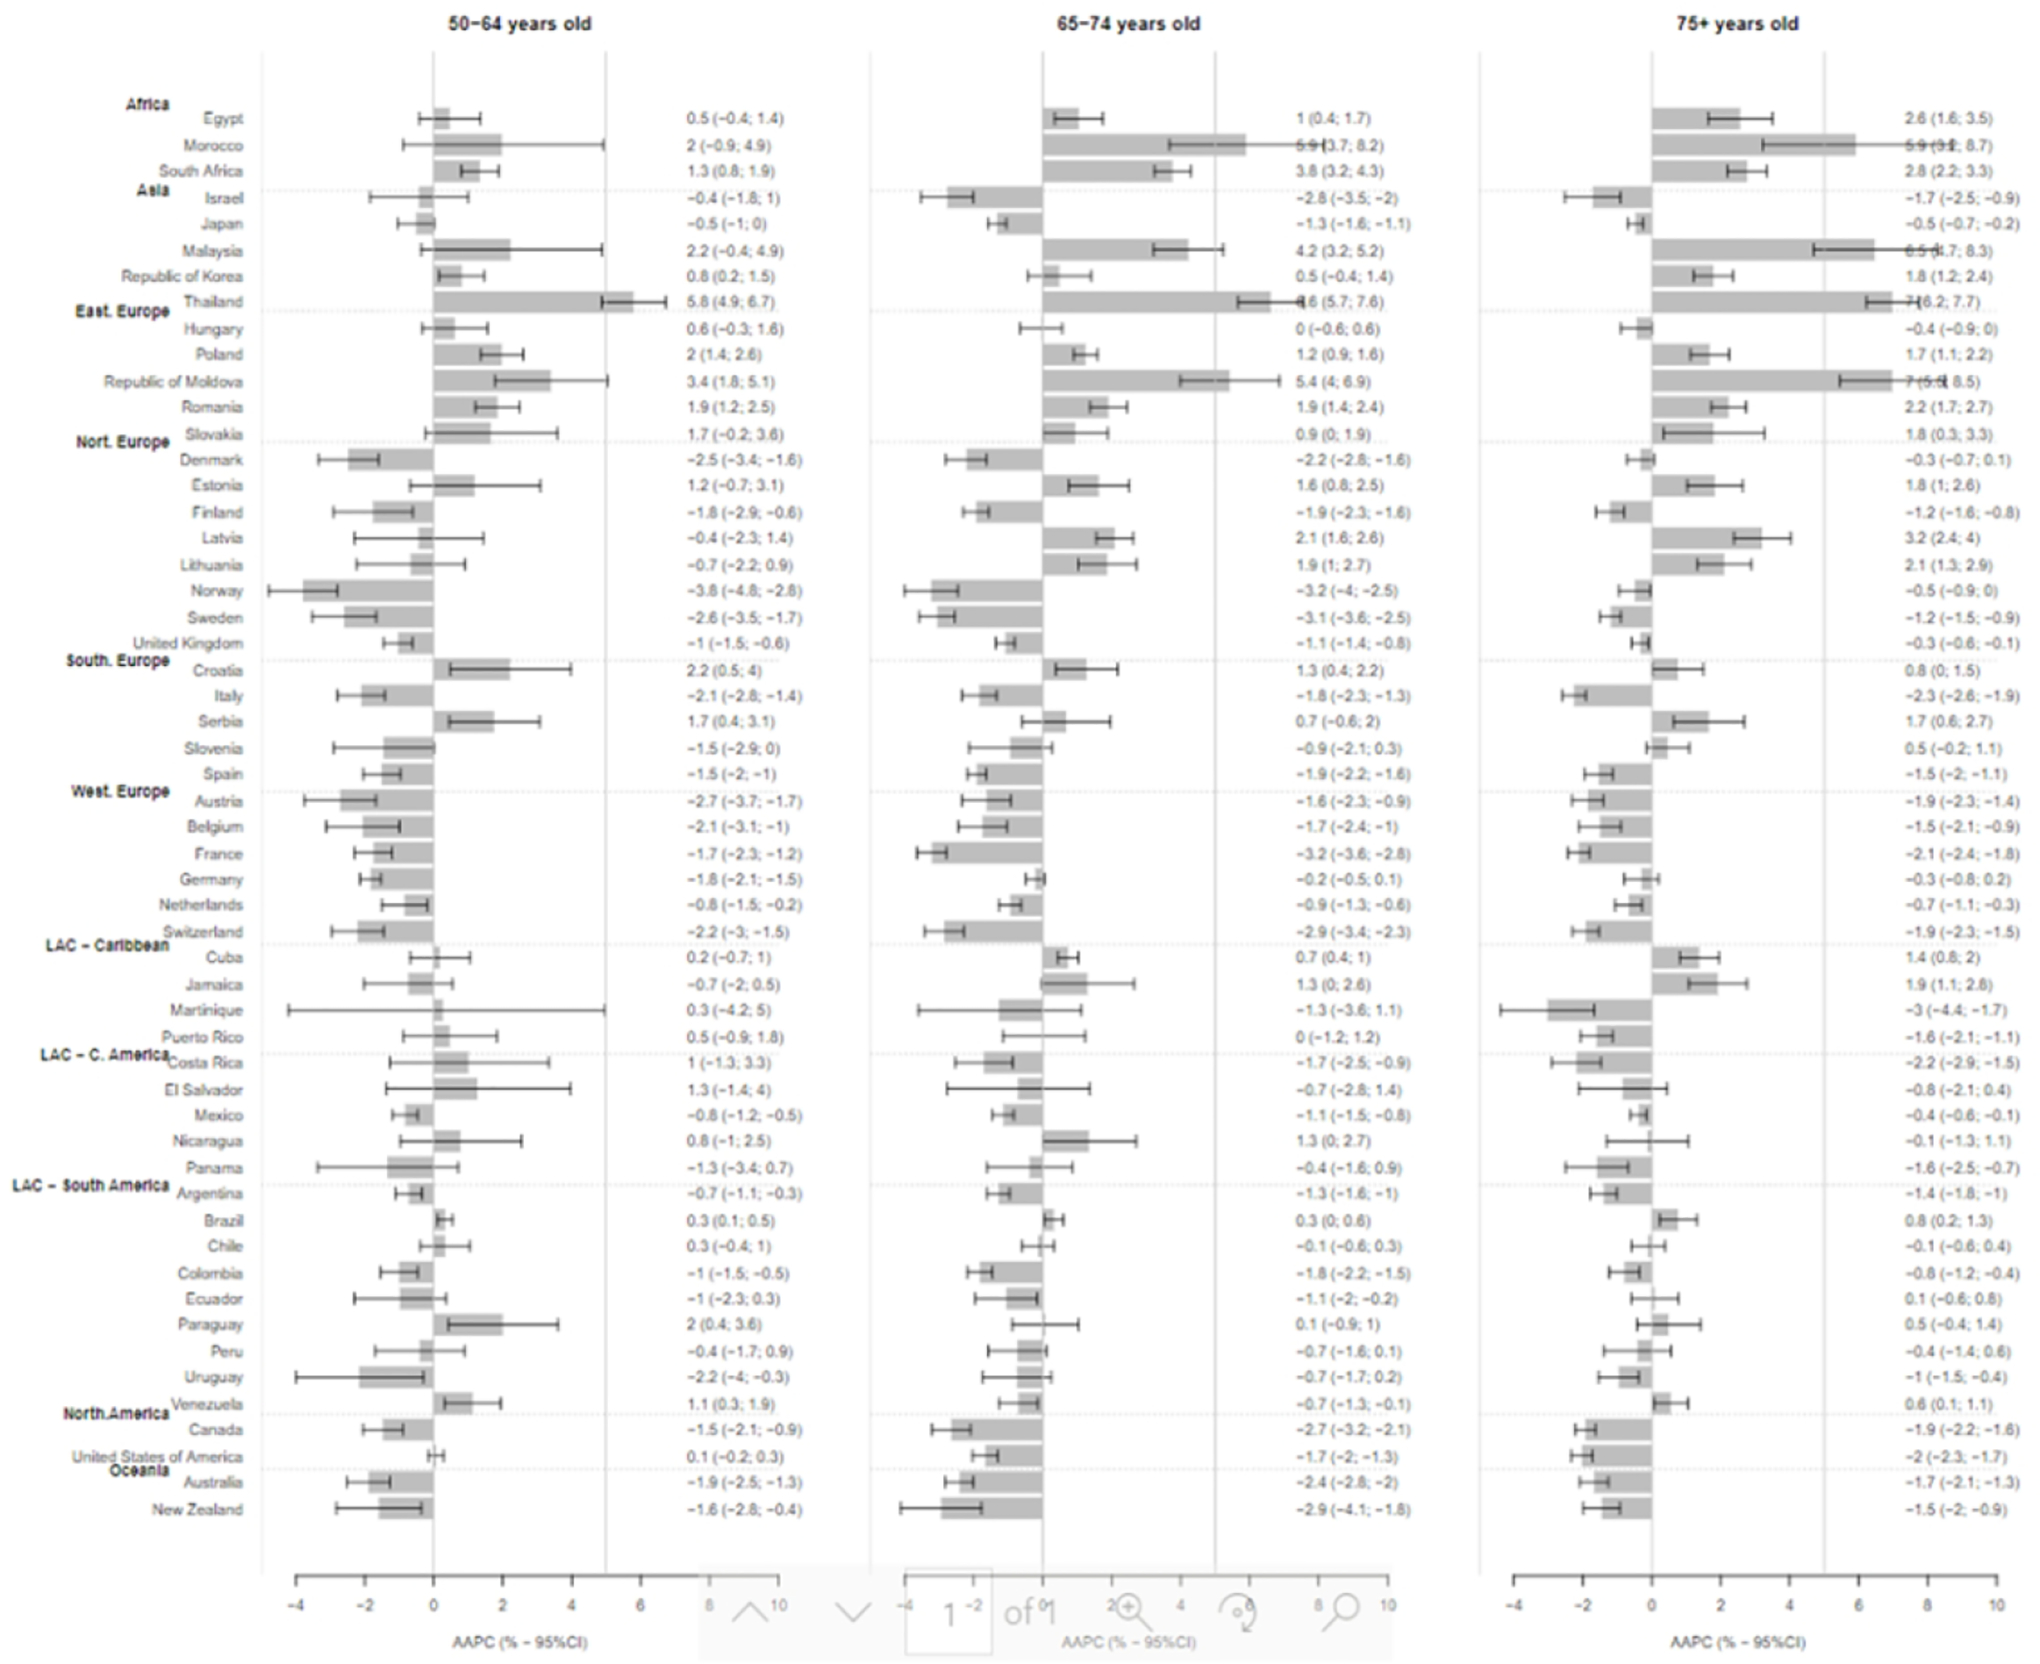
Average Annual Percent Change (AAPC) and 95% Confidence interval in the rate of person-years of life lost to prostate cancer in selected countries globally, by age group.
YLL in 2040
YLL are anticipated to increase more than twofold from 3.5 million in 2020 to 7.5 million in the 184 countries included in 2040 (Table 2). Increases are projected to be greatest in Africa (0.4 million to 1.1 million), Asia (1.1 million to 2.5 million), and Latin America and the Caribbean (0.6 million to 1.3 million).
Table 2.
Projected prostate cancer deaths and YLL as a result of population ageing and changing life expectancy.
| Number of deaths due to prostate cancer | YLL | |||
|---|---|---|---|---|
| WORLD | 372,490 | 670,559 | 3,469,605 | 7,524,250 |
| Africa | 46,682 | 96,965 | 435,409 | 1,074,693 |
| Asia | 119,080 | 237,159 | 1,071,416 | 2,537,690 |
| Europe | 107,805 | 143,719 | 1,002,716 | 1,682,816 |
| Latin America and the Caribbean | 57,062 | 107,759 | 562,186 | 1,297,468 |
| Northern America | 37,104 | 57,765 | 384,483 | 717,616 |
| Oceania | 4,757 | 7,700 | 44,928 | 90,075 |
Discussion
This is the first study describing global variations and trends in the YLL due to prostate cancer in different age groups. We estimated that 3.5 million years of life could be lost due to prostate cancer in males aged 50 years or older in 2020 and projected YLL could reach 7.5 million in 2040. Men aged over 75 account for a large share of the YLL (40%) despite occupying a relatively small proportion of the men aged 50 and over (12%). Nevertheless, 60% of the YLL were lost among people aged between 50 and 75. These results emphasize that prostate cancer affects men across a broad age range and is a major burden across the globe.
The significant variation in burden as measured by YLL across the globe and temporally may be driven by differences in life expectancy, population age structure, and true underlying risk of prostate cancer, prognosis, and quality of cause of death registration.
International and temporal variations in rates of YLL can arise in part due to differences in life expectancy across countries and over time. Changes in YLL between 2020 and 2040 will be influenced by the pace of population growth and aging. For instance, Latin America and the Caribbean is experiencing a rapid aging of its population that is accompanied by a rapid increase in number of cancers diagnosed in older people,11 and will inevitably lead to more YLL. Nevertheless, differences in life expectancy do not explain differences in YLL entirely. For example, the life expectancy in Sub-Saharan Africa is among the lowest but the YLL remains among the highest.
Prostate cancer risk is influenced by genetic susceptibility and prevalence of known and unknown risk factors. Genetic susceptibility may play a role in the lower incidence, mortality and YLL in Asia. For example, PTEN inactivation is very common among patients with prostate cancer and is reported in over two-thirds of persons with European ancestry, however less than one-third persons with Asian ancestry have a PTEN mutation.12,13 PTEN mutation is associated with higher invasive disease and metastasis therefore, having a higher mortality rate.12 Another potentially important mutation that impacts prostate cancer mortality is TMPRSS2-ERG fusion, which has been shown to be associated with advanced T-stage, metastasis and Gleason score in prostate cancer and to vary in prevalence by ancestry.14,15 With respect to risk factors, the lowest rates of YLL observed in Asia might be due, in part, to lower incidence rates of prostate cancer attributable to dietary and lifestyle factors. Red meat, eggs, and poultry have been identified as potential dietary risk factors for prostate cancer,16–18 whereas Asian populations tend to have higher consumption of vegetables and lower proportions of animal protein than their western counterparts.19 Obesity on the other hand has been associated with risk of of late stage prostate cancer and, through that, could yield higher mortality.20,21 In North America specifically in the United States the prevalence of obesity was 42.4% among all adults. A meta-analysis of studies across the globe found that obesity is associated with higher mortality among prostate cancer patients.22 Another meta-analysis observed that for every 5 kg/m2 the risk of prostate cancer specific mortality increased by 9% and overall mortality increased by 3%.23
Prognosis is influenced by tumor aggressiveness, access to early detection and diagnosis and effective treatment. For example, the decreasing number of YLL observed over the past decade in western Europe, North America and Oceania may be, in part, explained by improving survival because of early diagnosis and effective treatment and a resultant decrease in prostate cancer deaths4. However, in terms of early diagnosis, PSA testing will in large part identify disease at its early stage, which in higher income countries will have very good prognosis and as a result limited impact on mortality and YLL.
Within the African continent, we observed substantial differences in the rates of YLL, which are likely to reflect the combined effects of genetics (discussed above), survival, and differential data quality (discuss below). With respect to survival, a recent study reported insufficient staging and undertreatment as major factors for high mortality among a large proportion of prostate cancer patients in sub-Saharan Africa.24
Undiagnosed prostate cancers may cause death without being detected, leading to a misclassification of the cause of death and an underestimate of the prostate cancer burden. Particularly, in low-and-middle income countries access to cancer screening and treatment may be limited.25 Increases in YLL over time in sub-Saharan African countries for example, might partially be explained by a greater number deaths being attributed to prostate cancer as prostate cancer detection increases.25 Therefore, some of the regional and temporal differences observed could be explained by data quality, and changes in diagnostic infrastructure rather than true underlying burden.
YLL is a complementary metric to more routinely reported metrics such as incidence and mortality. Unlike incidence, YLL is not sensitive to overdiagnosis as it considers only lethal prostate cancer. Unlike disease specific survival, it is not affected by lead-time bias. Due to their direct relationship, the pattern of YLL due to prostate cancer parallels the prostate cancer mortality pattern.4 By quantifying prostate cancer burden in terms of years of life lost, the metric complements mortality rates in that it can be interpreted from a social and socioeconomic point of view.26 Disability adjusted life years (DALYs) are a metric of the combined impact of YLL and Years Lived with Disease (YLD), taking into account the disability caused by the disease. It has been shown that YLL contribute nearly 8-fold more to DALYs than YLD.27Existing research from the Global Burden of Disease project has shown that prostate cancer ranked 12th in terms of contributors to YLL due to cancer in 2015 but results were not stratified by age groups.27 The relative contribution of prostate cancer (as well as that of other cancer types) to global YLL due to cancer overall, and within specific age categories should be explored in future studies.
Some limitations must also be considered while interpreting our study results. Some of these are inherent to the cancer mortality and registry data and have been describes previously2. For example, despite being one of the largest datasets in the world, the quality of vital registration including cause of death vary greatly across countries in the WHO mortality data28. As a result, some of the international differences may be attributable to differences in vital registration rather than underlying burden. Second, we used estimated prostate cancer mortality from the GCO, which are dependent on coverage, completeness, and degree of detail of mortality data. In countries with no vital registration, prostate cancer mortality data has been estimated as an average of rates observed in neighboring countries.2 Third, uncertainty/standard error estimates are not routinely published at the country-level for mortality or life expectancy, which prohibited us from estimating uncertainties in YLL. Finally, we were restrained by the availability of life expectancy in each country. For instance, the UN tables did not have life expectancy for China and therefore we could not report YLL for China and other countries.
In summary, there are wide variations in the burden of prostate cancer internationally as measured by YLL. The burden appears to be highest in Sub-Saharan Africa, Eastern Europe, Latin America, and the Caribbean. Strategic planning and utilization of modifiable drivers of YLL (e.g., the availability and use of effective early detection tools and treatment options) in these regions may reduce the toll of prostate cancer.
Supplementary Material
Acknowledgements
Where authors are identified as personnel of the International Agency for Research on Cancer/World Health Organization, the authors alone are responsible for the views expressed in this article and they do not necessarily represent the decisions, policy or views of the International Agency for Research on Cancer/World Health Organization.
Funding
This project is supported, in part, by the Sidney Kimmel Cancer Center Support Grant (NCI Award 5P30CA056036)
Footnotes
Conflict of Interest
The authors declare no conflict of interest.
References
- 1.Sung H, Ferlay J, Siegel RL, et al. Global Cancer Statistics 2020: GLOBOCAN Estimates of Incidence and Mortality Worldwide for 36 Cancers in 185 Countries. CA: A Cancer Journal for Clinicians. 2021;71(3):209–249. [DOI] [PubMed] [Google Scholar]
- 2.Ferlay J, Colombet M, Soerjomataram I, et al. Cancer statistics for the year 2020: An overview. International Journal of Cancer. 2021. [DOI] [PubMed] [Google Scholar]
- 3.Ferlay J, Ervik M, Lam F, et al. Global cancer observatory: cancer today. Lyon, France: international agency for research on cancer. 2018:1–6. [Google Scholar]
- 4.Culp MB, Soerjomataram I, Efstathiou JA, Bray F, Jemal A. Recent Global Patterns in Prostate Cancer Incidence and Mortality Rates. Eur Urol. 2020;77(1):38–52. [DOI] [PubMed] [Google Scholar]
- 5.Schröder FH, Hugosson J, Roobol MJ, et al. Screening and prostate-cancer mortality in a randomized European study. New England journal of medicine. 2009;360(13):1320–1328. [DOI] [PubMed] [Google Scholar]
- 6.Andriole GL, Levin DL, Crawford ED, et al. Prostate Cancer Screening in the Prostate, Lung, Colorectal and Ovarian (PLCO) Cancer Screening Trial: findings from the initial screening round of a randomized trial. Journal of the National Cancer Institute. 2005;97(6):433–438. [DOI] [PubMed] [Google Scholar]
- 7.Burnet NG, Jefferies SJ, Benson RJ, Hunt DP, Treasure FP. Years of life lost (YLL) from cancer is an important measure of population burden — and should be considered when allocating research funds. British Journal of Cancer. 2005;92(2):241–245. [DOI] [PMC free article] [PubMed] [Google Scholar]
- 8.Brustugun OT, Møller B, Helland Å. Years of life lost as a measure of cancer burden on a national level. British journal of cancer. 2014;111(5):1014–1020. [DOI] [PMC free article] [PubMed] [Google Scholar]
- 9.Ferlay J, Colombet M, Soerjomataram I, et al. Estimating the global cancer incidence and mortality in 2018: GLOBOCAN sources and methods. Int J Cancer. 2019;144(8):1941–1953. [DOI] [PubMed] [Google Scholar]
- 10.Martinez R, Soliz P, Caixeta R, Ordunez P. Reflection on modern methods: years of life lost due to premature mortality—a versatile and comprehensive measure for monitoring non-communicable disease mortality. International journal of epidemiology. 2019;48(4):1367–1376. [DOI] [PMC free article] [PubMed] [Google Scholar]
- 11.Pilleron S, Soerjomataram I, Soto-Perez-de-Celis E, et al. Aging and the cancer burden in Latin America and the Caribbean: Time to act. Journal of geriatric oncology. 2019;10(5):799–804. [DOI] [PubMed] [Google Scholar]
- 12.Rubin MA, Maher CA, Chinnaiyan AM. Common gene rearrangements in prostate cancer. J Clin Oncol. 2011;29(27):3659. [DOI] [PMC free article] [PubMed] [Google Scholar]
- 13.Magi-Galluzzi C, Tsusuki T, Elson P, et al. TMPRSS2–ERG gene fusion prevalence and class are significantly different in prostate cancer of caucasian, african-american and japanese patients. The Prostate. 2011;71(5):489–497. [DOI] [PubMed] [Google Scholar]
- 14.Song C, Chen H. Predictive significance of TMRPSS2-ERG fusion in prostate cancer: a meta-analysis. Cancer Cell International. 2018;18(1):177. [DOI] [PMC free article] [PubMed] [Google Scholar]
- 15.Zhou CK, Young D, Yeboah ED, et al. TMPRSS2:ERG Gene Fusions in Prostate Cancer of West African Men and a Meta-Analysis of Racial Differences. Am J Epidemiol. 2017;186(12):1352–1361. [DOI] [PMC free article] [PubMed] [Google Scholar]
- 16.Cross AJ, Peters U, Kirsh VA, et al. A prospective study of meat and meat mutagens and prostate cancer risk. Cancer research. 2005;65(24):11779–11784. [DOI] [PubMed] [Google Scholar]
- 17.Richman EL, Kenfield SA, Stampfer MJ, Giovannucci EL, Chan JM. Egg, red meat, and poultry intake and risk of lethal prostate cancer in the prostate-specific antigen-era: incidence and survival. Cancer prevention research. 2011;4(12):2110–2121. [DOI] [PMC free article] [PubMed] [Google Scholar]
- 18.World Cancer Research Fund. Food, nutrition and the prevention of cancer: a global perspective. Washington, D.C.: American Institute for Cancer Research, 1997:371–3. [DOI] [PubMed] [Google Scholar]
- 19.Nam K-C, Jo C, Lee M. Meat products and consumption culture in the East. Meat Science. 2010;86(1):95–102. [DOI] [PubMed] [Google Scholar]
- 20.Wang K, Chen X, Bird VY, Gerke TA, Manini TM, Prosperi M. Association between age-related reductions in testosterone and risk of prostate cancer—An analysis of patients’ data with prostatic diseases. International journal of cancer. 2017;141(9):1783–1793. [DOI] [PMC free article] [PubMed] [Google Scholar]
- 21.Porcaro AB, Tafuri A, Sebben M, et al. High body mass index predicts multiple prostate cancer lymph node metastases after radical prostatectomy and extended pelvic lymph node dissection. Asian Journal of Andrology. 2020;22(3):323. [DOI] [PMC free article] [PubMed] [Google Scholar]
- 22.Cao Y, Ma J. Body Mass Index, Prostate Cancer–Specific Mortality, and Biochemical Recurrence: a Systematic Review and Meta-analysis. Cancer Prevention Research. 2011;4(4):486. [DOI] [PMC free article] [PubMed] [Google Scholar]
- 23.Rivera-Izquierdo M, Pérez de Rojas J, Martínez-Ruiz V, et al. Obesity as a Risk Factor for Prostate Cancer Mortality: A Systematic Review and Dose-Response Meta-Analysis of 280,199 Patients. Cancers. 2021;13(16). [DOI] [PMC free article] [PubMed] [Google Scholar]
- 24.Seraphin TP, Joko-Fru WY, Hämmerl L, et al. Presentation, patterns of care, and outcomes of patients with prostate cancer in sub-Saharan Africa: a population-based registry study. Cancer. 2021;127(22):4221–4232. [DOI] [PubMed] [Google Scholar]
- 25.Hsing AW, Yeboah E, Biritwum R, et al. High prevalence of screen detected prostate cancer in West Africans: implications for racial disparity of prostate cancer. The Journal of urology. 2014;192(3):730–736. [DOI] [PMC free article] [PubMed] [Google Scholar]
- 26.Gardner JW, Sanborn JS. Years of potential life lost (YPLL)—what does it measure? Epidemiology. 1990:322–329. [DOI] [PubMed] [Google Scholar]
- 27.Launer BM, Lloyd GL. Sociodemographic index and global trends in prostate cancer: 1990–2017. The Prostate. 2021;81(12):825–831. [DOI] [PubMed] [Google Scholar]
- 28.Mikkelsen L, Phillips DE, AbouZahr C, et al. A global assessment of civil registration and vital statistics systems: monitoring data quality and progress. The Lancet. 2015;386(10001):1395–1406. [DOI] [PubMed] [Google Scholar]
Associated Data
This section collects any data citations, data availability statements, or supplementary materials included in this article.


