Abstract
Among the caspases that cause regulated cell death, a unique function for caspase-7 remained elusive. Caspase-3 executes apoptosis, whereas caspase-7 is typically considered an inefficient back-up. Caspase-1 activates gasdermin D pores to lyse the cell, however, caspase-1 also activates caspase-7 for unknown reasons1. Caspases can also trigger cell-type specific death responses, for example caspase-1 causes intestinal epithelial cell (IEC) extrusion in response to Salmonella Typhimurium infection2,3. Here we show in both organoids and mice that caspase-7-deficient IECs fail to complete extrusion. Mechanistically, caspase-7 counteracts gasdermin D pores and preserves cell integrity by cleaving and activating acid sphingomyelinase (ASM), thereby generating copious amounts of ceramide to enable enhanced membrane repair. This provides time to complete the process of IEC extrusion. In parallel, we also show that caspase-7 and ASM cleavage are required to clear Chromobacterium violaceum and Listeria monocytogenes after perforin pore-mediated attack by natural killer cells or cytotoxic T lymphocytes; which normally causes apoptosis in infected hepatocytes. Therefore, caspase-7 is not a conventional executioner, but instead, a death facilitator that delays pore-driven lysis so that more elegant processes, such as extrusion or apoptosis, can be completed prior to cell death. Cells must put their affairs in order before they die.
Caspase-3 is the primary apoptotic executioner, and is sufficient among caspases to cause apoptosis. In contrast, the role of other executioners, such as caspase-7, remain unknown. Illustrating this, Casp3−/− mice are perinatally lethal on the 129/SvJ background, whereas Casp7−/− mice are healthy4. However, on the C57BL/6 background, caspase-7 can rescue Casp3−/− mice5. This result leads to the current thought that caspase-7 is an inefficient back-up for caspase-3 that only works in certain conditions.
Caspase-7 is required for IEC extrusion
Although caspase-7 was expressed in most tissues6, it was highly expressed in the intestine and in isolated IECs7 (Extended Data Fig. 1a–c). After oral infection with Salmonella enterica serovar Typhimurium (S. Typhimurium), we observed many cleaved caspase-7 positive IECs in the cecum, which all had a characteristic morphology indicative of ongoing extrusion into the lumen8 (Extended Data Fig. 1d–f). Caspase-7 is classically known to be activated by apoptotic caspases, including caspase-3. However, infection did not increase cleaved caspase-3 positive cells, and Casp3−/− mice retained elevated cleaved caspase-7 positive cells (Extended Data Fig. 1g–i).
In WT mice, individual EpCAM+ IECs extruded while neighboring cells remained unperturbed in the monolayer during S. Typhimurium infection (Fig. 1a–b). Strikingly, in Casp7−/− mice, IECs extruded as clusters that remained attached to the apical epithelial surface, (Fig. 1a–b). Clusters became marked 24 hours post infection; in an extreme example, eighteen IECs were observed in a single extrusion cluster site (Fig. 1b, Extended Data Fig. 1j–l). This clustered morphology has not been previously reported. Thus, caspase-7 is activated in extruding IECs in response to S. Typhimurium infection, but independently of the conventional apoptotic executioner caspase-3.
Figure 1. Caspase-7 facilitates IEC extrusion during S. Typhimurium infection and ameliorates gasdermin D pores.
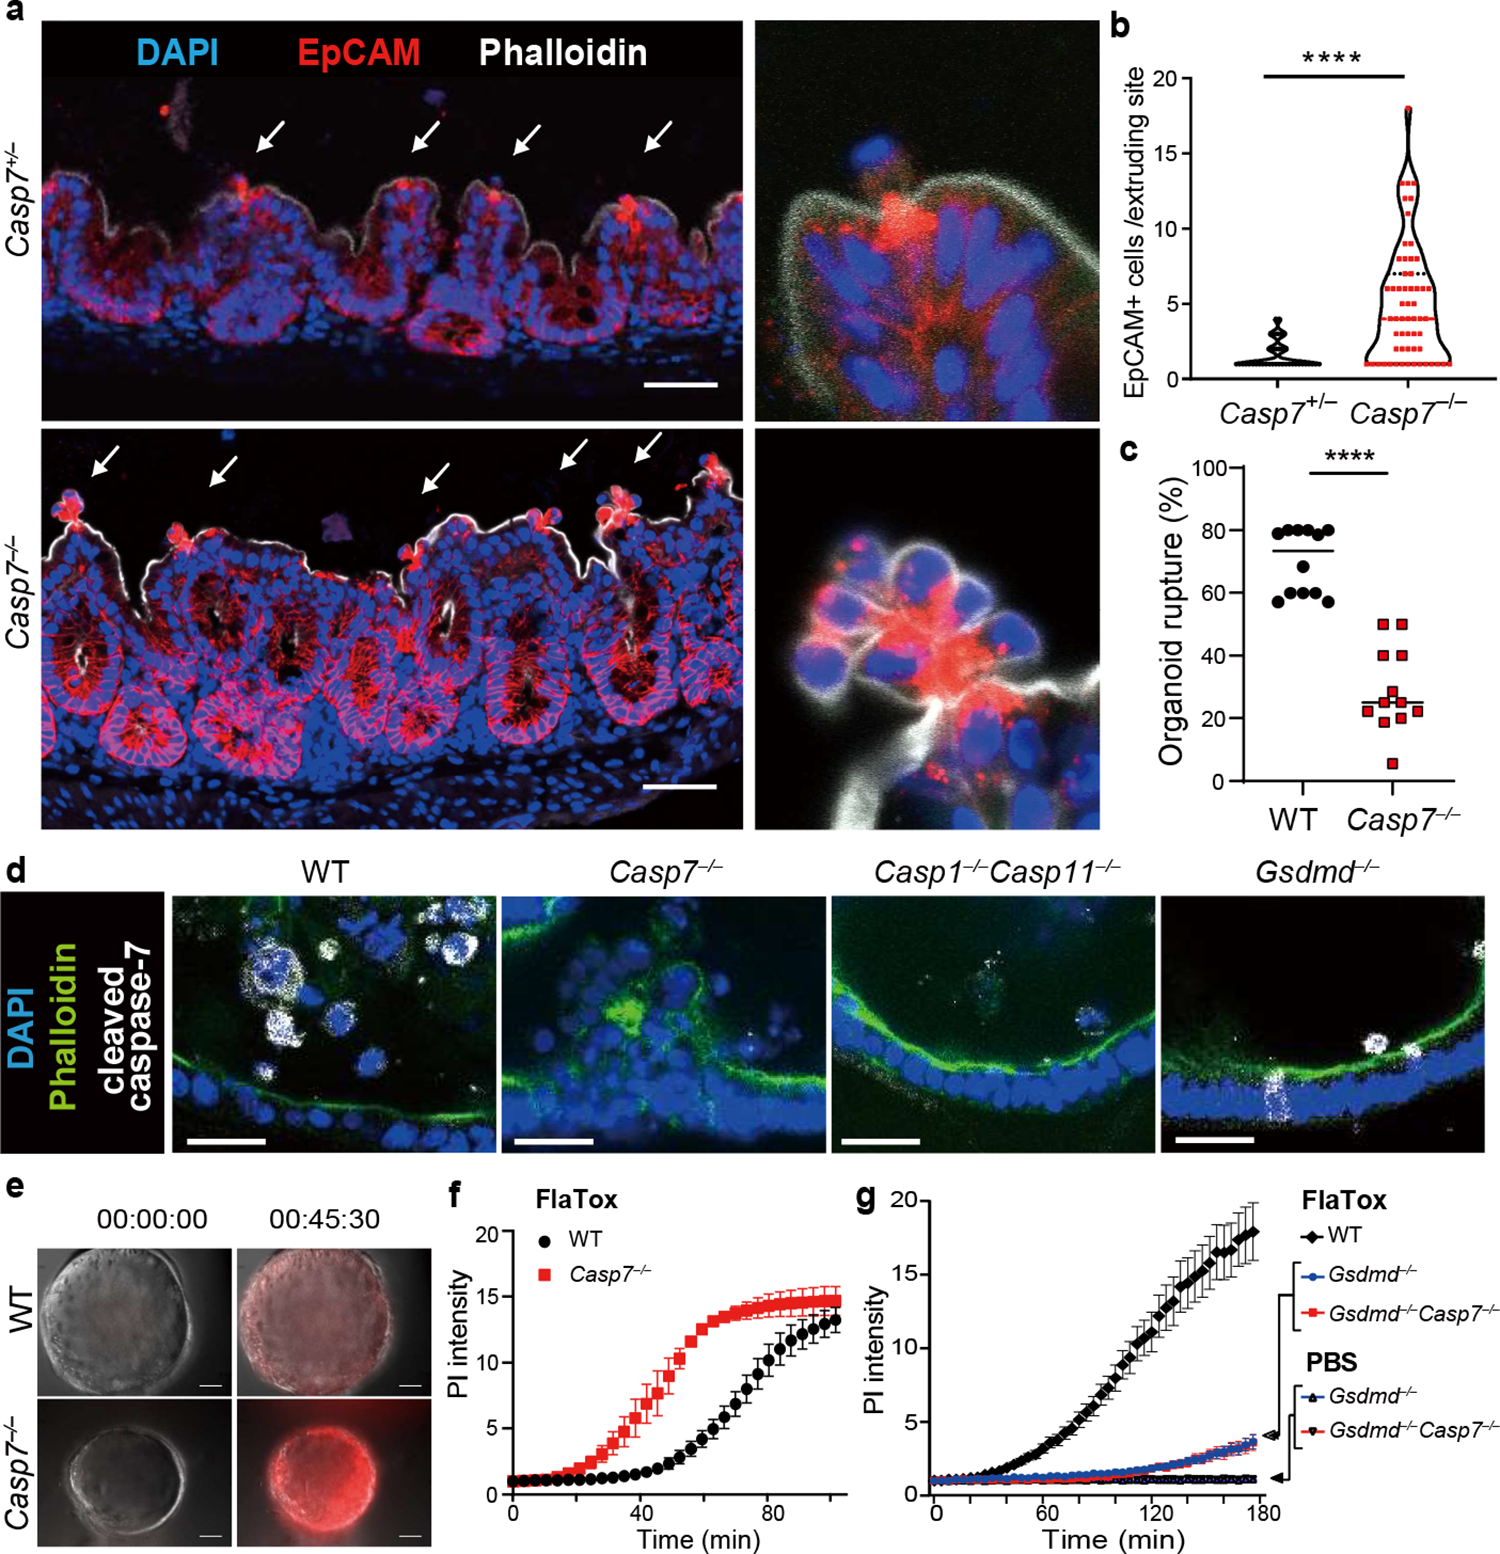
a-b, Indicated mice were infected with 5×10⁶ S. Typhimurium and ceca harvested 24 hours later. Representative images (a) and quantitation (b) of epithelial marker EpCAM+ cell counts per extrusion site (➝, extrusion sites). c, Percentage of ruptured IEC organoids after FlaTox treatment in pooled live imaging experiments (Related to Extended Data Fig. 2a). d, Representative images of organoids 30 min after FlaTox treatment, stained with phalloidin and for cleaved caspase-7. e-f, Representative images (e, full series are in Extended Data Fig. 4b) and quantitation (f) in live cell imaging of PI intensity of WT and Casp7−/− organoids treated with FlaTox. g, PI Intensity of WT, Gsdmd−/−, and Gsdmd−/−Casp7−/− organoids treated with FlaTox or control PBS. Data are representative of 3 experiments (a-b, d-f) or are pooled from 12 (c) or 3 (g) experiments. Scar bar = 50 μm (a), 20 μm (d). *P<0.05, **P<0.01, ***P<0.001, ****P<0.0001 (Two-sided Mann-Whitney U test in (b), two-sided unpaired t test in (c), two-way analysis of variance (ANOVA) with Sidak’s post-hoc test in (f) or with Turkey’s post-hoc test in (g)). Data shown as median ± SEM (b), mean ± SEM (c, f-g). Exact p values in Source Data F1.
During S. Typhimurium infection, IEC extrusion is initiated when caspase-1 is activated by NAIPs/NLRC4, which detects bacterial proteins in the cytosol, such as flagellin2,3. This can be mimicked in IEC organoid cultures by stimulation with FlaTox, an engineered toxin that delivers flagellin to the cytosol, causing extrusion in organoid monolayers in a setting where all cells activate caspase-1. We therefore examined caspase-7 function in this model of IEC extrusion.
FlaTox-treated WT organoids ultimately collapse, concomitant with rupture of the inner contents into the surrounding matrigel; we visualized extruding IEC morphology, and additionally quantitated organoid rupture as a proxy for overall extrusion dynamics. In Casp7−/− organoids the IECs also initiated extrusion, however, they remain attached to neighboring IECs, formed clusters of defectively extruding cells, and ultimately had a reduced incidence of organoid rupture (Supplemental video 1–2, Fig. 1c, Extended Data Fig. 2a–b). Casp3−/− organoids retained normal extrusion, cleaved caspase-7, and ruptured (Extended Data Fig. 2c–e). Therefore, caspase-7 is critical for caspase-1-driven IEC extrusion, and this occurs independently of caspase-3.
Caspase-1 activates caspase-7
Caspase-1 is an inflammatory caspase that is highly expressed in IECs (Extended Data Fig. 1c)7. Caspase-1 can cleave and activate caspase-7, although the physiologic relevance of this remains unknown1. We also observed this cleavage in IEC organoids; caspase-7 was cleaved as early as 15–30 minutes after FlaTox, concomitant with caspase-1 cleavage. This cleaved caspase-7 staining was lost in Casp1−/−Casp11−/− organoids, reflected by delayed cleavage kinetics by western blot, but remained present in Gsdmd−/− IECs (Fig. 1d, Extended Data Fig. 2f). In contrast, caspase-3 cleavage was not observed in the first 30 minutes, and Casp3−/− organoids retained staining cleaved caspase-7; only after 45 minutes in Casp1−/−Casp11−/− organoids did we observe cleavage of apoptotic caspase-8, caspase-9, and caspase-3 (Extended Data Fig. 2e–f). This suggests that secondary pathways (e.g. ASC-caspase-89) can activate both caspase-3 and caspase-7, but with delayed kinetics. This salvage pathway is slower than caspase-1, which rapidly activates caspase-7 after NLCR4 stimulation.
Caspase-7 antagonizes gasdermin D
Caspase-1 also cleaves gasdermin D, which forms pores in the plasma membrane9. Both gasdermin D and caspase-7 are cleaved 15 mins after FlaTox treatment, independently of one another (Extended Data Fig. 2f, 3a). However, gasdermin pore permeability, as assessed by propidium iodide (PI) uptake, was accelerated in Casp7−/− organoids, (Supplemental video 3–4, 7–8, Fig. 1e–f, Extended Data Fig. 3b–c). This caspase-7 effect was not seen during apoptosis activated by TNF with cycloheximide or by the caspase-1-BID pathway that occurs in Gsdmd−/− cells9 (Extended Data Fig. 3d, Fig. 1g). Identical conclusions were drawn using calcein-AM, which stains intact cells (Supplemental video 5–6, Extended Data Fig. 3e–f). The caspase-7 effect was not observed in Casp3−/− organoids (Extended Data Fig. 3g–h). These results indicate that caspase-7 uniquely impedes gasdermin D pore functionality.
ASM is cleaved by caspase-7
When the plasma membrane is damaged, cells have at least four mechanisms to repair the membrane: acid sphingomyelinase (ASM)-driven endocytosis, ESCRT-induced shedding, constriction, and patching10. Among these, ASM is a sphingomyelin-converting enzyme located inside the lysosome. Once the plasma membrane is damaged, Ca++ triggers lysosomal exocytosis into the damaged site where the released ASM can repair the plasma membrane10. In studies unrelated to membrane repair, caspase-7 was found to cleave ASM and enhance sphingomyelin-catalyzing activity11. Despite this link to ASM, a role for caspase-7 in membrane repair has never been examined. We hypothesized that the caspase-7-dependent antagonization of the gasdermin D pore that we observed (Fig. 1e–g) resulted from caspase-7 cleaving and activating ASM.
Full length ASM (pro-ASM; a 72 kDa band) is cleaved by caspase-7 to generate a 57 kDa form with greater enzymatic activity11. In resting organoids, the pro-ASM band is dominant, but FlaTox treatment causes the cleaved band to appear in WT organoids (Extended Data Fig. 4a–c). Immunoreactivity of cleaved ASM is stronger than pro-ASM, a phenomenon also seen with the anti-gasdermin D antibody (Extended Data Fig. 3a), albeit to a lesser degree. ASM cleavage required caspase-7, and additionally NLRC4 and caspase-1, but not caspase-3 (Extended Data Fig. 4b–c). We observed that the 57 kDa cleaved form of ASM was glycosylated, consistent with this band being an active enzyme12 (Extended Data Fig. 4d). Thus, caspase-7 specifically cleaves ASM in our organoid model.
Caspase-7-activated ASM makes ceramide
Sphingomyelin is a major constituent of the membrane in animal cells, containing a head group attached to two lipid groups. The sphingomyelin head group allows the plasma membrane to remain largely flat. ASM removes the head group of sphingomyelin, converting it into ceramide. Ceramide causes the membrane to naturally invaginate, causing spontaneous clathrin-independent endocytosis that internalizes proteinaceous pores in the plasma membrane (Extended Data Fig. 5a). This endocytosis repairs membrane damage quickly – streptolysin O pores are repaired within 30 seconds13. We hypothesized that by activating ASM to produce ceramide, caspase-7 would enhance endocytic membrane repair of the gasdermin D pore.
We found that S. Typhimurium infection resulted in strong ceramide staining in extruding IECs, but not in neighboring IECs (Fig. 2a, Extended Data Fig. 5b–c). In contrast, Casp7−/− mice had no ceramide enrichment in the abnormal IEC extrusion clusters (Fig. 2a). Organoids showed the same caspase-7-dependent ceramide production after FlaTox (Extended Data Fig. 5d–f). In contrast, organoids treated with a functional inhibitor of ASM, imipramine (IMP)14, lost ceramide staining but retained capase-7 cleavage (Extended Data Fig. 5d–f). IMP-treated WT organoids had significantly reduced incidence of rupture, showed more rapid PI entry and calcein loss, and had a faster extrusion initiation time, all similar to Casp7−/− organoids (Fig. 2b–c, Extended Data Fig. 5g–h). In contrast, WT and Casp3−/− organoids initiated extrusion at similar times (Extended Data Fig. 5i). Finally, ceramide treatment normalized Casp7−/− organoid PI staining, extrusion initiation time, and rupture percentage (Extended Data Fig. 5j–l).
Figure 2. Caspase-7 activation drives ASM to repair gasdermin D pores and facilitate IEC extrusion.
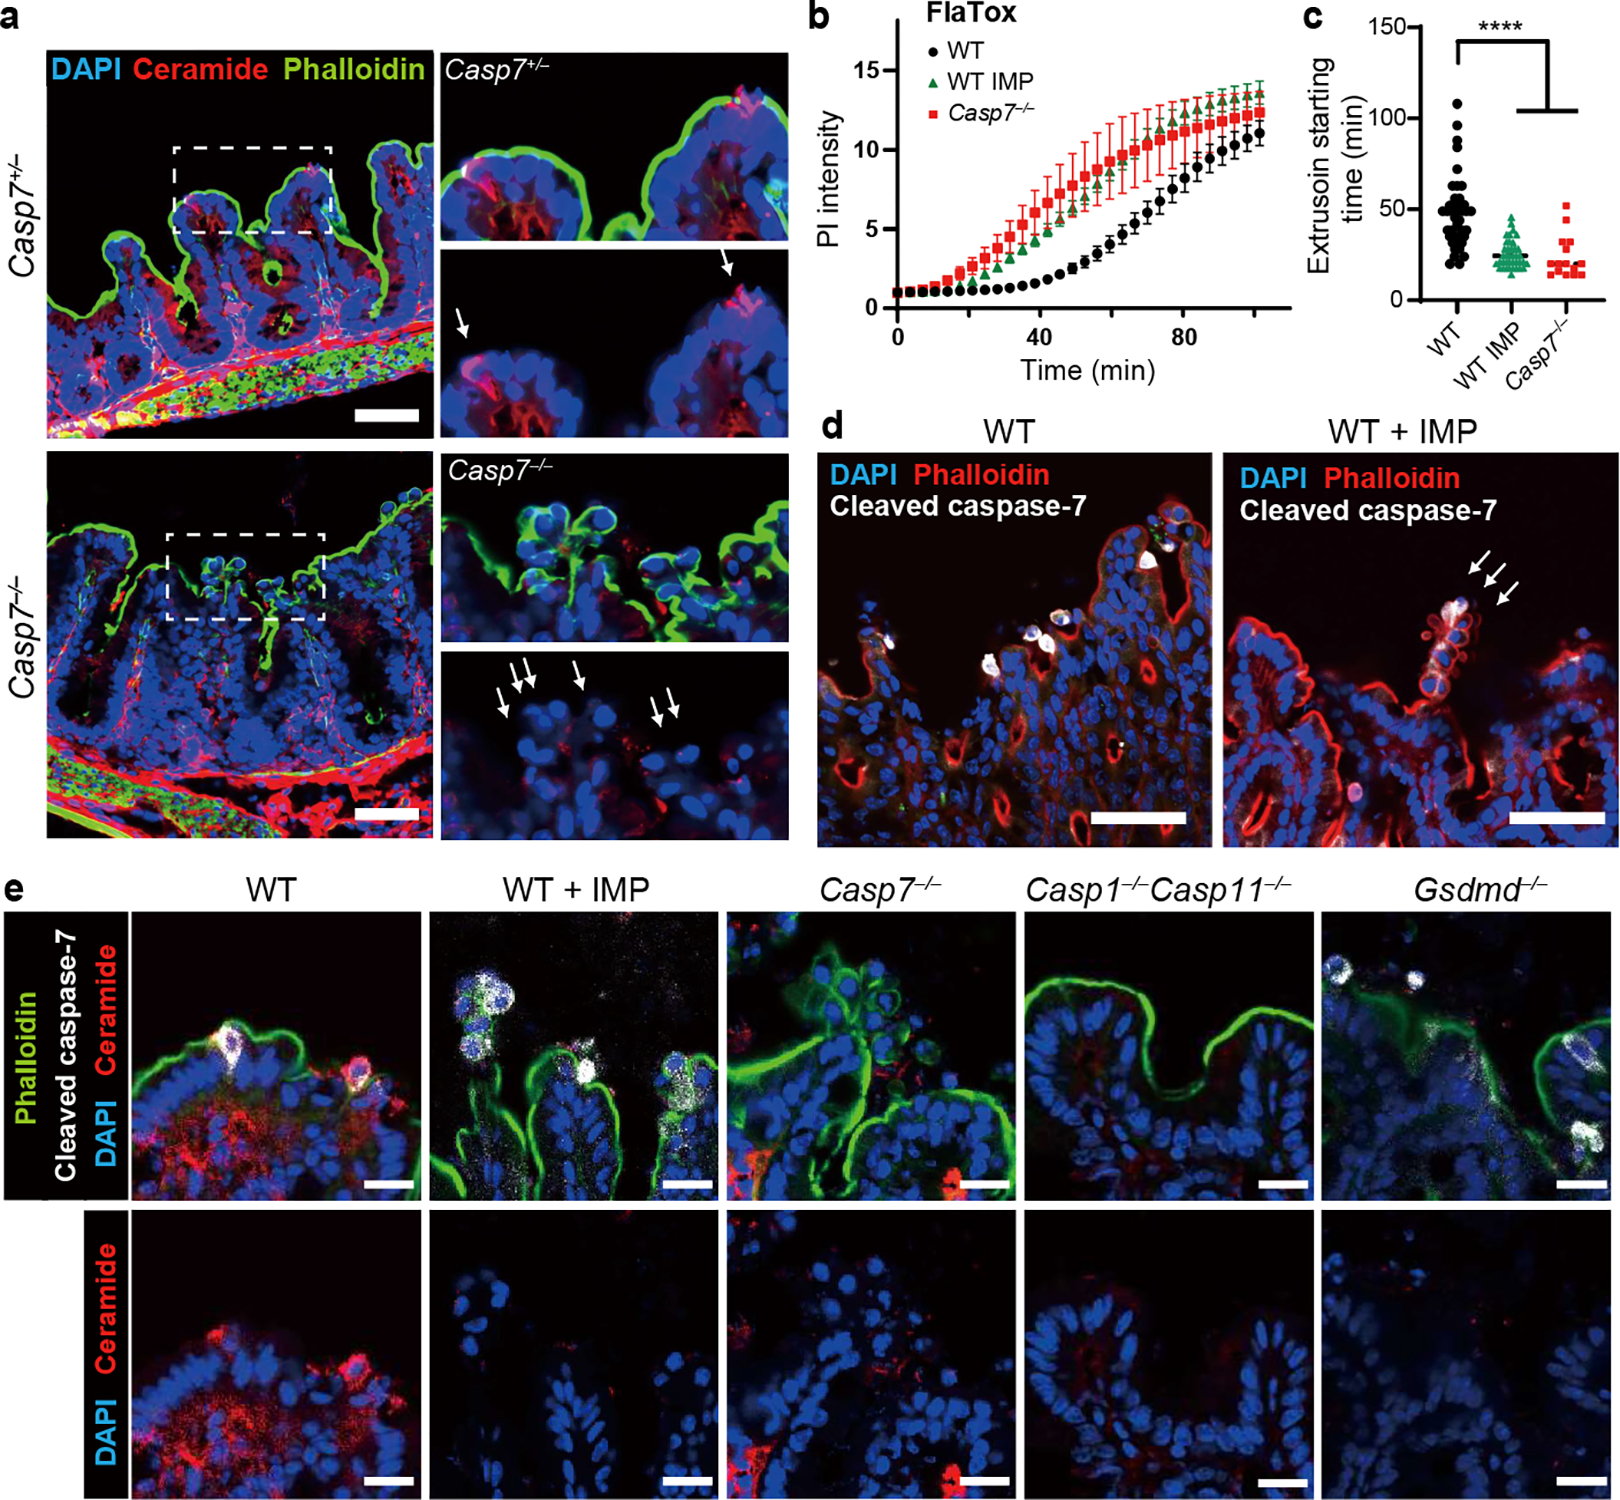
a, Indicated mice were infected with 5×10⁶ S. Typhimurium and ceca harvested 24 hours later. (a) Ceramide staining; dotted rectangles shown at higher magnification at right (➝ indicates individual extruding cells). b-c, Indicated organoids treated with FlaTox were live-imaged, and PI intensity (b) or (c) extrusion starting time were quantitated. d-e, Indicated mice were infected with 5×10⁶ S. Typhimurium and ceca harvested 24 hours later. (d) Cleaved caspase-7 staining (➝ indicates extruding cell clusters). (e) Ceramide and cleaved caspase-7 staining. Scar bar = 50 μm (a, d) or 20 μm (e). Data are representative of 3 experiments (a, d, e) or are pooled from 3 experiments (b-c). For (c), WT (n=41), WT+IMP (n=39), and Casp7−/− (n=15) organoids pooled from 3 experiments were analyzed. *P<0.05, **P<0.01, ***P<0.001, ****P<0.0001 (Two-way ANOVA with Tukey’s post-hoc test in (b), one-way ANOVA with Tukey’s post-hoc test in (c)). Data are shown as mean ± SEM. Exact p values in Source Data F2.
We next applied IMP treatments to our S. Typhimurium infection in vivo. Similar to Casp7−/− mice, IMP-treated WT mice displayed abnormal extrusion clusters (Fig. 2d), and additionally contained cleaved caspase-7 positive IECs that failed to exhibit the morphology of extrusion (Extended Data Fig. 5m). This could be the result of impairment very early in the extrusion process. Further, IMP-treatment did not prevent cleaved caspase-7 staining in the extruding clusters, but ceramide staining was lost (Fig. 2e). We also found the abnormal extruding clusters in IMP-treated organoids after FlaTox stimulation (Extended Data Fig. 5n). Consistent with caspase-1 activating caspase-7, ceramide staining was lost in Casp1−/−Casp11−/− mice (Fig. 2e). Altogether, caspase-7 activates ASM to generate ceramide, which can reseal gasdermin D pores in extruding IECs. Further, depletion of ASM causes defective IEC extrusion clusters, similar to caspase-7 deficiency.
Gasdermin D links caspase-7 to ceramide
The above data strongly associate caspase-7 and ASM. However, a conundrum remains, which is that ASM resides in the lysosomal lumen, whereas caspase-7 resides in the cytosol. How can caspase-7 cross the membrane to interact with and cleave ASM? We hypothesized that the gasdermin D pore was the conduit. Indeed, in FlaTox-treated Gsdmd−/− organoids, caspase-7 was activated, but was unable to cleave ASM (Extended Data Fig. 2f, 4b). Furthermore, ceramide production was lost in Gsdmd−/− mice during infection (Fig. 2e, Extended Data Fig. 6). These data support the hypothesis that caspase-7 passes through the gasdermin D pore in order to encounter and cleave ASM; importantly, these are the same pores that require ASM-driven membrane repair.
Cleaved ASM repairs membranes
IMP affects many lysosomal proteins, and is thus not fully specific for ASM. To specifically eliminate the caspase-7 cleavage of ASM, we generated ASM D249A (Smpd1DA/DA) mice via CRISPR-Cas9 mutagenesis (Extended Data Fig. 7a). Smpd1DA/DA mice were fertile and healthy to at least five months of age. During S. Typhimurium infection, Smpd1DA/DA mice showed the same extrusion defect as Casp7−/− mice (Fig. 3a–b, Extended Data Fig. 7b). As in IMP-treated mice, caspase-7 was activated in the extruding cell clusters in Smpd1DA/DA mice (Fig. 3c), and Smpd1DA/DA organoids treated with FlaTox (but not TNF+CHX) showed faster PI uptake, reduced rupture incidence, and faster extrusion initiation (Fig. 3d, supplementary video 9, Extended Data Fig. 7c–f). Importantly, Smpd1DA/DA organoids with FlaTox treatment showed no ASM cleavage (Fig. 3e). Therefore, caspase-7-cleavage resistant mice replicate the phenotypes seen in Casp7−/− mice and IMP-treated mice.
Figure 3. ASM cleavage-resistant mutation impairs membrane repair and IEC extrusion.
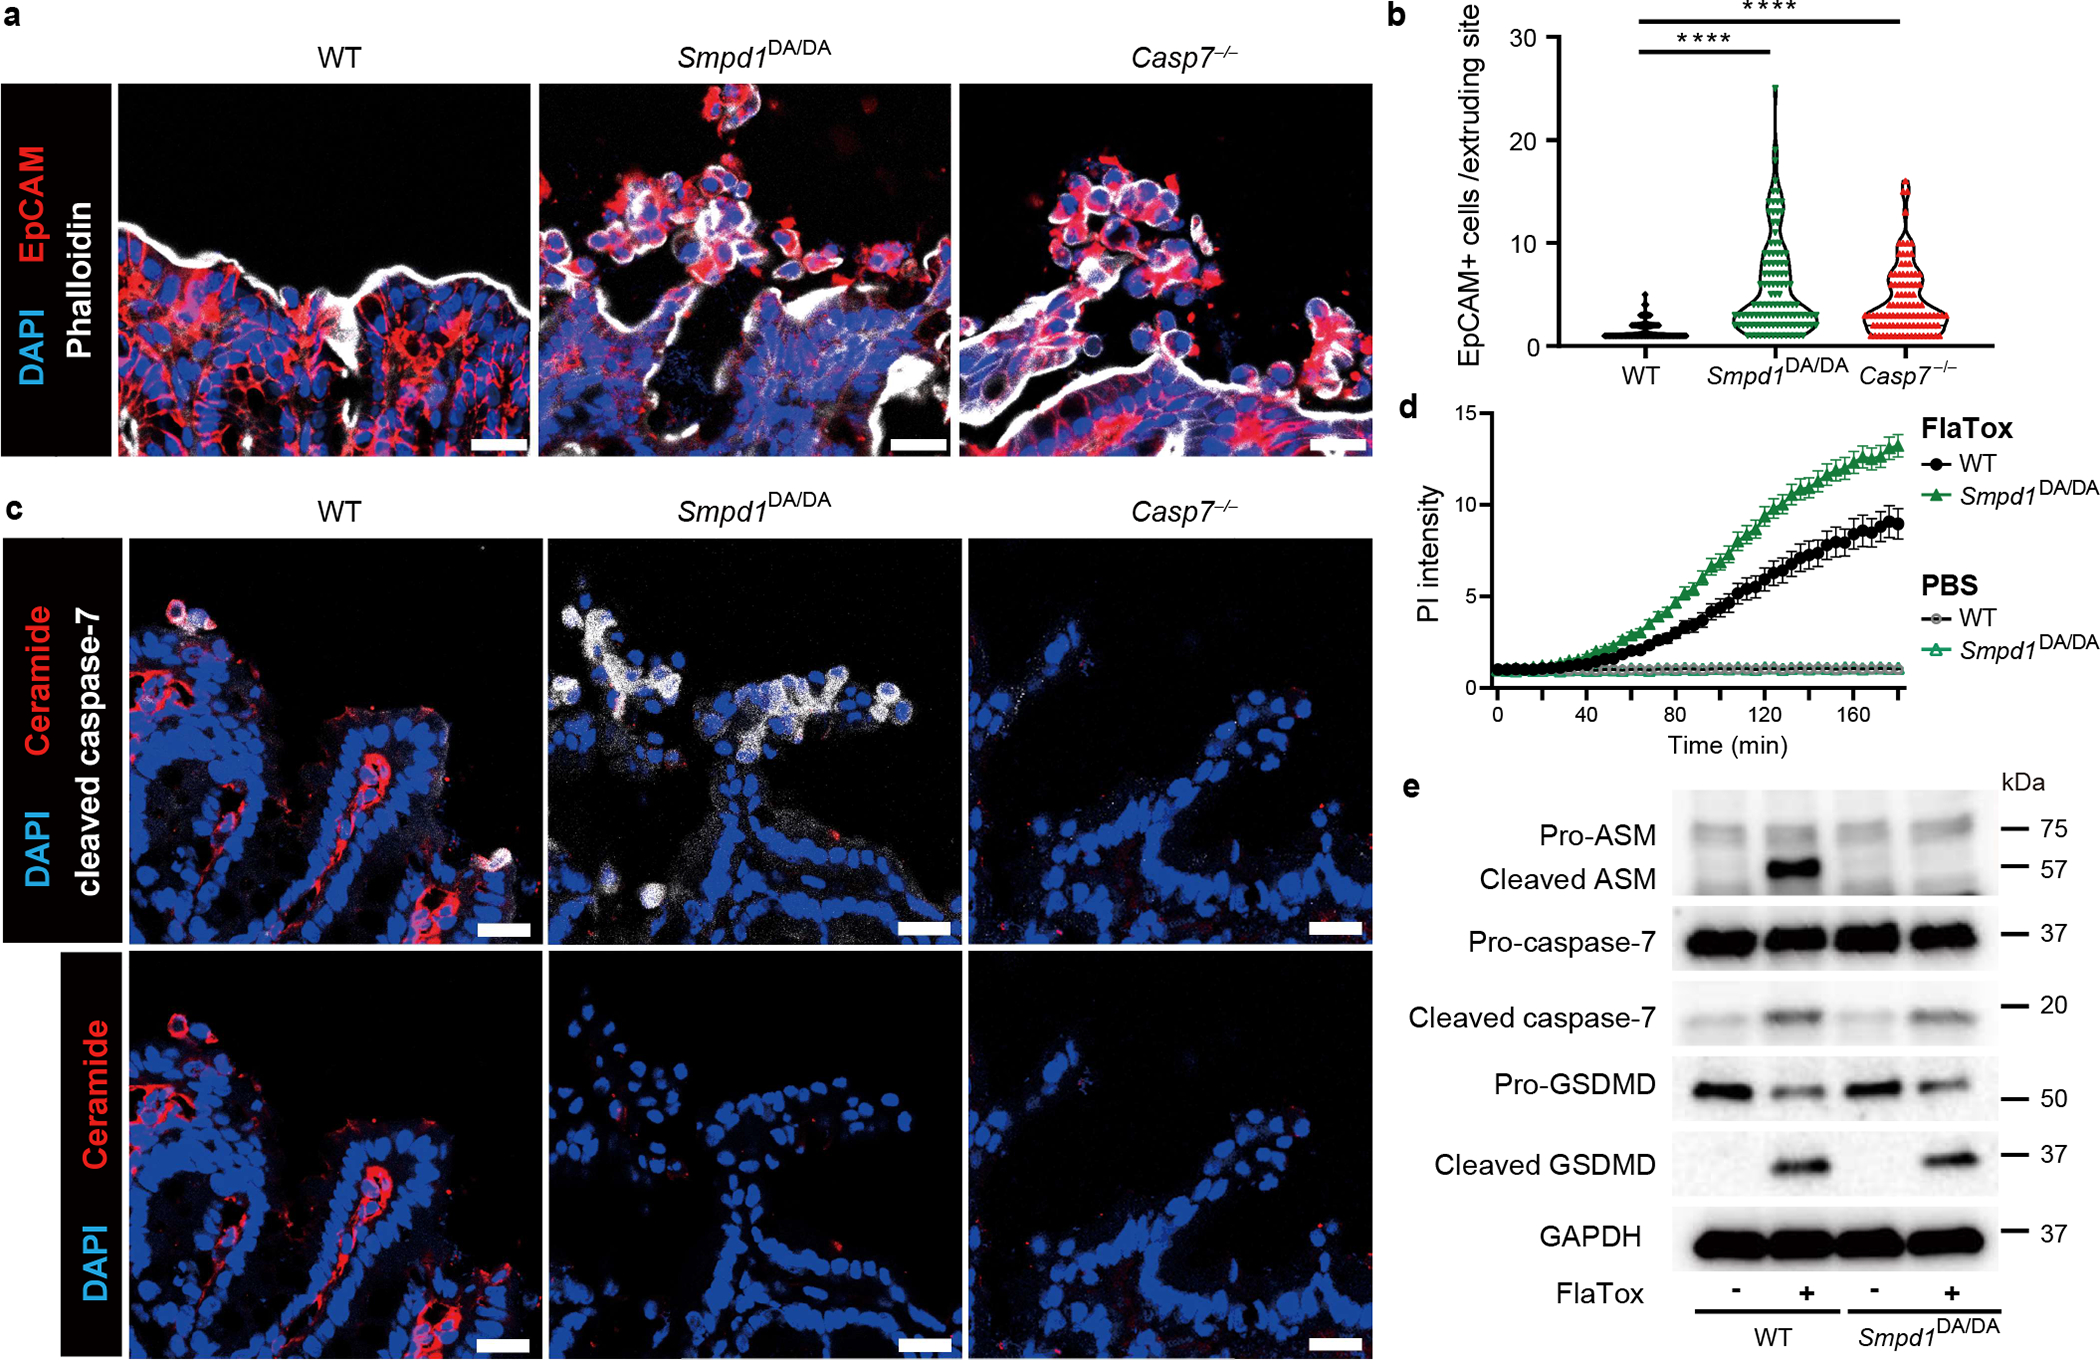
a-c, Indicated mice were infected with 5×10⁶ S. Typhimurium and ceca harvested 24 hours later. Representative images (a) and quantitation (b) of EpCAM+ cell counts per extruding site. (c) Ceramide and cleaved caspase-7 staining. d, Indicated organoids treated with FlaTox or PBS control were live-imaged, and PI intensity was quantified. e, indicated organoids were removed of dead cells and then stimulated 20 min with PBS or FlaTox and ASM, caspase-7, and GSDMD cleavage assessed. Data are representative of 3 experiments (a-c, e) or are pooled from 3 experiments (d). Scar bar = 20 μm. *P<0.05, **P<0.01, ***P<0.001, ****P<0.0001 (Two-sided Mann-Whitney U test in (b), two-way ANOVA with Sidak’s post-hoc test in (d)). Data are shown as median ± SEM (b), mean ± SEM (d). Exact p values in Source Data F3.
Caspase-7 mitigates intestinal pathology
WT mice show significant intestinal pathology during S. Typhimurium infection, whereas Casp1−/−Casp11−/− mice show minimal pathology15. In contrast, Casp7−/− mice showed worsened pathology and cytokine response, with extruded cells retained in proximity to the gut wall 48 hours post infection. However, bacterial burdens were minimally altered in Casp7−/− or Smpd1DA/DA mice (Extended Data Fig. 8a–j). We observed similar results during dextran sodium sulfate colitis, in which Casp7−/− mice exacerbated weight loss and pathology (Extended Data Fig. 8k–l), Thus, caspase-7 is important for reducing intestinal damage, but not S. Typhimurium burdens.
These results indicate that a series of events is required to facilitate IEC extrusion downstream of caspase-1: caspase-7 passes through gasdermin D pores, then cleaves ASM, potentiating its activity to generate ceramide, which mediates membrane repair to ensure that extrusion completes successfully. Defective extrusion causes pathology, but does not reverse bacterial burdens.
If activating ASM is the core evolved function of caspase-7, then this should hold true in other model systems where cell death involves pores concomitant with caspase-7 activation. The most classical example of this is the perforin pore attack pathway used by natural killer (NK) cells and cytotoxic T lymphocytes (CTLs) to activate apoptosis.
NK-perforin defense requires caspase-7
NK cells and CTLs use perforin pores to deliver granzyme B, which activates all three of the apoptotic executioner caspases: caspase-316,17, caspase-718,19, and caspase-620. NK/CTLs attack host cells harboring intracellular pathogens, which eliminates the infected cells21. Remarkably, perforin pores are similar in size to gasdermin pores. However, a unique role for caspase-7 after perforin-mediated attack remains elusive.
We discovered a novel model pathogen, Chromobacterium violaceum, where NK cell perforin attack clears bacteria. C. violaceum is a ubiquitous environmental bacterium that only infects immunocompromised people22. The immune system actually uses both apoptosis and pyroptosis to combat C. violaceum; each is required in a different cell type23. Pyroptosis is implicated in clearance of bacteria from the spleen, where NLRC4 and caspase-1 are essential probably in macrophages, but the caspase-1 processed cytokines IL-1β and IL-18 are dispensable23. In the liver there is an additional role for IL-18, which primes NK cells to use perforin attack on hepatocytes (in which caspase-1 is not detectable)23.
Casp7−/− mice, but not Casp6−/− mice, were more susceptible to C. violaceum infection, phenocopying Prf1−/− mice (Fig. 4a–b, Extended Data Fig. 9a–b). Thus, we discovered another in vivo phenotype with which to study caspase-7. We expected that Casp3−/− mice, lacking the primary apoptotic executioner, would be susceptible to C. violaceum. Instead, Casp3−/− mice were aberrantly hyper-resistant (Extended Data Fig. 9a). This does not indicate that caspase-3 enhances infection; Casp3−/− mice are known to have an abnormal immune system. Our results may be another example of the aberrant tonic type I IFN signaling seen in caspase-3-deficient mice that causes aberrant resistance to viruses24,25. Casp7−/− and Casp6−/− mice do not suffer from this caveat. Thus, although caspase-3 is fully sufficient to accomplish apoptosis in vitro, caspase-3 was unable to compensate for the loss of caspase-7 in defense against C. violaceum in vivo.
Figure 4. NK cell perforin attack cleaves caspase-7 and ASM to clear C. violaceum.
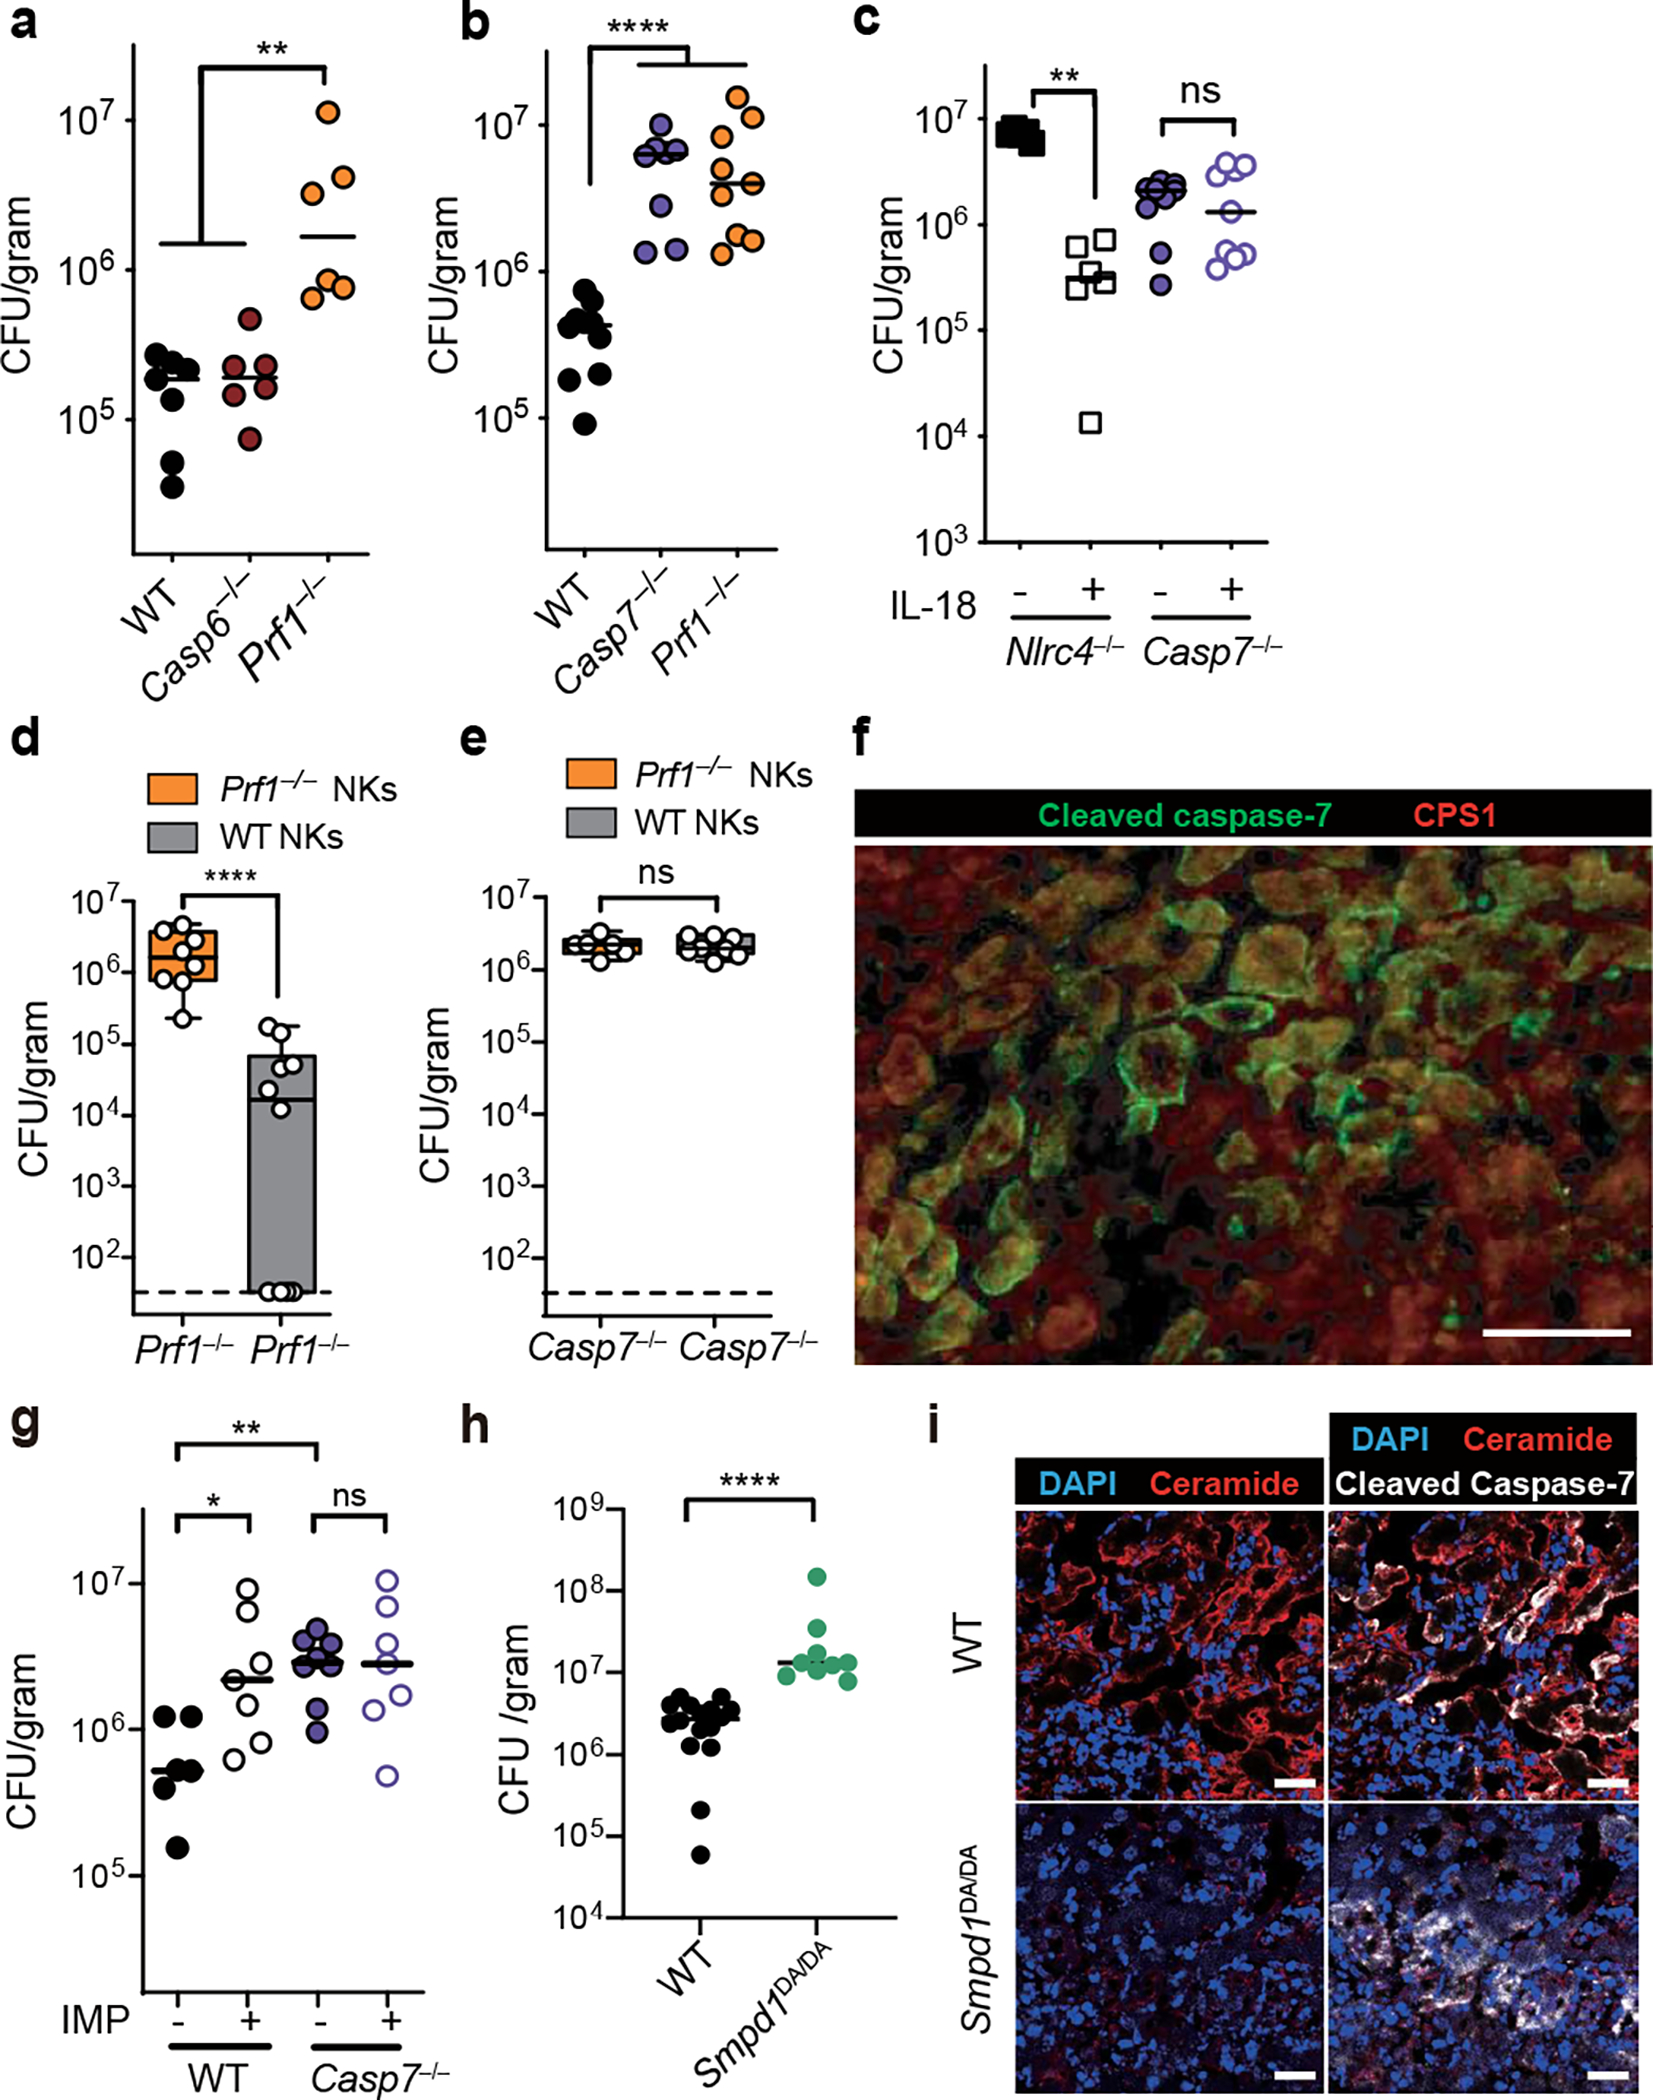
a-i, Indicated mice were infected with 102 (c) or 104 (a-b, d-i) C. violaceum. Enumeration of liver burdens 3 days post infection (dpi) (a-e, g-h). (c, f) Mice were treated with recombinant IL-18 or PBS control (day 0 and 1). (d-e) Mice were adoptively transferred with NK cells from the indicated sources 24 hours before infection. (f) Livers were stained for the indicated markers via immunofluorescence 2 dpi. Scale bars, 50 μm. Larger image area and single channels shown in Extended Data Fig. 8b. (g) Mice were treated with imipramine or PBS. (i) Representative images of infected livers 3 dpi stained for indicated markers. Scale bars, 20 μm. (a-e) Data are pooled from 2 experiments, or from (g-h) 3 experiments. (f, i) Data are representative of 2 experiments. Mouse numbers (a) WT n=7, Casp6−/− n=6, Prf1−/− n=6; (b) WT n=10, Casp7−/− n=7, Prf1−/− n=8; (c) PBS n=6 and IL-18 n=6 treated Nlrc4−/−, Casp7−/− n=9 each; (d) Prf1−/− n=9, Casp7−/− n=7; (g) WT n=6, WT IMP n=7, Casp7−/− control n=8, Casp7−/− IMP n=7; (h) WT n=16, Smpd1DA/DA n=9. *P<0.05, **P<0.01, ***P<0.001, ****P<0.0001 (Two-sided Mann-Whitney U test (a-e, h) or one-way ANOVA (g)). Bars indicate median values. Box plots show median, 25th-75th percentile, whiskers are minimum and maximum. Exact p values in Source Data F4.
Caspase-7 acts in hepatocytes
NLRC4-driven IL-18 is upstream of NK cell perforin during C. violaceum infection23. IL-18 therapy rescued Nlrc4−/− mice but not Casp7−/− mice (Fig. 4c) or Prf1−/− mice23. Further, liver burdens in Casp7−/− mice and Prf1−/− mice were comparable (Fig. 4b, Extended Data Fig. 9b), suggesting a common defense pathway. Using NK adoptive transfer, we determined that perforin acted in the NK cell, whereas caspase-7 did not (Fig. 4d–e, Extended Data Fig. 9c–d). Thus, caspase-7 acts downstream of both IL-18 and NK perforin to defend the liver from C. violaceum infection.
We previously showed that C. violaceum resides in hepatocytes23, and thus we hypothesized that hepatocytes would contain activated capsase-7. In order to synchronize NK cell attack and downstream caspase-7 activation, we used IL-18 therapy in Casp1−/−Casp11−/− mice. C. violaceum liver infection results in macroscopic 2–4 mm lesions23 identifiable by DAPI, in which cleaved caspase-7 was visualized in hepatocytes (marked by CPS1) (Fig. 4f, Extended Data Fig. 10a–d). Cleaved caspase-3 and cleaved caspase-7 were both observed in serial sections, and cleaved caspase-3 remained present in Casp7−/− mice; additionally, these cells were positive for an apoptosis marker (TUNEL) (Extended Data Fig. 10e–j). Cleaved caspase-7 and cleaved PARP (another apoptosis marker) were also observed in WT mice (Extended Data Fig. 10k–l). Therefore, apoptotic caspase-7 and caspase-3 are both activated in hepatocytes, where caspase-7 plays an essential role that cannot be compensated for by caspase-3.
Caspase-7 activates ASM after NK attack
One commonality between the Salmonella/IEC model and the C. violaceum/hepatocyte model is that both require caspase-7 and form plasma membrane pores during the cell death processes. We hypothesized that caspase-7-amplified ASM activity could explain its role downstream of NK-perforin attack. ASM depletion in WT mice caused an increase in C. violaceum burdens in WT mice, but not in Casp7−/− mice (Fig. 4g). In infected livers, ceramide staining became intense around the inflammatory foci, encircling the lesion within cleaved caspase-7 positive cells in WT mice, but not in Casp7−/− or IMP-treated mice (Extended Data Fig. 11). The few ceramide-positive cells after IMP treatment may have escaped complete ASM-depletion. We also infected Smpd1DA/DA mice with C. violaceum and found increased burdens, and decreased ceramide staining, similar to Casp7−/− and IMP-treated WT mice (Fig. 4h–i). These data suggest that several key events are required for C. violaceum clearance: NK cell perforin attack, caspase-7 cleavage, ASM cleavage, and ceramide production.
NK cells clear Listeria via caspase-7
Listeria monocytogenes is useful to compare to C. violaceum because both are tropic for hepatocytes (Extended Data Fig. 12a). However, unlike C. violaceum, L. monocytogenes evades inflammasomes in vivo26,27, limiting IL-18 release28 to a level that avoids priming the host NK cytotoxic response. Concomitant with this, WT and Casp7−/− mice have equal burdens 3 days post infection. This susceptibility was corrected with IL-18 therapy in WT mice, which failed in either NK cell depleted, Casp7−/− (Extended Data Fig. 12b–c), and Prf1−/− mice23, matching our results with C. violaceum. Therefore, IL-18 primes NK cell cytotoxicity to clear a Gram-negative and a Gram-positive intracellular bacterium, both requiring caspase-7.
CTLs clear Listeria via caspase-7
While L. monocytogenes evades NK cytotoxicity during a natural infection, it is efficiently identified and eradicated by the CTL response. CTL-perforin attack during L. monocytogenes infection is typically studied using adoptive transfer experiments, which minimizes redundancy from Th1 responses29,30 (Extended Data Fig. 12d–k). As a control, naïve CTL transfer resulted in the expected high burdens in both WT and Casp7−/− mice. Immune CTLs from vaccinated mice reduced burdens in WT (or Casp6−/−) mice, but were significantly defective in Casp7−/− recipients (Fig. 5a, Extended Data Fig. 12l). Perforin was required in CTLs while caspase-7 was required in the recipient mouse (Fig. 5b–c). Finally, when we compared Prf1−/− CTLs in a WT recipient (an effective single perforin knockout) to Prf1−/− CTLs in a Casp7−/− recipient (which should be an effective double knockout) there was no additive effect (Extended Data Fig. 12m). The residual clearance in Casp7−/− mice was mostly dependent upon IFN-γ (Extended Data Fig. 12n), as expected.
Figure 5. CTL perforin attack clearance of L. monocytogenes requires caspase-7 and ASM cleavage.
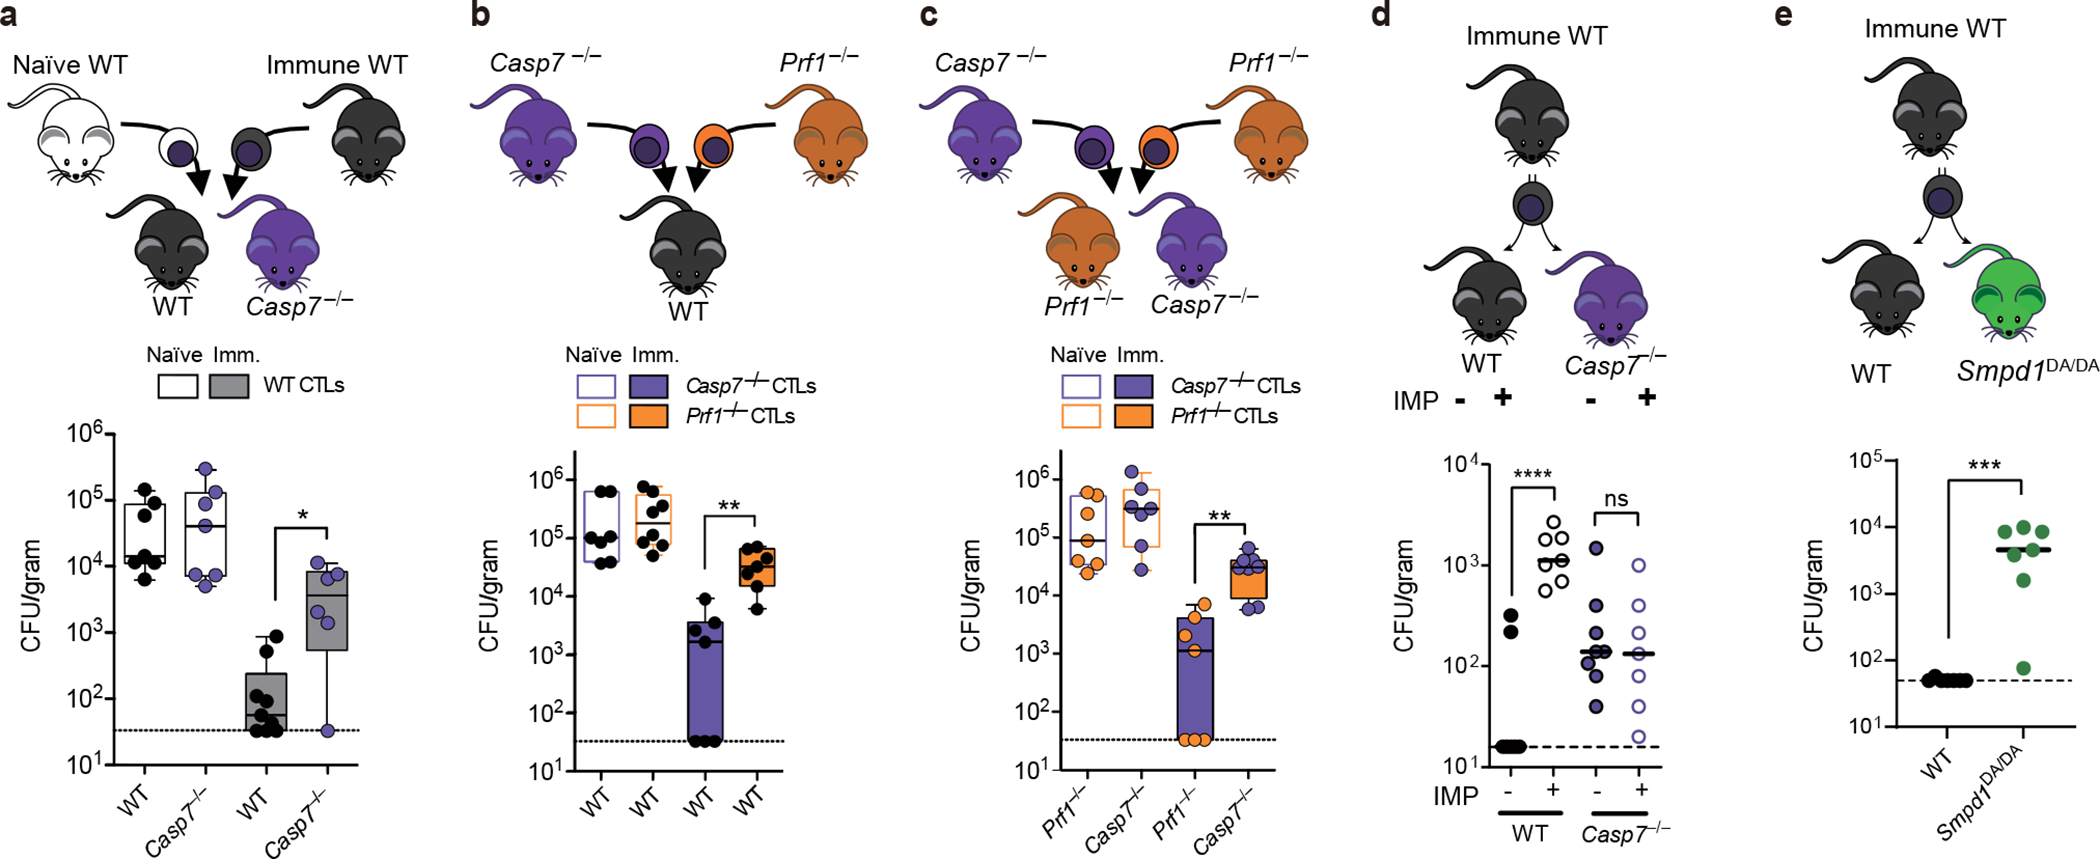
a-e, CTL donor mice were PBS treated (naïve) or vaccinated with ΔactA L. monocytogenes (immune). Recipient mice were infected with L. monocytogenes, transferred with CTLs 2 days post infection (dpi), and liver burdens determined 3 dpi. Timeline for AT experiments in EDF13a. d, Recipient mice were injected IP with imipramine or PBS (day −1 to infection, then daily). All data are pooled from two experiments. Mouse numbers in (a) naïve WT n=7, immune WT n=9, naïve Casp7−/− n=7, immune Casp7−/− n=6; (b) WT mice with Casp7−/− CTLs n=7 each, naïve Prf1−/− CTLs n=8, immune Prf1−/− CTLs n=7; (c) naïve recipients n=7 each, immune recipient Prf1−/− n=8, Casp7−/− n=7; (d) WT n=7, WT IMP n=7, Casp7−/−n=8, Casp7−/− IMP n=7; (e) WT n=7, Smpd1DA/DA n=7. *P<0.05, **P<0.01, ***P<0.001, ****P<0.0001 (Two-sided Mann-Whitney U test (a, e) or one-way ANOVA (b-d)). Bars indicate median values. Box plots show median, 25th-75th percentile, whiskers are minimum and maximum. Exact p values in Source Data F5.
Cleaved caspase-7 positive hepatocytes appeared specifically after immune CTL transfer, assessed by flow cytometry and histologic staining within infected foci (Extended Data Fig. 13a–g). A large percentage of cleaved caspase-7 positive cells had identifiable L. monocytogenes (Extended Data Fig. 13h–i). Thus, perforin activity is required in CTLs, whereas caspase-7 activity is required in hepatocytes.
Caspase-7 activates ASM after CTL attack
Again, we hypothesized that the mechanism of caspase-7 function was by activating ASM. IMP-treated WT mice showed increased L. monocytogenes burdens after immune CTL transfer, but again IMP-treatment did not affect burdens in Casp7−/− mice (Fig. 5d). Further, Smpd1DA/DA mice also showed increased burdens (Fig. 5e). Thus, caspase-7 cleaves ASM in order to facilitate L. monocytogenes clearance after CTL attack.
Therefore, after NK/CTL attack, caspase-7 cleaves and activates ASM, driving the production of ceramide, which is required for eventual C. violaceum and L. monocytogenes clearance.
Caspase-7 is dispensable in some cases
Amongst viral infections, murine cytomegalovirus (MCMV) and lymphocytic choriomeningitis virus (LCMV) are common models to study perforin defense after NK and CTL attack, respectively31,32. Although perforin is important for both, caspase-7 and caspase-6 were not (Extended Data Fig. 14). That caspase-7 was required for resistance against two bacteria but not two viruses, might indicate direct bactericidal effects of caspase-7, however, we found no evidence for this (Extended Data Fig. 15). Thus, the role for caspase-7 depends upon the nature of the infecting pathogen.
Caspase-7 is dispensable for pyroptosis
During C. violaceum infection, we previously proposed that there are at least two niches defended by different cell death modalities: hepatocytes cleared by apoptosis, and macrophages cleared by pyroptosis. This raises the question of whether direct cleavage of caspase-7 by caspase-1 might be also important to clear C. violaceum in the spleen, where pyroptosis likely defends the niche. We found Gsdmd−/− mice were susceptible and had spleen burdens equivalent to Casp1−/−Casp11−/− mice, but Casp7−/− mice (and other genotypes studied herein) competently cleared their spleens (Extended Data Fig. 16a–h). Caspase-1 and gasdermin D are required for pyroptosis, but also for IL-18 release which is upstream of the perforin/caspase-7 defense pathway; thus, caspase-1 and gasdermin D are required for liver defense (Extended Data Fig. 16c). Consistently, caspase-7 was not required in other infectious models where pyroptosis clears bacteria in vivo (Extended Data Fig. 16i–m). Therefore, in niches where pyroptosis dominates as the programmed cell death defense, caspase-7 is not required. Conversely, when apoptosis is dominant with evasion of caspase-1, as seen during L. monocytogenes infection26,27, caspase-1 is not required for the perforin/caspase-7 defense pathway (Extended Data Fig. 16n).
Phylogeny of caspase-7 and pores
Finally, we examined the phylogenetic conservation of Casp7, Prf1, and Gsdmd. Casp7 and Prf1 were present even within Chondrichthyes (sharks). However, Gsdmd first arises in marsupials and is absent in more primitive organisms (Extended Data Fig. 16o). Therefore, caspase-7 and perforin arose long before gasdermin D. We speculate that the original evolved function of caspase-7 was to counteract perforin pores, and that a secondary function to counteract gasdermin D pores appeared later in evolution. If this is the case, it could explain why we observed stronger phenotypes in bacterial clearance during perforin-mediated immune defense.
Discussion
Here we discover that the unique function of caspase-7 is to activates ASM and thereby drive plasma membrane repair (schematic in Extended Data Fig. 17). Our results indicate that ASM has two modes of action: basal activity and caspase-7 potentiated activity. Total loss of ASM causes Niemann-Pick disease, a lysosomal storage disease10. That Casp7−/− and Smpd1DA/DA mice are healthy demonstrates that caspase-7 cleavage is dispensable for basal ASM activity. The basal activity of pro-ASM-generated ceramide will rapidly repair a few pores in the plasma membrane without the need for caspase-7. Similarly, basal ESCRT-III–dependent exocytosis can repair gasdermin D or MLKL pore opening33,34, however, caspases are not known to enhance ESCRT-III function. Importantly, the combined activity of the many basal membrane repair pathways, including basal ASM, ESCRT-III, constriction, and patching10, fail to compensate for the loss of caspase-7-enhanced membrane repair in our models. When caspase-7 cleaves ASM, this boosts ASM activity, resulting in copious ceramide production that repairs numerous membrane pores. Therefore, caspase-7 improves upon normal membrane repair capacity.
Gasdermin D and perforin pores will allow massive calcium influx, causing lysosomal exocytosis that will deliver pro-ASM to the cell surface to repair the membrane. However, caspase-1 or NK/CTL attack might generate numerous gasdermin/perforin pores that exceeds basal membrane repair capacity. We propose a model where activated caspase-7 passes through gasdermin D or perforin pores in order to encounter ASM. This is an elegant solution to enable caspase signaling to reach across the membrane to activate extracellular ASM. This caspase-7-ASM pathway provides one regulatory mechanism to slow down pore-mediated lysis. This should be in parallel to other regulatory mechanisms, for example, caspase-1 self-inactivation by cleavage between its CARD and protease domains35, and caspase-3 inhibition by XIAPs36.
Why is membrane repair required to facilitate successful IEC extrusion? Opening the gasdermin D pore likely triggers IEC extrusion, but the open pore would also cause the loss of cytosolic molecules required to complete the extrusion process. For example, ATP is essential for normal actomyosin contraction in extruding IECs8. In the absence of repair, IECs might become depleted of ATP or other critical constituents before the extrusion process is completed. This incomplete extrusion could be detrimental to neighboring cells, which could explain the abnormal clustering of extruding cells we observe during S. Typhimurium infection in Casp7−/− and Smpd1DA/DA mice. The precise identity of the cytosolic extrusion effectors that are compromised under caspase-7/ASM deficiency await elucidation.
Why is membrane repair essential to facilitate intracellular bacteria clearance after NK/CTL-perforin attack? There is evidence that multiple CTL attacks are required in vivo in other infectious models37, which would generate many perforin pores. These should be problematic for completing apoptosis because rapid swelling and membrane rupture might occur faster than caspase-3 can act38,39. Apoptosis requires time and intact cellular energetics. We speculate that caspase-7 permits the cell the time needed to complete apoptosis after perforin-mediated attack. We propose that completion of the apoptotic process is required to clear C. violaceum and L. monocytogenes, and that perforin-driven lysis is not sufficient. However, it is not immediately intuitive why lysis would not be sufficient to clear the bacteria. Indeed, pyroptosis drives lysis in vivo in order to trap bacteria in pore-induced intracellular traps (PITs) that lead to neutrophil efferocytosis, thereby killing bacteria40; this mechanism likely clears C. violaceum in the spleen. What aspect of apoptosis leads to bacterial clearance from hepatocytes awaits elucidation. Overall, our results suggest that caspase-7 is not simply a weak back-up for caspase-3 during apoptosis. Instead, caspase-7 is a facilitator of cell death pathways that is independently essential during regulated cell death. Remarkably, in our IEC extrusion model caspase-7 acts downstream of the pyroptotic caspase-1, but in the NK/CTL model, caspase-7 acts downstream of granzyme B and probably in concert with the apoptotic caspase-3. We therefore propose to change the designation of caspase-7 from an apoptotic executioner to instead be a general cell death facilitator that is useful for both inflammatory and apoptotic pathways when a cell needs to maintain an intact membrane for a certain period of time.
EXPERIMENTAL MODEL AND SUBJECT DETAILS
Mice
Mice were housed in a pathogen-specific free facility: wild type (WT) C57BL/6 (Jackson Laboratory), Casp7−/− (Jackson #006237), Casp3−/− (Jackson #006233; note these mice are born at sub-Mendelian ratios from heterozygous x heterozygous or heterozygous x homozygous breeding, with the latter often failing to breed; weaned Casp3−/− mice appear normal and healthy by visual inspection), Gsdmd−/− (reference 3), Nlrc4−/− (reference 41), Casp1−/−Casp11129mt/129mt referred to as Casp1−/−Casp11−/− (reference 42), Casp6−/− (Jackson #006236)43, Prf1−/− (Jackson #002407)32. Smpd1D249A/D249A (this paper) were generated by the Duke Cancer Institute, breed normally, and are healthy by visual inspection to at least 5 months of age at the time of publication. Animal protocols were approved by the Institutional Animal Care and Use Committee (IACUC) at the University of North Carolina at Chapel Hill or by the IACUC at Duke University and met guidelines of the US National Institutes of Health for the humane care of animals. All strains were maintained on 12/12 light cycles, at 72 +/− 2 °F, and under the humidity set point of 45%. All strains were maintained in C57BL/6 background. For all mouse infections, 8–12-week-old mice were infected with the designated colony forming units (cfu) or plaque forming units (pfu). C. violaceum, S. Typhimurium, B. thailandensis, and MCMV were delivered in PBS by intraperitoneal (IP) injection; L. monocytogenes and L. monocytogenes ΔactA mutant were delivered in PBS by intravenous (IV) injection; LCMV was delivered in DMEM by IP injection. For bacterial and viral enumeration, organs were bead homogenized and serially diluted on BHI agar plates (C. violaceum, L. monocytogenes, and L. monocytogenes ΔactA mutant), LB agar plates (S. Typhimurium and B. thailandensis) or for plaque/TCID50 assays (LCMV and MCMV). Both male and female were used in equivalent numbers in groups unless otherwise stated. Mice were allocated to groups for experiments in a non-biased manner. Blinding of mice was not performed except for histologic scoring of pathology. Target sample size was 6 mice per group based on power analysis and historical trends in data variance, however smaller or larger group sizes were used sometimes due to mouse availability.
METHODS DETAILS
Strains and growth conditions
Bacterial strains used in this work: S. enterica serovar Typhimurium on the 14028s background with or without flgB::Tn10 were used for competitive index, comparing kanamycin vector control (pWSK129) to FliCON (pEM087)44, B. thailandensis (strain previously passaged through a Casp1−/−Casp11−/− mouse), C. violaceum (ATCC 12472), L. monocytogenes (10403s derivative, native inlAB replaced with mouse-specific inlAmB, PMC 2869327), and L. monocytogenes ΔactA mutant (kind gift from the lab of D.A.P.). We refer in the text to the L. monocytogenes strain with the mouse-specific inlAmB as wildtype L. monocytogenes. C. violaceum, L. monocytogenes, and L. monocytogenes ΔactA mutant were grown in Brain heart infusion (BHI). S. Typhimurium and B. thailandensis were grown in Luria-Bertani medium (LB). All bacterial strains were grown overnight at 37°C and back-diluted (1:40) for 2 hours for all experiments.
Viral stocks of lymphocytic choriomeningitis virus (LCMV) were generated from infected BHK-21 monolayers (lab of J.K.W.). Viral stocks of murine cytomegalovirus (MCMV, Smith Strain, ATCC #VR-1399) were grown in 3T12 cells (ATCC), passaged in weanling BALB/c mice, harvested from salivary glands and quantified in viral plaque assays45 (generated in the lab of M.G.B).
Tissue culture cell lines
L-WRN cells were purchased directly from ATCC, which is considered a reputable vendor; they were further authenticated by their phenotype of supporting organoid growth, a property that other cell lines cannot accomplish. HeLa cells were purchased from Duke University Cell Culture Facility, and were authenticated by Short Tandem Repeat (STR) analysis performed by this facility. Hepa1–6 and YAC-1 were purchased directly from ATCC, which is considered a reputable source. Hepa1–6 cells were partially authenticated by visual morphology. YAC-1 cells were partially authenticated by the phenotype of being attacked by NK cells. Cell lines were not further authenticated. Cell lines were tested for mycoplasma contamination. These cell lines are not included in the list of commonly misidentified cell lines by ICLAC.
S. Typhimurium oral infection
For S. Typhimurium infection, streptomycin pretreatment was performed as previously described46. Mice were deprived food and water for 4 hours and treated orally with 20mg/kg streptomycin the day before infection. S. Typhimurium SL1344 were grown overnight at 37°C and back-diluted (1:40) for 4 hours in LB, then diluted in PBS before infection. Mice were deprived food and water for 4h, then S. Typhimurium were delivered by oral gavage on day 0 (5 × 10⁶ CFU were used unless otherwise indicated). Water was provided thereafter, and food were provided 2 hours later ad libitum. For ASM depletion, mice were injected IP with 10 mg/kg imipramine (Sigma #I0899) or PBS control daily, started from the day before infection. For S. Typhimurium enumeration, organs were collected, bead homogenized, and serially diluted on LB agar plates with streptomycin. Ceca were incubated in gentamycin/PBS (50 μg/ml) for an hour, then washed three times and harvested.
Competitive Index
For competitive indices with S. Typhimurium, bacteria were grown to stationary phase overnight in LB. 8–10-wk-old mice were infected with 105 total CFUs composed of vector control pWSK129 (kanamycin resistant) mixed at a 1:1 ratio with FliCON (ampicillin resistant) S. Typhimurium. Bacteria were diluted in PBS and injected into mice by IP injection. Tissues were harvested 2 days after infection and homogenized, and dilutions were plated onto LB + antibiotics. Competitive index expressed as log (FliCON CFU/vector control CFU), thus a – 2.0 competitive index reflects a ratio of 1 FliCON to 100 vector control CFUs.
In vivo treatments
For NK cell depletion, mice were injected IP with 100 μg anti-NK1.1 (PK136, BioXcell, BE0036) or isotype control (C1.18.4, BioXCell, BE0085). Depletion of NK1.1-positive cells was confirmed by flow cytometry. For IL-18 therapies, mice were injected IP with 0.2 μg recombinant mouse IL-18 (rmIL-18; MBL) at the time of infection, and daily until harvest as we previously described23. For ASM depletion, mice were injected IP with 10mg/kg/mouse of imipramine (Sigma) or PBS control beginning at day −1 prior to infection, then daily. For in vivo IFN-γ blockade, mice were injected IP with 500 μg/mouse of anti-mouse IFN-γ (XMG1.2, BioXcell, BE0055) or isotype (Rat IgG1, BioXcell BE0290) control beginning at day −1 prior to infection, then every other day.
ELISA
Mice serum were collected and stored at −80°C until usage. IFN-γ levels in serum were determined by ELISA (R&D Systems). For ELISA, 100 μl of capture antibody diluted in PBS was plated into 96 well plate, covered with parafilm and left overnight at RT. After wash with wash buffer 4 times, blocking buffer was added 300 μl and incubated for 1 hour at RT. After wash 4 times, 100 μl of each sample and standard per well was added and reacted for 90 mins at RT. After wash 4 times, 100 μl of detection Ab was added. After wash 4 times, 100 μl of streptavidin-HRP was added and incubated for 20 mins at RT. After development with 100 μl of substrate solution for 20 min, reaction was stopped with 50μl of 2N H2SO4 and signal at 450 nm was detected using Epoch Microplate Spectrophotometer (BioTek) running Gen 5 v3.10 software.
Induction of acute colitis by dextran sodium sulfate
Animals were initially maintained on 2.5% w/v DSS (MP Biochemical #160110, Santa Ana, CA) ad libitum for 7 days, followed by 10 days of regular drinking water. Body weights were measured before induction of colitis and daily thereafter until mice were sacrificed. For histology, mice were treated with 2.5% w/v DSS ad libitum for 5 days and euthanized, then tissues were placed in 10% formalin for at least 24 h prior to embedding, cutting, and H&E staining by the UNC Cell Services and Histology Core.
Immunofluorescence and analysis
Cecum or organoid samples were fixed with 4% paraformaldehyde (PFA) in PBS overnight at 4°C. Liver was perfused via the portal vein with 2% paraformaldehyde (PFA) in PBS and left to fix in 5 ml of 2% PFA overnight. The next day, samples were rinsed in PBS and replaced in 30% sucrose in PBS for two days, then compound in OCT media (Sakura Finetek # 4583) and frozen on dry ice and cut for 5–8 μm sections.
Tissues were air-dried, washed in PBS and permeabilized with 1% Triton X-100 in PBS for 30 mins, and blocked in 1% BSA PBS for 1 hour at RT. Primary antibodies were incubated overnight. After washing in PBS for 10 mins three times, secondary antibody reactions were performed for 2 hours at RT, followed by another three washes in PBS. Finally, slides are mounted with DAPI (Fluoroshield, Sigma #F6057).
Primary antibodies detecting cleaved caspase-7 (1:400, Cell Signaling #9491), cleaved caspase-3 (1:400, Cell Signaling #9661), EpCAM (1:1000, BioLegend #118202, clone G8.8), and ceramide (1:200, ENZO Life Sciences #ALX-804–196, clone MID 15B4), 1:200, Glycobiotech #MAB_0014, clone S58–9) in 1% BSA PBS were used. For hepatocyte or Listeria colocalization analyses, slides were then stained with CPS1 as a marker of hepatocyte47. (See CPS1 Antibody above) or a polyclonal anti-Listeria antibody (Abcam #68592, 1:10) for 1 hour. Phalloidin (1:1000, Invitrogen, # A12379, #A34055, #A22287) was used to stain F-actin. Alexa-conjugated antibodies (anti-rabbit; Cell Signaling #4412, #4414, anti-rat; Abcam #ab175475, anti-mouse; Invitrogen #A10037) were used to as secondary antibodies (1:1000). Anti-PARP1 antibody (D214, #STJ90100, St John’s Laboratory; 1:400).
For TUNEL staining, tissues were instead fixed in 4% PFA and permeabilized with 0.2% Triton, with 0.2% Triton remaining in all further staining steps. Slides were stained overnight for cleaved caspase-7 as above. Tissues were then stained for TUNEL signal with the Roche in situ cell death detection kit TMR red (Sigma Cat. # 12156792910). Mounting media contained DAPI.
All images were taken on Zeiss 880 machine with Plan-Neofluar 40×/1.3 objective operated by ZEN Black Edition v14.0 software, or Olympus BX61 machine. Images shown in Extended Data Figure 9 are composed of multiple merged 20× images in the zones of cleaved caspase-3 or -7 staining, which were overlaid above a 10× image that occupies the upper left quadrant of the image (where there is primarily DAPI staining).
Anti-CPS1-HRP antibody was obtained from Abcam (#198969, 1:300) and is an intracellular marker (thus requires fixation and permeabilization prior to antibody use). HRP-conjugated antibodies can be used with tyramide signal amplification techniques to generate a fluorescent signal detectable by flow cytometry and immunofluorescence. AlexaFluor 488 signal was generated using the Thermofischer kit #T20922, and cells/tissues were incubated with the solution for 10 minutes before stopping the reaction and washing. Endogenous peroxidase signal was blocked with 0.3% hydrogen peroxide for 60 minutes prior to incubation with anti-CPS1 antibody.
Intestinal epithelial cell isolation, culture, and treatment
Jejunal-ileal crypts were isolated from 10 to 15-week old wild-type mice as previously described48. After euthanasia, intestine was removed and cut open, then washed three times, followed by 2.5mM EDTA chelation for 30 mins at 4°C and mechanical dissociation. The isolated crypts were pelleted and washed three times in 2% sorbitol PBS with low-speed centrifugation (400 rpm, 3 mins) at 4°C and resuspended in 1%FCS/DMEM. After filtered through 70 μm strainers, crypts were pelleted and embedded in Matrigel (BD Biosciences #356321) and incubated for 20 mins at 37°C. After gels were solidified, warmed 50% L-WRN conditioned media from L-WRN cells (ATCC #3276) based on Advanced DMEM/F12 (Gibco #12634010) were added49. These conditioned media were supplemented with 20 ng/mL mouse EGF (Peprotech # 315–09). The medium was changed every 2 days until the following use of cultured organoids. For organoid imaging experiment, day 2 organoids from various genotypes were grown further for 24–48 hours in Advanced DMEM/F12 containing 1× glutamax, 1× pen/strep, 2.5 mM N-acetylcysteine (Sigma # A9165), 500 ng/mL mouse Rspo1 (R&D Systems #3474-RS-050), 20 ng/mL mouse EGF, and 100 ng/mL mouse Noggin (R&D Systems #6997-NG-025) to allow differentiation.
For organoid stimulation, 3 μg/ml FlaTox50, 20 ng/ml TNF (Peprotech #315–01A), 5 μg/ml cycloheximide (Sigma #C4859), 50 μM imipramine (Sigma #I7379) were used. For organoid imaging experiments, Propidium Iodide (100 μg/ml, Invitrogen #P3566) was loaded before 1 hour of imaging. Calcein AM (2 μM, Invitrogen #C3100) was loaded before 30 mins of experiments as manufacturer’s protocol. For ceramide introduction, 1 mM of C-16 ceramide (Cayman Chemical #10681) stock solution was prepared in N,N-Dimethylformamide (Sigma #D4551). C-16 ceramide (final concentration; 500 nM) or control vehicle was added to the cell culture media before 2 hour 30 mins of imaging.
Time-lapse imaging for organoids
Time-lapse imaging of the organoid was performed on a MetaMorph v7.10 software in VivaView Incubator Fluorescence Microscope (Olympus) with an X-Cite eXacte as illumination source. DIC image as well as fluorescent images (PI and calcein) were acquired through UPLSAPO20x objective (0.75 N.A.) onto Orca R2 cooled CCD camera (Hamamatsu). After 30 mins to one hours of adaption, single plane imaging was performed for 1.5–6 hours at 120–320s intervals just after FlaTox or TNF+CHX treatment. ImageJ v1.4.3.67 software (NIH) was used to measure the Mean Intensity of each organoid in hyperstuck image for PI and calcein Intensity analysis.
Liver cell enrichment
Livers were extracted and perfused with collagenase type I (1mg/ml in RPMI) via portal vein injection until visible blanching of all lobes was observed. Liver lobes were then finely cut into small pieces using a razor blade and incubated for 10 minutes at 37°C with CO2. They were then mashed through a cell strainer (Falcon, 70 μm) into a 50 ml conical and washed with ~40 ml of plain RPMI. Cells were spun in a tabletop centrifuge (Eppendorf, model 5810R) at 50 × g for 5 minutes at 4°C. The supernatant was discarded, the pellet resuspended in 15 ml of RPMI, and spun for an additional 2× at 50 × g for 5 minutes at 4°C. The cell pellet, now consisting of >96% hepatocytes (as previously reported51 and validated by flow cytometry) were resuspended once in PBS and spun again as before. Cells were resuspended in RBC Lysis Buffer, incubated for 5 minutes at room temperature (~22°C), spun at 1500 rpm in a small tabletop centrifuge (Eppendorf model 5810R), and the pellet resuspended in RPMI or 1X PBS depending on usage. For splenocyte isolation: spleens were mashed through a cell strainer (Falcon, 70 μm) into a 50 ml conical and washed with 15 ml of plain RPMI. Cells were spun at 1,000 × g for 5 minutes, once in RPMI, and once in PBS. They were then RBC lysis treated, spun, and the pellet resuspended in RPMI or 1 X PBS.
Adoptive transfer of natural killer cells
Splenocytes were harvested from naïve mice as described above. Cells were seeded into 10 cm non-TC-treated dishes with RPMI + 10% FBS + NEAA + Pen/Strep + 15 ng/ml IL-2. Four days later, the supernatant was removed and spun at 1000 rpm for 5 minutes to remove dead cells. The supernatant was returned to the dish along with 2 ml of new media with an additional 10 ng/ml of IL-2. Six days post initial plating the cells were counted and used for transfer.
Adoptive transfer with bacterial count enumeration
For experiments using bacterial counts from L. monocytogenes, donor mice were vaccinated with 1×10⁶ of the ΔactA L. monocytogenes mutant strain or mock injected with PBS as described previously52. NK cells were depleted (see “In vivo treatments” section above) in all donor mice on day 5 post challenge to remove potential confounding NK contributions. Splenocytes were harvested from naïve or immunized mice as described above. Recipient mice were then adoptively transferred via IV injection with 5×10⁷ bulk splenocytes. One-hour post AT recipient mice were IV injected with 5×10⁴ cfu of L. monocytogenes. Mice were harvested 3 days later with livers and spleens homogenized and dilutions plated on BHI. Plates were incubated at 37°C and bacterial counts were enumerated 16–24 hours later.
Adoptive transfer with flow and immunofluorescence analysis
For experiments examining cleaved caspase-7 expression (Extended Data Fig. 12) in L. monocytogenes infections, donor mice were vaccinated, NK depleted, and splenocytes harvested as in the AT experiments described above (“In vivo treatments” and “Adoptive transfer of natural killer cells”). Recipient mice were IV injected with 5×10⁴ L. monocytogenes 2 days prior to AT. Recipient mice were then transferred with 8×10⁷ bulk splenocytes via IV injection. Mice were harvested 24 hours post AT. One lobe of the liver was prepared for immunofluorescence, and hepatocytes isolated from the remaining liver lobes for flow cytometry (see “Liver cell enrichment” above and “Flow cytometry” below).
Flow cytometry
Surface and intracellular staining was performed directly ex vivo. Cells were Fc-blocked with anti-CD16/CD32 (1:100) and surface stained with anti-CD45.2-PercPCy5.5 (104, Biolegend #109828; 1:400), anti-NK1.1-FITC (PK136, Biolegend #108706; 1:400), and anti-CD8a (Biolegend #109807; 1:400). Cells were fixed in 2% PFA either overnight at 4°C or for 20 minutes on ice before permeabilizing with 10X Fix/Perm Buffer (Biolegend #421002) on ice. Cells were incubated with cleaved caspase-7 antibody (Cell Signaling #9491, 1:500, 45 minutes) followed by APC-conjugated secondary anti-rabbit antibody (Cell Signaling, #4414s, 1:1000, 45 minutes). After 5 washes, cells were stained with anti-CPS1-HRP antibody (Abcam #198969, 1:300, detailed description below, 45 minutes), and samples were analyzed on a FacsCalibur machine courtesy of Dr. Whitmire’s lab. Flow cytometry data was collected using BD CellQuest Pro v5.2.1 software and analyzed using FlowJo v10.3 software.
Viral titer enumeration
LCMV viral titer in the liver was quantified by plaque assay on Vero cell monolayers53. MCMV viral titer in the liver was quantified by TCID50 assay on 10.1 murine embryonic fibroblasts (MEFs). MEFs were seeded at 5000 cells/well into 96 well plates and allowed to adhere for 24 hours. Serial dilutions of liver homogenate were then added and cultured for 6 days before determining cytopathic effects (CPE). Titer was determined via the Reed Muench method.
In vitro coculture assays
NK cells were expanded ex vivo as follows: splenocytes were harvested from naïve mice as described above. Cells were seeded into 10 cm non-TC-treated dishes with RPMI + 10% FBS + NEAA + Pen/Strep + 15 ng/ml IL-2. Four days later, the supernatant was removed and spun at 1000 rpm for 5 minutes to remove dead cells. The supernatant was returned to the dish along with 2 ml of new media with an additional 10 ng/ml of IL-2. Six days post initial plating the cells were counted and used for transfer. Hepa1–6 cells (murine hepatocyte cell line; ATCC CRL-1830) were maintained in DMEM with 10% FBS. Cells were seeded at 5×10⁴ cells/well of a treated 96 well plate and allowed to adhere overnight. The following day (approximately 24 hours later), they were infected at a MOI of 0.5 with L. monocytogenes for 1 hour before washing and replacing with media containing gentamicin (50 μg/μl). The next morning (approximately 16 hours later), the cells were washed to remove gentamicin from all wells, and co-cultured with NK cells at an effector:target (E:T) ratio of 5:1 with or without gentamicin added to the media. Bacterial counts and caspase-3/7 activation were analyzed 5 hours post co-culture.
YAC-1 cells (non-adherent murine lymphoblast cell line; ATCC TIB-160) are inherently targeted by NK cells and often used for NK killing assays. YAC-1 cells were maintained in RPMI with 10% FBS. They were also seeded at 5×10⁴ cells/well of a treated 96 well plate. They were infected for 1 hour at a MOI of 10 with either C. violaceum or L. monocytogenes before washing and replacing with media containing gentamicin (50 μg/μl) for 1 hour. YAC-1 cells were then washed, co-cultured with NK cells, and analyzed for bacterial counts and caspase-3/7 activation as with the Hepa1–6 cells.
In vitro granzyme B
For each experiment, Hepa1–6 cells were lifted and 1×10⁶ cells/replicate for each treatment condition were lysed in 50 μl of 1% TritonX-100. Purified recombinant murine granzyme B (PeproTech Cat: 140–03) was then added at the indicated amounts (0.2, 0.4, or 0.8 μg) and incubated with the lysates for 1 hour at room temperature. A small volume (10 μl) was removed at the end of the hour to validate the cleavage of caspase-3 and -7 by Western blot. Then 50 μl containing 1×10⁶ L. monocytogenes was added and incubated at room temperature. Small volumes of lysate were dilution plated over 16 hours to quantify possible effects on bacterial viability in the presence of granzyme B, active caspase-3, and active caspase-7.
Western blots
The amount of total protein from organoid lysates were normalized in BCA kit (Pierce) and were resolved on NuPage precast 4%–12% Bis-Tris gels (Invitrogen) and were transferred to polyvinylidene difluoride membranes. After blocking in 2% BSA/TBST for 40 mins at RT, primary antibody was added and incubated overnight at 4°C. Caspase-3 cleavage was analyzed using a cleavage-specific antibody (1:500, Cell Signaling #9661). Caspase-7 cleavage was analyzed using a cleavage-specific antibody (1:500, Cell Signaling #9491). Caspase-1 cleavage (1:200, Santa Cruz #sc-514 clone M-20), caspase-8 cleavage (1:500, Cell Signaling #8592), caspase-9 cleavage (1:400 Cell Signaling #9504) was detected using those antibodies. Gasdermin D was analyzed using an antibody detecting both full length and cleaved form (1:500, Abcam #ab209845). GAPDH (1:1000, Cell Signaling #97166) was detected as internal control. After washing in TBST three times, secondary antibody was added and incubated for 2 hours at RT. Secondary horseradish peroxidase (HRP)-conjugated anti-rabbit antibody were purchased from Cell Signaling (1:2000, Cell signaling #7074). After three washes in TBST, signals were developed with ECL substrates (ThermoFisher Scientific) and analyzed.
For the detection and validation of ASM, ASM-knockout HeLa cell lines were generated with CRISPR-Cas9 technology at the Duke Functional Genomics Core. Two-guide RNA targeting was used (target sites; 5’-GAACCCAATGTGGCTCGCGT-3’ and 5’-ACAATGGATTGGCACACGGC-3’).
For the detection of ASM in IECs, organoids were isolated from ECM and washed three times in PBS with low-speed centrifugation (850 rpm X 1mins). After dead cell removal, each organoid from various genotypes was separated equally into 2 parts, then treated with or without FlaTox and both incubated for 20 mins at 37°C. After incubation, organoids are collected and lysed, then ASM is detected (1:1000, Invitrogen #PA-5 72432).
ASM was deglycosylated with PNGase F (New England BioLabs #P0704) per the manufacturer’s protocol. Briefly, lysates were denatured with at 100°C for 10 minutes in Glycoprotein Denaturing Buffer, chilled and centrifuged quickly, then incubated with PNGase F in GlycoBuffer at 37°C for 1 hour. After the reaction, ASM was detected by western blot.
QUANTIFICATION AND STATISTICAL ANALYSIS
Histological scoring
For S. typhimurium infection, histology was assessed using a modified scheme adapted from Barthel et al.46. Slides were blind scored (0 to 3) for each of four criteria: epithelial hyperplasia and damage; immune infiltrate into the mucosa and lamina propria; goblet cell loss; and submucosal edema. The average score of four criteria was then calculated. For DSS experiments, slides were blind scored based on Cooper et al.54. Three major criteria (0 to 3): crypt hyperplasia, inflammatory cell infiltration, and muscle thickening. Two minor criteria (0 to 1): goblet cell depletion and crypt abscess. These criteria were added together.
For Immunofluorescence quantification in Intestine
For the quantification of cleaved caspase-7 positive cell, cleaved caspase-3 positive cell, and EpCAM positive cells, 60 to 90 fields with 40× Lenz in each mouse sample randomly examined and the number of DAPI+caspase-7+ cells, DAPI+caspase-3+, or DAPI+EpCAM+ cells was counted.
For immunofluorescence quantification in liver
For both C. violaceum and L. monocytogenes infections, Inflammatory foci / lesions were easily identifiable by visualization of abundant immune cell nuclei in the DAPI channel, and random lesions were selected for multi-channel pictures. These were split into single channel images and regions of interest (ROI) were drawn around the foci using the DAPI channel as a guide (in ImageJ); thus, we were blinded for cleaved caspase-7 intensity. The ROI was copied to the single channel image with cleaved caspase-7 and the integrated density was measured. Background integrated density (defined as the signal in an area outside the lesions) was subtracted for the reported values.
In order to analyze C. violaceum-infected liver images, multiple 10X pictures were stitched together due to the large size of the lesions, and two lesions per mouse were quantified for cleaved caspase-7 signal (Extended Data Figure 9a–b, quantification in c). The number of CPS1, cleaved caspase-7 double positive cells were determined in Extended Data Figure 9d. This was done by drawing a ROI encompassing 45 cells on the CPS1 single channel image and copying it to the cleaved caspase-7 single channel image. The percentage of double positive cells was calculated for one region per IL-18-treated mouse, with 6 regions scored and plotted as the mean with standard deviation. Cleaved caspase-7 positive cells were scored as CPS1-positive or –negative.
Cleaved caspase-7 signal was quantified from 5 lesions per mouse for L. monocytogenes-infected livers at 20X magnification (Extended Data Figure 12d, quantification in g). The percentage of cleaved caspase-7 positive signal colocalizing with L. monocytogenes staining was determined in Extended Data Figure 12i from 3 lesions per mouse.
Organoid quantification
For organoid rupture counting experiment, 10–20 organoids after FlaTox treatment were tracked for 2–3 hours in each live imaging experiment to determine the rupture behavior of them. When the organoid architecture collapsed and the inner content of the organoid composed mostly of extruded IECs increased and ruptured into the exterior of the organoid, this is determined as one ruptured organoid. All the ruptured organoids were counted and calculated as one rapture ratio shown as one indicative dot in the graphs, and then pooled and combined.
For examining the extrusion starting time, the time when total 4 cells in one organoid started extrusion was recorded as extrusion initiation time of that organoid in order to exclude the non-specific (homeostatic) epithelial extrusion.
For examining the PI/calcein intensity of the organoid, single plane imaging was performed for 1.5–6 hours at 180–480s intervals just after FlaTox or TNF+CHX treatment. ImageJ software (NIH) was used to measure the Mean Intensity of each organoid in hyperstuck image and the average of the Mean Intensity in each time point was calculated.
Expression Data Analysis
For BioGPS expression data, the indicated genes were used as queries (www.biogps.org)6. Mouse data from Dataset: GeneAtlas MOE430, gcrma was selected7, and the raw data downloaded from the download tab. Selected organ data were graphed. Mean and SEM are shown of 2 datapoints. For purified IEC expression data, the dataset GDS3921[ACCN] was searched in the GEO Dataset Browser at NCBI (https://www.ncbi.nlm.nih.gov/gds). This dataset is expression data from purified IECs previously published by Reikvam7. Indicated genes were used as search terms for this dataset, and on the results page the graph image was selected to access the raw data page. Raw data from the value (count) chart was collated and plotted from the control mice that were not treated with antibiotics. Antibiotic treated mouse data is not shown but results were equivalent. Mean with SEM are shown from 6 datapoints.
Statistics
Error bars represent the standard deviation of technical replicates and bars indicate median. Two-tailed unpaired t-test, two-tailed Mann-Whitney U test, one way ANOVA with Tukey’s multiple comparison test, and log rank Mantel Cox test were used for statistical analysis. P values of ≤ 0.05 were considered significant. Statistical analysis was performed using GraphPad Prism v5 and v8 software and Microsoft Excel 2013.
Data Availability
All relevant data are included in the Article or its Supplementary Information and Source Data files. More details are available from the corresponding authors upon request.
Extended Data
Extended Data Figure 1. Caspase-7 is required for efficient IEC extrusion during S. Typhimurium infection.
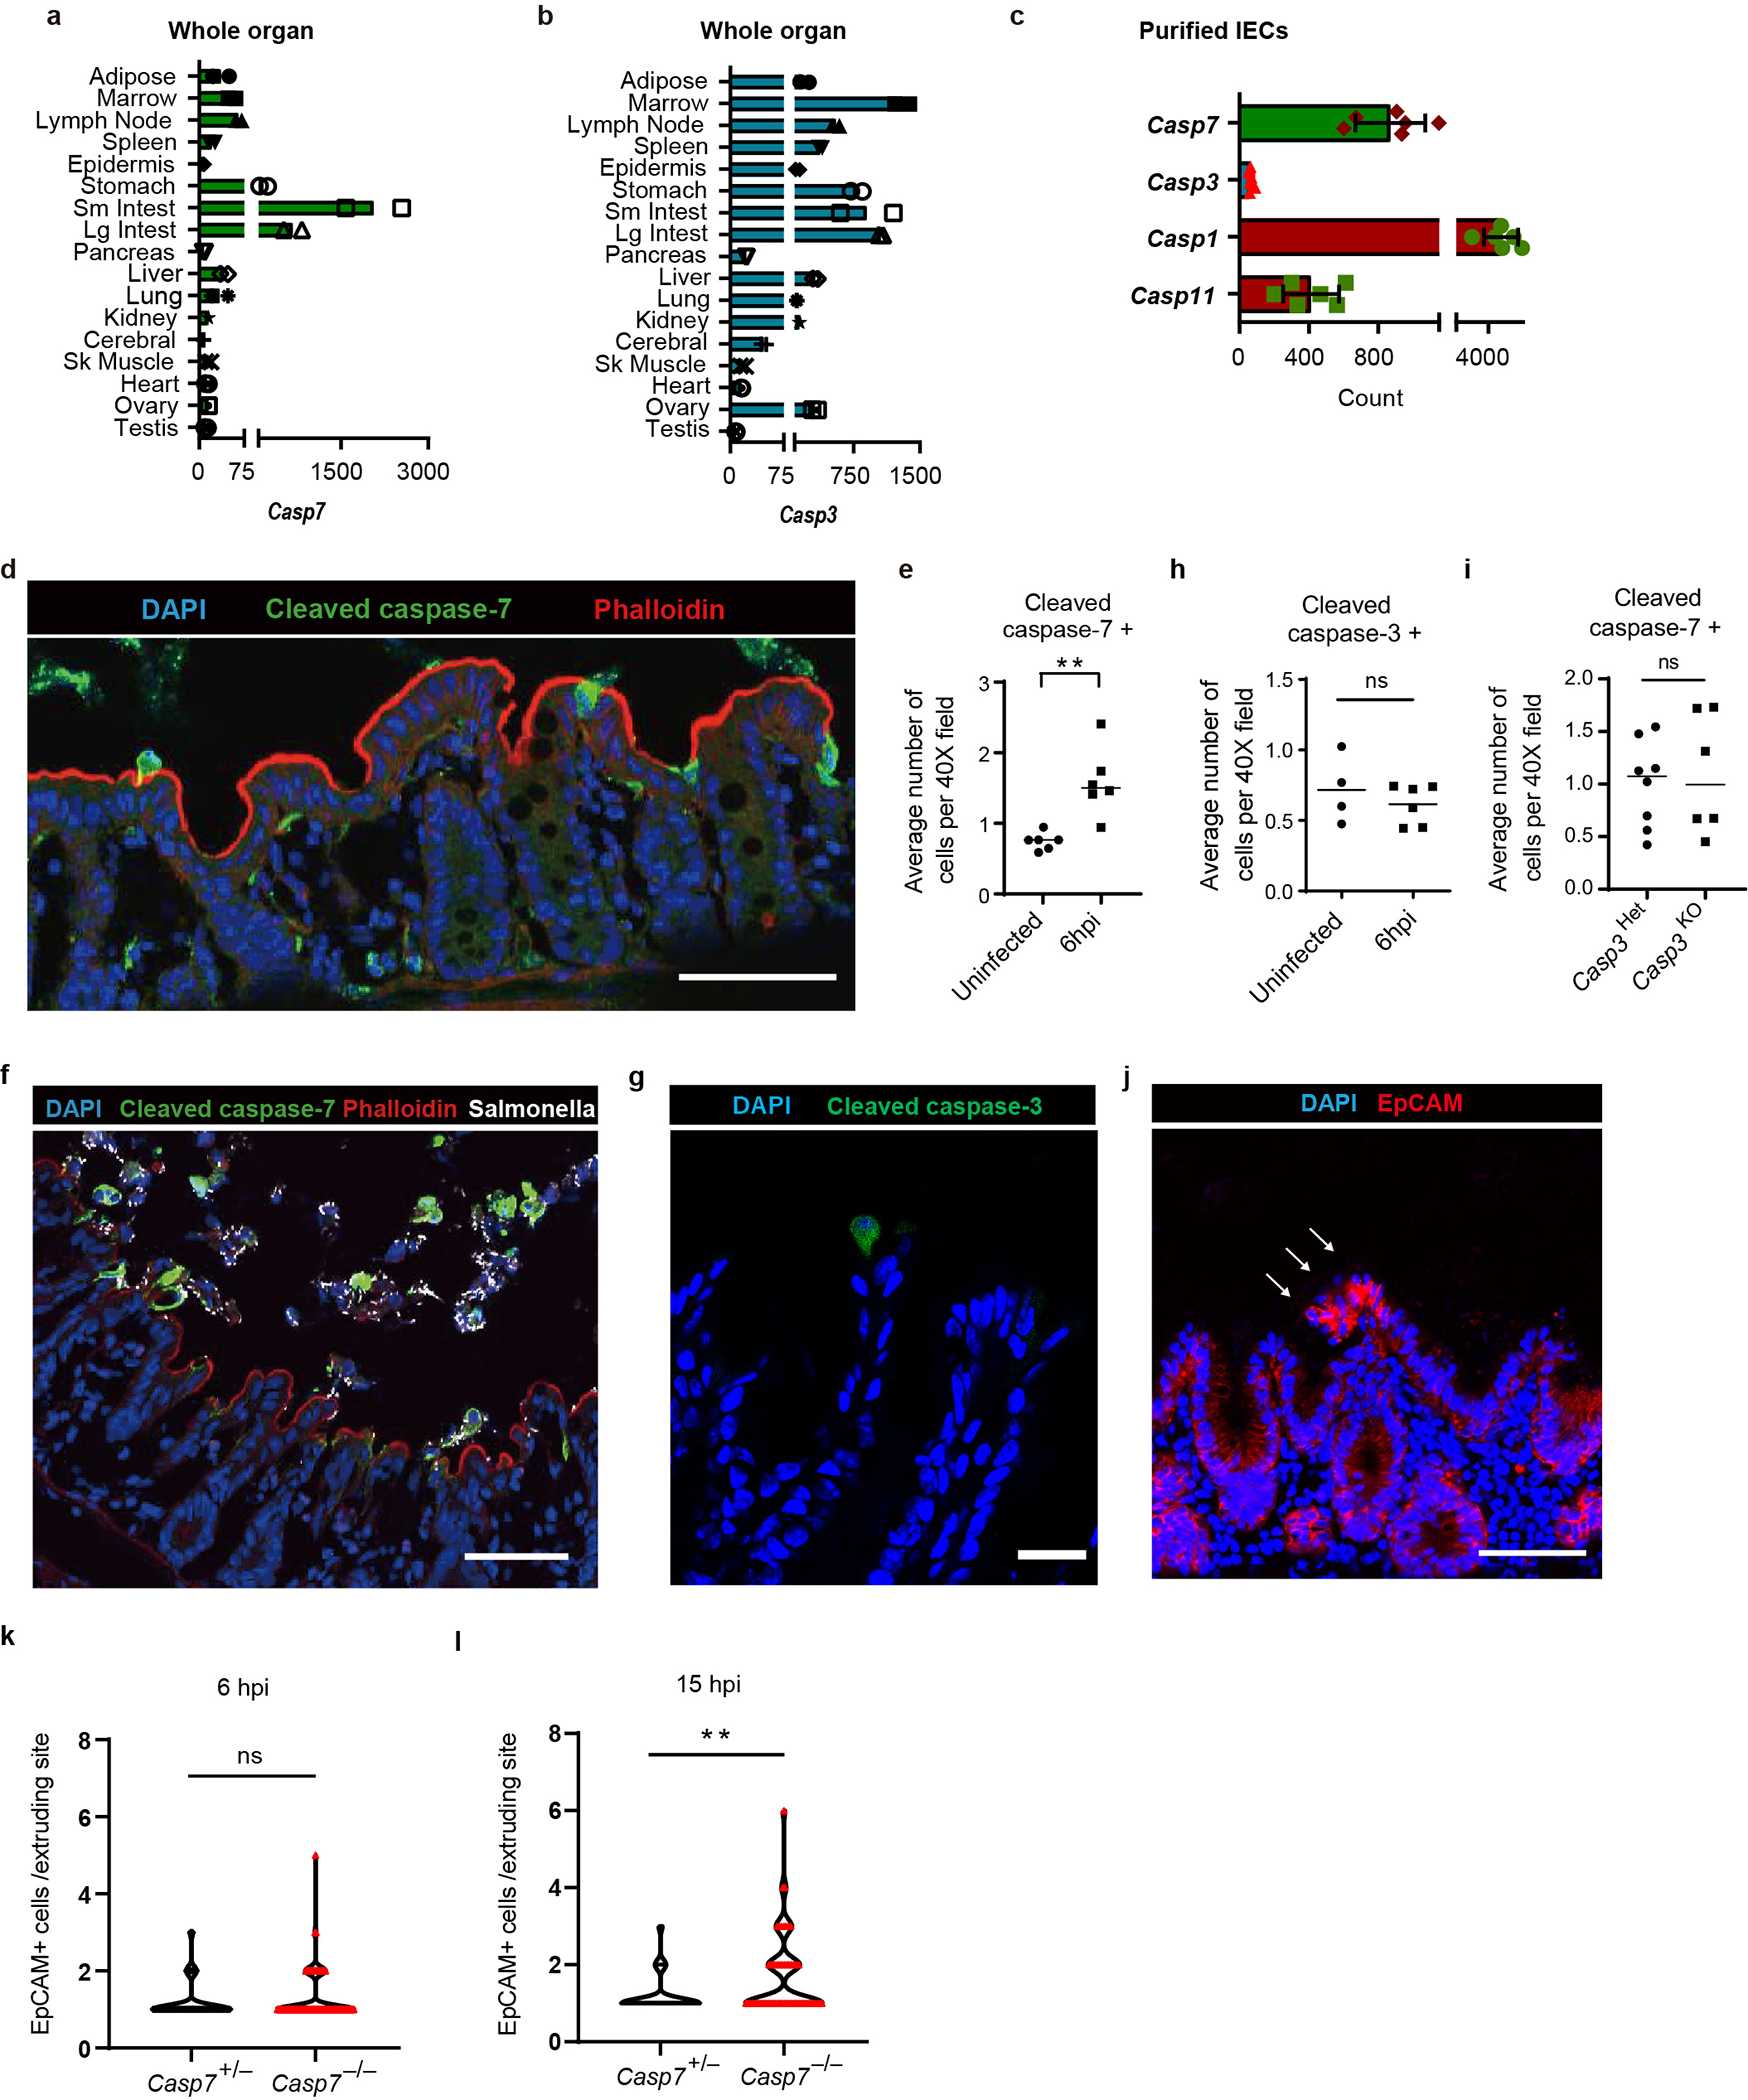
a-b, Caspase-7 and caspase-3 mRNA levels in various tissues from n=2 samples were examined using BioGPS (biogps.org)6. c, Caspase-7, caspase-3, caspase-1 and caspase-11 expression levels in isolated IEC from n=6 samples were determined by from published transcriptome data7. d-e, Representative image (d) of cleaved caspase-7 staining of cecum from WT mice 6 hours post infection (hpi) with 106 S. Typhimurium and its quantification with uninfected control (uninfected mice (n=6) and infected mice (n=6)) (e). f, Cleaved caspase-7 staining of cecum from WT mice 12 hpi with 106 GFP-S. Typhimurium. g-h, Representative image (g) of cleaved caspase-3 staining of cecum from WT mice 6 hpi with 106 S. Typhimurium and its quantification with uninfected control (uninfected mice (n=4) and infected mice (n=6)) (h). I, Quantitation in as in (d) for littermate controlled Casp3+/− (n=8) and Casp3−/− mice (n=6). j, EpCAM staining of cecum from Casp7−/−mice 24 hpi with 5×10⁶ S. Typhimurium (➝, extrusion site with 18 clustered cells was one of the largest observed, related to fig. 1a–b). k-l, quantitation of EpCAM+ cells per extruding site in cecum from littermate Casp7+/− and Casp7−/− mice 6 hpi (k) or 15 hpi (l) with 5×10⁶ S. Typhimurium; from the same experiment as the 24 hpi time point in Fig. 1b. Data are representative of 2 experiments (e, h, i), 3 experiments (d, f, g) or 1 experiment (a-c, k, l). Scar bar = 50 μm. *P < 0.05, **P < 0.01, ***P < 0.001, ****P < 0.0001 (Two-sided Mann-Whitney U test). Data are shown as median ± SEM. Exact p values in Source Data EDF1.
Extended Data Figure 2. Caspase-7 facilitates IEC extrusion after FlaTox treatment.
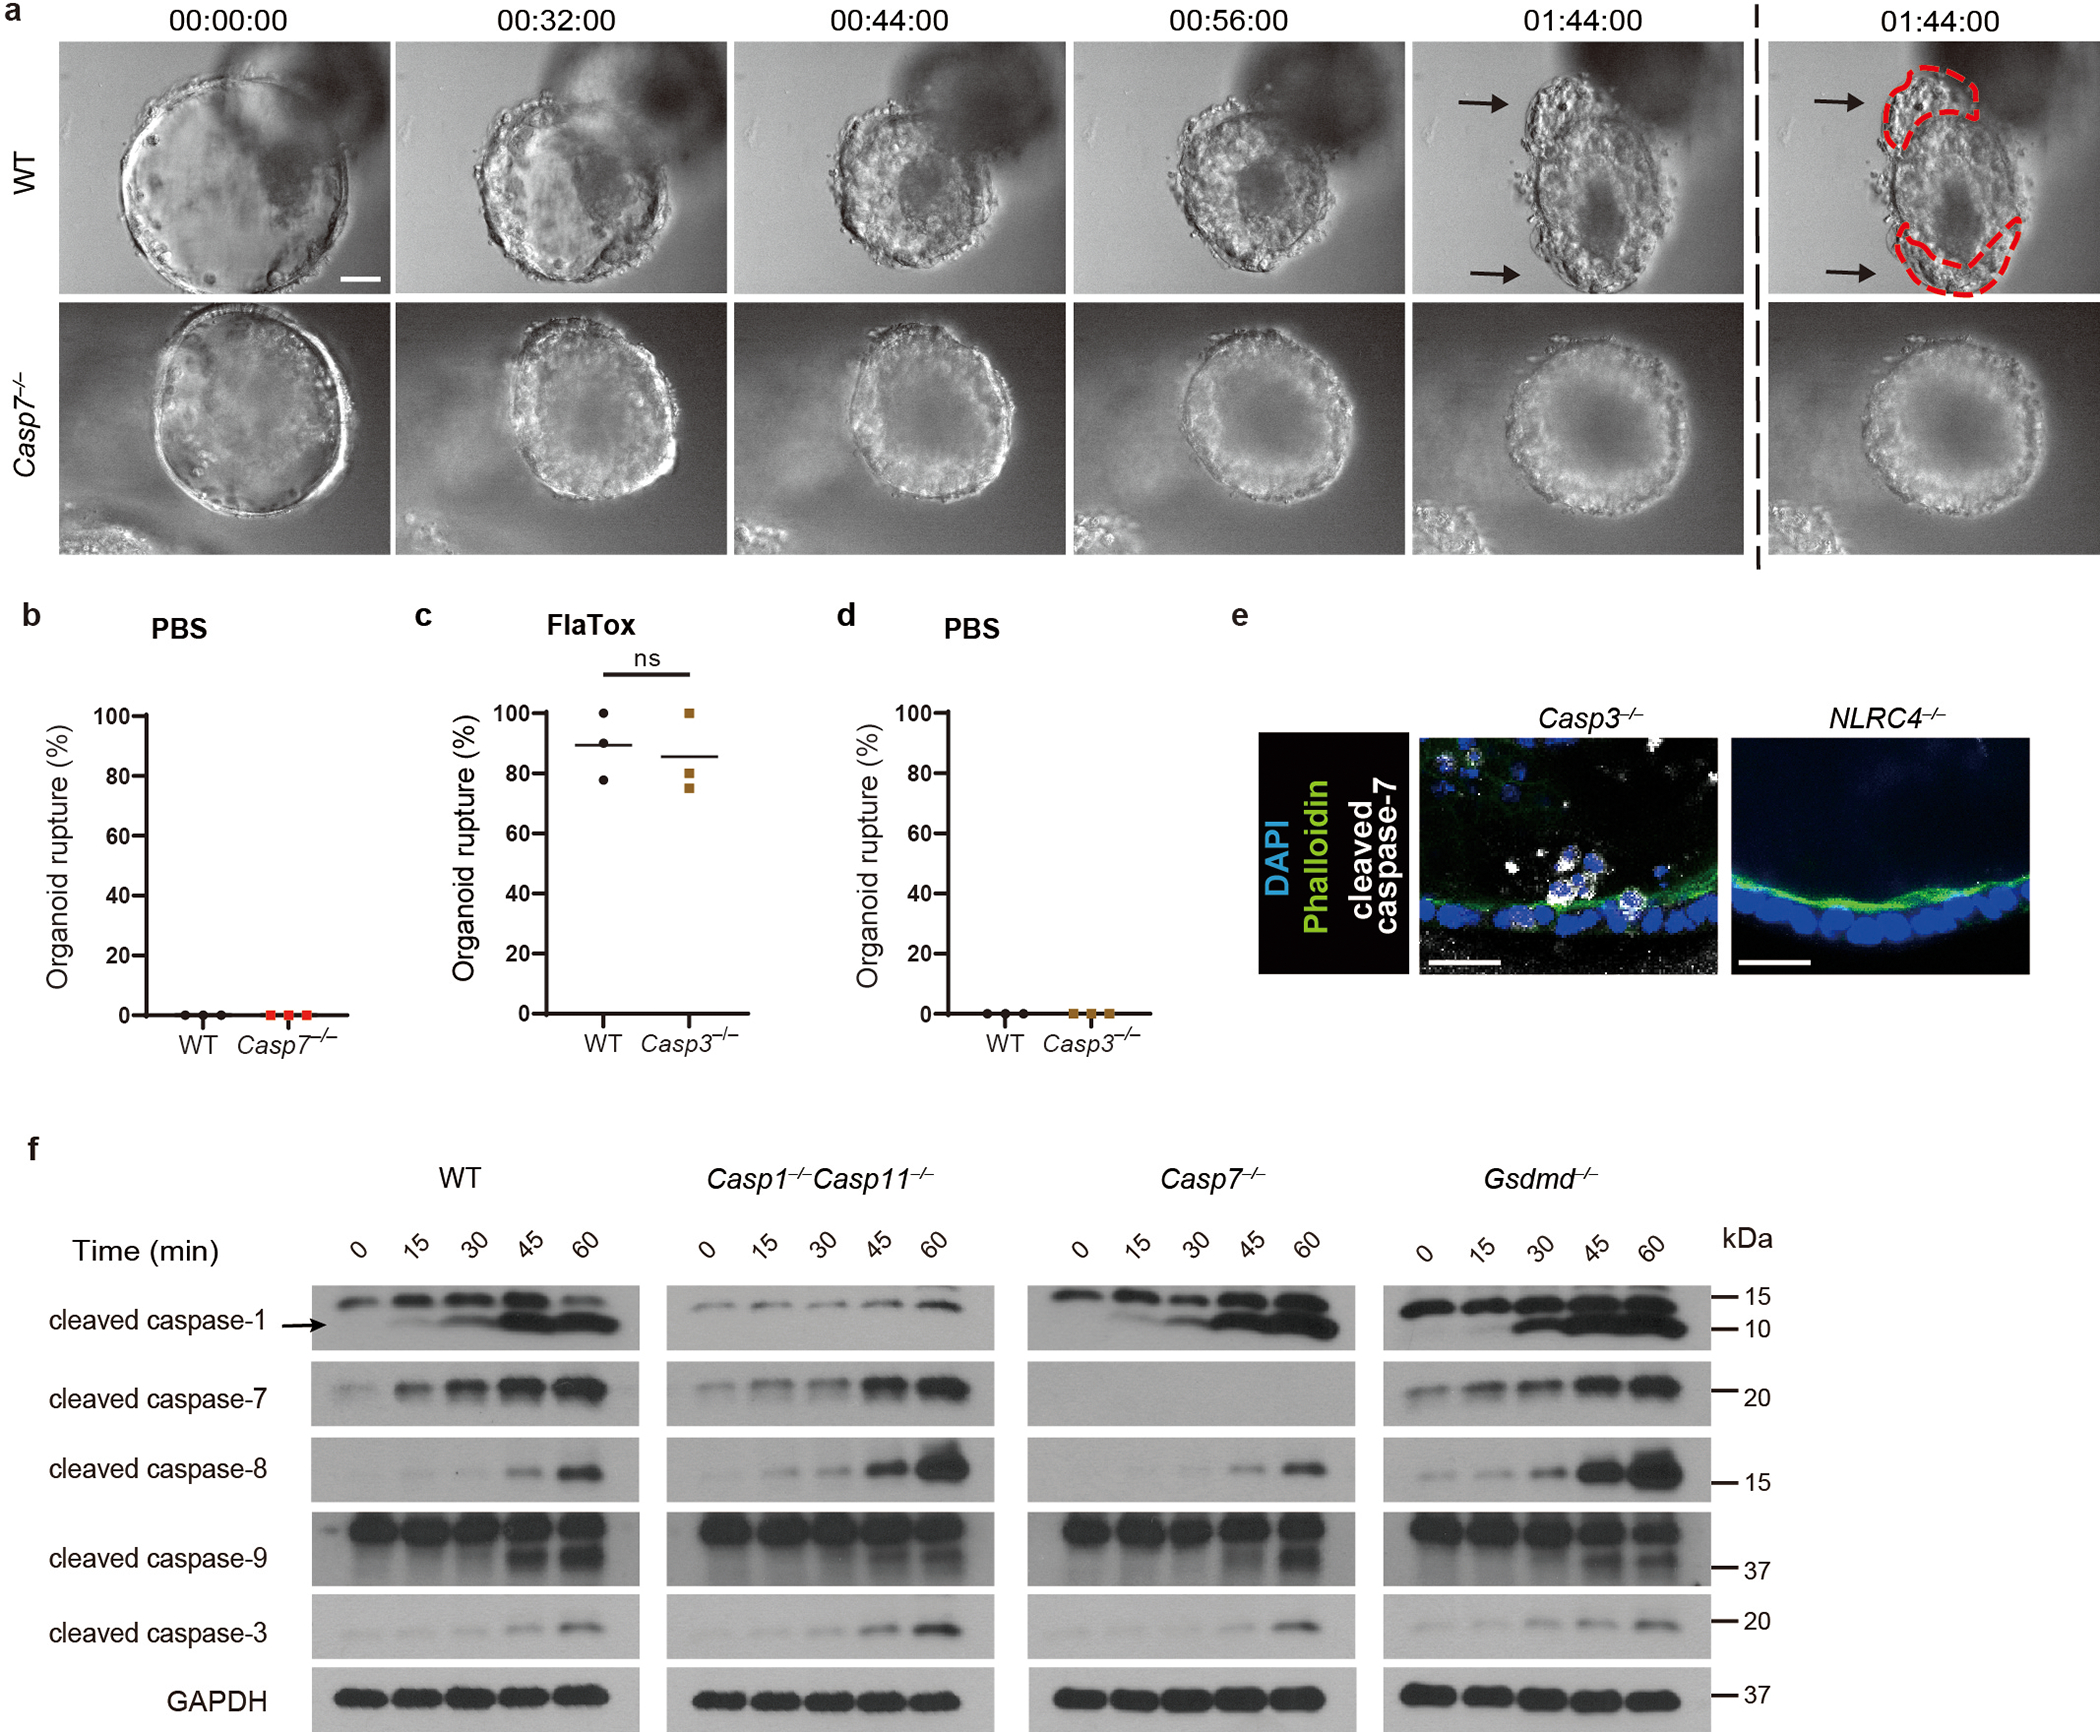
a, Representative images of WT and Casp7−/− organoids after FlaTox treatment in 12 pooled experiments. b, Percentage of ruptured WT and Casp7−/− organoids after PBS treatment in pooled live imaging experiments. c-d, Percentage of ruptured WT and Casp3−/− organoids after FlaTox (c) or PBS (d) treatment in pooled experiments. e, Representative images of indicated organoids 30 min after FlaTox treatment, stained with phalloidin and for cleaved caspase-7 (Related to Fig. 1d). f, Immunoblot of IEC organoids treated with FlaTox probed for the indicated caspases. Data are representative of 3 experiments (e, f) or pooled from 12 (a), or 3 (b-d) experiments. Scar bar = 20 μm. *P < 0.05, **P < 0.01, ***P < 0.001, ****P < 0.0001 (Two-sided unpaired t test). Data are shown as mean ± SEM. Exact p values available in Source Data EDF2.
Extended Data Figure 3. Caspase-7 prolongs membrane integrity against gasdermin D pores.
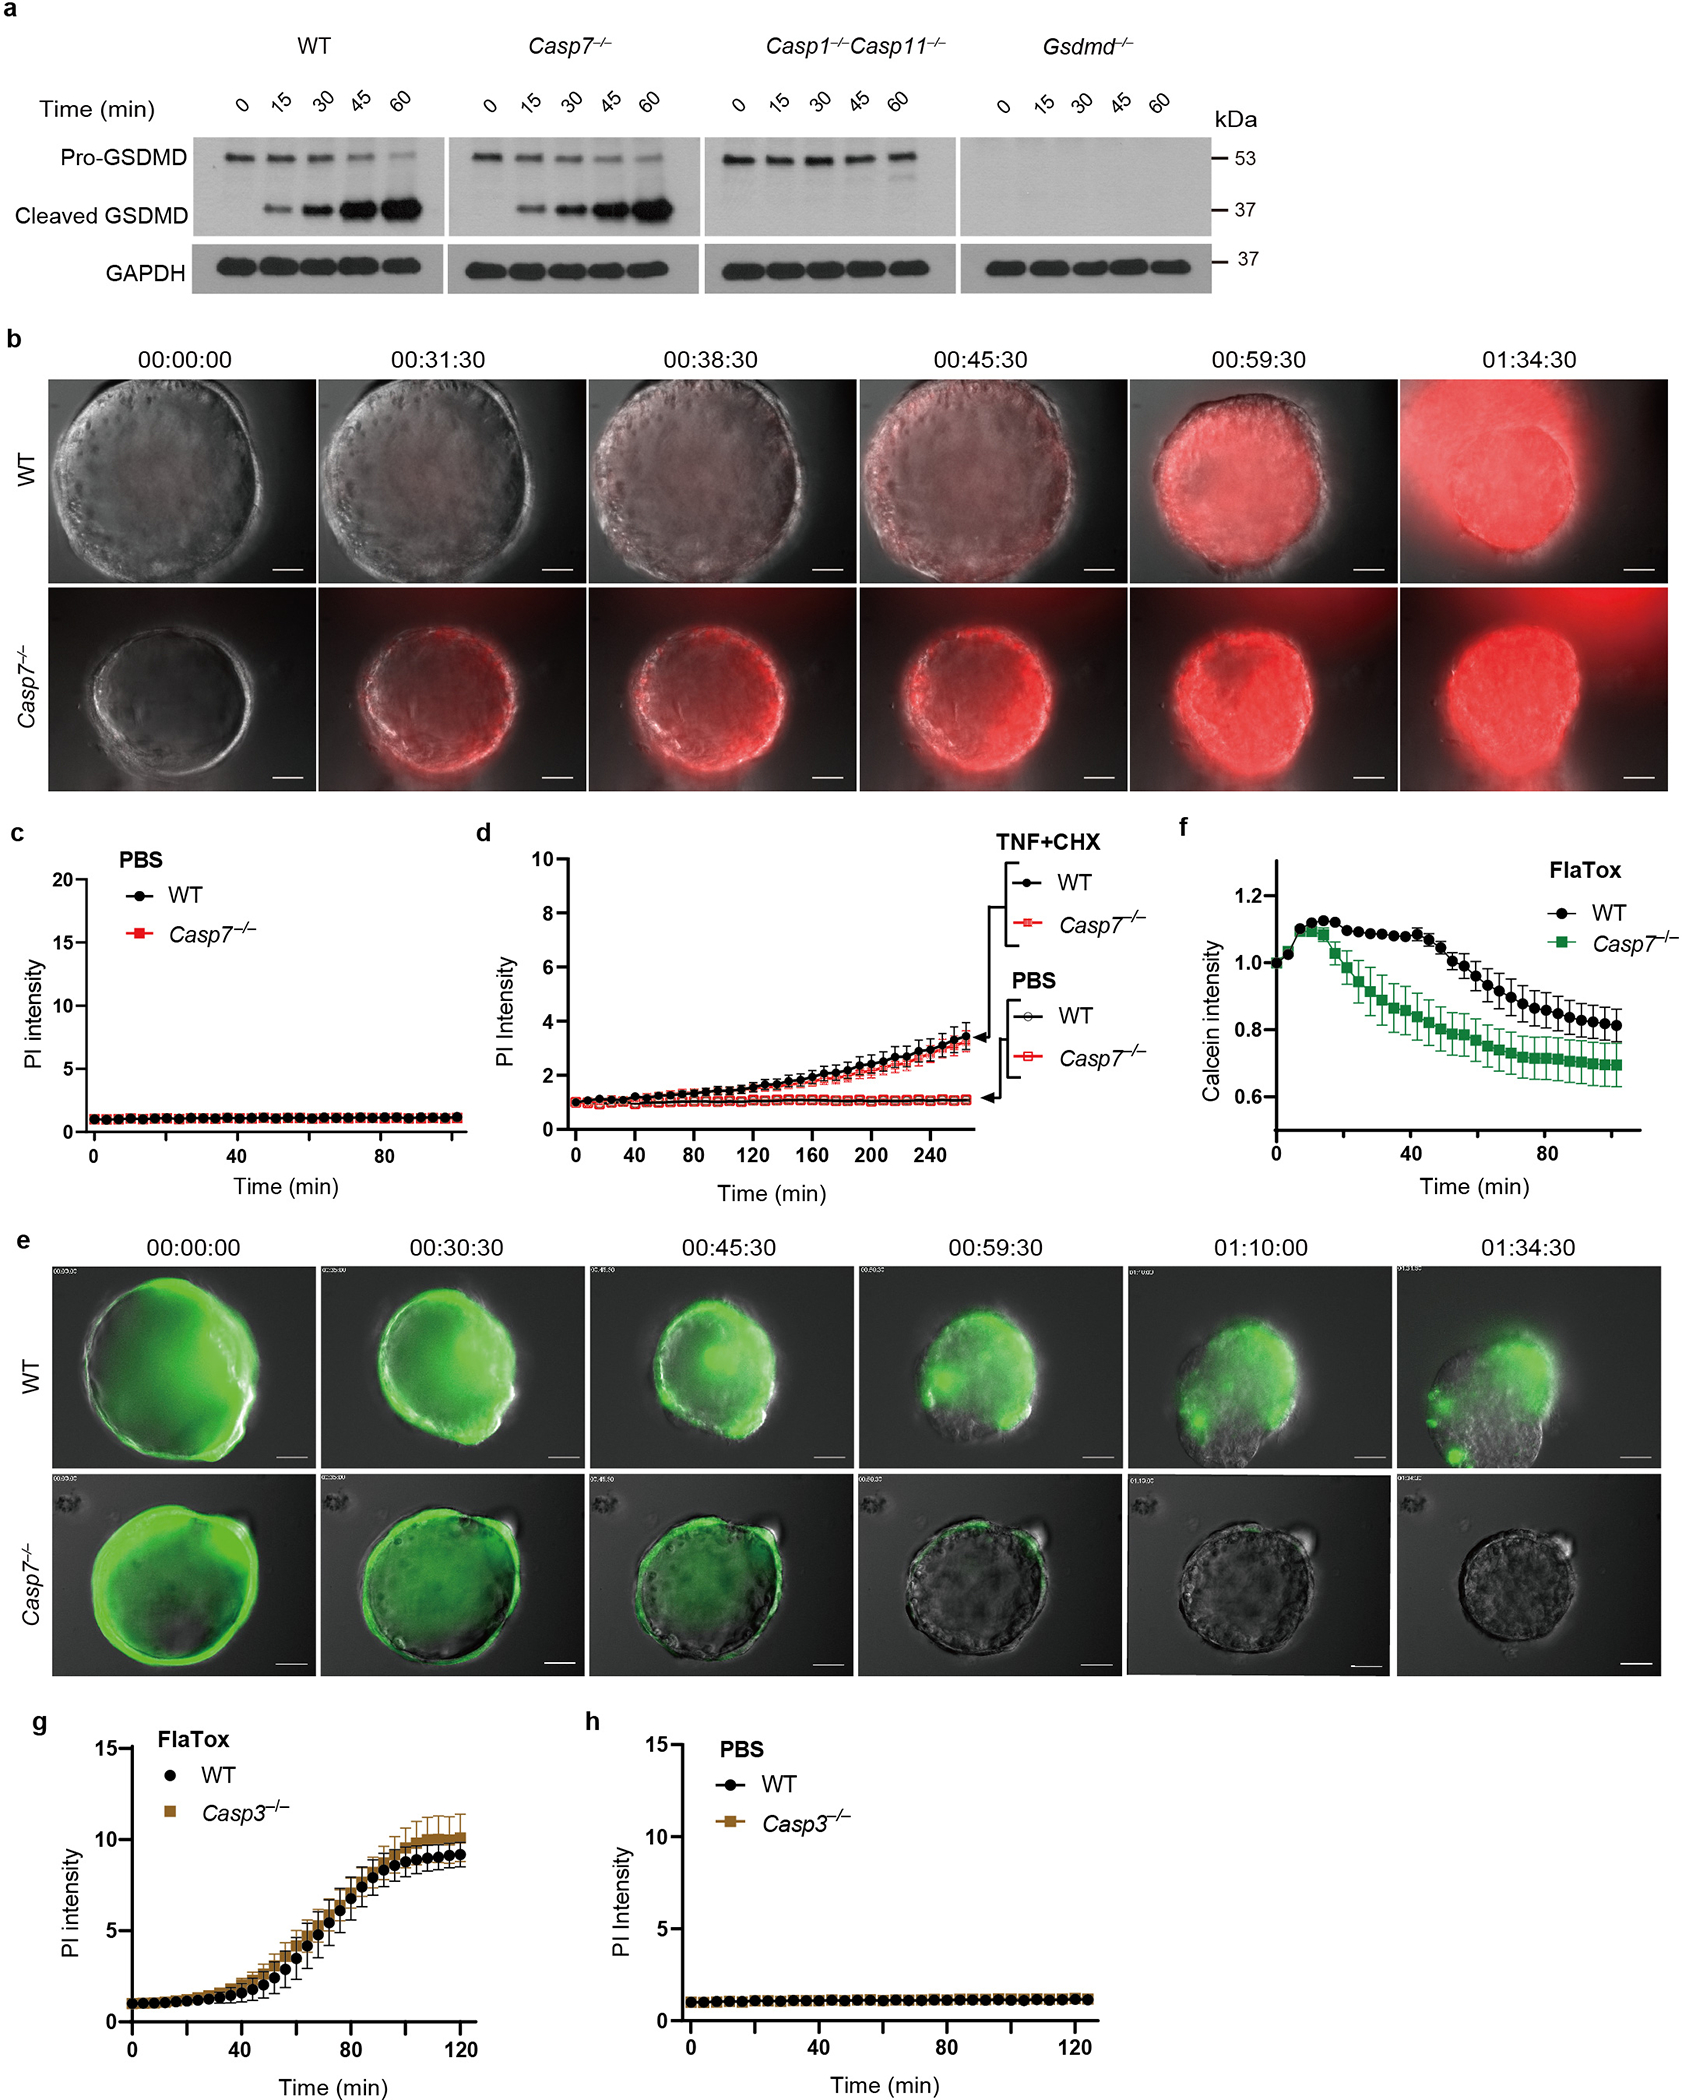
a, Gasdermin D (GSDMD) cleavage in organoids treated with FlaTox. b, Representative images in live cell imaging showing PI intensity of WT and Casp7−/− organoids treated with FlaTox. c-d, Quantitation of PI intensity in live cell imaging of WT and Casp7−/− organoids treated with PBS (c) or TNF + cycloheximide (CHX) or PBS control (d). e-f, Representative images (e) and quantitation (f) in live cell imaging of calcein intensity of WT and Casp7−/− organoids treated with FlaTox. g-h, Quantitation in live cell imaging of PI intensity of WT and Casp3−/− organoids treated with FlaTox (g) or PBS (h). Data are representative of 3 experiments. Scar bar = 50 μm. *P < 0.05, **P < 0.01, ***P < 0.001, ****P < 0.0001 (Two-way ANOVA with Sidak’s post-hoc test). Data shown as mean ± SEM. Exact p values in Source Data EDF3.
Extended Data Figure 4. ASM cleavage by caspase-7 requires gasdermin D.
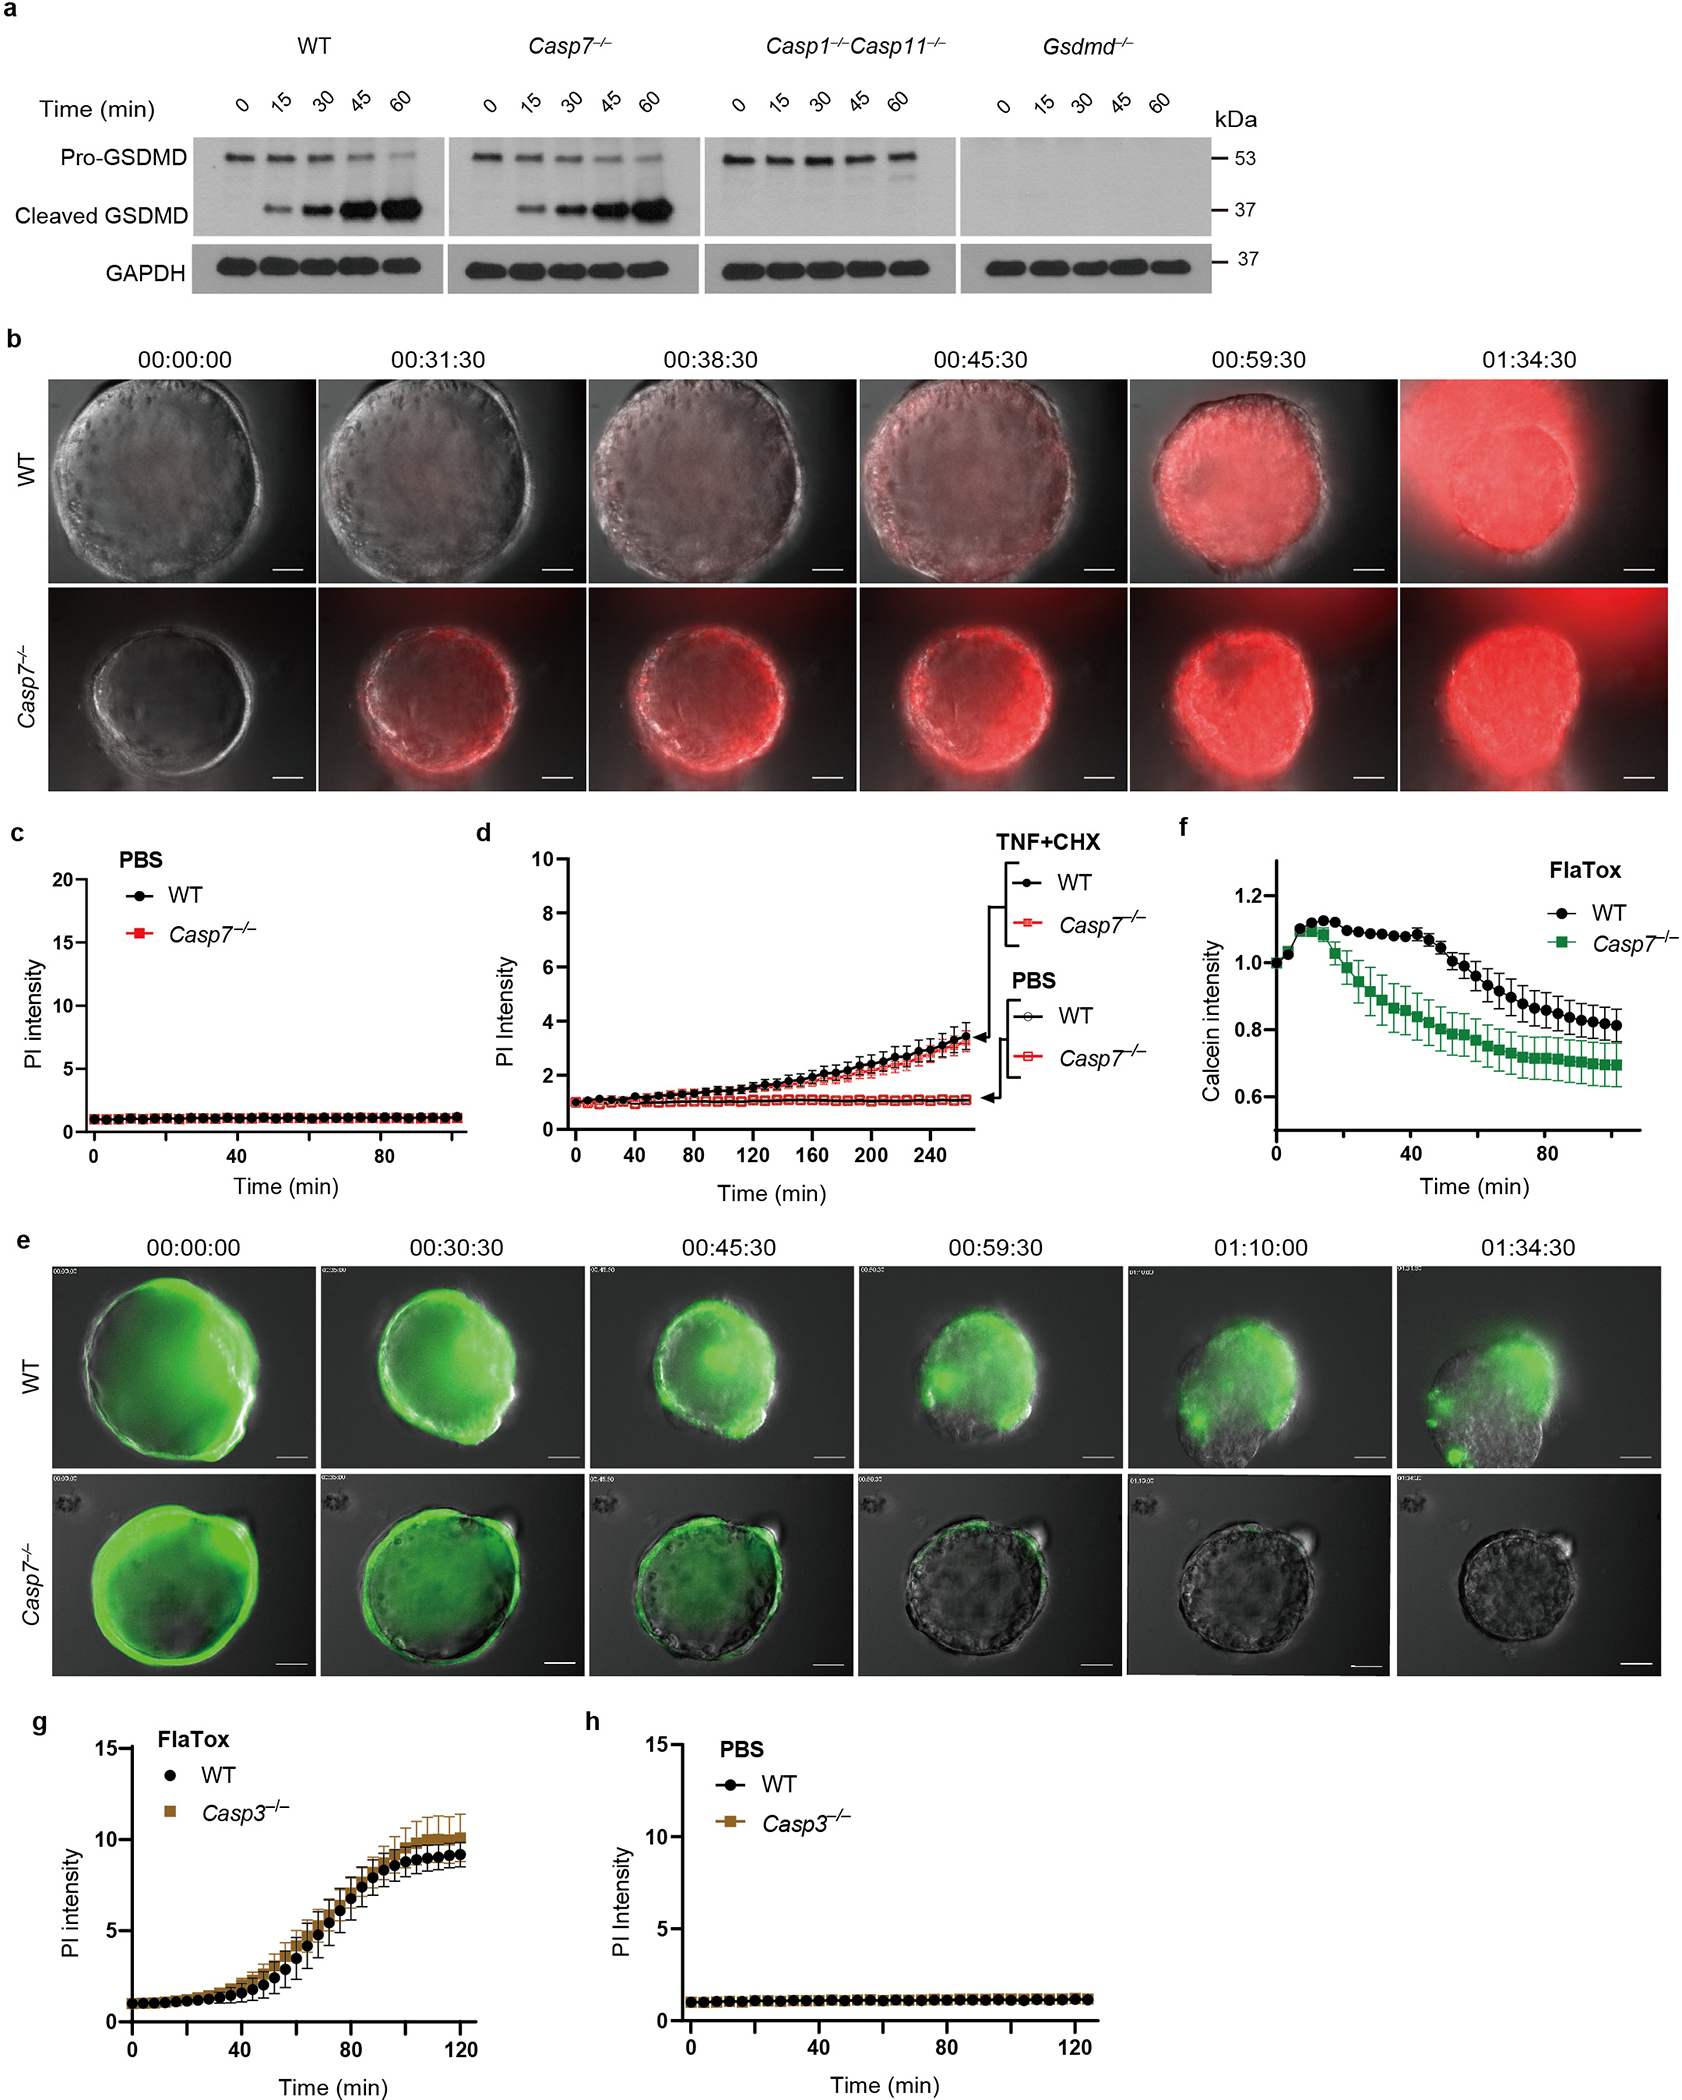
a, Validation of ASM antibody performed by immunoblot of Crispr/CAS9 targeted HeLa cells. b-d, ASM cleavage of organoids that were removed of dead cells and stimulated 20 min with FlaTox. (b) organoid cells were split into 3 tubes, one for T=0 without stimulation (left blots, shorter 30 sec exposure and longer 2 min exposure) and two for 20 min PBS or FlaTox treatment (right blot, shorter 30 sec exposure). (c) ASM cleavage from WT, Casp3−/−, or Nlrc4−/− organoids. (d) WT organoid lysates treated with FlaTox in (b) was mock or treated with PNGase F to remove glycosylation; a band shift excludes the possibility that the 57 kDa band represents a deglycosylation event of pro-ASM. Data are representative of 3 experiments.
Extended Data Figure 5. Caspase-7 activates ASM to generate ceramide.
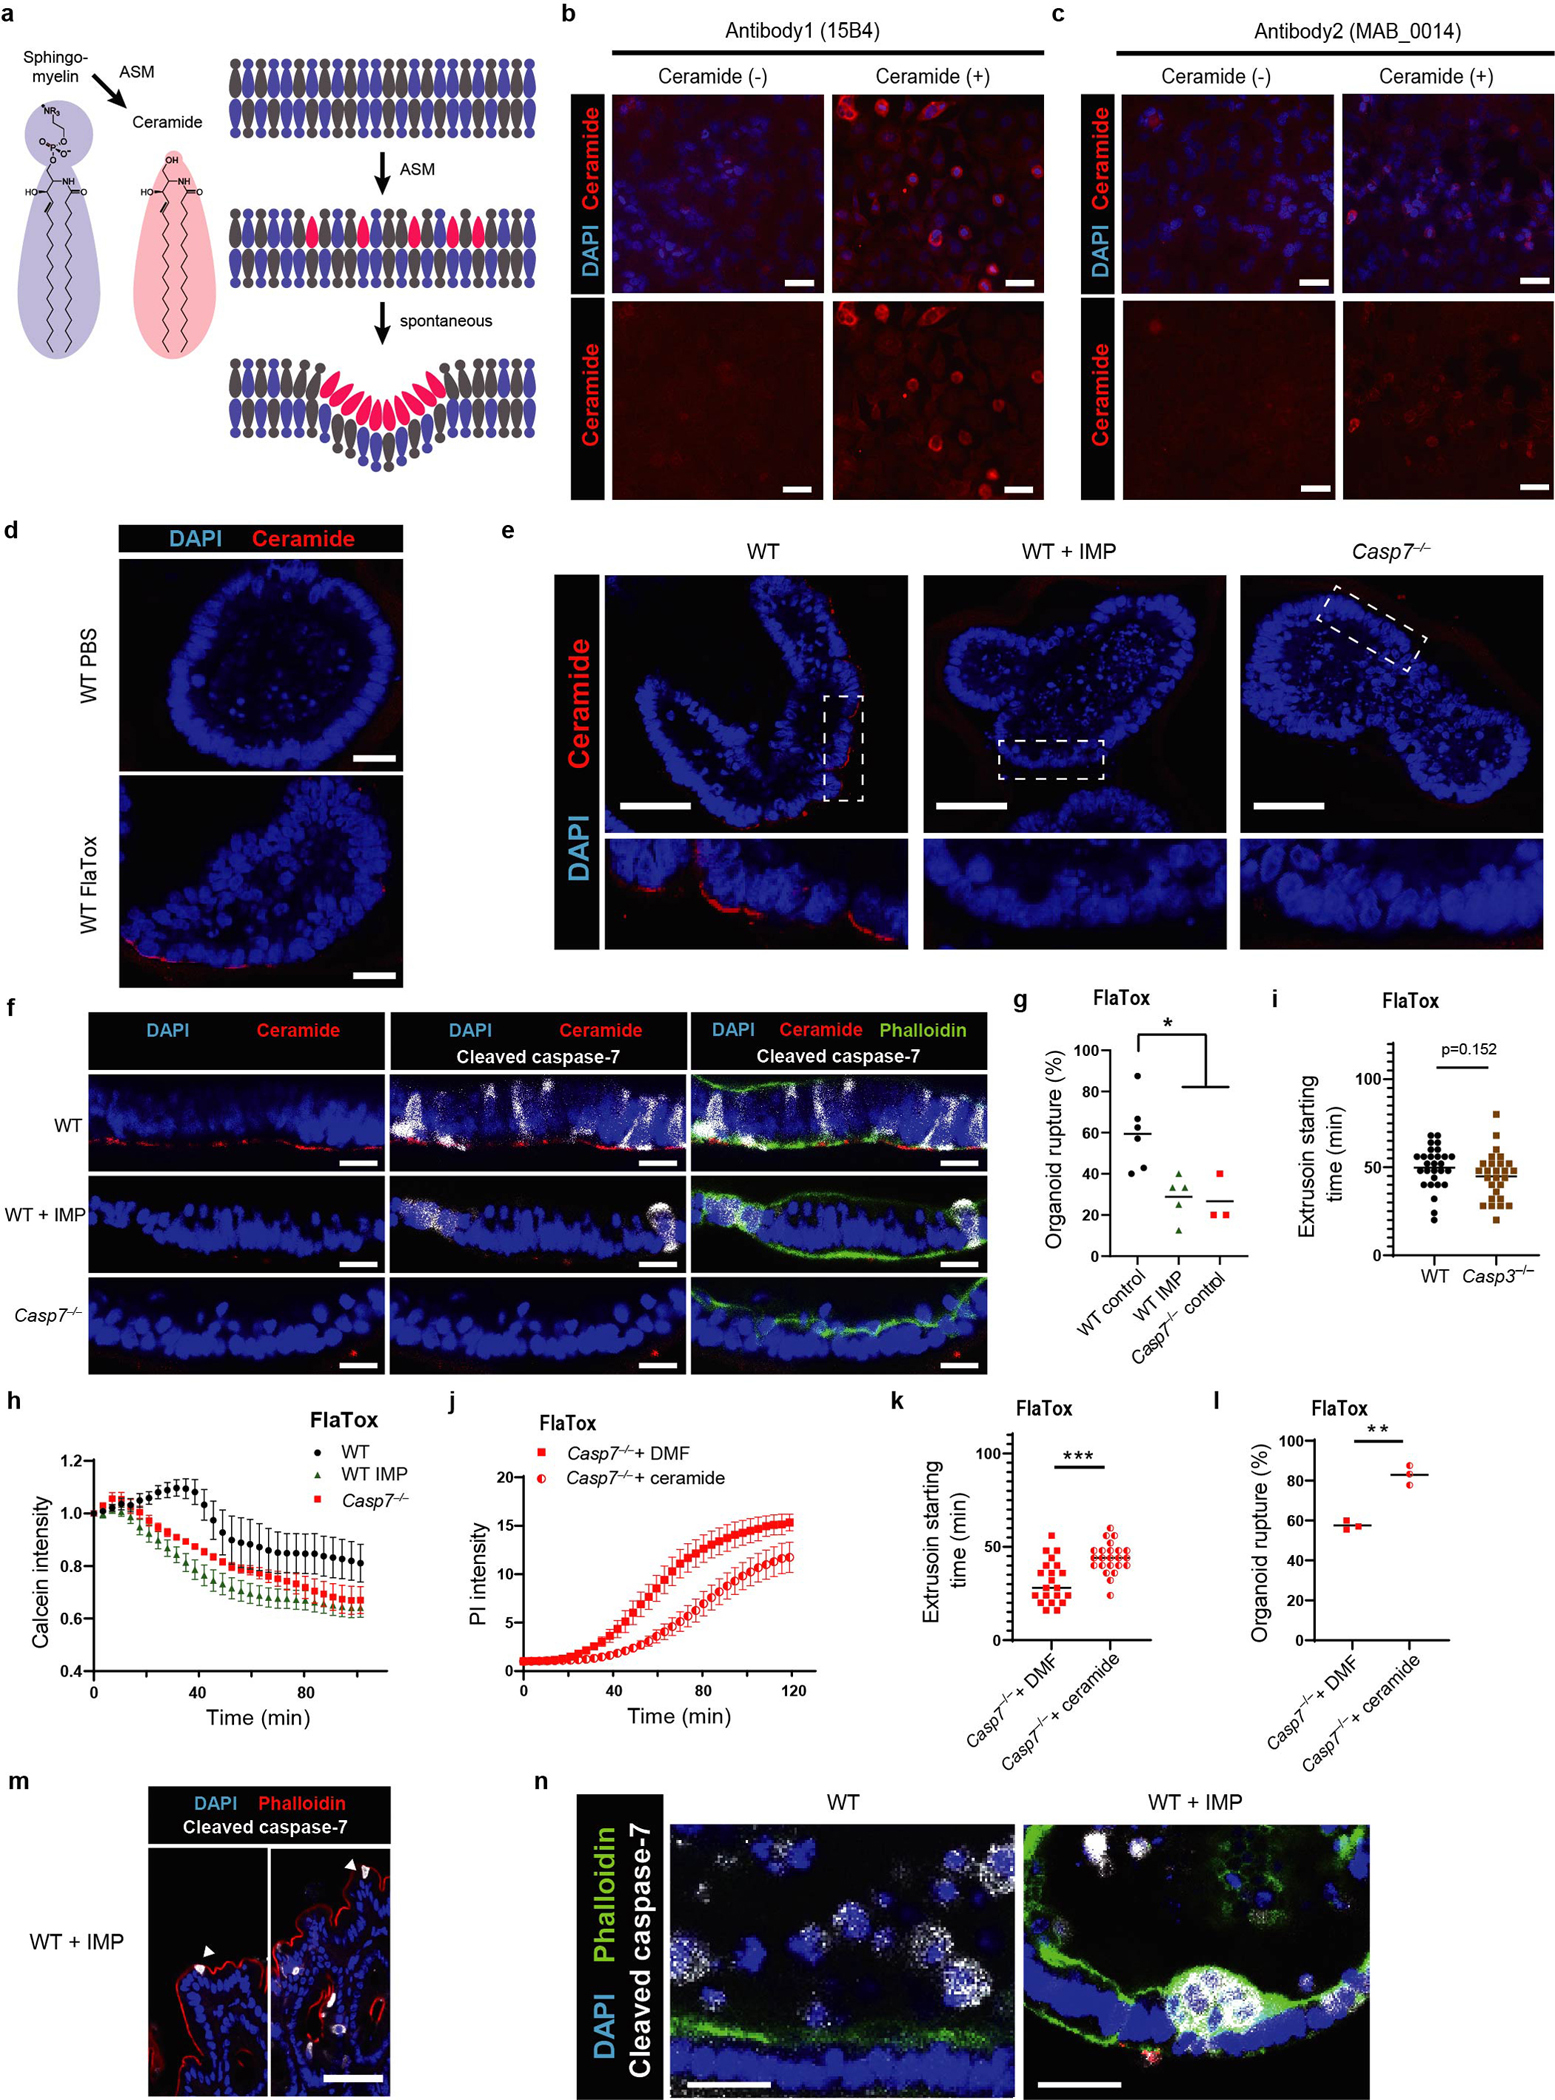
a, Established mechanism whereby sphingomyelin is cleaved by ASM to generate ceramide, a lipid that naturally invaginates membranes to drive membrane repair via endocytosis (adapted from (Andrews et al, 2014)10). b-c, Ceramide specificity of anti-ceramide antibodies was validated by treating HeLa cells with exogenous C-16 ceramide for 2.5 hours followed by staining with the anti-ceramide antibodies 15B4 (b) or MAB_0014 (c). d, Ceramide staining of WT organoids at 20 mins post PBS or FlaTox. e, Ceramide staining of organoids at 20 min post FlaTox, with inset expanded images of the boxed areas. f, Ceramide and cleaved caspase-7 staining of indicated organoids at 20 min post FlaTox. g-i, Live imaging of indicated organoids after FlaTox treatment, quantitated for rupture percentage (g), calcein intensity (h), or extrusion starting time (i). j-l, Live imaging of indicated Casp7−/− + dimethylformamide (DMF) or vehicle or Casp7−/− + ceramide organoids after FlaTox treatment with quantitation of PI intensity (j), extrusion starting time (k), or rupture percentage (l). m, Cleaved caspase-7 staining of cecal tissues from IMP treated WT mice 24 hpi with 5×10⁶ S. Typhimurium, related to fig. 2d (➤ indicates cleaved caspase-7+ cells that appear stuck in the monolayer and lack normal extrusion morphology). n, Cleaved caspase-7 staining of WT and WT+IMP organoids at 30 min post FlaTox. Data are representative of 2 experiments (b, c) or 3 experiments (d-f, j, m-n), or are pooled from 3 experiments (h, l). For (g), live Imaging of WT (n=6 datasets), WT+IMP (n=5 datasets), and Casp7−/− (n=3 datasets) organoids pooled from 7 experiments were analyzed. For (i), WT (n=28) and Casp3−/− (n=27) organoids pooled from 3 experiments were analyzed. For (k), Casp7−/− + DMF (n=21) and Casp7−/− + ceramide (n=23) organoids pooled from 3 experiments were analyzed. Scar bar = 20 μm (b-d, f, n), 50 μm (e, m). *P < 0.05, **P < 0.01, ***P < 0.001, ****P < 0.0001 (Two-sided unpaired t test in (g, i, k, l), two-way ANOVA with Tukey’s post-hoc test in (h) or with Sidak’s post-hoc test in (j)). Data are shown as mean ± SEM. Exact p values in Source Data EDF5.
Extended Data Figure 6. Ceramide production by caspase-7 requires gasdermin D pores.
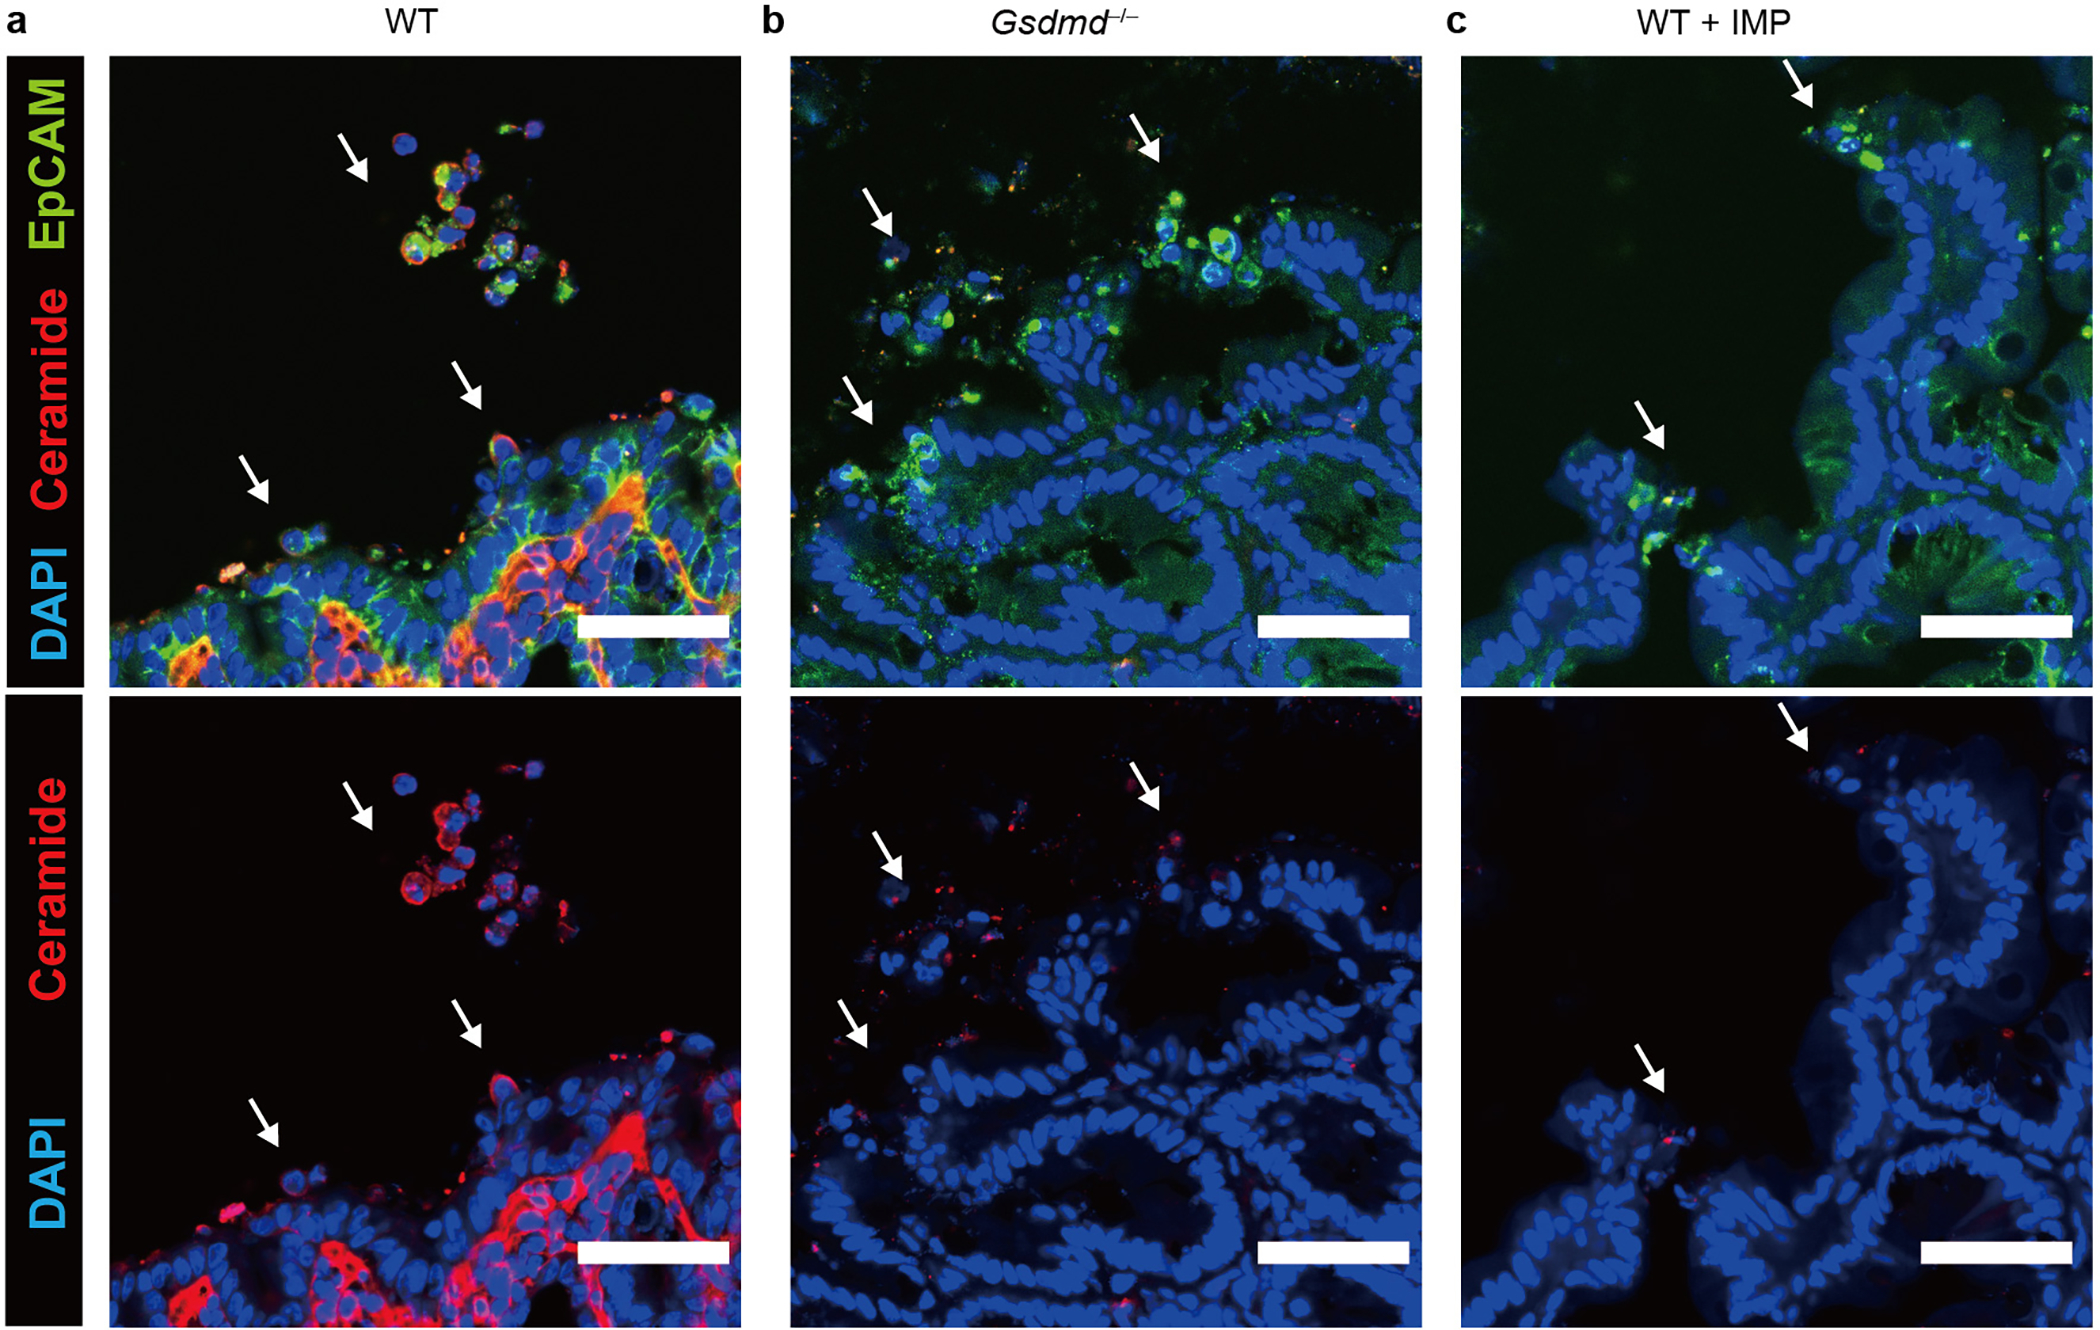
a-c, Ceramide and EpCAM staining of cecum from WT (a), Gsdmd−/− (b), or WT+IMP (c) mice 24 hpi with 5×10⁶ S. Typhimurium (➝, extruding or extruded cells). Scar bar = 50 μm. Data are representative of 3 experiments.
Extended Data Figure 7. ASM cleavage is requires for IEC extrusion.
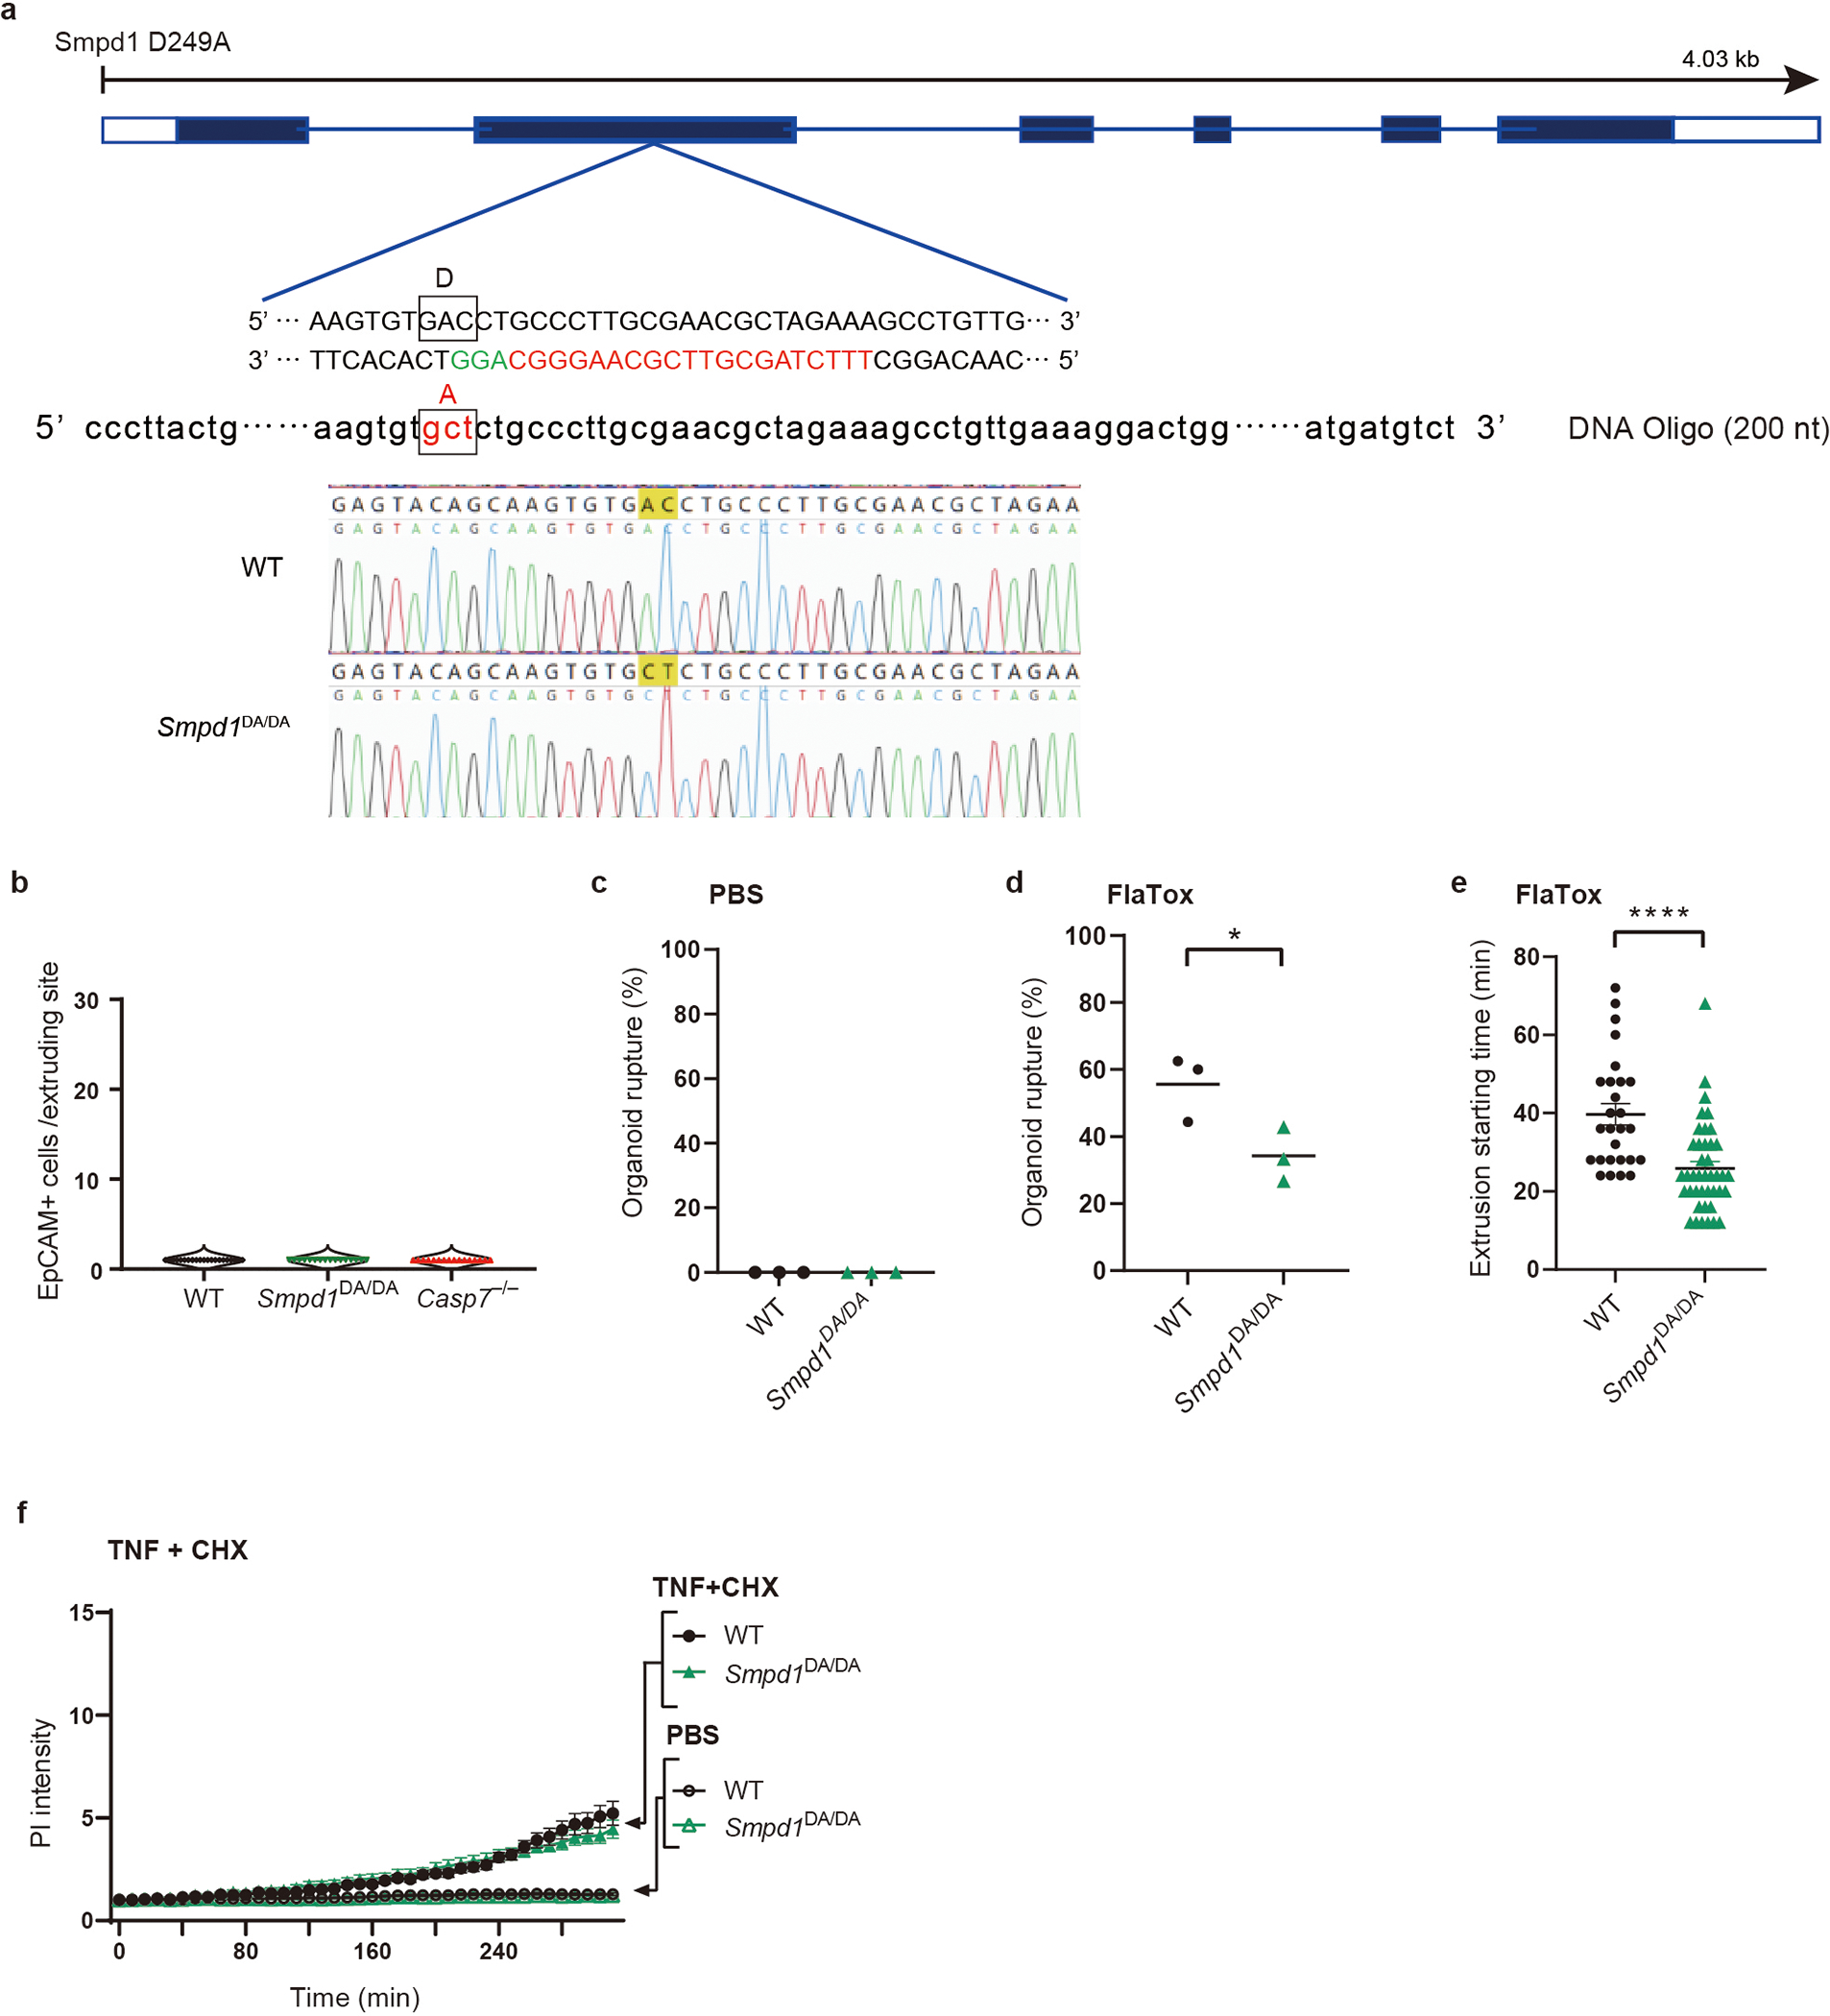
a, Strategy to generate ASM D249A mutant mice by CRISPR-Cas9. Target sequence for guide RNA in exon 2 is shown in red. Repair oligo DNAs (200 nt) containing indicated mutation are also used for electroporation with Cas9. Successful mutation was confirmed by Sanger sequencing. b, Quantification of EpCAM+ cells per extruding site in non-infected WT, Smpd1DA/DA, and Casp7−/− ceca (n=4 in each group). c-f, Live imaging of indicated IEC organoids, which were quantified for rupture percentage after PBS (c) or FlaTox (d) treatment, extrusion starting time after FlaTox treatment (e), and PI Intensity after TNF+CHX or PBS treatment (f). Data are pooled from 2 (b) or 3 (c-d) experiments or are representative of 3 experiments (f). For (e), WT (n=27) and Smpd1DA/DA (n=41) organoids pooled from 3 experiments were analyzed. *P < 0.05, **P < 0.01, ***P < 0.001, ****P < 0.0001 (Two-sided unpaired t test in (d, e), two-way ANOVA with Sidak’s post-hoc test in (f)). Data are shown as mean ± SEM. Exact p values in Source Data EDF7.
Extended Data Figure 8. Caspase-7 ameliorates tissue pathology during S. Typhimurium infection or DSS colitis.
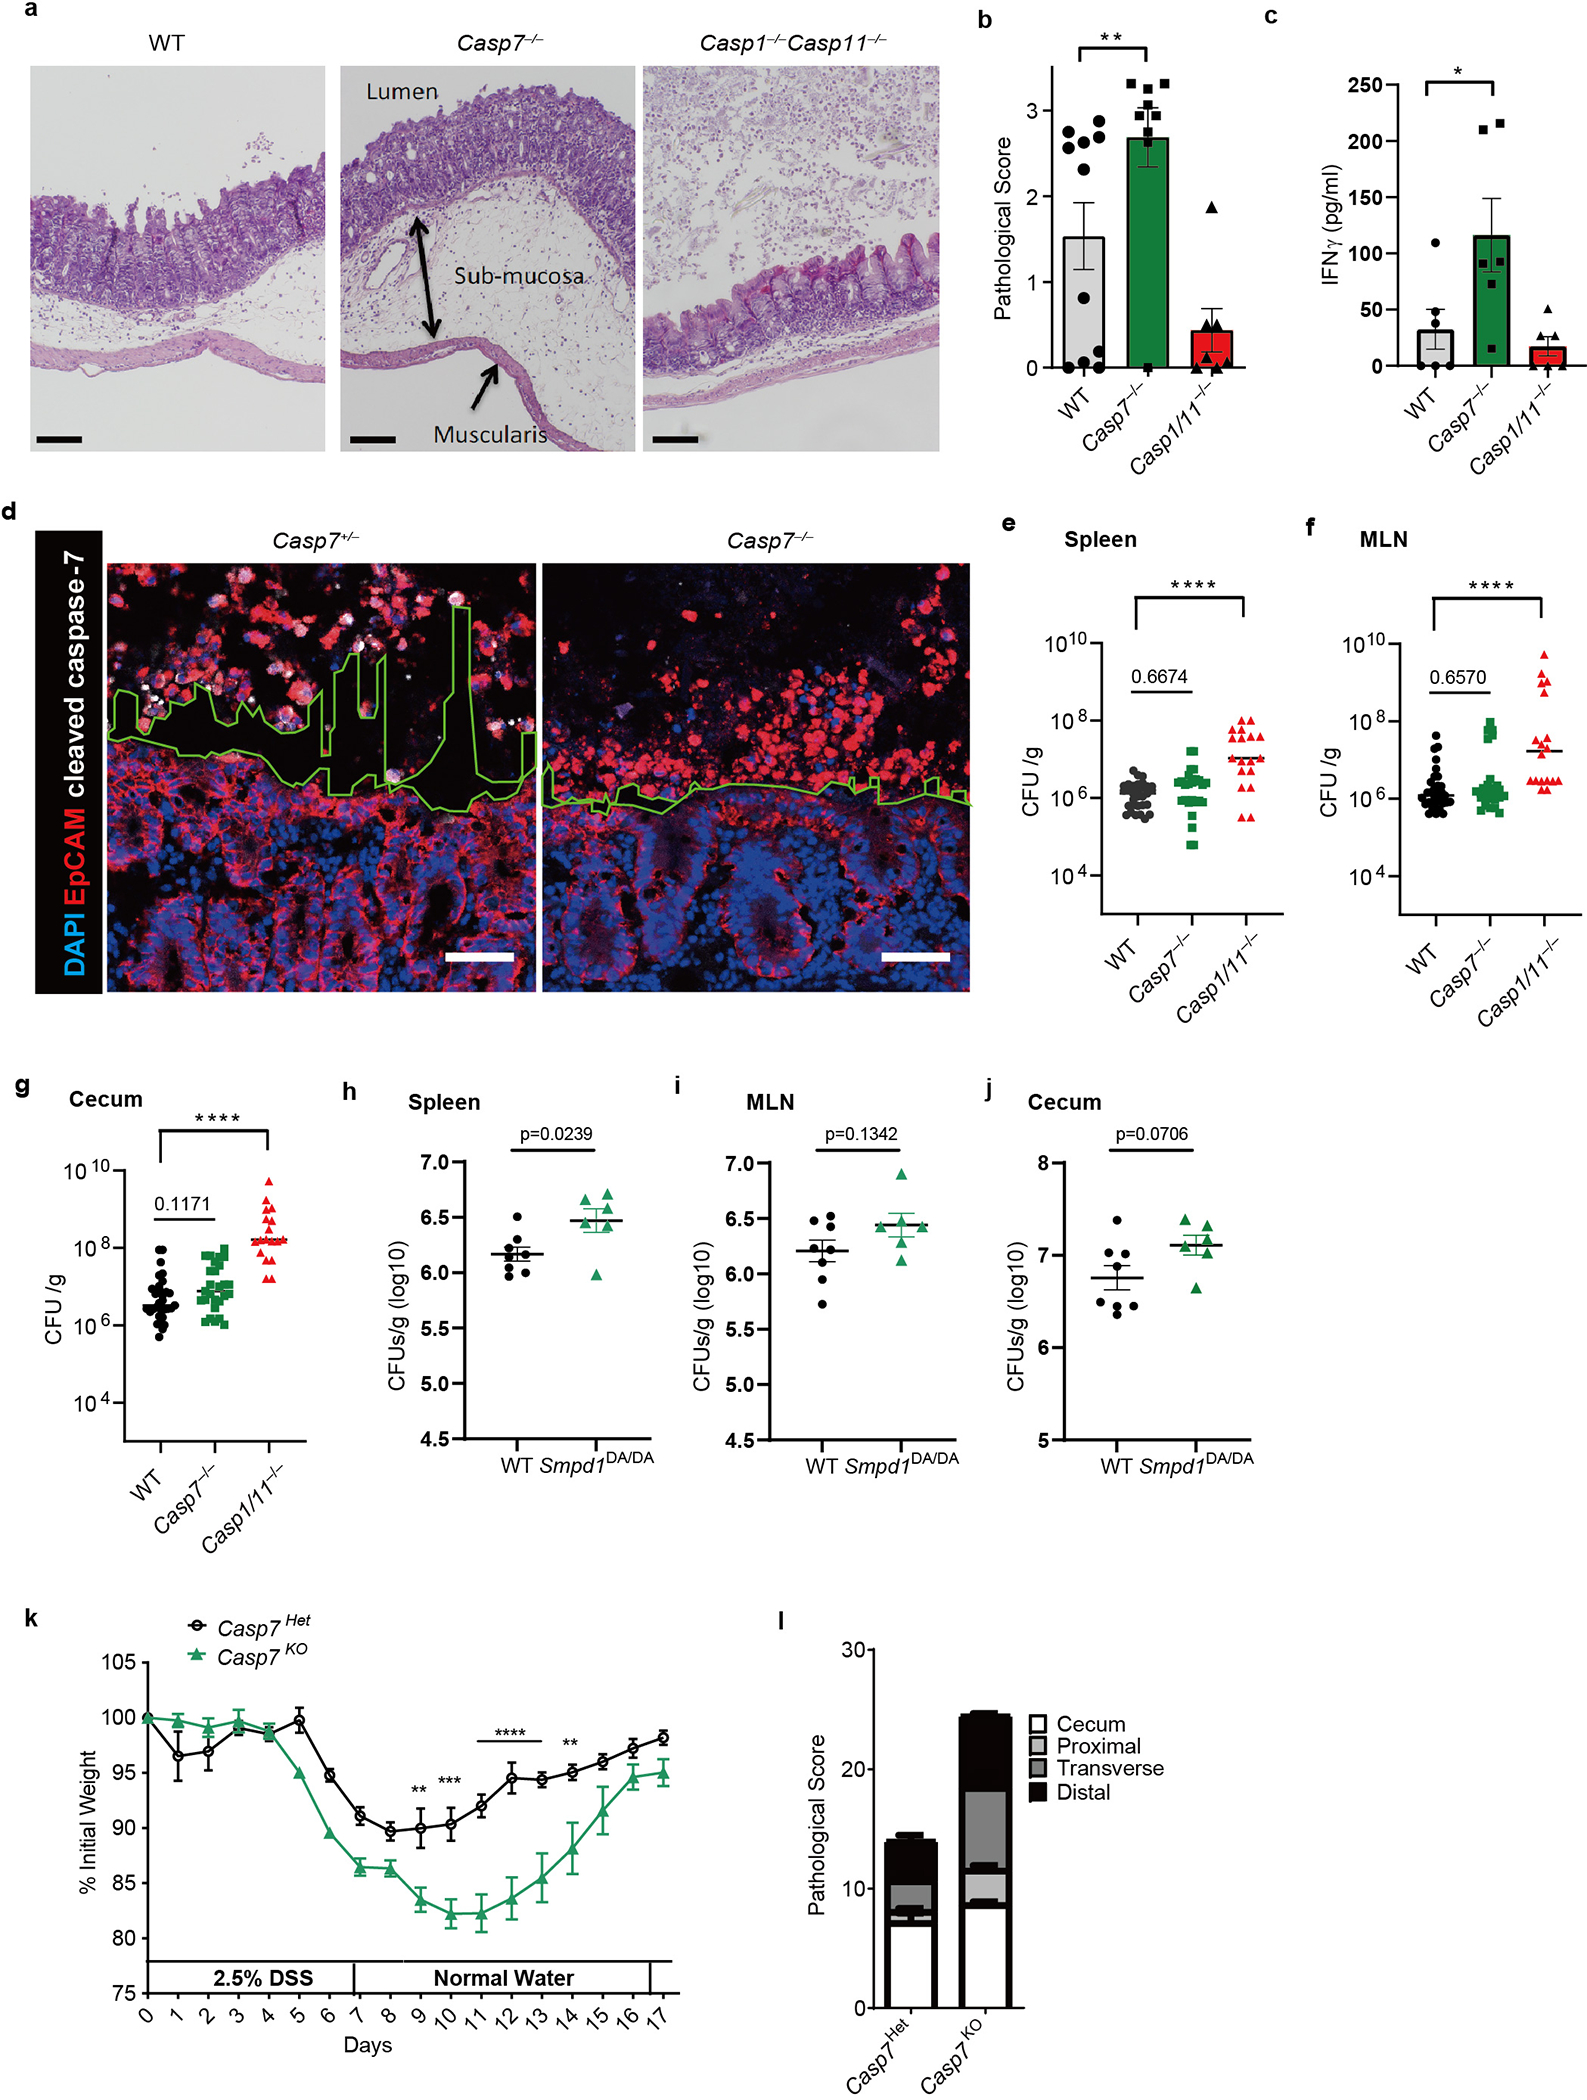
a-c, The indicated mice were infected with 106 S. Typhimurium for 2 days, then cecum were harvested and stained with H&E. Shown are representative images (a) (Scar bar = 100 μm), pathological score (b) of WT (n=11), Casp7−/− (n=9), and Casp1−/−Casp11−/− (n=7) mice, and serum IFN-γ (c) of WT, Casp7−/−, and Casp1−/−Casp11−/− mice (n=6). d, EpCAM staining of ceca from littermate Casp7+/− and Casp7−/− mice 2 dpi with 5×10⁶ S. Typhimurium. Dotted lines indicate the space between the extruding IECs and epithelial layer. Scar bar = 50 μm. e-g, CFU of WT (n=31), Casp7−/− (n=27), and Casp1−/−Casp11−/− (n=18) mice 4 dpi with 106 S. Typhimurium in spleen (e), MLN (f), and gentamicin-treated cecum (g). h-j, CFU of WT (n=8) and Smpd1DA/DA (n=6) mice 4 dpi with 106 S. Typhimurium in (h) spleen, (i) MLN, and (j) gentamicin-treated cecum. k-l, Casp7+/− and Casp7−/− mice treated with the indicated time course of DSS. Mouse weight (k) and pathology score (l) at day 5. Data are representative of 2 experiments with (a, b, d, k, l), or are pooled from 2 experiments (c), 3 experiments (h-j), or 5 experiments (e-g). *P < 0.05, **P < 0.01, ***P < 0.001, ****P < 0.0001 (Two-sided Mann-Whitney U test in (b), two-sided unpaired t test in (c, h-j), one-way ANOVA with Dunnett’s post-hoc test in (e-g), two-way ANOVA with Sidak’s post-hoc test in (k)). Data are shown as mean ± SEM. Exact p values in Source Data EDF8.
Extended Data Figure 9. Caspase-7 and perforin phenocopy defense against C. violaceum infection.

a-b, Mice were infected IP with 104 C. violaceum and bacterial burdens in the liver were determined 3 days post infection for separately bred mice (a) or littermate-controlled mice (b). c, Ly5A+ splenocytes were harvested from wildtype mice and expanded ex vivo in IL-2 for the NK adoptive transfer experiments in Fig. 4e–f. Shown is the percentage of transferred cells that were NK cells. d, NK cell adoptive transfer schematic for experiments in Fig. 4d–e. Data are pooled from 2 experiments in (a), representative of two experiments in (b), and representative of 3 experiments in (c). *P < 0.05, **P < 0.01, ***P < 0.001, ****P < 0.0001 (One way ANOVA (a) or two-sided Mann-Whitney U test (b)). Bars indicate mean with standard deviation (c). Exact p and n values in Source Data EDF9.
Extended Data Figure 10. IL-18 primes NK cell cytotoxicity to activate caspase-7 in hepatocytes.
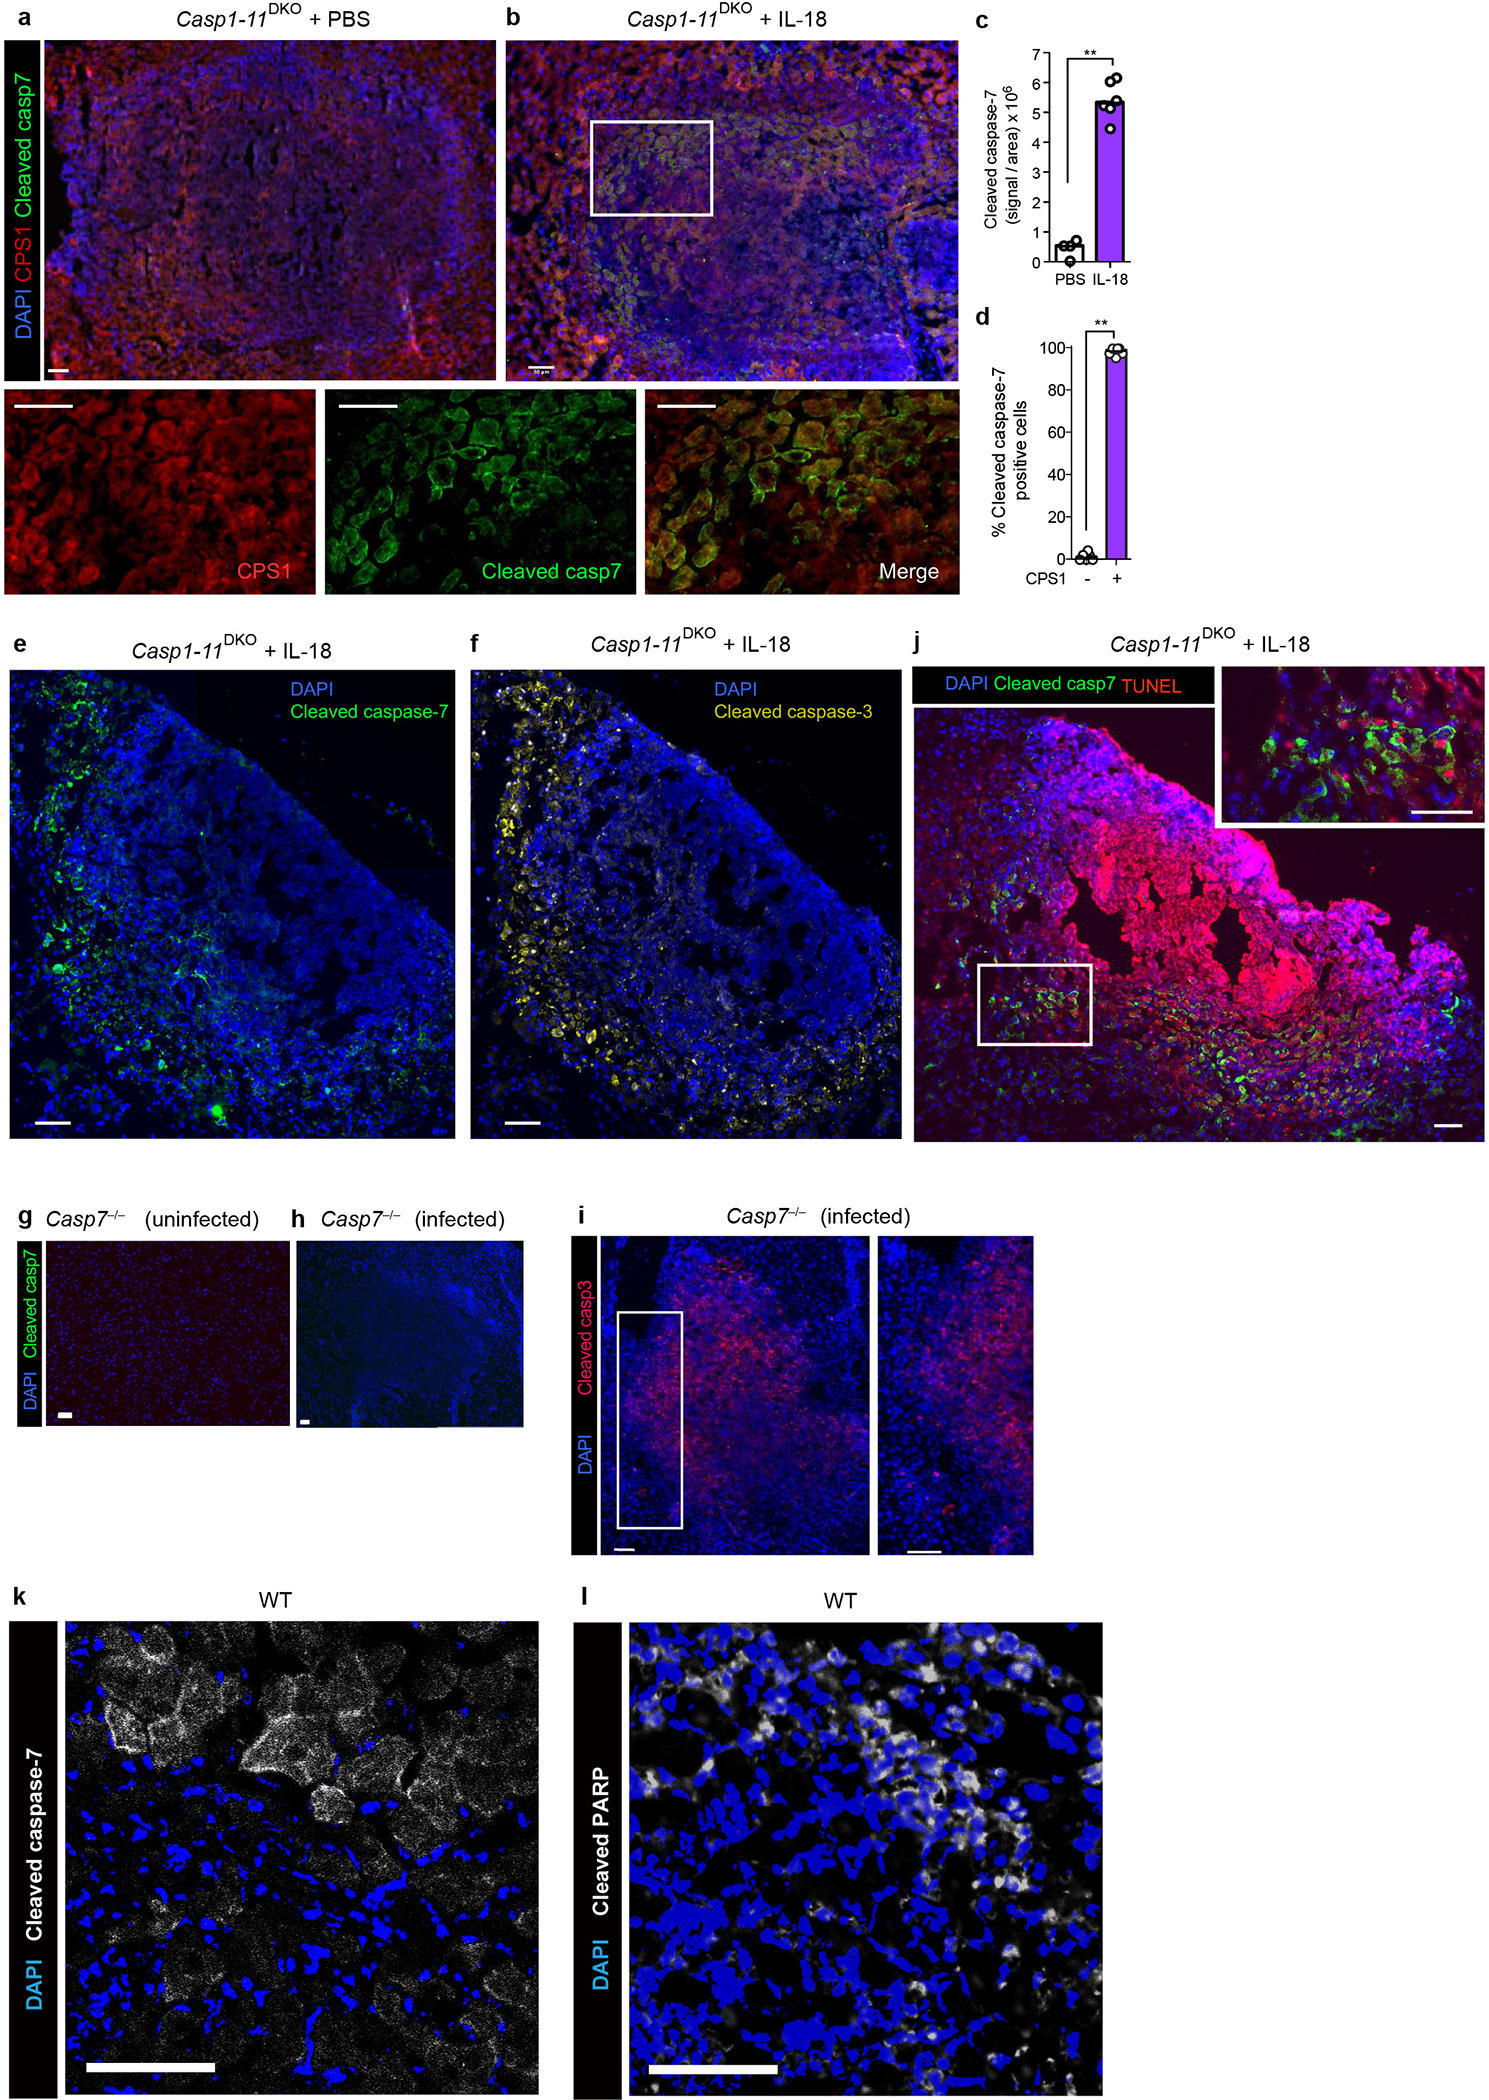
a-b, e-g, Casp1–11DKO mice were infected with 104 C. violaceum, treated with PBS or IL-18 (IP 0.2 μg recombinant mouse IL-18 (MBL) at day 0 and 1), and harvested 2 days post infection (dpi). Livers were stained for the indicated markers via immunofluorescence. Single channel zoom images are from inset box. Merged inset is shown in main Figure 4f. Scale bars, 50 μm. c, Quantification of cleaved caspase-7 signal within lesions, with each dot as the average per mouse. d, Percent of cleaved caspase-7 positive cells that co-stain with CPS1. g-j, Casp7−/− or WT mice were left uninfected or infected with 104 C. violaceum as indicated, and harvested 2 days post infection. Representative images of livers stained for nuclei (DAPI; blue), cleaved caspase-7 (g-h, j, green), cleaved caspase-3 (i, red), TUNEL (j, red). k-l, WT mice were infected with 104 C. violaceum and harvested 3 days post infection, then stained for cleaved caspase-7 (k, white), cleaved PARP (l, white). Scale bars, 50 μm. Data are pooled (c-d) or representative (a-b, e-l) of 2 experiments. *P < 0.05, **P < 0.01, ***P < 0.001, ****P < 0.0001 (Two-sided Mann-Whitney U test). Bars indicate median values. Exact p and n values in Source Data EDF10.
Extended Data Figure 11. Caspase-7 enhances ceramide production via ASM after NK/CTL attack.
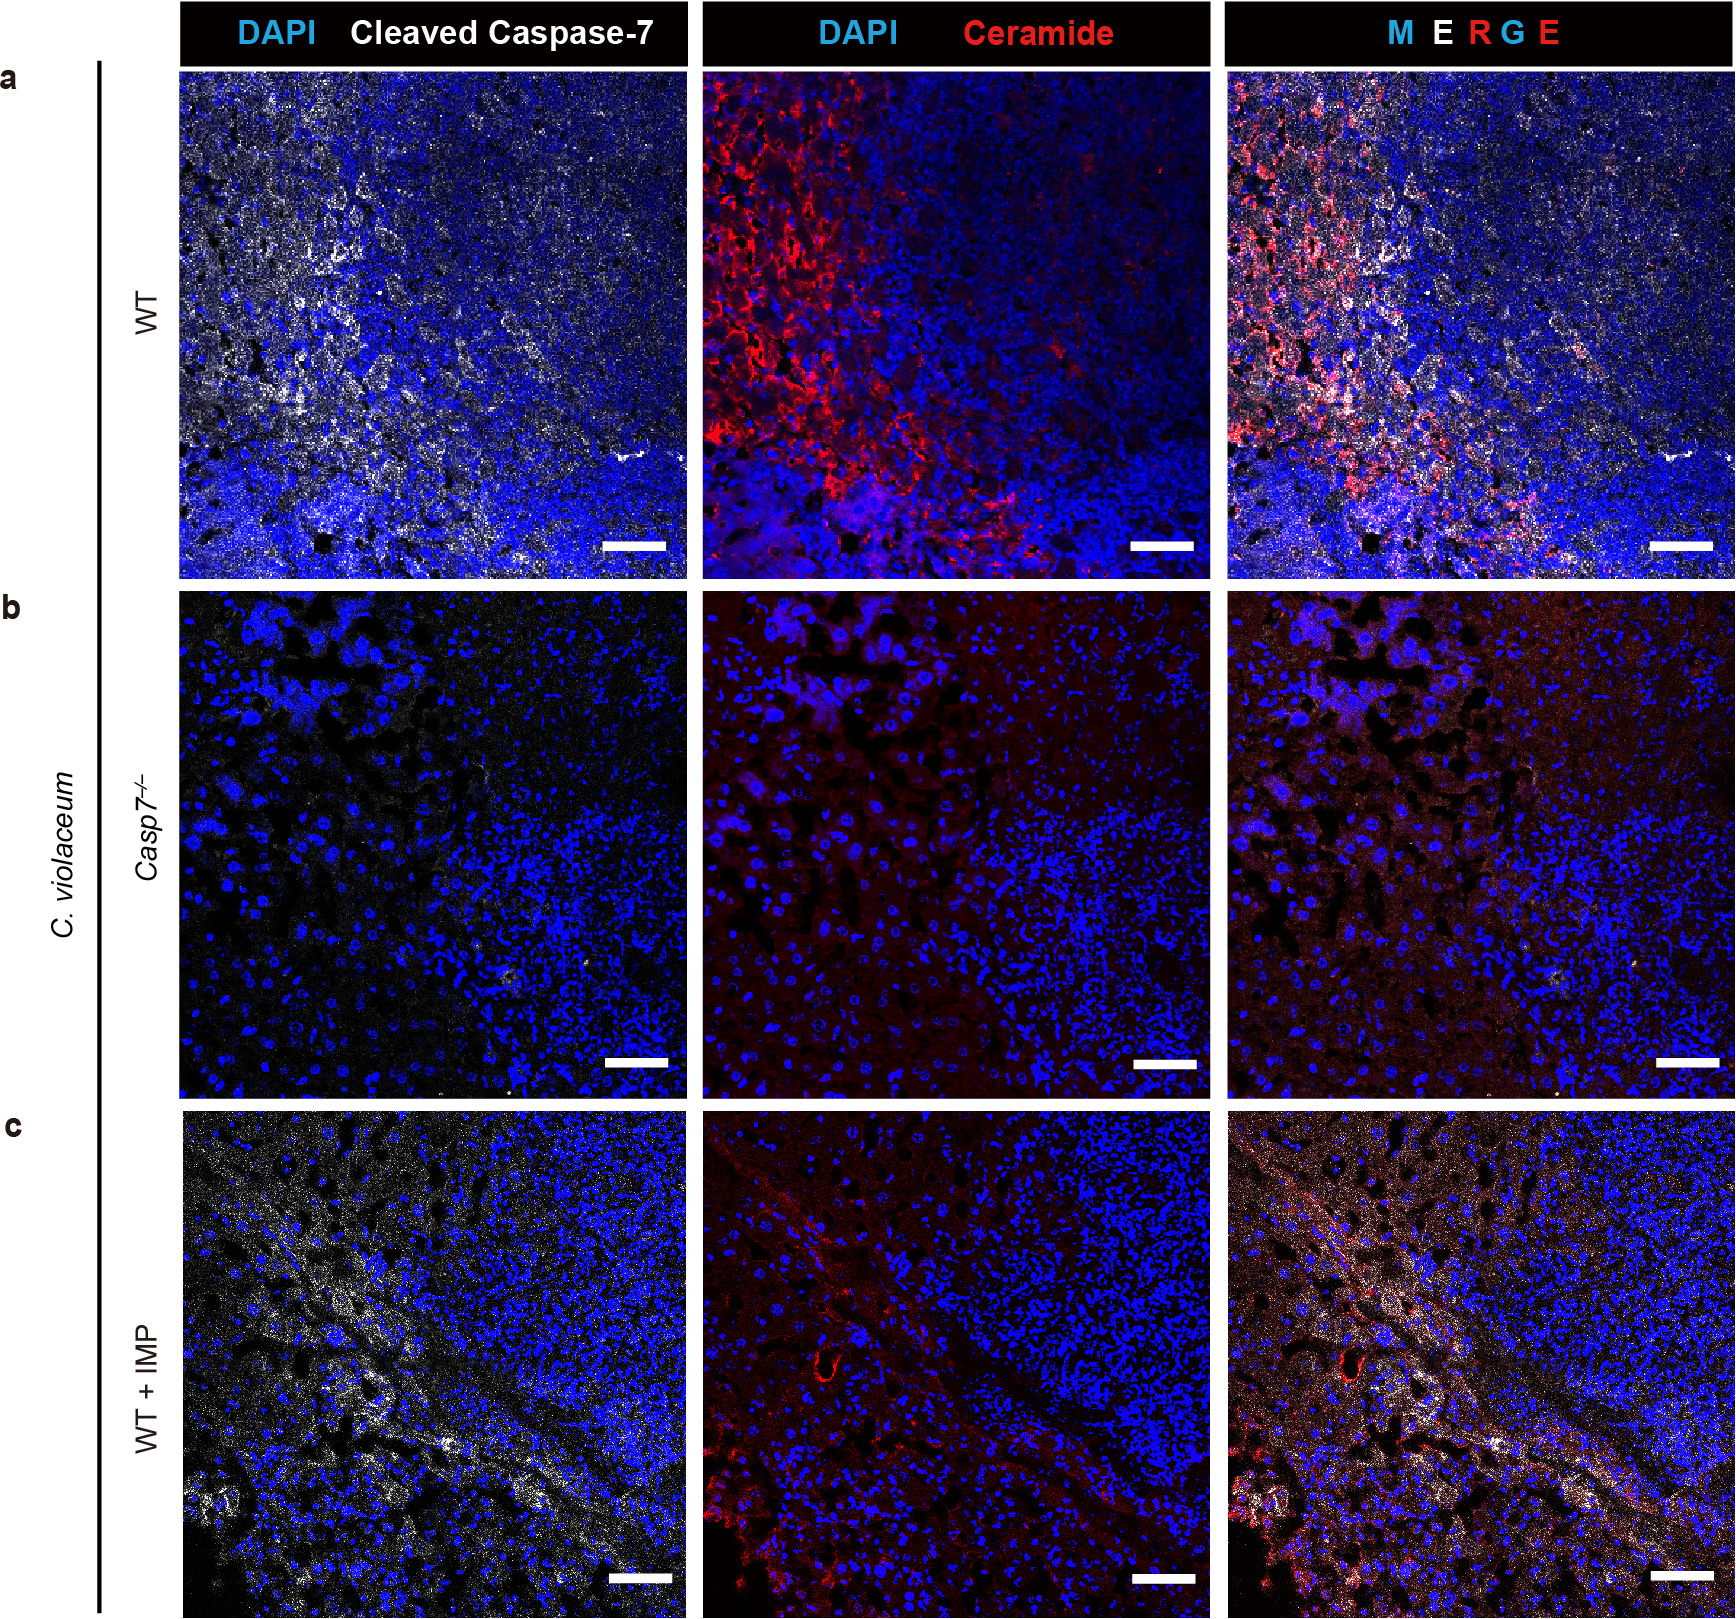
a-c, Mice were treated with imipramine or PBS, followed by intraperitoneal infection with 104 C. violaceum and harvested 3 dpi. Representative images of infected livers from WT (a), Casp7−/− (b), or WT+IMP (c) mice stained for nuclei (DAPI; blue), cleaved caspase-7 (white), and ceramide (red). Scale bars, 50 μm. Data are representative of 3 experiments.
Extended Data Fig. 12. CTL transfer model during L. monocytogenes infection.
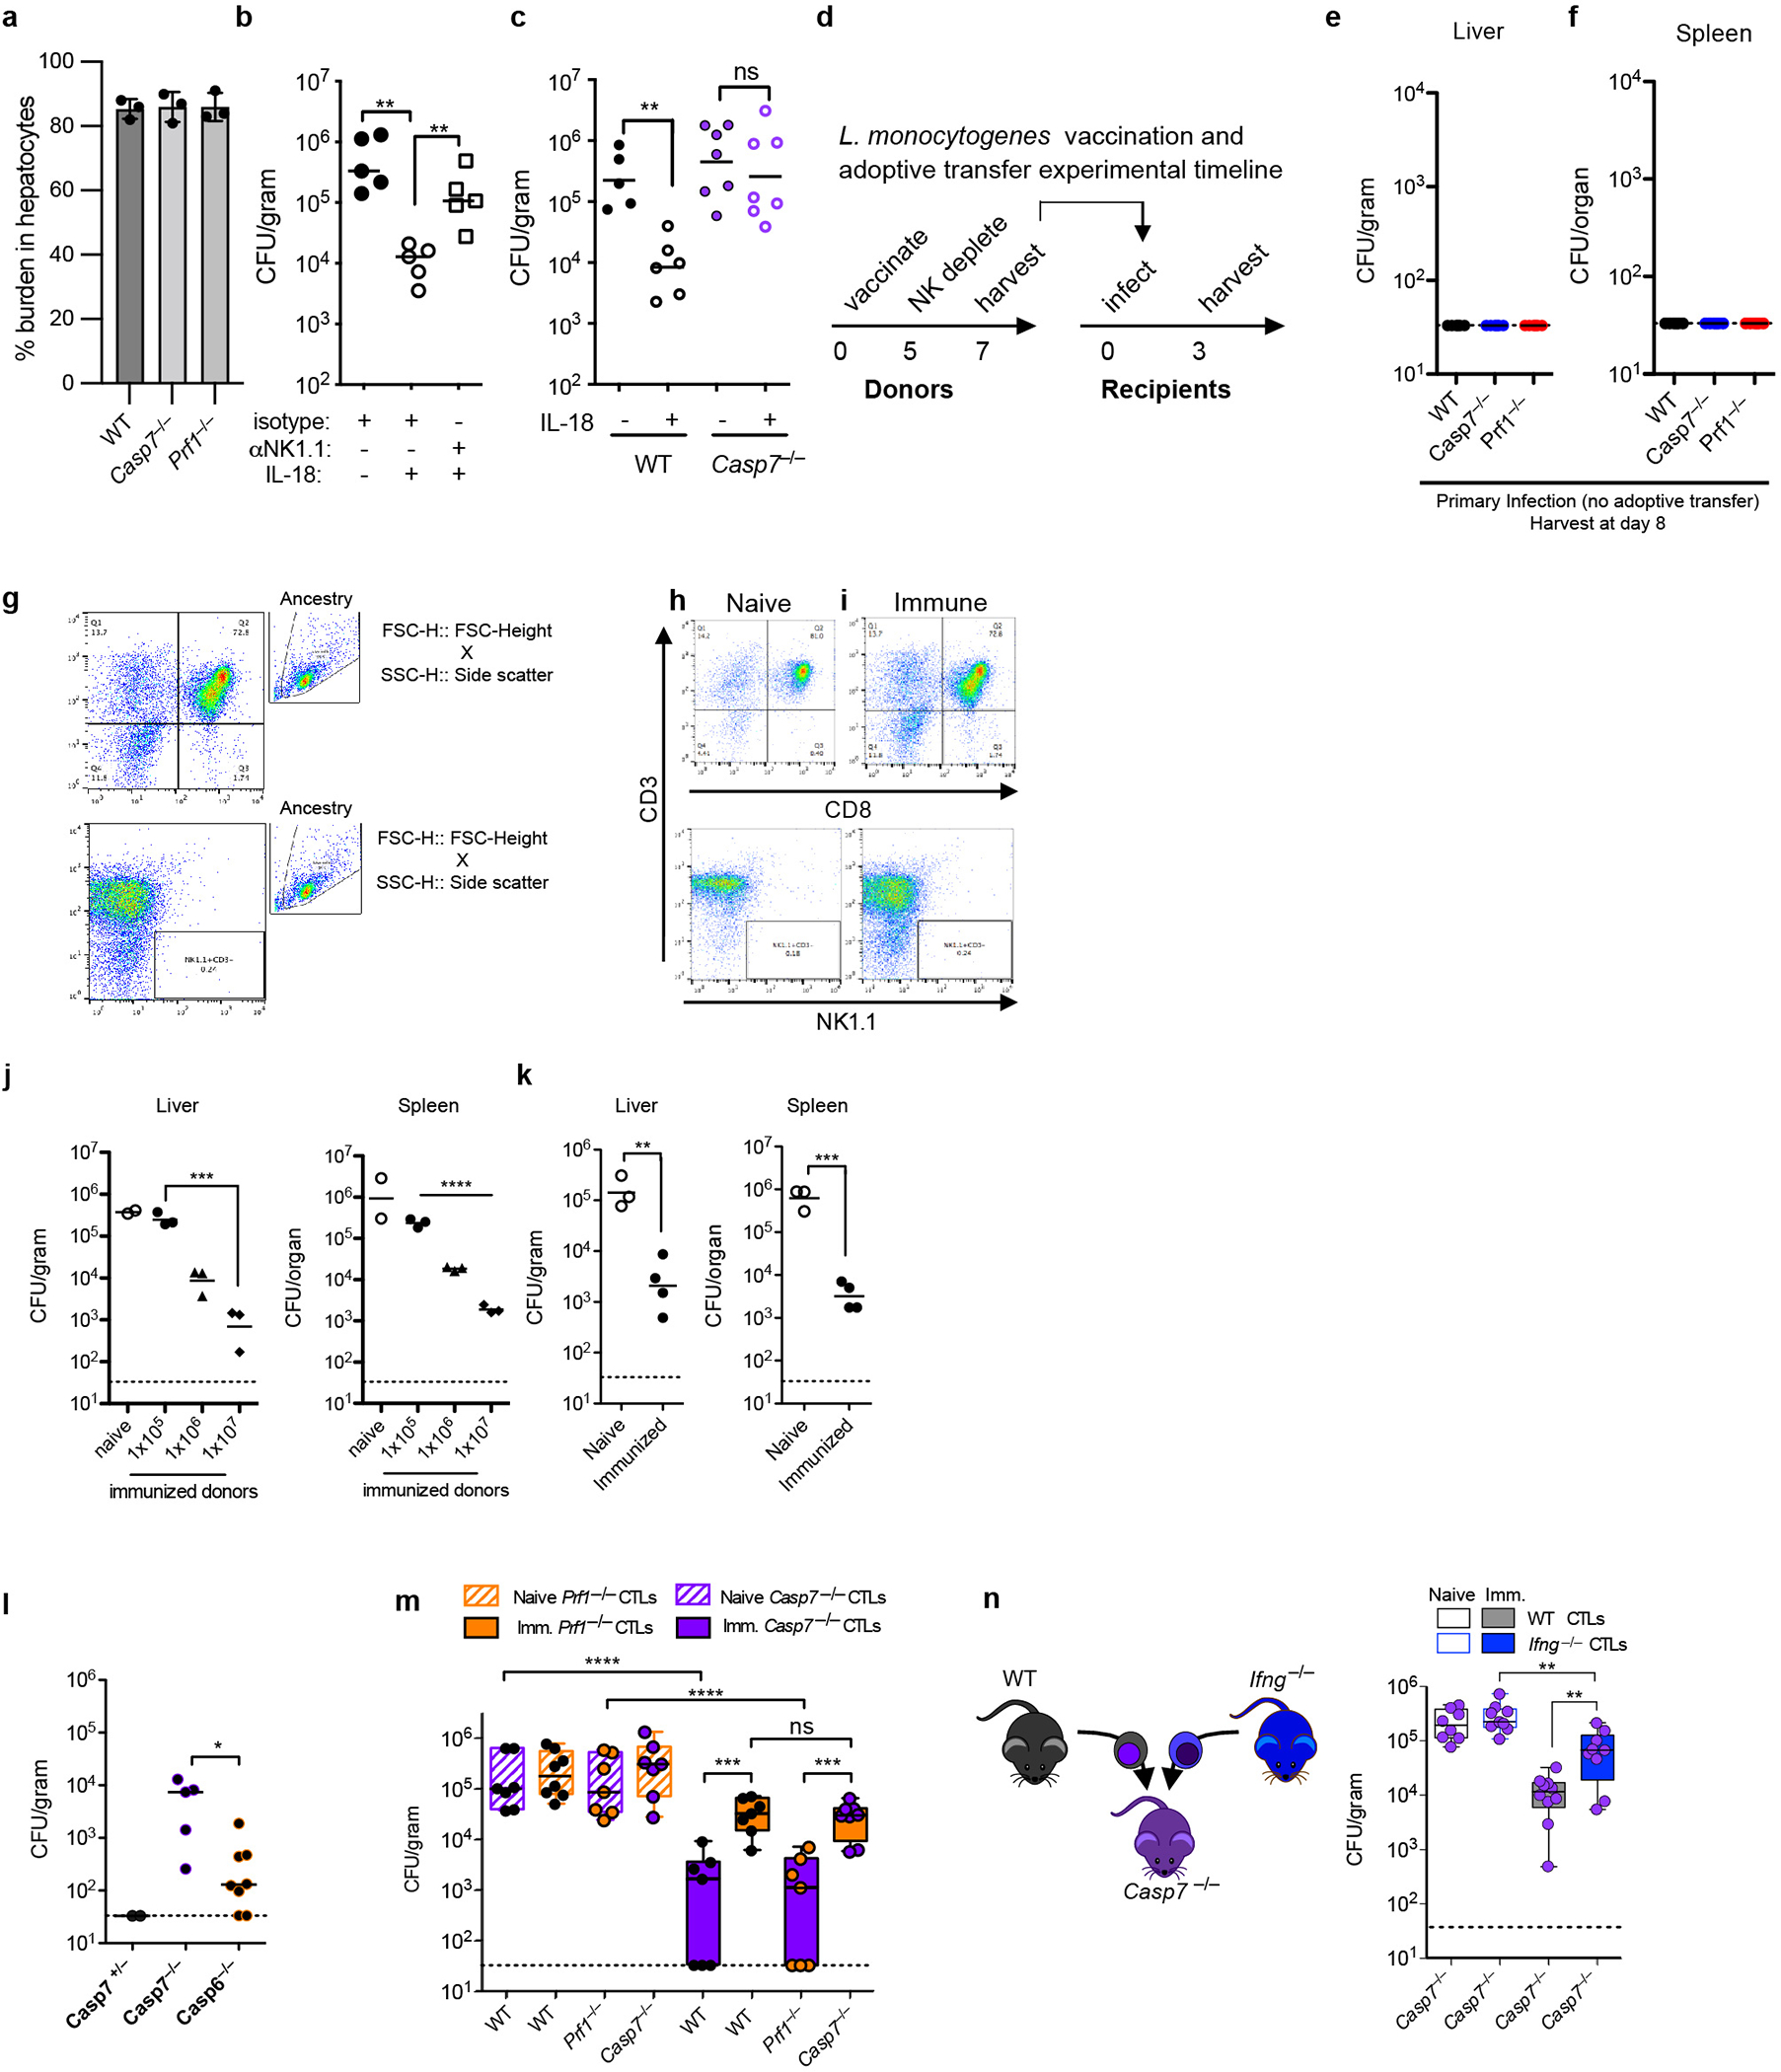
a, Percentage of bacterial burden localized to hepatocytes 3 days post infection. Equal weight liver sections were removed and the hepatocyte fraction was graphed as a percentage of the total burden by weight. 3 mice per genotype. b-c, Mice were infected IV with 5×10³ L. monocytogenes and IP treated with combinations of isotype antibody or NK depleting antibody (100 μg anti-NK1.1 PK136), with IL-18 (0.2 μg recombinant mouse IL-18) or isotype control as indicated. Mouse numbers (b) n=5 each group; (c) WT PBS n=6, WT IL-18 n=6, Casp7−/− n=7 each. d, Timeline for adoptive transfers. Donor mice were PBS treated (naïve) or vaccinated with 1×10⁶ ΔactA L. monocytogenes (immune). e-f, Liver and splenic burdens 8 days post primary infection with 5×10³ L. monocytogenes. n=6 mice each. g, Flow gating strategy for flow experiments depicted in (h-i). h-i, Donor mice were NK depleted (> 99% eliminated) and their CTLs enriched by negative selection (> 72% purity). j, Mice were adoptively transferred with the indicated numbers of purified CTLs (naïve were given 1×10⁷ as the maximum transferred number), infected with 5×10⁴ L. monocytogenes and bacterial burdens were analyzed in the liver and spleen 3 days post infection. 2 naïve mice, 3 per immunized group. k, Bulk splenocyte transfer (5×10⁷, as previously described in 23) with NK depletion was comparable to that of isolated CTLs. Naïve n=3, immunized n=4 mice. l, Mice were infected with 5×10⁴ of L. monocytogenes and adoptively transferred with immunized WT CTLs as in d. Liver bacterial burdens were determined 3 days post infection. Mouse numbers: Casp7+/− (n=2F), Casp7−/− (n=3M+2F), and Casp6−/− (n=5F+3M). Note full clearance in Casp7+/− mice may be due to gender disparities or simply to low numbers leading to stochasticity and poor sampling. m-n, Donor mice were PBS treated (naïve) or vaccinated with 1×10⁶ ΔactA L. monocytogenes (immune). (m) Adoptive transfer data from Figure 5b–c are shown on the same graph, since all the transfers were done in the same 2 pooled experiments. Numbers of mice (m) WT mice with Casp7−/− CTLs n=7 each, naïve Prf1−/− CTLs n=8, immune Prf1−/− CTLs n=7; naïve knockout recipients n=7 each, immune recipients Prf1−/− n=8, Casp7−/− n=7; (n) naïve WT n=8, immune WT n=10, Ifng−/− n=9 each. Data are representative of two experiments (a, e-f, h) or pooled from two experiments (b-c, j-n). *P < 0.05, **P < 0.01, ***P < 0.001, ****P < 0.0001 (Two-sided Mann-Whitney U test (a-c, k, l), or (j, m, n) one way ANOVA with Tukey’s multiple comparison test). Bars indicate mean with standard deviation (a). Box plots show median, 25th-75th percentile, whiskers are minimum and maximum. Exact p and n values in Source Data EDF12.
Extended Data Figure 13. CTL transfer induces cleavage of caspase-7 during L. monocytogenes infection.
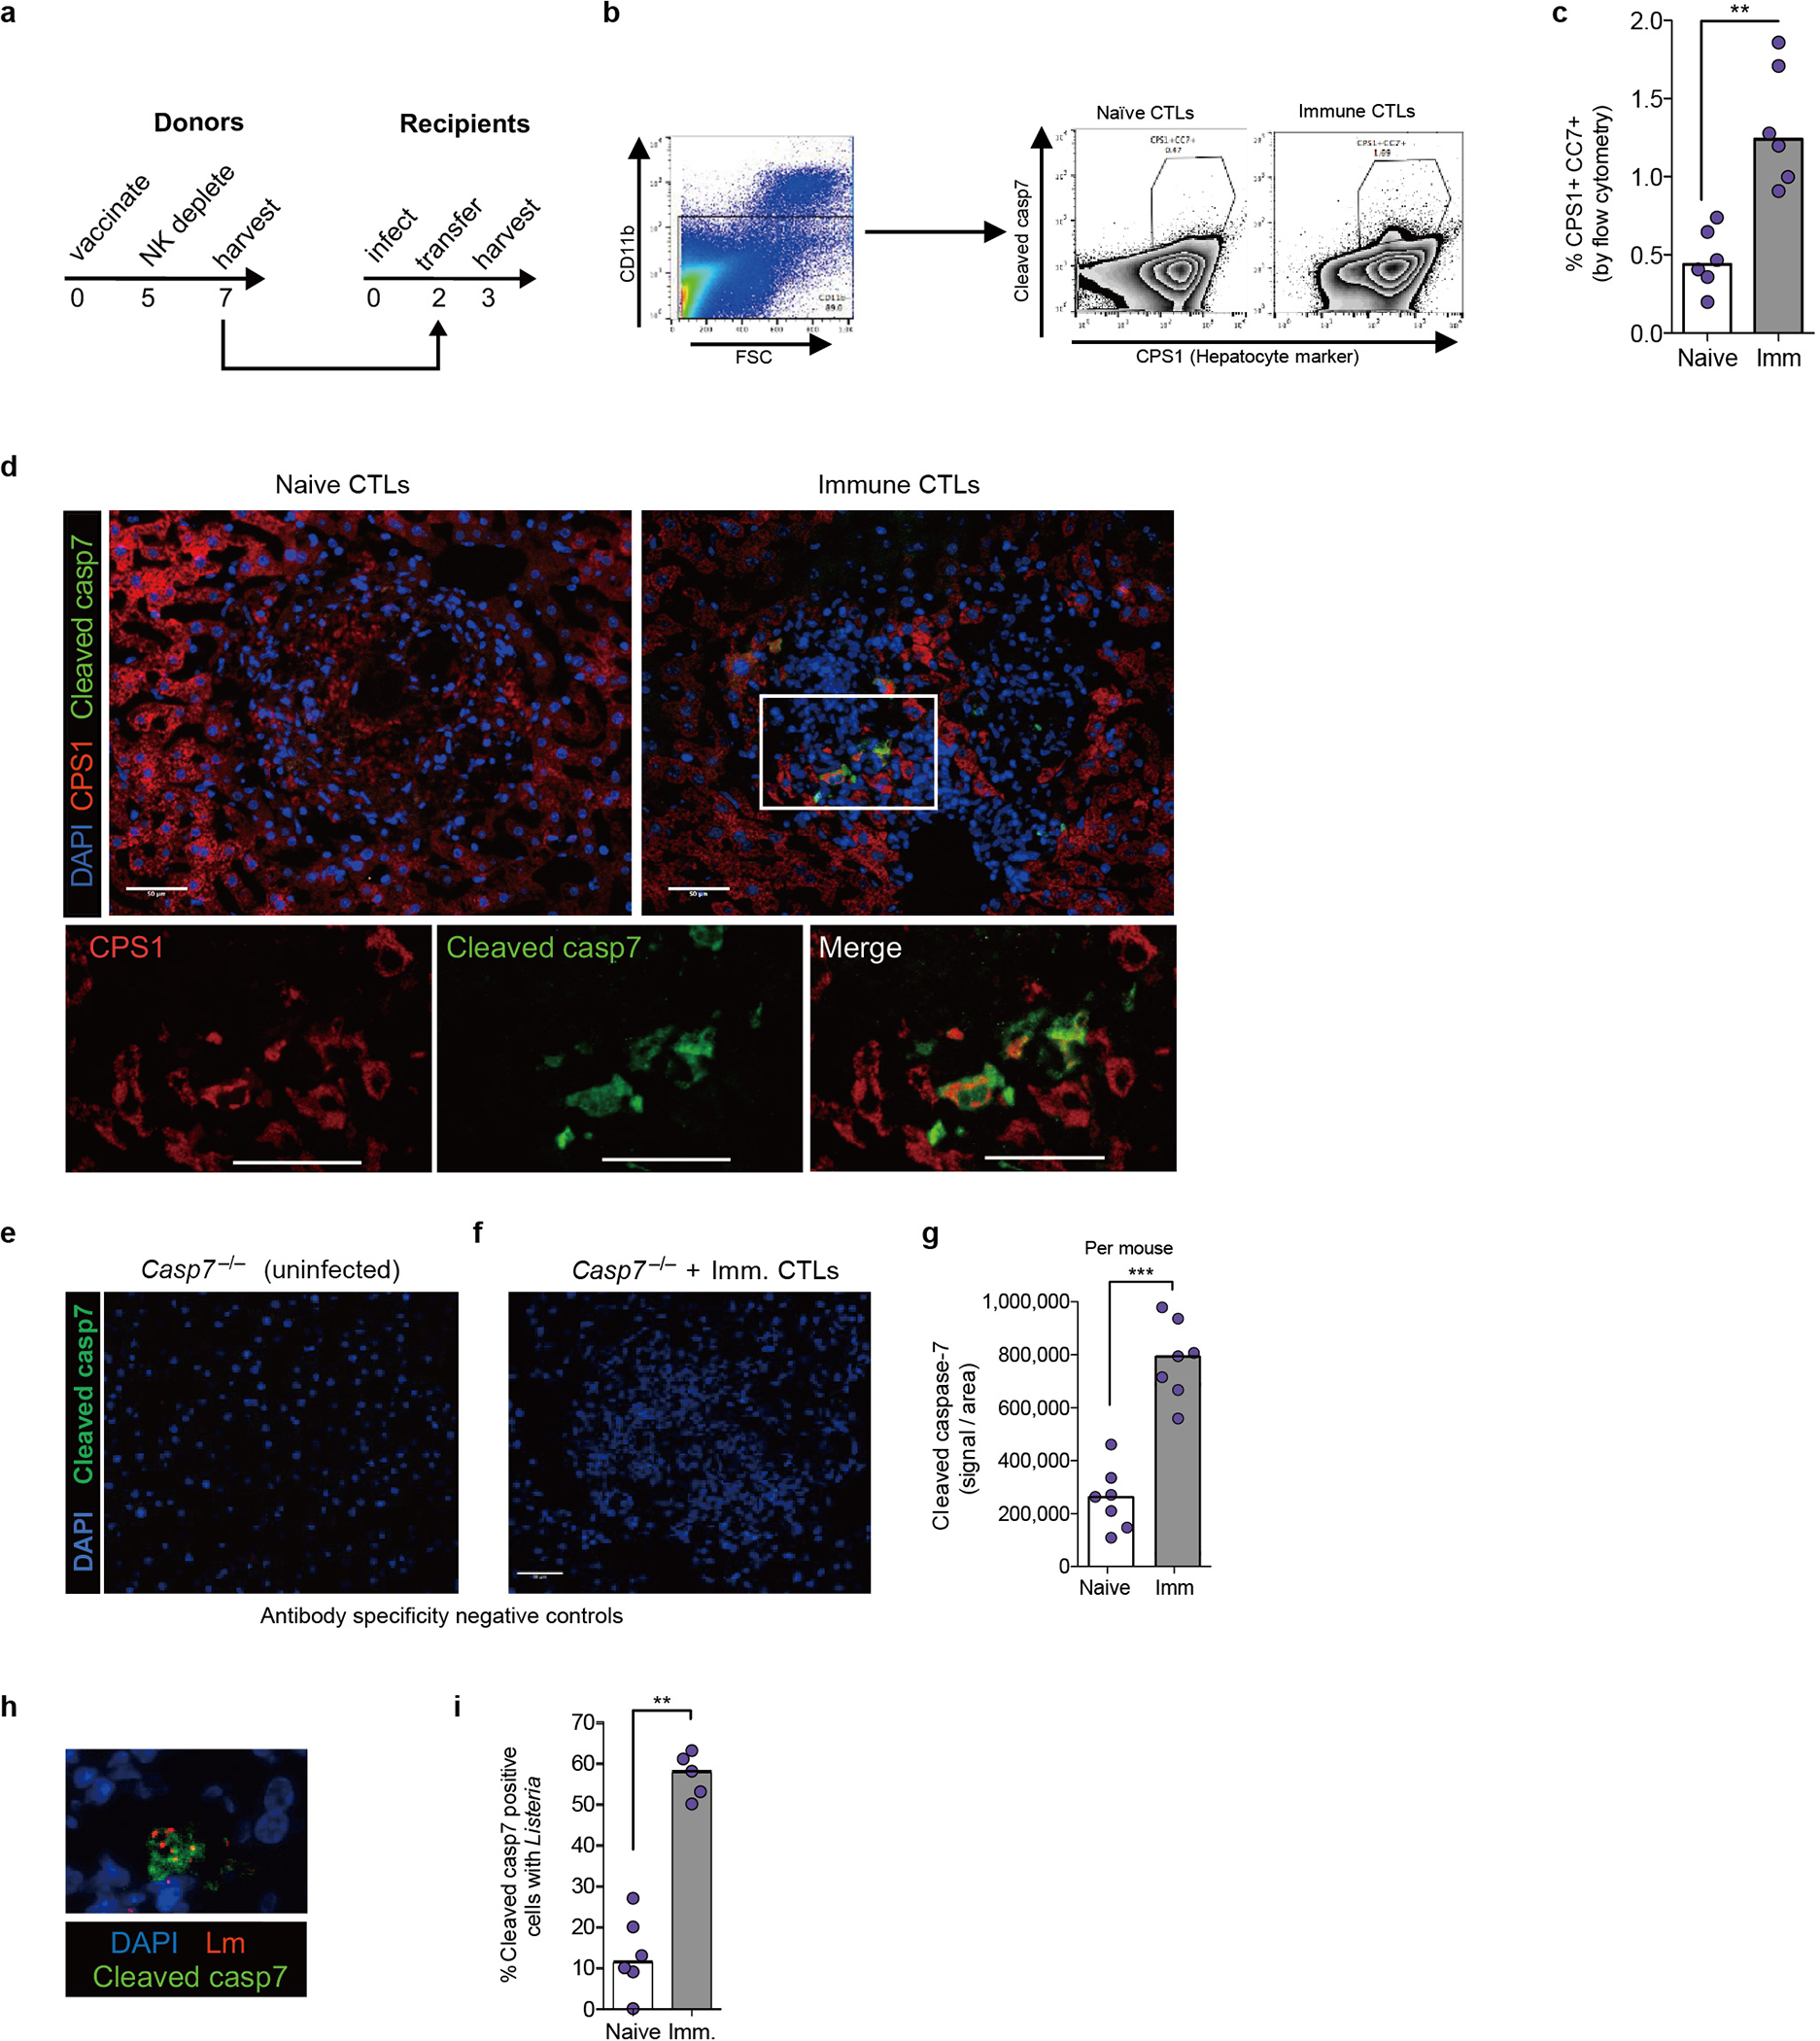
a, Timeline for adoptive transfers with recipients infected IV with 5×10⁴ L. monocytogenes in Figure 5. b-c, Flow cytometry of enriched hepatocytes for cleaved caspase-7 staining and gating scheme, with representative plot (b) and quantification of n=6 mice per group (c). d, Representative images of livers stained for nuclei (DAPI; blue), cleaved caspase-7 (green), and CPS1 (red). Scale bars, 50 μm. e-f, Immunofluorescence control staining. Casp7−/− mice were left uninfected (e) or CTL transferred and infected with 5×10⁴ L. monocytogenes (f), and harvested 3 days post infection. Representative images of livers stained for nuclei (DAPI; blue) and cleaved caspase-7 (green). Scale bars, 50 μm. g, Quantification of cleaved caspase-7 signal within lesions (dot = average per mouse; n=7 WT mice per group). h-i, Colocalization of cleaved caspase-7 signal and L. monocytogenes with representative image (h) and quantification (i) from n=6 naïve and n=5 immune WT mice. Scale bar, 50 μm. Graphed data are pooled from 2 experiments (c, g, i). Images representative of 2 experiments (d, h) or one experiment (e, f). * P < 0.05, **P < 0.01, ***P < 0.001, ****P < 0.0001 (Two-sided Mann-Whitney U test). Bars indicate median values. Exact p and n values in Source Data EDF13.
Extended Data Fig. 14. MCMV and LCMV are cleared independent of caspase-6 and caspase-7.
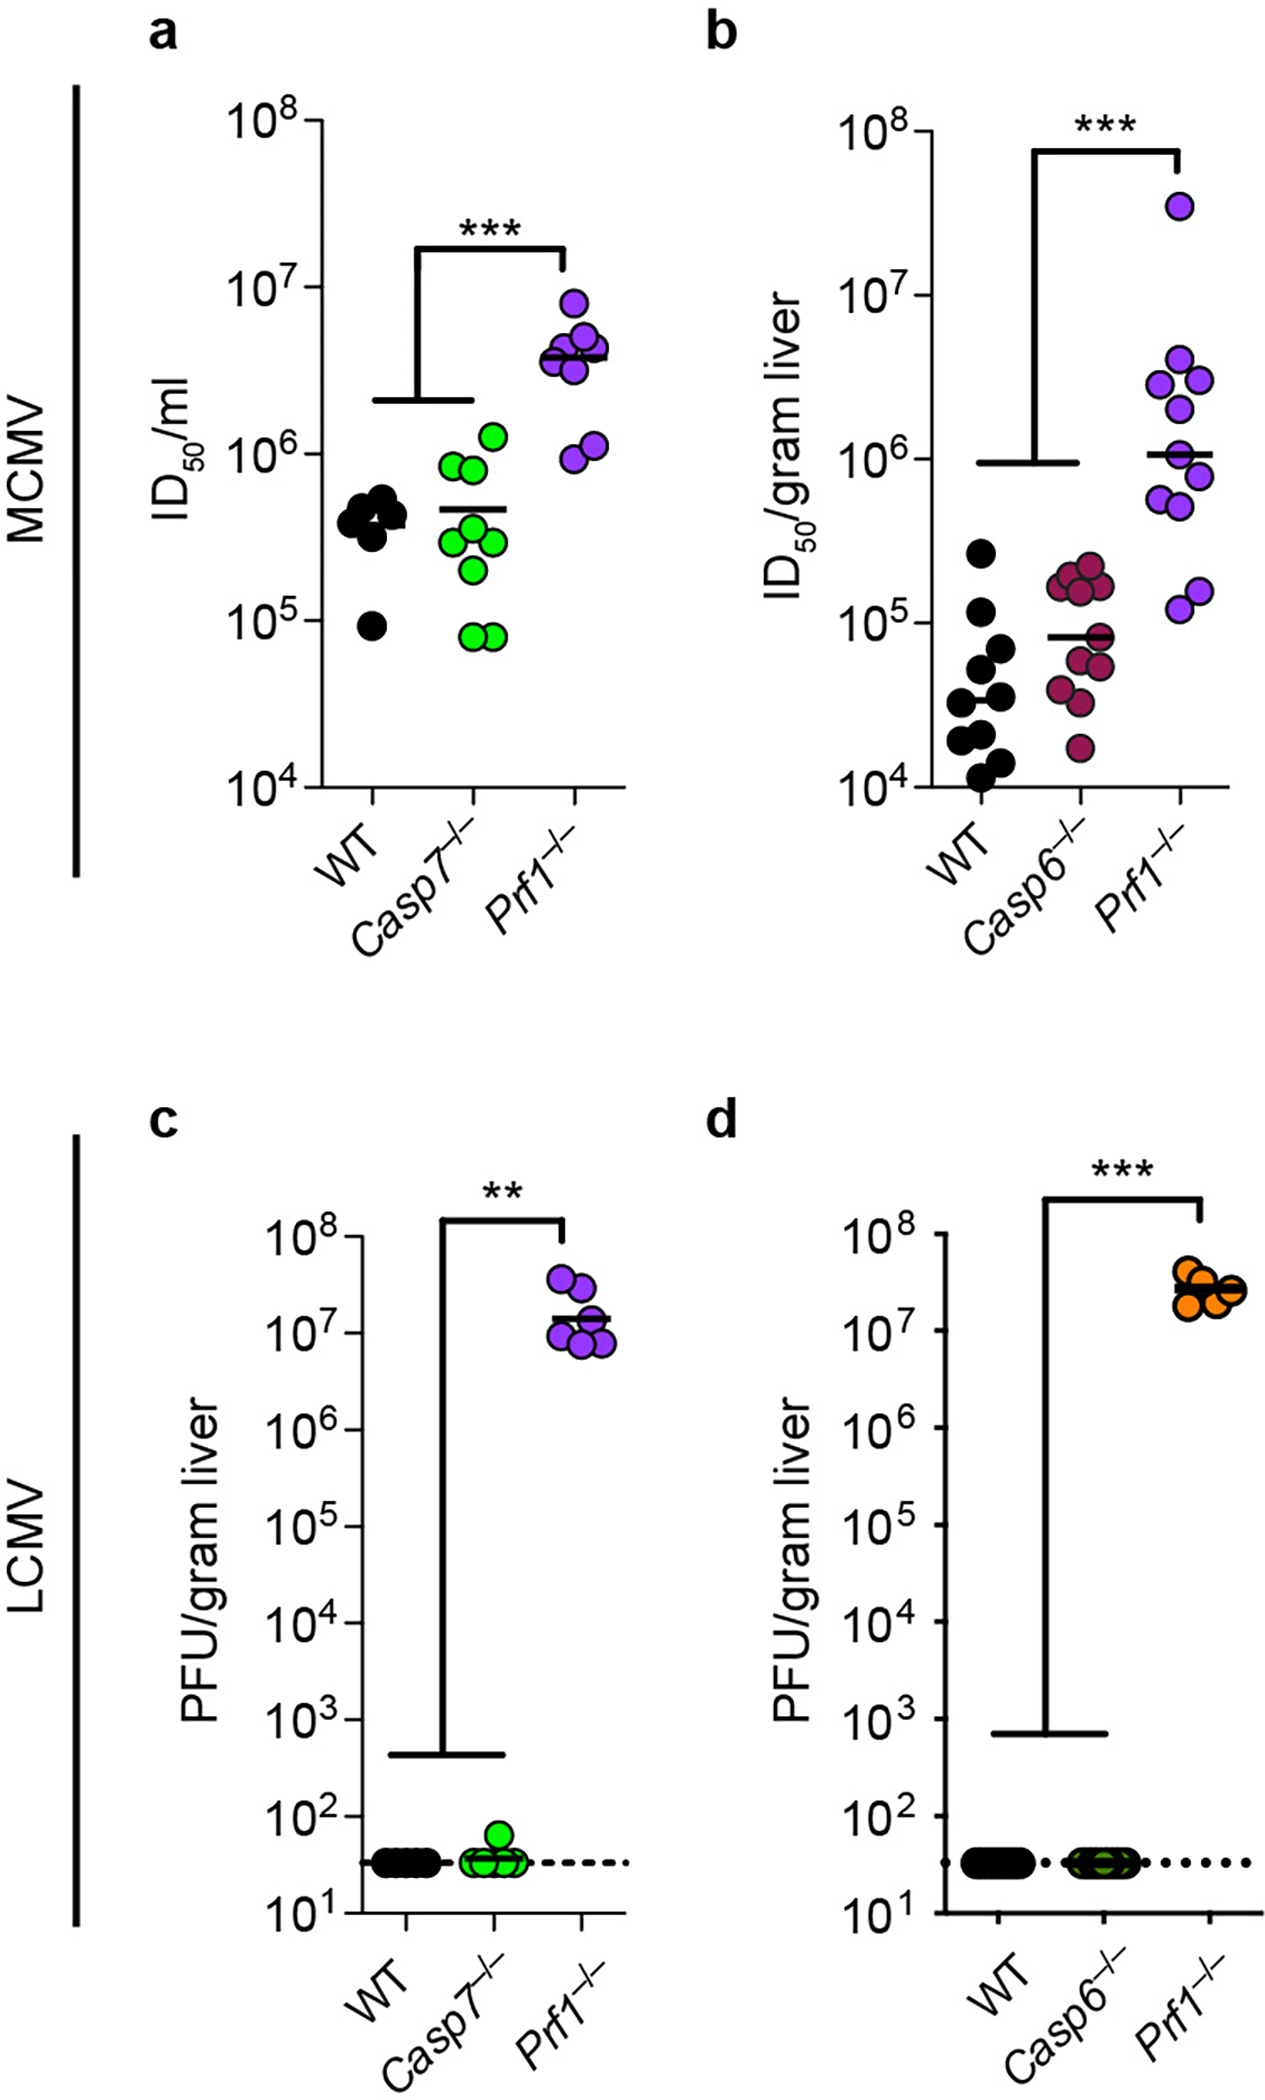
a-b, Mice were infected IP with 5×10⁴ pfu of MCMV. Viral titer in the liver was determined 4 days post infection from (a) n=6 WT, n=9 Casp7−/−, n=8 Prf1−/−; (b) n=10 WT, n=11 Casp6−/−, n=11 Prf1−/−. c-d, Mice were infected IP with 2×10⁵ pfu of LCMV. Viral titer in the liver was determined by plaque assay 8 days post infection from (c) n=5 WT, n=6 Casp7−/−, n=6 Prf1−/−; (d) n=8 WT, n=9 Casp6−/−, n=5 Prf1−/−. All data are pooled from 2 experiments. *P < 0.05, **P < 0.01, ***P < 0.001, ****P < 0.0001 (Two-sided Mann-Whitney U test). Bars indicate median values. Exact p and n values in Source Data EDF14.
Extended Data Fig. 15. Granzyme B, active caspase-3, and active caspase-7 are not sufficient to kill bacteria in vitro.
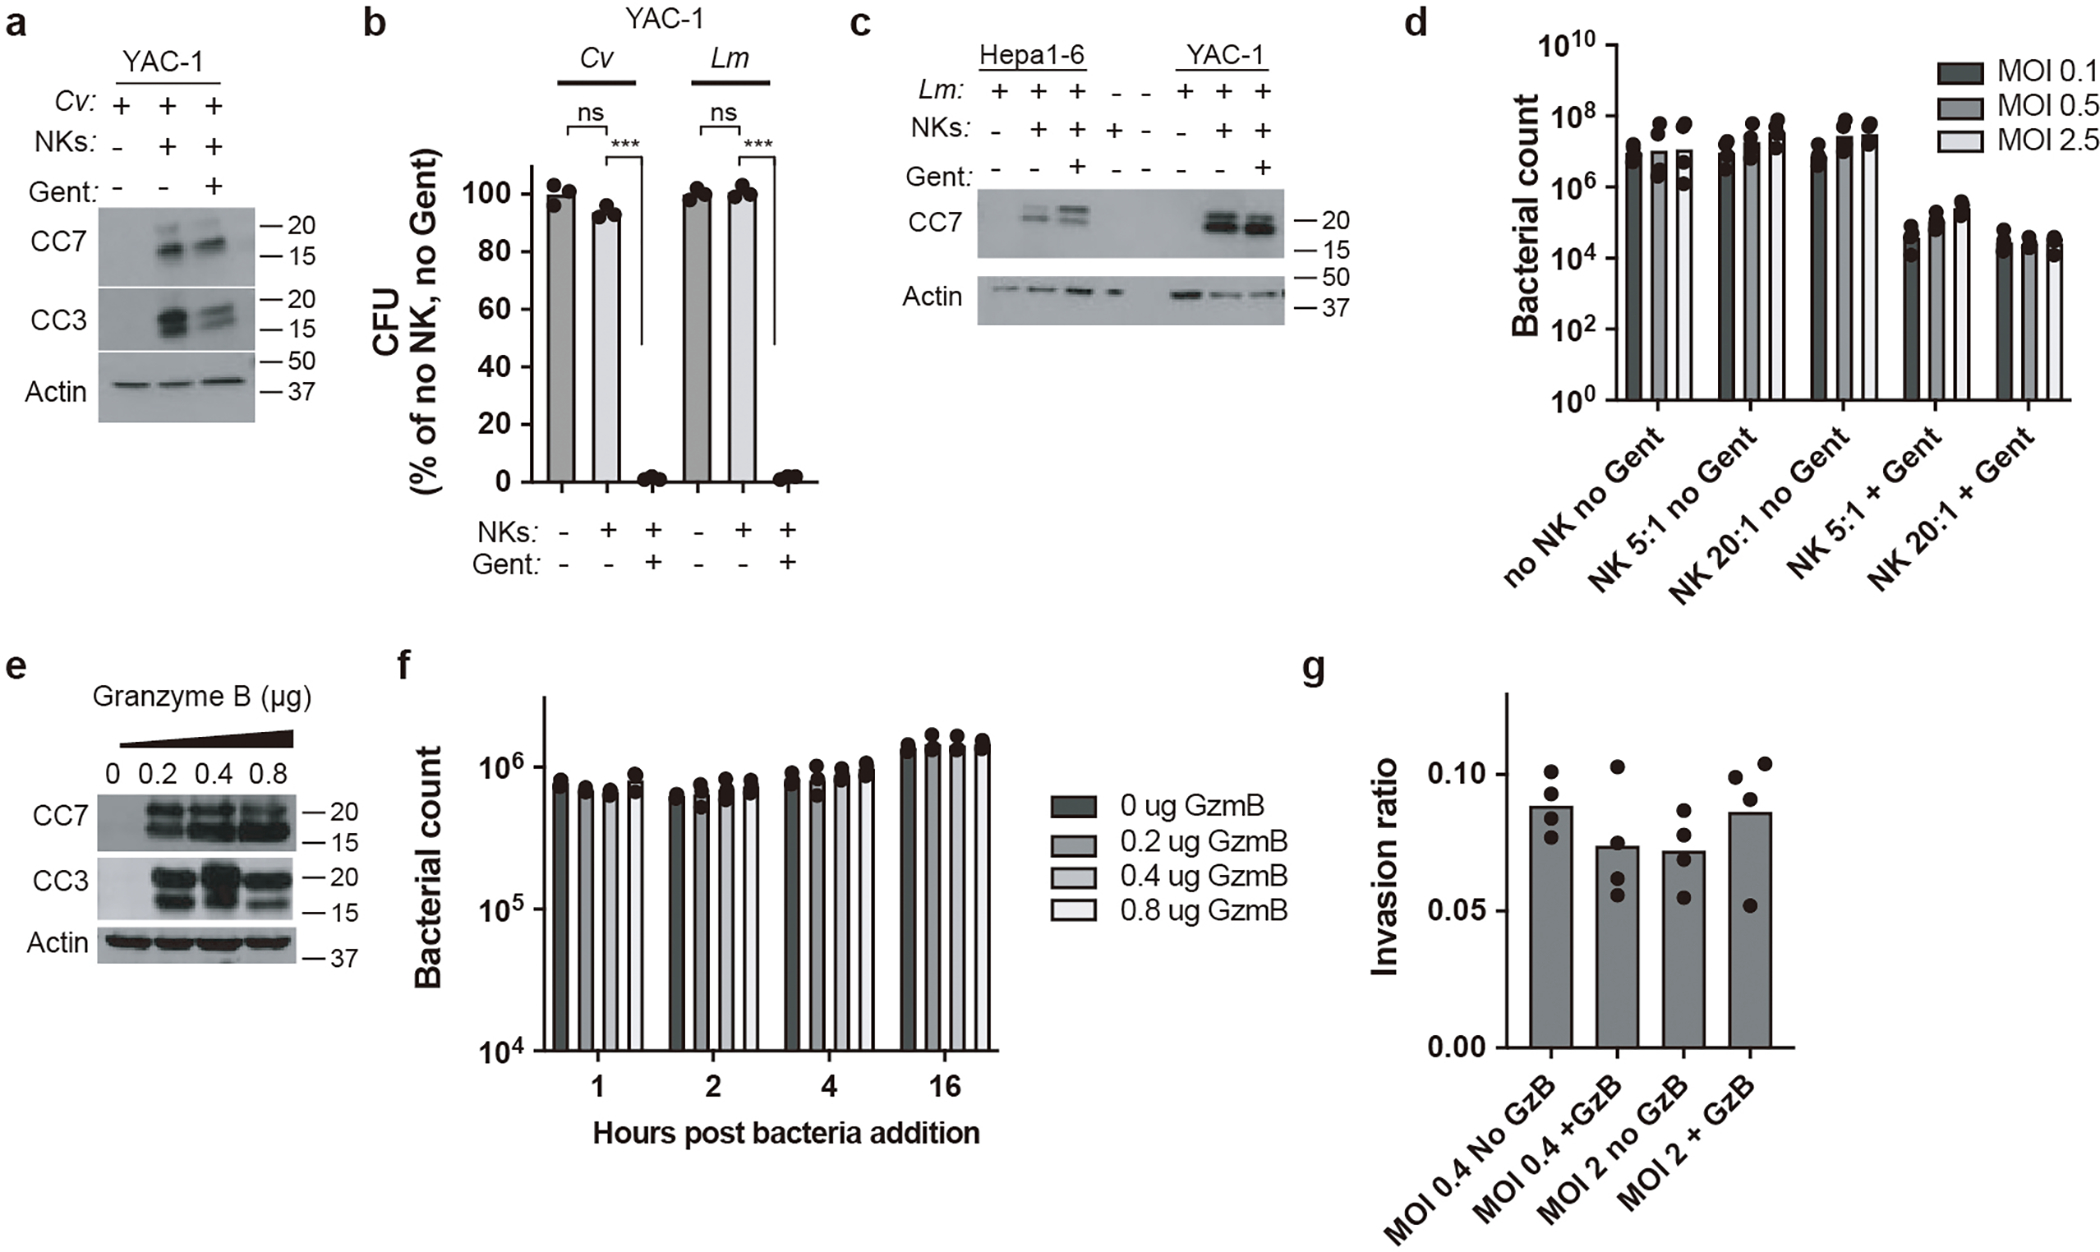
a-d, NK co-culture killing assays (see “In vitro coculture assays” in methods for detailed description) with C. violaceum-infected YAC-1 cells or L. monocytogenes-infected Hepa1–6 and YAC-1 cells as indicated. (a, c) Western blot analysis of cleaved caspase-3 (CC3) and/or cleaved caspase-7 (CC7). (b, d) Bacterial counts 5 hours post co-culture. e-f, Hepa1–6 cell lysates were spiked with granzyme B at the indicated amounts for 1 hour and 8×10⁶ L. monocytogenes was added. Western blot analysis of CC3 and CC7 (e) and time course of bacterial numbers (f). g, Invasion assay with L. monocytogenes incubated in Hepa1–6 cell lysates for 16 hours with granzyme B. All data are representative of 2 experiments. *P < 0.05, **P < 0.01, ***P < 0.001, ****P < 0.0001 (Two-sided Mann-Whitney U test). Bars indicates mean.
Extended Data Fig. 16. Pyroptotic activation of caspase-7 is not required for clearance of C. violaceum.
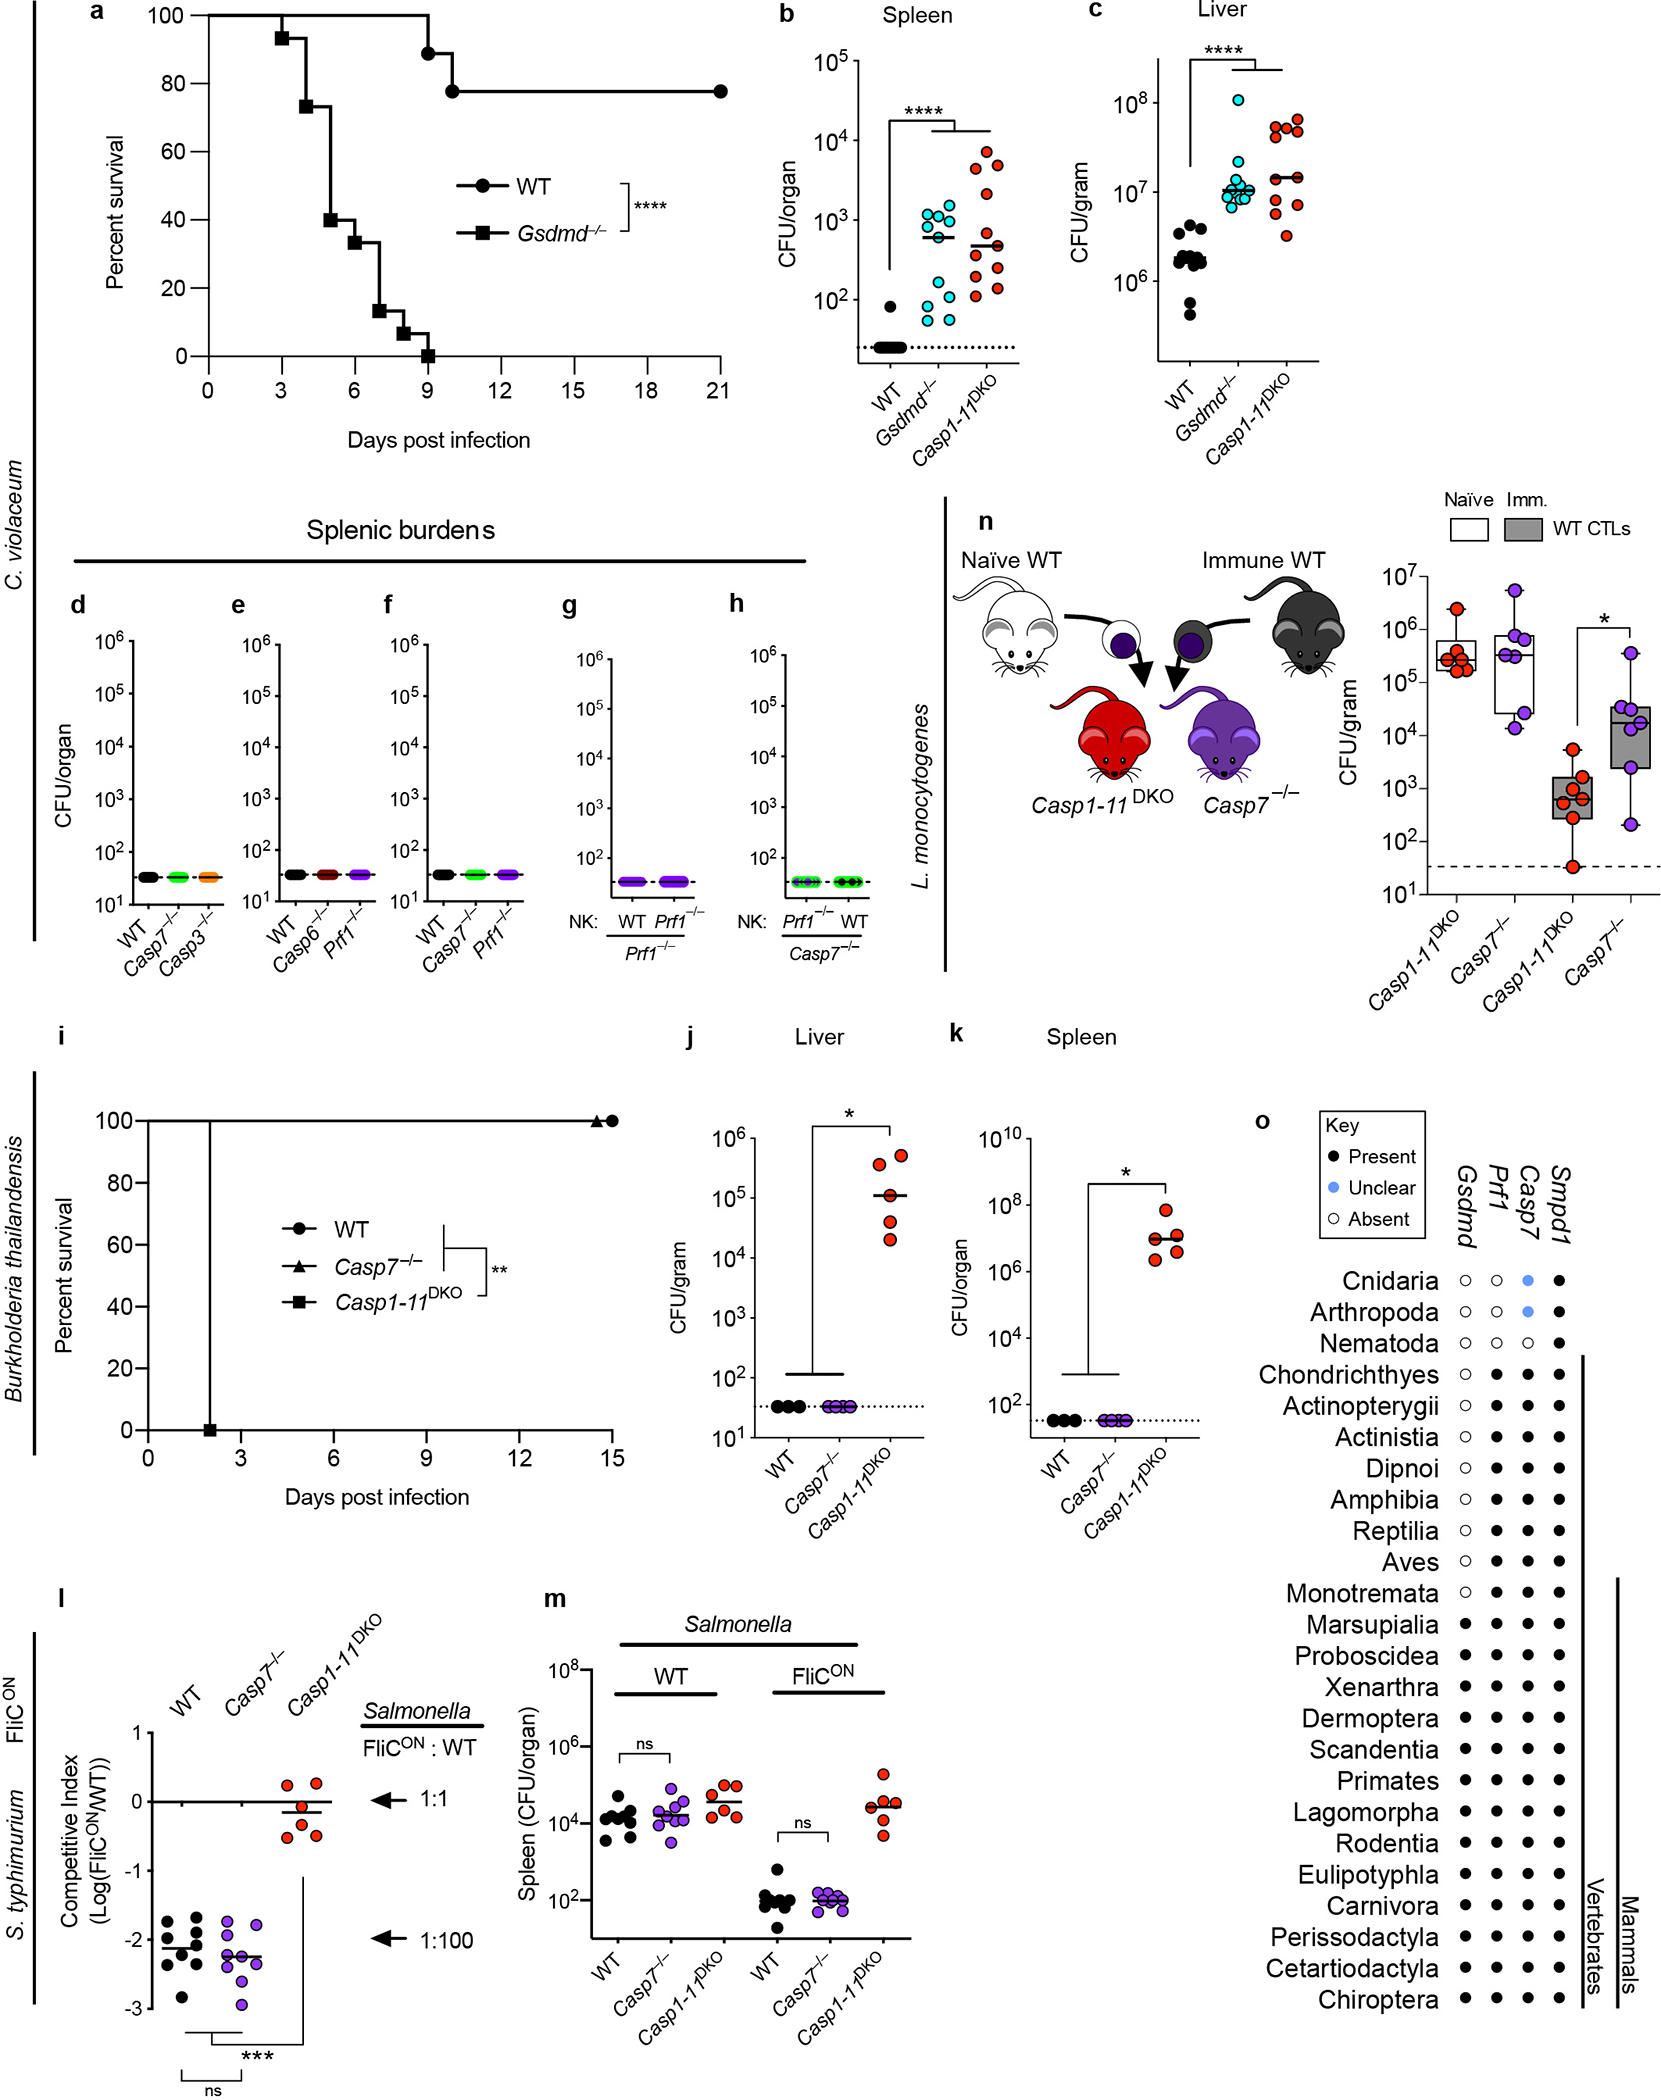
a-c, Mice were infected IP with 1×10⁴ C. violaceum and monitored for survival (a) or harvested for bacterial counts 2 days post infection (dpi) (b-c). d-h, Mice were infected with C. violaceum and spleen burdens determined 3dpi; spleen burdens shown are from the same mice whose liver burdens are shown in Extended Data Fig. 9a, Fig. 4a–b, and Fig. 4d–e. i-k, Mice were infected IP with B. thailandensis at 2×10⁷ (i) or 1×10⁴ CFUs (j-k) and mice were monitored for survival (i) or bacterial burdens were enumerated 3 dpi (j-k). l-m, Mice were infected IP with 1×10⁵ total S. typhimurium (5×10⁴ of WT plus 5×10⁴ of FliCON), with bacterial burdens determined 2 dpi and burdens graphed as competitive index (CI) of FliCON to WT bacteria (l) or graphed as total burdens (m). n, Liver bacterial burdens 3 dpi with 5×10⁴ L. monocytogenes, with adoptive transfer schematic. Donor mice were PBS treated (naïve) or vaccinated with 1×10⁶ ΔactA L. monocytogenes (immune). O, Presence or absence of Smpd1 (encoding ASM), Casp7, Prf1, and Gsdmd in the indicated taxonomic groups were determined by gene annotation and verified by reciprocal BLAST searches against the respective mouse gene product. Data are pooled from three experiments (a-c), pooled from two experiments (d-h, l-n) or representative of two experiments (i-k). Mouse numbers (a) n=9 WT, n=15 Gsdmd−/−; (b-c) n=12 WT, n=11 Casp1−/−Casp11−/−, n=11 Gsdmd−/−; (i) n=5 WT, n=3 Casp1−/−Casp11−/−, n=5 Casp7−/−; (j-k) n=3 WT, n=4 Casp7−/−, n=5 Casp1−/−Casp11−/−; (l-m) n=9 WT, n=9 Casp7−/−, n=6 Casp1−/−Casp11−/−; (n) n=6 naïve Casp1−/−Casp11−/−, n=7 immune Casp1−/−Casp11−/−, n=7 each Casp7−/−. *P < 0.05, **P < 0.01, ***P < 0.001, ****P < 0.0001 (Two-sided Mann-Whitney U test, or (a, i) log-rank Mantel-Cox test). Bars indicate median values. Box plots show median, 25th-75th percentile, whiskers are minimum and maximum. Exact p and n values in Source Data EDF16.
Extended Data Figure 17. Model for membrane repair driven by caspase-7.
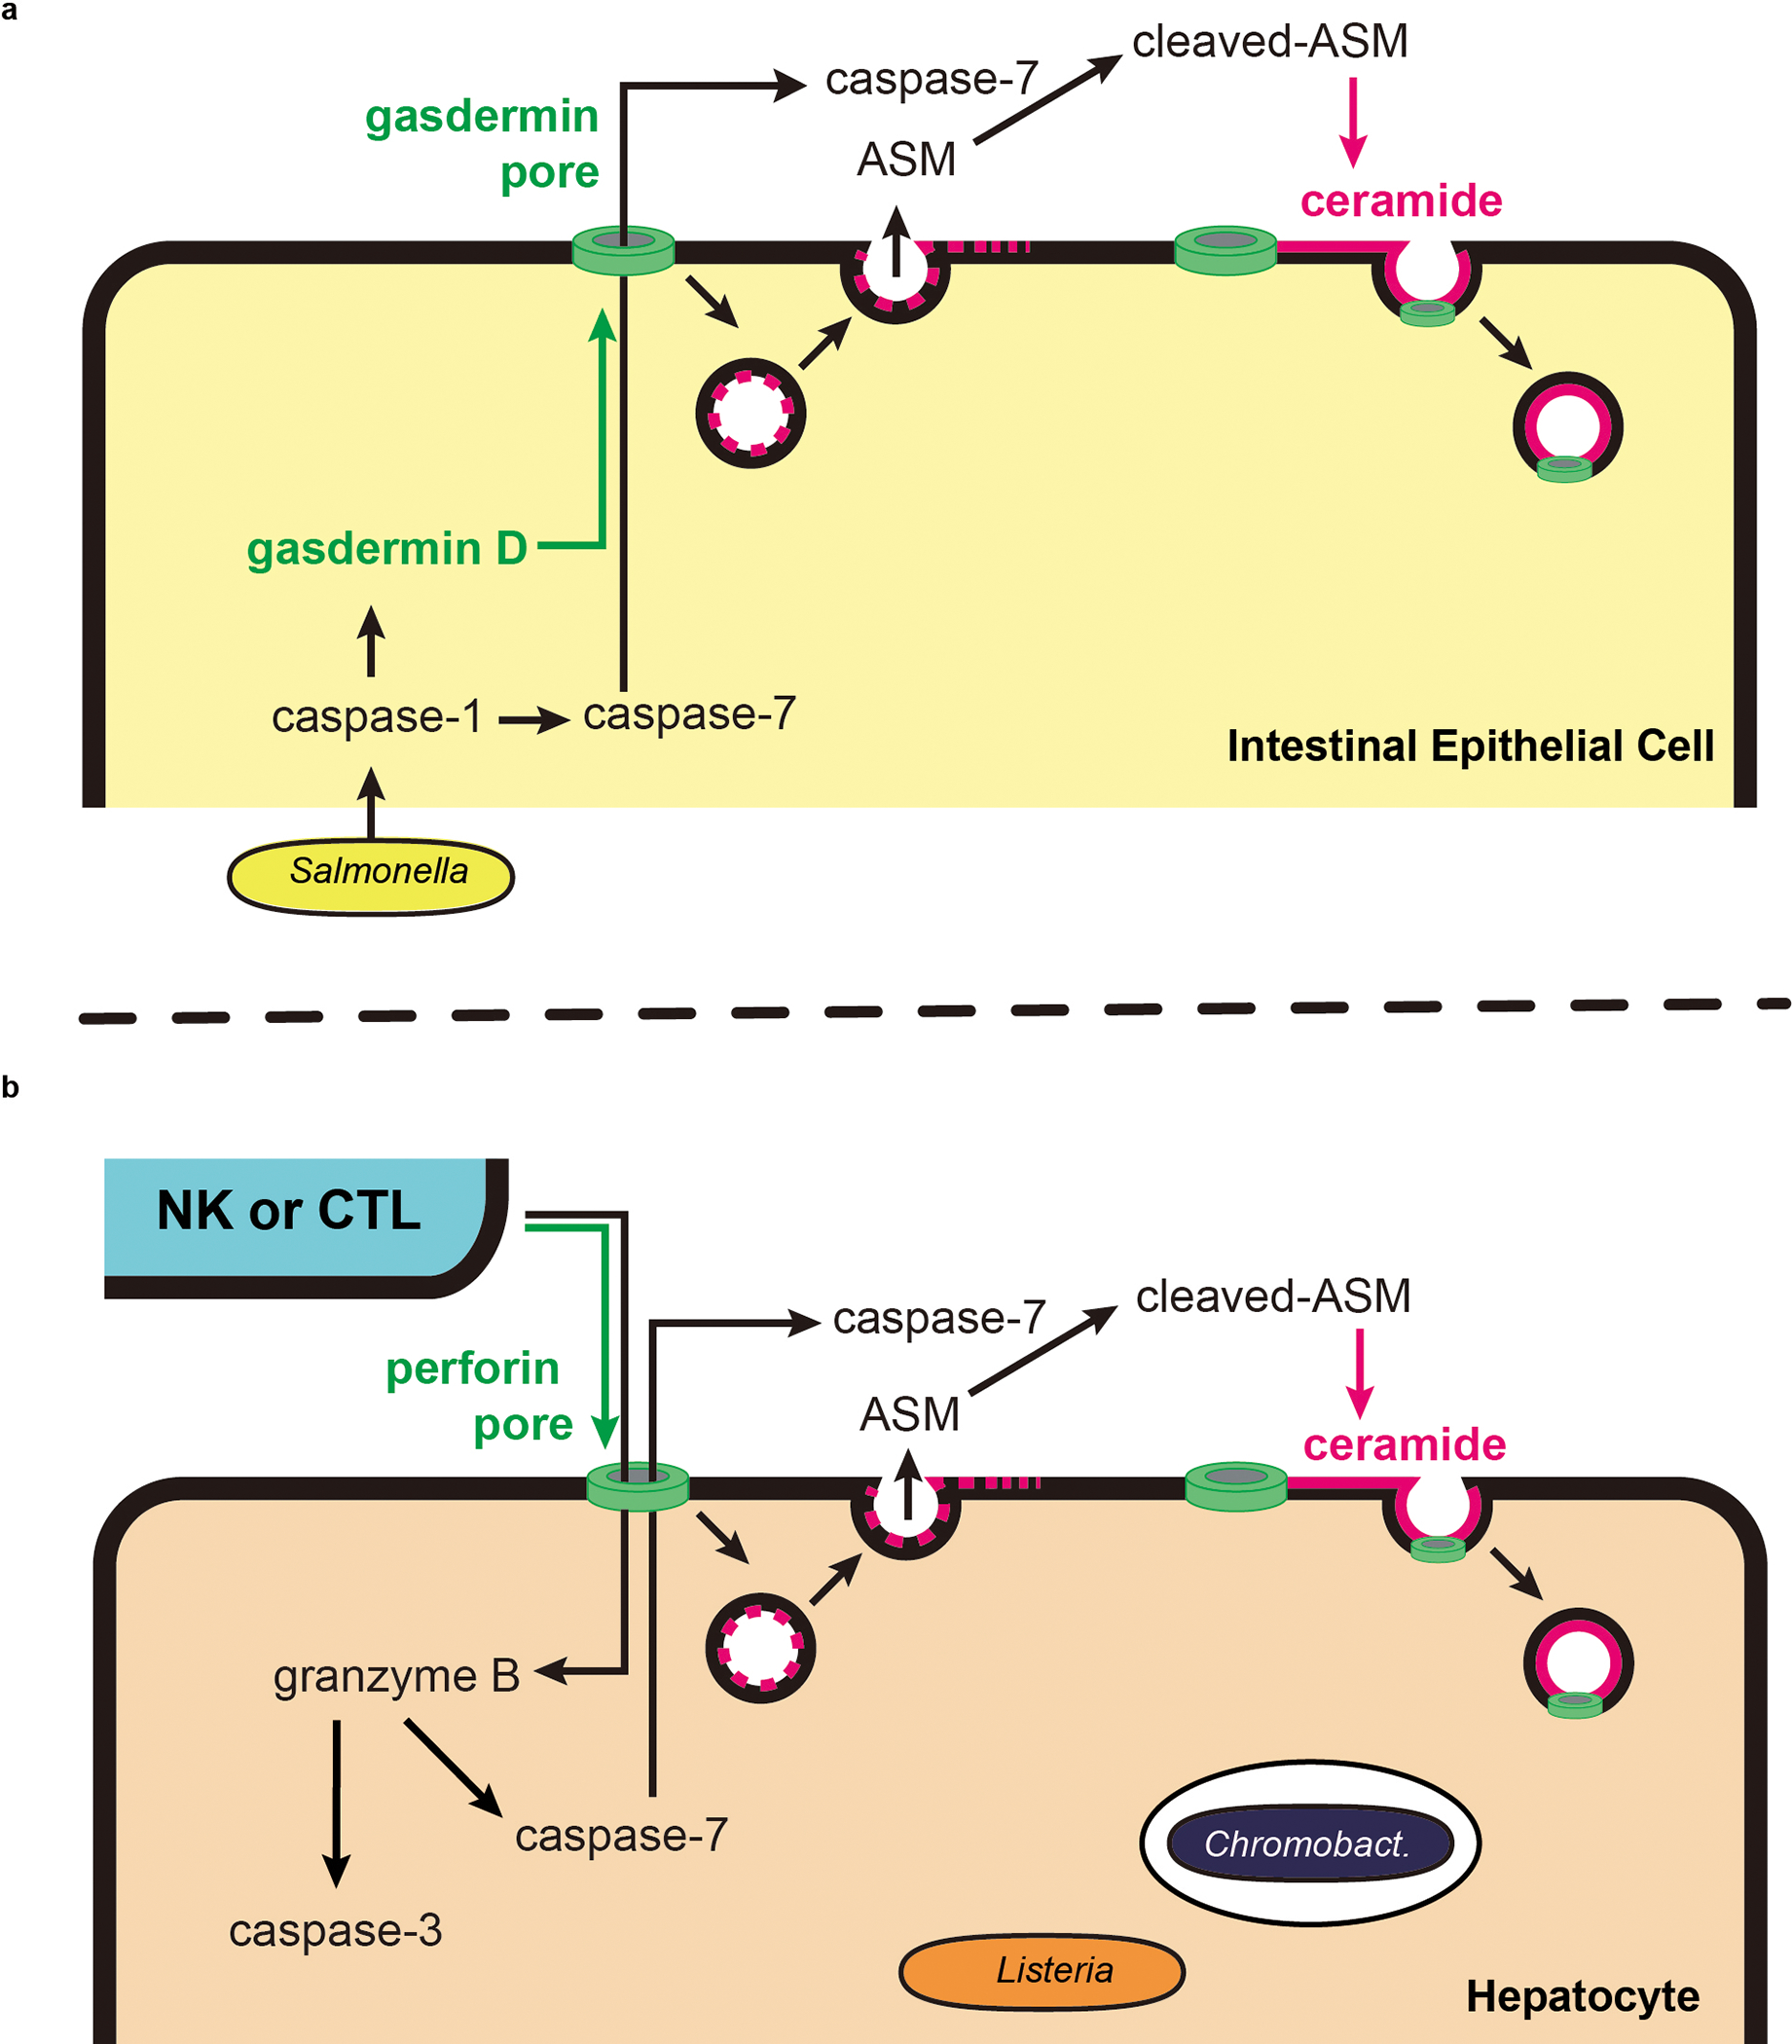
a, IECs detect the activity of the Salmonella T3SS via NLRC4 and activate caspase-1 in response. Caspase-1 then activates both the gasdermin D pore as well as caspase-7. We propose a model where caspase-7 diffuses through the gasdermin D pore, thereby entering the extracellular space. Simultaneously, the gasdermin D pore triggers lysosomal exocytosis, thus delivering acid sphingomyelinase (ASM) to the extracellular space. In this model, caspase-7 and ASM meet in the extracellular space. Note that additional studies will be needed to validate the location of the caspase-7 and ASM interaction. Caspase-7 cleaves ASM, increasing its enzymatic activity and generating more ceramide. This ceramide can then be used for continuous endocytic repair of gasdermin D pores to facilitate IEC extrusion. b, NK cells or CTLs attack by degranulating perforin and granzyme B. Perforin pores allow granzyme B to enter the target cell, where it activates caspase-3 (not shown) and caspase-7. Activated caspase-7 can exit the cell to encounter ASM, which generates ceramide that should allow endocytosis of perforin pores. We propose that this maintains cell integrity long enough for the cell to complete caspase-3-driven apoptosis.
Supplementary Material
Acknowledgements
We thank Drs. Flavell, Dixit, Vance, and Deshmukh for sharing mice directly or via Jackson labs. This work was supported by the following NIH grants: AI097518, AI133236, AI139304, AI119073, AI136920 (E.A.M) AI097518-02S1 (V.I.M), R56AI110682 and R01AI074862 (J.K.W.), R01AI050072 (M.G.B.), and P30CA016086 (UNC Flow Core). We also thank Taylor Abele, Farhan Lakhani, Maria Artunduaga, Morgan DePrizio, Samuel Pereles, Arthi Vaidyanathan, Rhiannon Eplett, Michael Mann, Skylar Redecke, and Laura Scarpelli for mouse colony upkeep.
Footnotes
Declaration of Interests
The authors declare no competing interests.
Additional Information
Supplementary Information is available for this paper. Correspondence and requests for materials should be addressed to EAM (edward.miao@duke.edu). Reprints and permissions information is available at www.nature.com/reprints.
REFERENCES
- 1.Lamkanfi M et al. Targeted peptidecentric proteomics reveals caspase-7 as a substrate of the caspase-1 inflammasomes. Mol Cell Proteomics 7, 2350–2363, doi: 10.1074/mcp.M800132-MCP200 (2008). [DOI] [PMC free article] [PubMed] [Google Scholar]
- 2.Sellin ME et al. Epithelium-intrinsic NAIP/NLRC4 inflammasome drives infected enterocyte expulsion to restrict Salmonella replication in the intestinal mucosa. Cell Host Microbe 16, 237–248, doi: 10.1016/j.chom.2014.07.001 (2014). [DOI] [PubMed] [Google Scholar]
- 3.Rauch I et al. NAIP-NLRC4 Inflammasomes Coordinate Intestinal Epithelial Cell Expulsion with Eicosanoid and IL-18 Release via Activation of Caspase-1 and -8. Immunity 46, 649–659, doi: 10.1016/j.immuni.2017.03.016 (2017). [DOI] [PMC free article] [PubMed] [Google Scholar]
- 4.Kuida K et al. Decreased apoptosis in the brain and premature lethality in CPP32-deficient mice. Nature 384, 368–372, doi: 10.1038/384368a0 (1996). [DOI] [PubMed] [Google Scholar]
- 5.Lakhani SA et al. Caspases 3 and 7: key mediators of mitochondrial events of apoptosis. Science 311, 847–851, doi: 10.1126/science.1115035 (2006). [DOI] [PMC free article] [PubMed] [Google Scholar]
- 6.Wu C et al. BioGPS: an extensible and customizable portal for querying and organizing gene annotation resources. Genome Biol 10, R130, doi: 10.1186/gb-2009-10-11-r130 (2009). [DOI] [PMC free article] [PubMed] [Google Scholar]
- 7.Reikvam DH et al. Depletion of murine intestinal microbiota: effects on gut mucosa and epithelial gene expression. PLoS One 6, e17996, doi: 10.1371/journal.pone.0017996 (2011). [DOI] [PMC free article] [PubMed] [Google Scholar]
- 8.Marchiando AM et al. The epithelial barrier is maintained by in vivo tight junction expansion during pathologic intestinal epithelial shedding. Gastroenterology 140, 1208–1218.e1201–1202, doi: 10.1053/j.gastro.2011.01.004 (2011). [DOI] [PMC free article] [PubMed] [Google Scholar]
- 9.Nozaki K, Li L & Miao EA Innate Sensors Trigger Regulated Cell Death to Combat Intracellular Infection. Annu Rev Immunol, doi: 10.1146/annurev-immunol-101320-011235 (2022). [DOI] [PMC free article] [PubMed] [Google Scholar]
- 10.Andrews NW, Almeida PE & Corrotte M Damage control: cellular mechanisms of plasma membrane repair. Trends Cell Biol 24, 734–742, doi: 10.1016/j.tcb.2014.07.008 (2014). [DOI] [PMC free article] [PubMed] [Google Scholar]
- 11.Edelmann B et al. Caspase-8 and caspase-7 sequentially mediate proteolytic activation of acid sphingomyelinase in TNF-R1 receptosomes. EMBO J 30, 379–394, doi: 10.1038/emboj.2010.326 (2011). [DOI] [PMC free article] [PubMed] [Google Scholar]
- 12.Ferlinz K et al. Functional characterization of the N-glycosylation sites of human acid sphingomyelinase by site-directed mutagenesis. Eur J Biochem 243, 511–517, doi: 10.1111/j.1432-1033.1997.511_1a.x (1997). [DOI] [PubMed] [Google Scholar]
- 13.Andrews NW, Corrotte M & Castro-Gomes T Above the fray: Surface remodeling by secreted lysosomal enzymes leads to endocytosis-mediated plasma membrane repair. Semin Cell Dev Biol 45, 10–17, doi: 10.1016/j.semcdb.2015.09.022 (2015). [DOI] [PMC free article] [PubMed] [Google Scholar]
- 14.Llacuna L, Marí M, Garcia-Ruiz C, Fernandez-Checa JC & Morales A Critical role of acidic sphingomyelinase in murine hepatic ischemia-reperfusion injury. Hepatology 44, 561–572, doi: 10.1002/hep.21285 (2006). [DOI] [PubMed] [Google Scholar]
- 15.Müller AJ et al. The S. Typhimurium effector SopE induces caspase-1 activation in stromal cells to initiate gut inflammation. Cell Host Microbe 6, 125–136, doi: 10.1016/j.chom.2009.07.007 (2009). [DOI] [PubMed] [Google Scholar]
- 16.Quan LT et al. Proteolytic activation of the cell death protease Yama/CPP32 by granzyme B. Proc Natl Acad Sci U S A 93, 1972–1976, doi: 10.1073/pnas.93.5.1972 (1996). [DOI] [PMC free article] [PubMed] [Google Scholar]
- 17.Darmon AJ, Nicholson DW & Bleackley RC Activation of the apoptotic protease CPP32 by cytotoxic T-cell-derived granzyme B. Nature 377, 446–448, doi: 10.1038/377446a0 (1995). [DOI] [PubMed] [Google Scholar]
- 18.Chinnaiyan AM et al. Cytotoxic T-cell-derived granzyme B activates the apoptotic protease ICE-LAP3. Curr Biol 6, 897–899, doi: 10.1016/s0960-9822(02)00614-0 (1996). [DOI] [PubMed] [Google Scholar]
- 19.Gu Y et al. Processing and activation of CMH-1 by granzyme B. J Biol Chem 271, 10816–10820, doi: 10.1074/jbc.271.18.10816 (1996). [DOI] [PubMed] [Google Scholar]
- 20.Orth K, Chinnaiyan AM, Garg M, Froelich CJ & Dixit VM The CED-3/ICE-like protease Mch2 is activated during apoptosis and cleaves the death substrate lamin A. J Biol Chem 271, 16443–16446 (1996). [PubMed] [Google Scholar]
- 21.Jorgensen I, Rayamajhi M & Miao EA Programmed cell death as a defence against infection. Nat Rev Immunol 17, 151–164, doi: 10.1038/nri.2016.147 (2017). [DOI] [PMC free article] [PubMed] [Google Scholar]
- 22.Batista JH & da Silva Neto JF Pathogenicity: Updates and Insights from Genome Sequencing of Novel. Front Microbiol 8, 2213, doi: 10.3389/fmicb.2017.02213 (2017). [DOI] [PMC free article] [PubMed] [Google Scholar]
- 23.Maltez VI et al. Inflammasomes Coordinate Pyroptosis and Natural Killer Cell Cytotoxicity to Clear Infection by a Ubiquitous Environmental Bacterium. Immunity 43, 987–997, doi: 10.1016/j.immuni.2015.10.010 (2015). [DOI] [PMC free article] [PubMed] [Google Scholar]
- 24.Rongvaux A et al. Apoptotic caspases prevent the induction of type I interferons by mitochondrial DNA. Cell 159, 1563–1577, doi: 10.1016/j.cell.2014.11.037 (2014). [DOI] [PMC free article] [PubMed] [Google Scholar]
- 25.McArthur K et al. BAK/BAX macropores facilitate mitochondrial herniation and mtDNA efflux during apoptosis. Science 359, doi: 10.1126/science.aao6047 (2018). [DOI] [PubMed] [Google Scholar]
- 26.Sauer JD et al. Listeria monocytogenes engineered to activate the Nlrc4 inflammasome are severely attenuated and are poor inducers of protective immunity. Proc Natl Acad Sci U S A 108, 12419–12424, doi: 10.1073/pnas.1019041108 (2011). [DOI] [PMC free article] [PubMed] [Google Scholar]
- 27.Warren SE et al. Generation of a Listeria vaccine strain by enhanced caspase-1 activation. Eur J Immunol 41, 1934–1940, doi: 10.1002/eji.201041214 (2011). [DOI] [PMC free article] [PubMed] [Google Scholar]
- 28.Clark SE, Schmidt RL, McDermott DS & Lenz LL A Batf3/Nlrp3/IL-18 Axis Promotes Natural Killer Cell IL-10 Production during Listeria monocytogenes Infection. Cell Rep 23, 2582–2594, doi: 10.1016/j.celrep.2018.04.106 (2018). [DOI] [PMC free article] [PubMed] [Google Scholar]
- 29.Kägi D, Ledermann B, Bürki K, Hengartner H & Zinkernagel RM CD8+ T cell-mediated protection against an intracellular bacterium by perforin-dependent cytotoxicity. Eur J Immunol 24, 3068–3072, doi: 10.1002/eji.1830241223 (1994). [DOI] [PubMed] [Google Scholar]
- 30.Harty JT, Lenz LL & Bevan MJ Primary and secondary immune responses to Listeria monocytogenes. Curr Opin Immunol 8, 526–530, doi: 10.1016/s0952-7915(96)80041-0 (1996). [DOI] [PMC free article] [PubMed] [Google Scholar]
- 31.Hsu KM, Pratt JR, Akers WJ, Achilefu SI & Yokoyama WM Murine cytomegalovirus displays selective infection of cells within hours after systemic administration. J Gen Virol 90, 33–43, doi: 10.1099/vir.0.006668-0 (2009). [DOI] [PMC free article] [PubMed] [Google Scholar]
- 32.Kägi D et al. Cytotoxicity mediated by T cells and natural killer cells is greatly impaired in perforin-deficient mice. Nature 369, 31–37, doi: 10.1038/369031a0 (1994). [DOI] [PubMed] [Google Scholar]
- 33.Rühl S et al. ESCRT-dependent membrane repair negatively regulates pyroptosis downstream of GSDMD activation. Science 362, 956–960, doi: 10.1126/science.aar7607 (2018). [DOI] [PubMed] [Google Scholar]
- 34.Gong YN et al. ESCRT-III Acts Downstream of MLKL to Regulate Necroptotic Cell Death and Its Consequences. Cell 169, 286–300.e216, doi: 10.1016/j.cell.2017.03.020 (2017). [DOI] [PMC free article] [PubMed] [Google Scholar]
- 35.Boucher D et al. Caspase-1 self-cleavage is an intrinsic mechanism to terminate inflammasome activity. J Exp Med 215, 827–840, doi: 10.1084/jem.20172222 (2018). [DOI] [PMC free article] [PubMed] [Google Scholar]
- 36.Jost PJ et al. XIAP discriminates between type I and type II FAS-induced apoptosis. Nature 460, 1035–1039, doi: 10.1038/nature08229 (2009). [DOI] [PMC free article] [PubMed] [Google Scholar]
- 37.Halle S et al. In Vivo Killing Capacity of Cytotoxic T Cells Is Limited and Involves Dynamic Interactions and T Cell Cooperativity. Immunity 44, 233–245, doi: 10.1016/j.immuni.2016.01.010 (2016). [DOI] [PMC free article] [PubMed] [Google Scholar]
- 38.Keefe D et al. Perforin triggers a plasma membrane-repair response that facilitates CTL induction of apoptosis. Immunity 23, 249–262, doi: 10.1016/j.immuni.2005.08.001 (2005). [DOI] [PubMed] [Google Scholar]
- 39.Thiery J et al. Perforin activates clathrin- and dynamin-dependent endocytosis, which is required for plasma membrane repair and delivery of granzyme B for granzyme-mediated apoptosis. Blood 115, 1582–1593, doi: 10.1182/blood-2009-10-246116 (2010). [DOI] [PMC free article] [PubMed] [Google Scholar]
- 40.Jorgensen I, Zhang Y, Krantz BA & Miao EA Pyroptosis triggers pore-induced intracellular traps (PITs) that capture bacteria and lead to their clearance by efferocytosis. J Exp Med 213, 2113–2128, doi: 10.1084/jem.20151613 (2016). [DOI] [PMC free article] [PubMed] [Google Scholar]
METHODS REFERENCES
- 41.Mariathasan S et al. Differential activation of the inflammasome by caspase-1 adaptors ASC and Ipaf. Nature 430, 213–218, doi: 10.1038/nature02664 (2004). [DOI] [PubMed] [Google Scholar]
- 42.Kuida K et al. Altered cytokine export and apoptosis in mice deficient in interleukin-1 beta converting enzyme. Science 267, 2000–2003 (1995). [DOI] [PubMed] [Google Scholar]
- 43.Zheng TS, Hunot S, Kuida K & Flavell RA Caspase knockouts: matters of life and death. Cell Death Differ 6, 1043–1053, doi: 10.1038/sj.cdd.4400593 (1999). [DOI] [PubMed] [Google Scholar]
- 44.Miao EA et al. Caspase-1-induced pyroptosis is an innate immune effector mechanism against intracellular bacteria. Nat Immunol 11, 1136–1142, doi: 10.1038/ni.1960 (2010). [DOI] [PMC free article] [PubMed] [Google Scholar]
- 45.Wheat RL, Clark PY & Brown MG Quantitative measurement of infectious murine cytomegalovirus genomes in real-time PCR. J Virol Methods 112, 107–113, doi: 10.1016/s0166-0934(03)00197-6 (2003). [DOI] [PubMed] [Google Scholar]
- 46.Barthel M et al. Pretreatment of mice with streptomycin provides a Salmonella enterica serovar Typhimurium colitis model that allows analysis of both pathogen and host. Infect Immun 71, 2839–2858, doi: 10.1128/iai.71.5.2839-2858.2003 (2003). [DOI] [PMC free article] [PubMed] [Google Scholar]
- 47.Butler SL et al. The antigen for Hep Par 1 antibody is the urea cycle enzyme carbamoyl phosphate synthetase 1. Lab Invest 88, 78–88, doi: 10.1038/labinvest.3700699 (2008). [DOI] [PubMed] [Google Scholar]
- 48.Sato T et al. Single Lgr5 stem cells build crypt-villus structures in vitro without a mesenchymal niche. Nature 459, 262–265, doi: 10.1038/nature07935 (2009). [DOI] [PubMed] [Google Scholar]
- 49.Miyoshi H & Stappenbeck TS In vitro expansion and genetic modification of gastrointestinal stem cells in spheroid culture. Nat Protoc 8, 2471–2482, doi: 10.1038/nprot.2013.153 (2013). [DOI] [PMC free article] [PubMed] [Google Scholar]
- 50.von Moltke J et al. Rapid induction of inflammatory lipid mediators by the inflammasome in vivo. Nature 490, 107–111, doi: 10.1038/nature11351 (2012). [DOI] [PMC free article] [PubMed] [Google Scholar]
- 51.Gregory SH, Jiang X & Wing EJ Lymphokine-activated killer cells lyse Listeria-infected hepatocytes and produce elevated quantities of interferon-gamma. J Infect Dis 174, 1073–1079, doi: 10.1093/infdis/174.5.1073 (1996). [DOI] [PubMed] [Google Scholar]
- 52.Badovinac VP & Harty JT Adaptive immunity and enhanced CD8+ T cell response to Listeria monocytogenes in the absence of perforin and IFN-gamma. J Immunol 164, 6444–6452, doi: 10.4049/jimmunol.164.12.6444 (2000). [DOI] [PubMed] [Google Scholar]
- 53.Ahmed R, Salmi A, Butler LD, Chiller JM & Oldstone MB Selection of genetic variants of lymphocytic choriomeningitis virus in spleens of persistently infected mice. Role in suppression of cytotoxic T lymphocyte response and viral persistence. J Exp Med 160, 521–540, doi: 10.1084/jem.160.2.521 (1984). [DOI] [PMC free article] [PubMed] [Google Scholar]
- 54.Cooper HS, Murthy SN, Shah RS & Sedergran DJ Clinicopathologic study of dextran sulfate sodium experimental murine colitis. Lab Invest 69, 238–249 (1993). [PubMed] [Google Scholar]
Associated Data
This section collects any data citations, data availability statements, or supplementary materials included in this article.
Supplementary Materials
Data Availability Statement
All relevant data are included in the Article or its Supplementary Information and Source Data files. More details are available from the corresponding authors upon request.


