Abstract
The striatum is the main input structure of the basal ganglia, receiving information from the cortex and the thalamus and consisting of D1- and D2- medium spiny neurons (MSNs). D1-MSNs and D2-MSNs are essential for motor control and cognitive behaviors and have implications in Parkinson’s Disease. In the present study, we demonstrated that Sp9-positive progenitors produced both D1-MSNs and D2-MSNs and that Sp9 expression was rapidly downregulated in postmitotic D1-MSNs. Furthermore, we found that sustained Sp9 expression in lateral ganglionic eminence (LGE) progenitor cells and their descendants led to promoting D2-MSN identity and repressing D1-MSN identity during striatal development. As a result, sustained Sp9 expression resulted in an imbalance between D1-MSNs and D2-MSNs in the mouse striatum. In addition, the fate-changed D2-like MSNs survived normally in adulthood. Taken together, our findings supported that Sp9 was sufficient to promote D2-MSN identity and repress D1-MSN identity, and Sp9 was a negative regulator of D1-MSN fate.
Subject terms: Cellular neuroscience, Development of the nervous system
Introduction
The mammalian striatum, a crucial structure in the motor system, can receive and integrate excitatory inputs from the cortex, then the striatal signals flow to the internal segment of the globus pallidus (GPi) and the substantia nigra pars reticulata (SNr), which make outputs back to the cortex to control brain functions, such as movement, reward, motivation and cognitive behaviors [1]. Medium spiny neurons (MSNs), constituting 90%–95% of all neurons in the striatum, are derived from the ventral lateral ganglionic eminence (vLGE) during the embryonic period [2, 3]. Neural stem cells from the germinal zone (GZ) in the vLGE proliferate and then migrate radially to the mantle zone (MZ), where they undergo terminal neuronal differentiation to become MSNs of the striatum [4–7]. The D1-MSNs (striatonigral projection neurons) express the neuropeptide substance P (TAC1) and dopamine D1 receptor (DRD1). The D2-MSNs (striatopallidal projection neurons) express the neuropeptide enkephalin (PENK) and dopamine D2 receptor (DRD2) [1, 8, 9]. These two subpopulations of MSNs participate in two efferent pathways that functionally oppose each other and provide a balanced output from the basal ganglia [10]. This particular balance is widely believed to be crucial for normal motor control [11]. Abnormality or damage to striatal function leads to a spectrum of pathologies, such as Parkinson’s disease and Huntington’s disease, in humans [12–15]. Although previous single-cell analysis of the mouse striatum revealed diverse striatal cells in the adult striatum and the spatial distribution of different MSNs in the early postnatal striatum [16–18], the development of D1-MSNs and D2-MSNs and the mechanism by which they are targeted and integrated into striatal circuits are not fully understood. Furthermore, whether the neural stem cell pool of the vLGE exhibits diverse states and lineage plasticity in the specific time window during brain development has not been ascertained. These unresolved issues impelled us to explore lineage-targeted transcriptomics of the LGE at the single-cell level to identify key molecular determinants of MSN specification.
In this study, we identified a number of genes that were differentially expressed in two subpopulations of MSNs and a series of transcription factors that were found to be essential to the fate determination of MSNs. We demonstrated that Sp9-positive progenitors were common precursor cells of D1-MSNs and D2-MSNs. In particular, Sp9-positive progenitors formed the bridge linking neural stem cells to MSNs. As indicated in our previous study, the transcription factor Sp9 was involved in striatal development, serving as a pivotal transcription factor for the development of D2-MSNs. Notably, in this case, Sp9-null mice lose most D2-MSNs, whereas the D1-MSNs development is largely unaffected [19, 20]. Accordingly, during striatal development, Sp9 expression is downregulated in D1-MSNs, and the high level of Sp9 expression is limited to D2-MSNs. These findings raised the possibility that the downregulation of Sp9 expression may be necessary for the differentiation and maturation of D1-MSNs. We hypothesized that if Sp9 expression was maintained in LGE progenitor cells and their progeny, including D1-restricted cells (pre-D1- MSNs), the fate of pre-D1-MSNs may change into D2-MSNs. To test this hypothesis, we generated Rosa-Sp9-OE/+ mice and obtained conditional Sp9-overexpression mice by crossing the Rosa-Sp9-OE/+mice with Cre reporter mice. We found that Sp9 overexpression led to a reasonable proportion of pre-D1-MSNs developing into D2-like MSNs. Moreover, the fate switching between D1-MSNs and D2-like MSNs was gradual, and these D2-like MSNs survived normally in the adult brain.
Results
Single-cell transcriptome analysis delineates cellular heterogeneity in the mouse lateral ganglionic eminence
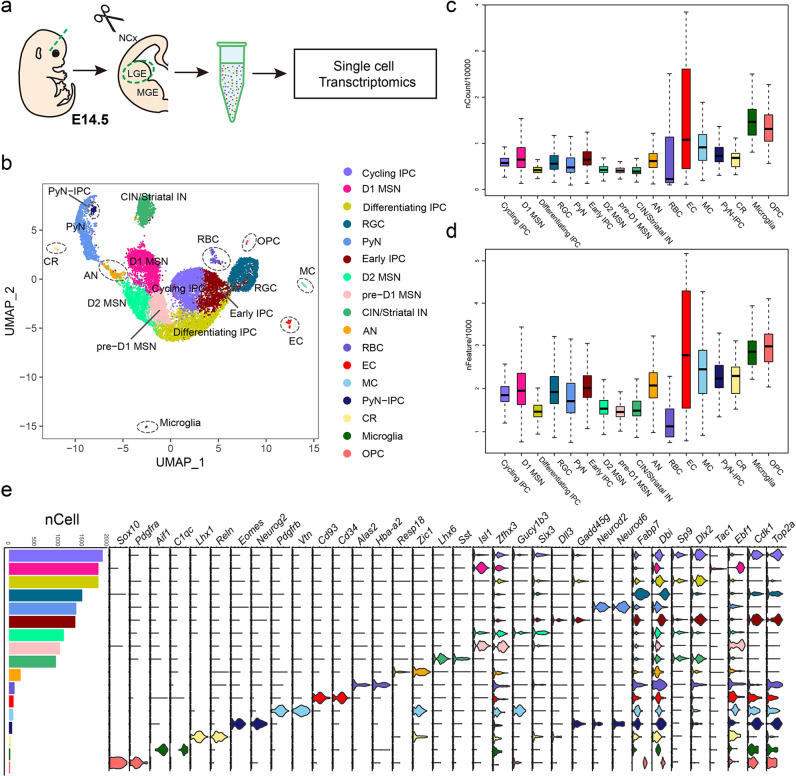
The lateral ganglionic eminence in the ventral telencephalon is the primordium of the striatum. To systematically characterize the cell types in the LGE, we dissected the LGE from the mouse subpallium (eight total samples) at embryonic day 14.5 (E14.5), which is a crucial period in which striatal medium spiny neurons emerge, and we performed single-cell RNA sequencing (scRNA-seq) using 10X Genomics Chromium technology V3 [21] (Fig. 1a). A total of 17,555 single cells were harvested, and the transcriptome was profiled. Finally, 5587 unique molecular identifiers (UMIs) (median = 3837) and 1794 genes (median = 1620) per cell were detected (Fig. 1c, d). After quality control, a final data set of 14,001 cells was obtained. Unsupervised clustering using Uniform Manifold Approximation and Projection (UMAP) revealed seventeen clusters with distinct gene expression signatures (Fig. 1b). The principal cell types found within the LGE were radial glial cells (RGCs) (e.g., markers Dbi and Fabp7), early intermediate progenitors (early IPCs)(e.g., markers Gadd45g and Dll3), cycling intermediate progenitors (cycling IPCs) (e.g., markers Top2a and Cdk1), differentiating intermediate progenitors (differentiating IPCs) (e.g., markers Dlx2 and Sp9), pre-D1-MSNs (e.g., markers Zfp503 and Isl1), D1-MSNs (e.g., markers Ebf1 and Tac1) and D2-MSNs (e.g., markers Gucy1b3 and Six3) [18, 22] (Fig. 1e). The other cell clusters expressed the markers of projection pyramidal neurons (PyN) (e.g., markers Neurod2 and Neurod6), interneurons (e.g., markers Lhx6 and Sst), amygdala neurons (e.g., markers Zic1 and Resp18), red blood cells (e.g., markers Hba-a2 and Alas2), ependymal cells (e.g., markers Cd34 and Cd93), mural cells (e.g., markers Pdgfrb and Vtn), PyN intermediate progenitors (PyN IPCs) (e.g., markers Neurog2 and Eomes), Cajal-Retzius cells (e.g., markers Reln and Lhx1), Microglia (e.g., markers C1qc and Aif1) and OPC (e.g., markers Sox10 and Pdgfra) [21] (Fig. 1e), which made up a small proportion of total cells within the LGE (Fig. 1b, e), and we therefore decided not to take these cell types into account in the following analyses.
Fig. 1. Single-cell transcriptome delineates mouse lateral ganglionic eminence cellular heterogeneity.
a Schematic view of the experimental workflow. b Cellular composition of the lateral ganglionic eminence (LGE) was visualized using UMAP, and seventeen clusters were identified and annotated. Individual single-cell transcriptomes were colored on the basis of cluster identity. c, d Boxplots showed the number of unique molecular identifiers (UMIs, nCounts) per cluster (scale is in ten thousand) and the number of genes (nFeatures) detected per cluster (scale is in thousands). e Graph showed the number of cells per cluster. Violin plots depicted the expression of cell-type-specific marker genes for each cluster. Individual clusters was colored on the basis of cluster identity as shown in b. IN: interneurons, AN: amygdala neurons, RBC: red blood cells, EC: ependymal cells, MC: mural cells, CR: Cajal-Retzius cells.
scRNA-seq reveals Sp9-positive progenitors are common progenitors of striatal MSNs
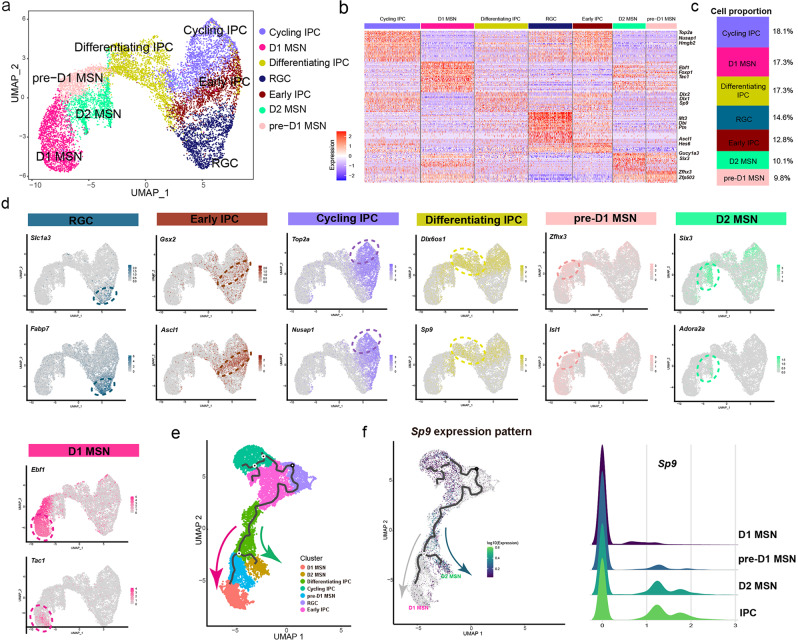
Striatal medium spiny neurons and neuronal progenitors made up a majority of the total cell population (Fig. 1b, e). To directly investigate the development of MSNs, all irrelevant cells, including PyNs, interneurons, amygdala neurons, red blood cells, ependymal cells, mural cells, PyN IPCs, Cajal-Retzius cells, microglia and OPCs, were filtered for downstream clustering, resulting in seven clusters, including RGCs, IPCs (early IPCs, cycling IPCs, differentiating IPCs), pre-D1-MSNs, D1-MSNs and D2-MSNs (Fig. 2a). We showed seven clusters expressing RGCs markers (Slc1a3 and Fabp7), early IPCs markers (Gsx2, Ascl1), cycling IPCs markers (Top2a, Nusap1), differentiating IPCs markers (Dlx6os1, Sp9), pre-D1-MSNs markers (Zfhx3, Isl1), D1-MSNs markers (Ebf1 and Tac1), and D2-MSNs markers (Six3, Adora2a) (Fig. 2b, d). Among all these cells, 9.8% were pre-D1-MSNs, 17.3% were D1-MSNs and 10.1% were D2-MSNs (Fig. 2c).
Fig. 2. Identification of the developmental hierarchy of LGE cells.
a The UMAP plot of LGE cells. b The heatmap of the LGE cells ordered by the UMAP showed in a. Each column represents expression in one cell, and each row represents expression of one gene. c The proportions of distinct clusters among total LGE cells. d UMAP plots of the expression levels of selected marker genes in the seven subpopulations. e Monocle3 revealed predicted lineage trajectories from RGC in the LGE; each point represents a cell and is colored on the basis of cluster identity. f Sp9 expression pattern in the predicted lineage trajectories, and ridge plots shows Sp9 expression distribution in the MSN Progenitor, pre-D1 MSN, D1 MSN, and D2 MSN.
To further investigate cell trajectories during MSN development, we utilized Monocle3, a statistical framework for inferring branching lineage assignments and developmental distances. Cell lineage development was predicted to start from radial glial cells passing through intermediate progenitors, after which two distinct trajectories were identified that led to either a D1-MSN or a D2-MSN fate (Fig. 2e). The trajectories showed that Sp9-positive progenitors were located between radial glial cells and MSNs, supporting the hypothesis that Sp9-positive progenitors serve as a transitional cell type and are common MSN progenitors. Notably, a series of transcription factors identified previously were expressed in these progenitors, including Dlx1/2 [23], Dlx5/6 [24, 25], and Ascl1 [26, 27], indicating that they play vital roles in MSN differentiation. In this study, we showed the Sp9 expression pattern in the trajectories, which revealed that Sp9 was widely expressed in D2-MSNs and IPCs (early IPCs, cycling IPCs and differentiating IPCs), but was not expressed in pre-D1-MSNs or D1-MSNs (Fig. 2e, f). Taken together, the single-cell transcriptomics data support the hypothesis that Sp9-positive progenitor cells form a bridge, which contributes to the development of striatal MSNs, and the downregulation of Sp9 may be essential for the development of D1-MSNs.
Sp9-positive LGE progenitors give rise to both D1-MSNs and D2-MSNs but Sp9 expression is downregulated in immature postmitotic D1-MSNs
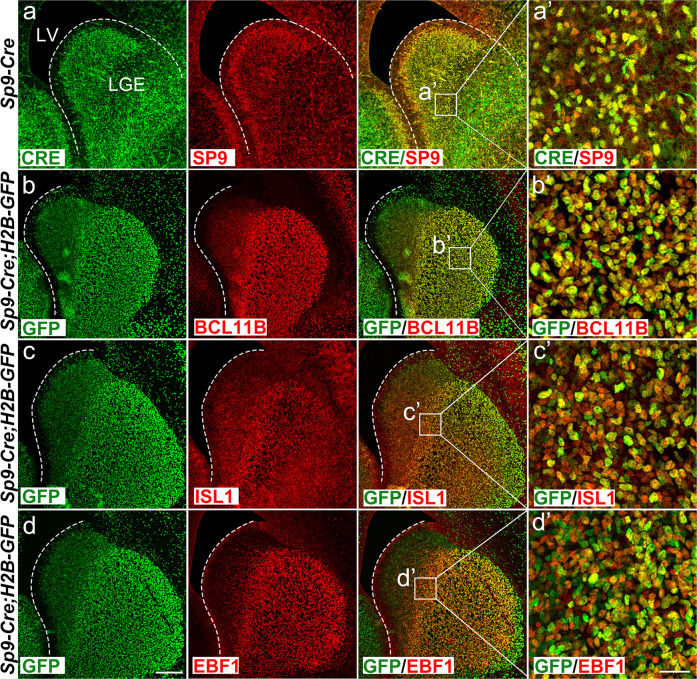
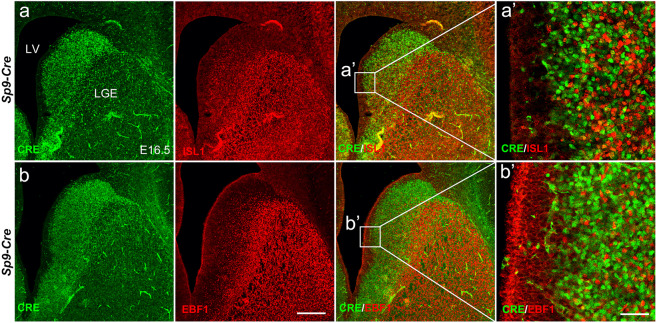
Previously, we demonstrated that a subset of Sp9-positive cells in the LGE subventricular zone (SVZ) expressed the proneural gene Ascl1, suggesting that Sp9 is expressed in LGE progenitors [20]. We also generated Sp9-Cre knock-in mice [20] and fate mapping at P30 using Sp9-Cre; Rosa-YFP mice showed that Sp9-positive progenitors generated all FOXP1 (a pan postmitotic MSN marker) positive cells in the LGE, indicating that, at the population level, Sp9-positive progenitors gave rise to both D1-MSNs and D2-MSNs. Our single-cell transcriptome analysis confirmed this initial finding, showing a clear developmental trajectory that Sp9-positive progenitors could transform into both D1-MSNs and D2-MSNs. In this study, we also proved that Sp9-Cre expression faithfully reflected the SP9 protein pattern, as virtually all Sp9-Cre-positive cells expressed the SP9 protein in the LGE at E16.5 (Fig. 3a-a’). Furthermore, immunostaining clearly showed that all BCL11B+, ISL1+ and EBF1+ cells were labeled with GFP in Sp9-Cre; Rosa-H2b-GFP LGE at E16.5 (Fig. 3b–d’). However, Sp9 (Sp9-cre) expression was rapidly downregulated in the immature postmitotic D1-MSNs of the LGE SVZ while Sp9 continued to be expressed in D2-MSNs, as only a few Sp9-Cre-positive cells expressed ISL1, and even fewer (or no) Sp9-Cre-positive cells expressed EBF1 (Fig. 4a, b’). These results revealed that Sp9 was rapidly downregulated in immature postmitotic D1-MSNs while it was expressed in common progenitors of D1-MSNs and D2-MSNs, and Sp9 was only maintained in D2-MSNs after MSN differentiation.
Fig. 3. SP9+ LGE progenitors generate both D1-MSNs and D2-MSNs.
a CRE/SP9 double immunostaining in the LGE of the Sp9-Cre mice at E16.5. a’ Higher magnification images of CRE+/SP9+ cells in the LGE. b BCL11B/GFP double immunostaining in the Sp9-Cre; H2B-GFP LGE at E16.5. b’ Higher magnification images of BCL11B +/GFP+ cells in the LGE. c ISL1+/GFP+ double immunostaining in Sp9-Cre; H2B-GFP LGE at E16.5. c’ Higher magnification images of ISL1+/GFP+ cells in the LGE. d EBF1+/GFP+ double immunostaining in Sp9-Cre; H2B-GFP LGE at E16.5. d’ Higher magnification images of EBF1+/GFP+ cells in the LGE. Scale bars: 100 µm in d for a–d, and 25 µm in d’ for a’–d’.
Fig. 4. SP9 expression is downregulated in immature postmitotic D1-MSNs.
a ISL1+/CRE+ double immunostaining in Sp9-Cre LGE at E16.5. a’ Higher magnification images of the ISL1+/CRE+ cells in the LGE. b EBF1+/CRE+ double immunostaining in the Sp9-Cre LGE at E16.5. b’ Higher magnification images of EBF1+/CRE+ cells in the LGE. Notably, nearly all ISL1+ or EBF1+ cells fail to be co-labeled with CRE (a’ and b’). Scale bars: 200 µm in b for a–b, and 50 µm in b’ for a’–b’.
Generation of Rosa-Sp9-OE/ + mice
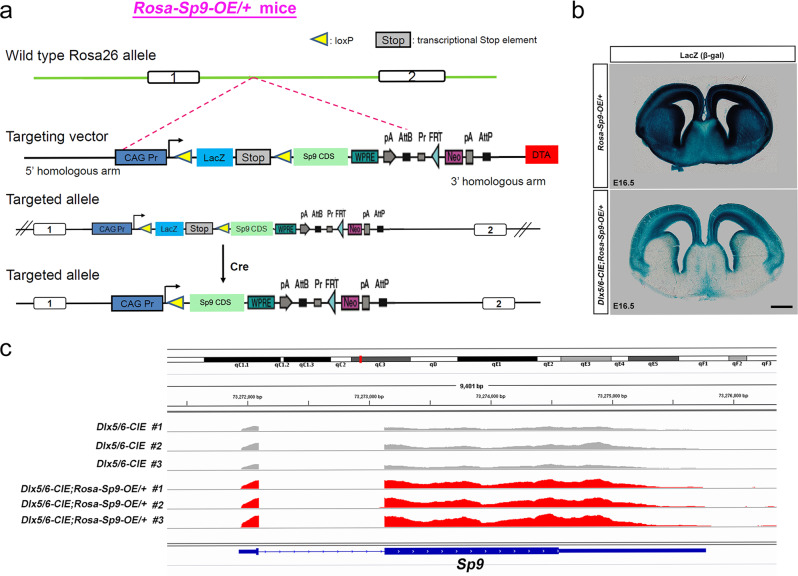
The above observations inspired us to hypothesize that Sp9 may play a critical role in the fate determination of D1-MSNs and D2-MSNs. Considering our previous study [20], we speculated that if Sp9 was forcibly expressed in MSN progenitors and their descendants, more D2-MSNs and fewer D1-MSNs would be generated. Thus, we generated Rosa-Sp9-OE/ + mice. Expression vector containing CAG promoter-Flox-LacZ-STOP-Flox-Sp9 CDS-PolyA was knocked into the Rosa26 locus to get the conditional Sp9-overexpression mice (Rosa-Sp9-OE/+), the transcriptional stop signal maintained the Sp9 gene in a transcriptionally silent state (Fig. 5a).
Fig. 5. Generation of Rosa-Sp9-OE/ + mice.
a The construction strategy of generating mice with conditional Sp9 overexpression (OE). b β-gal staining of Dlx5/6-CIE and Dlx5/6-CIE; Rosa-Sp9-OE/ + brains at E16.5. c Bulk RNA-sequencing revealed higher Sp9 expression levels (reads) in the Dlx5/6-CIE; Rosa-Sp9-OE/ + LGE than in the control at E16.5. Scale bar: b, 500 µm.
We obtained Sp9-overexpression mice by crossing the Rosa-Sp9-OE/ + mice with Cre reporter mice. Beta-gal staining confirmed that the Rosa-Sp9-OE/ + mice exhibited widespread beta-galactosidase (LacZ) activity in the whole brain (Fig. 5b). Since almost all striatal cells and the interneurons in the cortex originated from Dlx5/6-positive progenitors, Dlx5/6-CIE-induced Sp9-overexpression resulted in the whole striatum and partial cortex having no beta-galactosidase (LacZ) activity, indicating the integration of a functional transgenic cassette. To further verify that Sp9 was overexpressed in Dlx5/6-CIE; Rosa-Sp9-OE/ + mice, we performed bulk RNA-seq to compare the mRNA level of Sp9 in Dlx5/6-CIE; Rosa-Sp9-OE/ + LGE with that in control group (Dlx5/6-CIE). As expected, the peak of the Sp9 gene in exon 1 and exon 2 in the experimental group was much higher than that in the control group (Fig. 5c). Thus far, we have proven that Sp9 was conditionally overexpressed in the mice that we generated.
Sp9 overexpression downregulates the expression of D1-MSN-specific genes and upregulates the expression of D2-MSN-specific genes
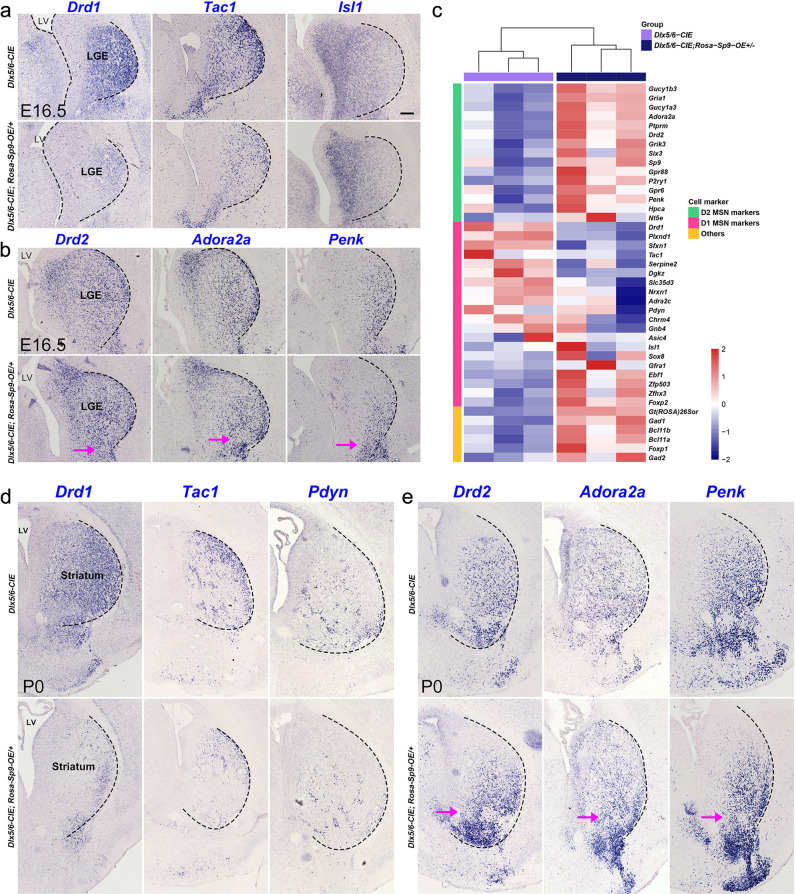
To examine the effect of Sp9 overexpression on striatal MSN development, we bred Rosa-Sp9-OE/ + mice with Dlx5/6-CIE (Dlx5/6-Cre-IRES-EGFP) mice [28, 29], which Cre activity was observed in the LGE progenitors of the developing brain. In situ hybridization showed a robust reduction in the expressions of Drd1 and Tac1, markers of D1-MSNs [30–34], in the Dlx5/6-CIE; Rosa-Sp9-OE/ + mice at E16.5, although we did not see the change of Isl1 expression (Fig. 6a). In dramatic contrast to the decrease of D1-MSNs enriched genes, the expressions of Drd2, Adora2a and Penk, markers of D2-MSNs [19, 20, 22] were significantly increased (Fig. 6b), especially in the nucleus accumbens (NAc) and olfactory tubercle (OT). Moreover, bulk RNA-seq analysis further confirmed that a repertoire of D1-MSNs enriched genes, including Drd1, Tac1, PlxnD1 and Slc35d3, was markedly decreased in Dlx5/6-CIE; Rosa-Sp9-OE/ + (Fig. 6c) and Sp9-Cre; Rosa-Sp9-OE/ + LGE at E16.5 (Table 1). In according with results from the in situ hybridization, D2-MSNs enriched genes, including Drd2, Grik3, Gucy1a3 and Penk, were significantly increased in Dlx5/6-CIE; Rosa-Sp9-OE/ + LGE at E16.5 (Fig. 6c).
Fig. 6. Sp9 overexpression represses the identity of D1-MSNs and promote the identity of D2-MSNs.
a In situ hybridization staining showed a significant reduction in Drd1 and Tac1, markers of D1-MSNs in the Dlx5/6-CIE; Rosa-Sp9-OE/ + striatum, while the expression of Isl1 was mostly unaffected in the Dlx5/6-CIE; Rosa-Sp9-OE/ + striatum at E16.5. b In situ hybridization staining showed an increase in Drd2, Adora2a and Penk, markers of D2-MSNs in the Dlx5/6-CIE; Rosa-Sp9-OE/ + striatum at E16.5. c Heatmap showing the expression levels of striatum-enriched genes (D1-MSNs enriched genes, D2-MSNs enriched genes and MSN-enriched genes) in E16.5 Dlx5/6-CIE; Rosa-Sp9-OE/ + and Dlx5/6-CIE striatum (obtained from bulk RNA sequencing). d In situ hybridization showing that the expression of D1-MSN-enriched genes (Drd1, Tac1 and Pdyn) were downregulated in P0 Dlx5/6-CIE; Rosa-Sp9-OE/ + striatum. e In situ hybridization staining showed that D2-MSNs enriched genes (Drd2, Adora2a and Penk) were upregulated in P0 Dlx5/6-CIE; Rosa-Sp9-OE/ + striatum. Magenta arrows indicate a significant up-regulation expression of Drd2, Adora2a and Penk in the ventral part of the striatum. Scale, 100 µm in a for a, b and d, e.
Similarly, at P0, we obtained a consistent phenotype. We observed the increase of D2-MSNs enriched genes and the decrease of D1-MSNs enriched genes in Dlx5/6-Cre; Rosa-Sp9-OE/ + mice than that in the control mice (Dlx5/6-CIE) (Fig. 6d, e). Altogether, these data provide strong evidences showing that Sp9 overexpression is sufficient to repress the development of the D1-MSNs and promote the development of D2-MSNs.
Sp9 overexpression leads to a dramatic decrease in D1-MSNs and an increase in D2-MSNs in postnatal striatum
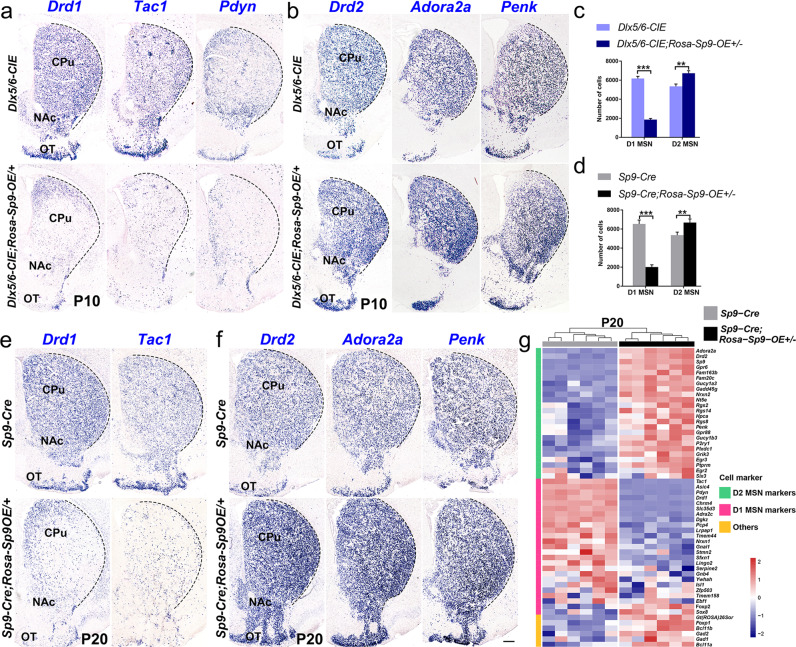
To further detect the changes of D1-MSNs and D2-MSNs in Sp9 overexpressing mice at the postnatal stage, we performed in situ hybridization in the Dlx5/6-CIE; Rosa-Sp9-OE/ + mice at P10. As expected, the dramatic downregulation of the expression of D1-MSN-specific markers (Drd1, Tac1 and Pdyn) was seen and the remaining signals were weak and scattered in the dorsal striatum. Conversely, the expression of D2-MSN-specific markers (Drd2, Adora2a and Penk) was increased significantly (Fig. 7a, b). These results indicated that most of the D1-MSNs did not accomplish the terminal differentiation in the Dlx5/6-CIE; Rosa-Sp9-OE / + mice at P10, this phenotype was even more remarkable than what we saw at P0. Consistently, there was an increase of D2-MSNs in the Dlx5/6-CIE; Rosa-Sp9-OE/ + mice compared with the Dlx5/6-CIE mice, especially in the ventral and lateral striatum (NAc and OT). The statistical analysis showed that the number of D1-MSNs decreased by ~70%, while the number of D2-MSNs increased by ~26% in the Dlx5/6-CIE; Rosa-Sp9-OE/ + mice compared with that in the control mice (Dlx5/6-CIE) (Fig. 7c).
Fig. 7. Sp9 overexpression decreases the number of D1-MSNs and increases the number of D2-MSNs.
a–c In situ RNA hybridization of Drd1, Tac1, Pdyn, Drd2, Adora2a and Penk showing that the number of D1-MSNs was decreased by ~70% and that the number of D2-MSNs was increased by ~26% in the striatum of the Dlx5/6-CIE; Rosa-Sp9-OE/ + mice compared to control mice at P10 (Student’s t-test, **p < 0.01, ***p < 0.001, n = 3, mean ± SEM). d–f In situ RNA hybridization showing that the number of D1-MSNs was decreased by ~70% and that the number of D2-MSNs was increased by ~25% in the striatum of the Sp9-Cre; Rosa-Sp9-OE/ + mice compared with control mice at P20 (Student’s t-test, **p < 0.01, ***p < 0.001, n = 3, mean ± SEM). g The heatmap showing the expression level of MSN-enriched genes in the Sp9-Cre; Rosa-Sp9-OE/ + and Sp9-Cre striatum at P20 (obtained by bulk RNA sequencing). The expression of the D1-MSN markers was greatly downregulated, and the expression of the D2-MSN markers was significantly upregulated. Scale bar: 500 µm in f for a, b and e, f.
We next sought to explore whether Sp9-Cre; Rosa-Sp9-OE/ + showed a similar phenotype and we found that the number of D1-MSNs decreased by ~70%, while the number of D2-MSNs increased by ~23% at P20 when Sp9 was forced to express by Sp9-Cre (Fig. 7d–f). Furthermore, bulk RNA-seq of the Sp9-Cre; Rosa-Sp9-OE/ + striatum at P20 showed a consist result (Fig. 7g). Therefore, our results indicated that some D1-fate restricted MSNs did not differentiate normally and eventually transformed into D2-like MSNs in a slow manner in Sp9 overexpression mice.
Long-term survival of D2-like MSNs
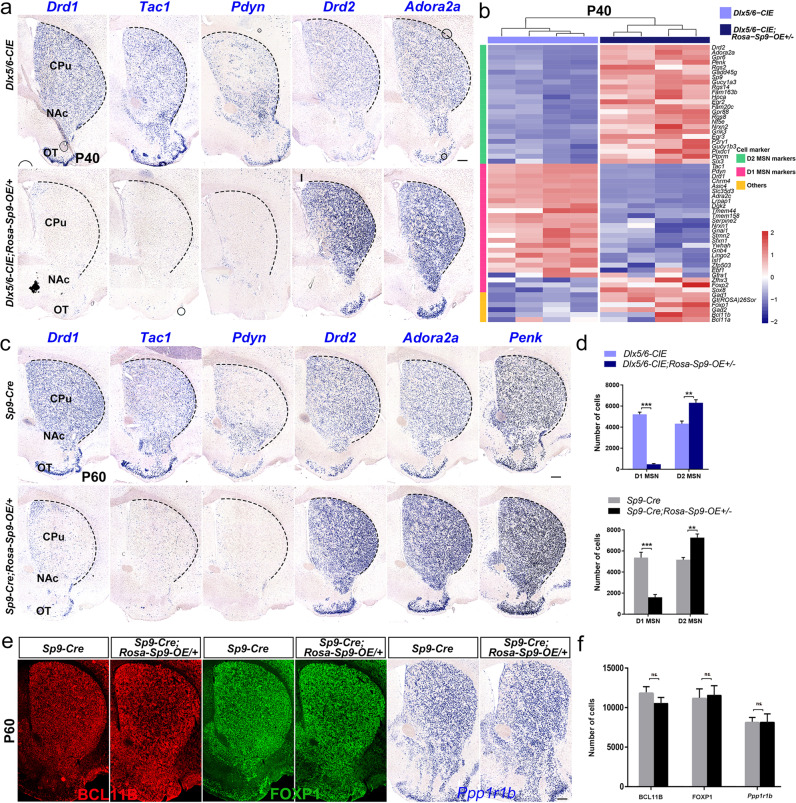
As the results showed that some D1-fate restricted MSNs underwent fate change and transformed into D2-like MSNs in Sp9 overexpressing mice. We further tested whether these D2-like MSNs can develop normally and survive to adulthood or even longer. To ascertain whether the D2-like MSNs exhibit long-term survival, we evaluated the phenotype of Dlx5/6-CIE; Rosa-Sp9-OE/ + mice at P40 and Sp9-Cre; Rosa-Sp9-OE/ + mice at P60 to observe the development of D1-MSNs and D2-MSNs. Our results showed that the expression of D2-MSNs enriched markers (Drd2, Adora2a and Penk) in Sp9 overexpressing mice was still significantly increased (Fig. 8a–c), especially in the lateral striatum, NAc and OT. As previously reported [7], MSNs in the striatum were produced in the ventricles and migrated over a long distance to the lateral striatum, NAc and OT, indicating that the earliest produced cells were the farthest away from the ventricles. We speculated that the early produced D1-MSNs were the first to be transformed into D2-like MSNs in Sp9 overexpressing mice. Notably, the expression of D1-MSNs enriched genes (Drd1, Tac1 and Pdyn) in Sp9 overexpressing mice was robustly decreased, we even could not detect the mRNA of D1-MSNs enriched genes in Dlx5/6-CIE; Rosa-Sp9-OE/ + mice, a very few remaining Drd1-positive cells distributed in the medial part of the striatum, suggesting that these cells were born relatively later (Fig. 8a–c).
Fig. 8. D2-like MSNs survive in the adult brain.
a, d In situ RNA hybridization of Drd1, Tac1, Pdyn, Drd2, Adora2a and Penk showing that the number of D1-MSNs was decreased by ~91% and that the number of D2-MSNs was increased by ~46% in the striatum of the Dlx5/6-CIE; Rosa-Sp9-OE/ + mice compared to the control mice at P40. b Heatmap showing the expression levels of MSN-enriched genes in the striatum of Sp9-Cre; Rosa-Sp9-OE/+ and Sp9-Cre striatum on P40 (obtained by bulk RNA sequencing). c, d In situ RNA hybridization showing that the number of D1-MSNs was decreased by ~71% and that the number of D2-MSNs was increased ~40% in the striatum of the Sp9-Cre; Rosa-Sp9-OE/ + mice compared to control mice on P60, indicating that D2-like MSNs exhibit long-term survival. e, f The expression of BCL11B, FOXP1 and Ppp1r1b (three pan-striatal MSN markers) was similar in the Sp9-Cre; Rosa-Sp9-OE/ + and control mice. (Student’s t-test, **p < 0.01, ***p < 0.001, n = 3, mean ± SEM). Scale bar: 250 µm in e for a, c, e.
Our statistical analysis further showed that the number of D1-MSNs in the Sp9 overexpressing mice was significantly decreased, and the number of D2-MSNs was greatly increased in adult (Fig. 8d). More D2-like MSNs were transformed at this moment than that at P20. To further explore that if the total number of striatal MSNs was changed, we performed staining of Foxp1, BCL11B and Ppp1r1b. Finally, we did not see the difference of the total number of MSNs between Sp9-Cre; Rosa-Sp9-OE/ + mice and control mice (Sp9-Cre) at P60 (Fig. 8e, f), indicating that most of the D1-restricted MSNs switched to becoming D2-like MSNs in adulthood. In summary, our findings suggested that the D2-like MSNs in Sp9 overexpressing mice can survive normally in adulthood.
Discussion
The correct specification and differentiation of striatal projection neurons are important for normal brain function, and defects in these processes underlie motor and cognitive impairment. Abundant cell types are generated from radial glial cells directly or indirectly through transit-amplifying progenitors in the subpallium. The heterogeneity of subpallial progenitors has been established, but further study is needed. Our scRNA-seq data showed that neural stem cells and their progeny constituted a majority of the cells in the LGE at E14.5. It is unclear whether D1-MSNs and D2-MSNs are generated through distinct lineages or through the same type of progenitor cells. our pseudo-time analysis showed that radial glial cells gave rise to several types of progenitor cells, which generate D1-MSNs or D2-MSNs. Sp9-positive progenitor cells form a bridge linking the radial glial cells and MSNs in the striatal development, suggesting that D1-MSNs and D2-MSNs were generated by common intermediate progenitors.
In the present study, we have provided evidences that Sp9 was highly expressed in MSN progenitors, and both D1-MSNs and D2-MSNs were generated by Sp9-positive LGE progenitors. Furthermore, Sp9 expressed at a high level in D2-MSNs and a low level in D1-MSNs in postmitotic stage. These observations indicated that the downregulation of Sp9 in MSN progenitors involved in D1-MSN differentiation, raising the possibility that Sp9 may play a vital role in the fate switching between D1-MSNs and D2-MSNs and encouraging us to investigate the role of Sp9 in D1-MSNs. Our findings further demonstrated that Sp9 overexpression led to increase of D2-MSNs at the expense of D1-MSNs, as indicated by the significantly upregulated expression of D2-MSNs related markers and the profoundly reduced expression of D1-MSNs related markers. Taken together, we proved that the transcription factor Sp9 play a vital role in the fate switching between D1-MSNs and D2-MSNs, and it was a negative regulator of D1-MSN development.
Recent studies have showed that Zfp503 was expressed in most, if not all, striatal MSNs. However, conditional knock out of Zfp503 selectively affected the specification of D1-MSNs and canonical D1-MSN markers were absent or severely reduced while D2-MSN markers were ectopically increased [35, 36]. This outcome is very similar to our results showing that Sp9 overexpression in D1-MSN lineage cells suppressed the expression of mature D1-MSNs markers (Drd1, Tac1, Pdyn and Chrm4) and promoted the expression of mature D2-MSNs markers (Drd2, Adora2a, Penk and Gpr6). Notably, the expression of a majority of canonical D1-MSNs markers was severely reduced and that most of D2-MSNs markers, except Gpr6 and Arpp21, was greatly increased at the embryonic stage in the Zfp503 knock out mice [35, 36]. We observed that in the Sp9 overexpressing mice, the increase of D2-MSNs markers was very mild at the embryonic stage but dramatic at postnatal stage, especially after P10. These results indicated that the D1-MSNs fate was not fully established as shown by the fact that only a limited expression of D1-MSNs enriched genes was changed. Zfp503 may have cooperated with Sp9 to regulate D1-MSNs fate determination, probably Zfp503 directly repressed Sp9 expression in D1-MSNs. In the other case, Zfp503 knockout mice showed that Six3, a Sp9 downstream gene in D2-MSNs development, was significantly increased in D1-MSNs where Six3 was typically not expressed, indicating that Zfp503 represses Six3 expression in D1-MSNs [19]. Six3 has been found to be specifically expressed in D2-MSNs and to regulate D2-MSN development [19, 22]. Thus, Six3 and Zfp503 are candidates for regulating striatal MSN specification. In addition, several transcription factors, such as Ebf1, Isl1 and Foxo1, have been reported to regulate D1-MSN specification but show little or mild effects on D2-MSNs [31–33, 37–39]. In study on Sp9 overexpressing mice, the expression of Ebf1, Isl1 and some D2-MSNs enriched genes were not significantly changed at embryonic stage (data not shown). However, at the postnatal stage, Ebf1 and Isl1 expression were rapidly downregulated and the expression of D2-MSNs enriched genes was gradually increased. These results suggested that Ebf1 and Isl1 may antagonize the D2-MSN specification by repressing effects of Sp9 at embryonic stage.
Previous studies have confirmed that the pathogenesis of Parkinson’s disease and Huntington’s disease is related to the abnormal function of two projection loops in the striatum. Although functional studies have revealed distinct roles for D1-MSNs and D2-MSNs, the production and specification of D1-MSNs and D2-MSNs remain largely uncharacterized. Therefore, studying the development of the basal ganglion loop and exploring its molecular mechanism may provide a theoretical basis for further understanding the occurrence and development of clinical neurodevelopmental diseases. Our findings lay the foundation for understanding the function of the striatum and the pathogenesis of neurodevelopmental diseases.
Materials and methods
Animals
All animal experiments described in this study were approved in accordance with institutional guidelines at Fudan University Shanghai Medical College. In this study, mice that conditionally overexpressed Sp9 were generated by knocking in an expression vector containing CAG promoter-Flox-LacZ-STOP-Flox-Sp9 CDS-PolyA into the Rosa26 locus. With this strategy, the SP9 protein was continuously expressed in CRE recombinase-positive cells. In mice failing to express CRE recombinase, this vector would cause β-galactosidase but not the SP9 protein to be ubiquitously expressed. We described Sp9-Cre knock-in mice, Dlx5/6-CIE mice and Rosa-YFP mice in our previous reports [20, 29, 40]. Mice with mixed C57BL/6J, 129S6, and CD1 backgrounds were obtained. The morning on which a vaginal plug was detected was designated as embryonic day 0.5 (E0.5) and the day of birth was recorded as postnatal day 0 (P0).
Immunohistochemistry and histochemistry
Immunohistochemistry and 5-bromo-4-chloro-3-indoyl-D-galactopyranoside (X-gal) staining were performed as previously described [20, 41]. Tissues were sliced into to 12 or 20 μm thick sections. The following primary antibodies were used to perform immunofluorescence labeling: mouse anti-CRE (Millipore, 69050-3), rabbit anti-EBF1 (Merck, AB10523), rabbit anti-ISL1 (Abcam, ab20670), chicken anti-GFP (AVES Labs, GFP-1020), rat anti-BCL11B (Abcam, ab18465), rabbit anti-FOXP1 (Abcam, ab16645) and rabbit anti-SP9 (1:500) [20]. Alexa Fluor 488-, Cy3- or 647-conjugated secondary antibodies were purchased from Jackson ImmunoResearch.
In situ RNA hybridization
Digoxigenin-labeled riboprobes were generated and performed in situ hybridization on 20 μm cryostat sections as previously described [20, 41]. The riboprobes were generated by the following primers:
Drd2 Forward: CGGGAGCTGGAAGCCTCGA
Drd2 Reverse: TGCAGGGTCAAGAGAAGGCCG
Adora2a Forward: ATGGGCTCCTCGGTGTACATCATG
Adora2a Reverse: TCAGGAAGGGGCAAACTCTGAAGAC
Drd1 Forward: ATGGCTCCTAACACTTCTACCATGG
Drd1 Reverse: TCAGGTTGAATGCTGTCCGCTGTG
Tac1 Forward: CCCCTGAACGCACTATCTATTC
Tac1 Reverse: TAGAGTCAAATACCGAAGTCTCAG
Isl1 Forward: TACGGGATCAAATGCGCCAA
Isl1 Reverse: ACTCAGTACTTTCCAGGGCG
Ppp1r1b Forward: CCAGACACCCCAAGAACG
Ppp1r1b Reverse: GTGCCCAGGGGAGAGAAT
RNA-seq
RNA-sequencing (RNA-seq) was performed at several developmental stages: on E16.5 with LGE, on P20 and P40 with striatum (n > = 3 for each group). Tissues were carefully dissected from the brains of mice exhibiting conditional Sp9 overexpression (Dlx5/6-CIE; Rosa-Sp9-OE/+ or Sp9-Cre; Rosa-Sp9-OE/+ mice) and respective littermate controls (Dlx5/6-CIE or Sp9-Cre). Total RNA was purified with a Mini RNA isolation kit (Zymo) followed by library generation according to the manufacturer’s protocol (Illumina TruSeq Stranded Total RNA Library Prep Kit with Ribo-Zero Mouse). Fragment size distribution was assessed using a Bioanalyzer 2100. The concentration of the libraries was measured using a Kapa library quantification kit. The purified libraries were sequenced on a HiSeq 4000 platform. Levels of gene expression were reported in fragments per kilobase of exon per million fragments mapped (FPKM). Significantly differentially expressed genes were defined on the basis of a false detection rate (FDR) < 0.05. Differentially expressed genes were shown in a heatmap calculated with R language software.
Tissue processing for single-cell RNA sequencing (scRNA-seq)
Embryonic mouse (E14.5) brains were quickly collected and placed in HBSS. The LGE was dissected and incubated in 1 mg/ml papain in HBSS for 20 min at 37 °C. The tissues were gently dissociated into a single-cell suspension by pipetting. Cells were centrifuged and washed twice, filtered through Flowmi Tip 40 μM strainers, and resuspended in HBSS + 0.04% BSA. Cell viability was assessed by trypan blue exclusion, and the cell concentration was adjusted for targeted sequencing of 10,000 cells/sample using a Chromium droplet-based sequencing platform (10X Genomics) Single Cell 30 Reagent Kits v3 protocol to prepare the libraries following the manufacturer’s instructions. The libraries were generated according to the manufacturer’s instructions and sequenced on an Illumina Hiseq4000. The raw data were processed and analyzed as previously described [21].
Image acquisition
An Olympus BX 51 microscope or an Olympus FV1000 confocal laser scanning microscope system was used to collect images. All images were taken of approximately similar sections across samples. Z-stack confocal images were reconstructed with FV10-ASW software. All images were merged and optimized using Adobe Photoshop software.
Quantification and statistics
At least three animals (randomized and assessed in a blinded manner) were used to obtain statistically significant data in each experiment. Student’s t-test was performed for two-group comparisons, and one-way ANOVA followed by Tukey’s post-hoc test was performed for comparisons of more than two-groups. For quantification of Drd1- and Drd2-positive cells in the striatum on P10, P20, P40 and P60, four 20 μm thick coronal sections from the rostral, intermediate, and caudal levels of the striatum were analyzed (n = 3 mice per group). We counted all Drd1- and Drd2-positive cells in the striatum. Brain regions were identified using a mouse brain atlas, and sections equivalent to the following bregma coordinates were assessed (in mm): the most rostral section, 1.18; the most caudal section, −0.10. Data are presented as the number of Drd1- and Drd2-positive cells per section for each striatum. For quantification of FOXP1-, BCL11B- and Ppp1r1b-positive cells in the mouse striatum on P60, four 20 μm thick coronal sections from the rostral, intermediate, and caudal levels of the striatum were selected (n = 3 mice per group). We used ImageJ software to count the number of FOXP1-, BCL11B-, and Ppp1r1b-positive cells in each striatum. Brain regions were identified using the mouse brain atlas, and sections equivalent to the following bregma coordinates were assessed (in mm): the most rostral section, 1.18; the most caudal section, −0.10. Data are presented as the number of FOXP1-, BCL11B- and Ppp1r1b-positive cells per section for each striatum. The cut-off for determining significance was p < 0.05 (*p < 0.05, **p < 0.01, and ***p < 0.001). The results were presented as the means ± SEM.
Supplementary information
Acknowledgements
We are grateful to Kenneth Campbell at University of Cincinnati College of Medicine for the Dlx5/6-CIE mice.
Author contributions
ZL and ZS performed all experiments and analyzed data. MS, XJ, YT, LY, ZW, ZS, GL, XL, and YY helped to conduct experiments and analyze the data. ZY, ZX, and ZZ designed the experiments and analyzed the results. ZL and ZZ wrote the manuscript.
Funding
This study was supported by grants from National Key Research and Development Program of China (2018YFA0108000, 2021ZD0202300), National Natural Science Foundation of China (NSFC 31820103006, NSFC 32070971, and NSFC32100768), and supported by Shanghai Municipal Science and Technology Major Project (No. 2018SHZDZX01), ZJ Lab, Sailing Program (grant number 19YF1404000), and Shanghai Center for Brain Science and Brain-Inspired Technology, and Natural Science Foundation of Shanghai (20ZR1452500).
Data availability
Bulk RNA-Seq and scRNA-Seq data are available from the Gene Expression Omnibus (GEO) database under accession number GSE202551.
Competing interests
The authors declare no competing interests.
Ethics approval and consent to participate
All animal experiments described in this study were approved in accordance with institutional guidelines at Fudan University Shanghai Medical College.
Footnotes
Publisher’s note Springer Nature remains neutral with regard to jurisdictional claims in published maps and institutional affiliations.
These authors contributed equally: Zhenmeiyu Li, Zicong Shang.
Contributor Information
Zhejun Xu, Email: 14111520028@fudan.edu.cn.
Zhuangzhi Zhang, Email: zz_zhang@fudan.edu.cn.
Supplementary information
The online version contains supplementary material available at 10.1038/s41420-022-01088-0.
References
- 1.Gerfen CR, Surmeier DJ. Modulation of striatal projection systems by dopamine. Annu Rev Neurosci. 2011;34:441–66. doi: 10.1146/annurev-neuro-061010-113641. [DOI] [PMC free article] [PubMed] [Google Scholar]
- 2.Kawaguchi Y, Wilson CJ, Augood SJ, Emson PC. Striatal interneurones: chemical, physiological and morphological characterization. Trends Neurosci. 1995;18:527–35. doi: 10.1016/0166-2236(95)98374-8. [DOI] [PubMed] [Google Scholar]
- 3.Marin O, Anderson SA, Rubenstein JL. Origin and molecular specification of striatal interneurons. J Neurosci. 2000;20:6063–76. doi: 10.1523/JNEUROSCI.20-16-06063.2000. [DOI] [PMC free article] [PubMed] [Google Scholar]
- 4.Olsson M, Campbell K, Wictorin K, Björklund A. Projection neurons in fetal striatal transplants are predominantly derived from the lateral ganglionic eminence. Neuroscience. 1995;69:1169–82. doi: 10.1016/0306-4522(95)00325-D. [DOI] [PubMed] [Google Scholar]
- 5.Kelly SM, Raudales R, He M, Lee JH, Kim Y, Gibb LG, et al. Radial Glial Lineage Progression and Differential Intermediate Progenitor Amplification Underlie Striatal Compartments and Circuit Organization. Neuron. 2018;99:345–61 e344. doi: 10.1016/j.neuron.2018.06.021. [DOI] [PMC free article] [PubMed] [Google Scholar]
- 6.Tinterri A, Menardy F, Diana MA, Lokmane L, Keita M, Coulpier F, et al. Active intermixing of indirect and direct neurons builds the striatal mosaic. Nat Commun. 2018;9. [DOI] [PMC free article] [PubMed]
- 7.Knowles R, Dehorter N, Ellender T. From progenitors to progeny: shaping striatal circuit development and function. J Neurosci. 2021;41:9483–502. doi: 10.1523/JNEUROSCI.0620-21.2021. [DOI] [PMC free article] [PubMed] [Google Scholar]
- 8.Gerfen CR, Engber TM, Mahan LC, Susel Z, Chase TN, Monsma FJ, Jr., et al. D1 and D2 dopamine receptor-regulated gene expression of striatonigral and striatopallidal neurons. Science. 1990;250:1429–32. doi: 10.1126/science.2147780. [DOI] [PubMed] [Google Scholar]
- 9.Su Z, Wang Z, Lindtner S, Yang L, Shang Z, Tian Y, et al. Dlx1/2-dependent expression of Meis2 promotes neuronal fate determination in the mammalian striatum. Development. 2022;149. [DOI] [PMC free article] [PubMed]
- 10.Bertran-Gonzalez J, Bosch C, Maroteaux M, Matamales M, Herve D, Valjent E, et al. Opposing patterns of signaling activation in dopamine D1 and D2 receptor-expressing striatal neurons in response to cocaine and haloperidol. J Neurosci. 2008;28:5671–85. doi: 10.1523/JNEUROSCI.1039-08.2008. [DOI] [PMC free article] [PubMed] [Google Scholar]
- 11.Albin RL, Young AB, Penney JB. The functional anatomy of basal ganglia disorders. Trends Neurosci. 1989;12:366–75 [DOI] [PubMed]
- 12.Lebouc M, Richard Q, Garret M, Baufreton J. Striatal circuit development and its alterations in Huntington’s disease. Neurobiol Dis. 2020;145. [DOI] [PubMed]
- 13.Wichmann T, DeLong MR. Functional and pathophysiological models of the basal ganglia. Curr Opin Neurobiol. 1996;6:751–8. doi: 10.1016/S0959-4388(96)80024-9. [DOI] [PubMed] [Google Scholar]
- 14.DeLong MR. Primate models of movement disorders of basal ganglia origin. Trends Neurosci. 1990;13:281–5. doi: 10.1016/0166-2236(90)90110-V. [DOI] [PubMed] [Google Scholar]
- 15.Yang L, Su Z, Wang Z, Li Z, Shang Z, Du H, et al. Transcriptional profiling reveals the transcription factor networks regulating the survival of striatal neurons. Cell death Dis. 2021;12:262–262. doi: 10.1038/s41419-021-03552-8. [DOI] [PMC free article] [PubMed] [Google Scholar]
- 16.Gokce O, Stanley GM, Treutlein B, Neff NF, Camp JG, Malenka RC, et al. Cellular taxonomy of the mouse striatum as revealed by single-cell RNA-seq. Cell Rep. 2016;16:1126–37. doi: 10.1016/j.celrep.2016.06.059. [DOI] [PMC free article] [PubMed] [Google Scholar]
- 17.Anderson AG, Kulkarni A, Harper M, Konopka G. Single-cell analysis of Foxp1-driven mechanisms essential for striatal development. Cell Rep. 2020;30:3051–.e3057. doi: 10.1016/j.celrep.2020.02.030. [DOI] [PMC free article] [PubMed] [Google Scholar]
- 18.Bocchi VD, Conforti P, Vezzoli E, Besusso D, Cappadona C, Lischetti T, et al. The coding and long noncoding single-cell atlas of the developing human fetal striatum. Science. 2021;372:591−+. [DOI] [PubMed]
- 19.Xu Z, Liang Q, Song X, Zhang Z, Lindtner S, Li Z, et al. Sp8 and Sp9 coordinately promote D2-type medium spiny neuron production by activating Six3 expression. Development. 2018;145:dev165456. [DOI] [PMC free article] [PubMed]
- 20.Zhang Q, Zhang Y, Wang C, Xu Z, Liang Q, An L, et al. The zinc finger transcription factor Sp9 is required for the development of striatopallidal projection neurons. Cell Rep. 2016;16:1431–44. doi: 10.1016/j.celrep.2016.06.090. [DOI] [PMC free article] [PubMed] [Google Scholar]
- 21.Li X, Liu G, Yang L, Li Z, Zhang Z, Xu Z, et al. Decoding cortical glial cell development. Neurosci Bull. 2021;37:440–60. [DOI] [PMC free article] [PubMed]
- 22.Song X, Chen H, Shang Z, Du H, Li Z, Wen Y, et al. Homeobox gene Six3 is required for the differentiation of D2-type medium spiny neurons. Neurosci Bull. 2021;37:985–98. doi: 10.1007/s12264-021-00698-5. [DOI] [PMC free article] [PubMed] [Google Scholar]
- 23.Anderson SA, Qiu M, Bulfone A, Eisenstat DD, Meneses J, Pedersen R, et al. Mutations of the homeobox genes Dlx-1 and Dlx-2 disrupt the striatal subventricular zone and differentiation of late born striatal neurons. Neuron. 1997;19:27–37. doi: 10.1016/S0896-6273(00)80345-1. [DOI] [PubMed] [Google Scholar]
- 24.Liu JK, Ghattas I, Liu SY, Chen S, Rubenstein JLR. Dlx genes encode DNA-binding proteins that are expressed in an overlapping and sequential pattern during basal ganglia differentiation. Dev Dynam. 1997;210:498–512. doi: 10.1002/(SICI)1097-0177(199712)210:4<498::AID-AJA12>3.0.CO;2-3. [DOI] [PubMed] [Google Scholar]
- 25.Lindtner S, Catta-Preta R, Tian H, Su-Feher L, Price JD, Dickel DE, et al. Genomic resolution of DLX-orchestrated transcriptional circuits driving development of forebrain GABAergic neurons. Cell Rep. 2019;28:2048–.e2048. doi: 10.1016/j.celrep.2019.07.022. [DOI] [PMC free article] [PubMed] [Google Scholar]
- 26.Wang B, Waclaw RR, Allen ZJ, 2nd, Guillemot F, Campbell K. Ascl1 is a required downstream effector of Gsx gene function in the embryonic mouse telencephalon. Neural Dev. 2009;4:5. doi: 10.1186/1749-8104-4-5. [DOI] [PMC free article] [PubMed] [Google Scholar]
- 27.Long JE, Swan C, Liang WS, Cobos I, Potter GB, Rubenstein JL. Dlx1&2 and Mash1 transcription factors control striatal patterning and differentiation through parallel and overlapping pathways. J Comp Neurol. 2009;512:556–72. doi: 10.1002/cne.21854. [DOI] [PMC free article] [PubMed] [Google Scholar]
- 28.Stenman J, Toresson H, Campbell K. Identification of two distinct progenitor populations in the lateral ganglionic eminence: implications for striatal and olfactory bulb neurogenesis. J Neurosci. 2003;23:167–74. doi: 10.1523/JNEUROSCI.23-01-00167.2003. [DOI] [PMC free article] [PubMed] [Google Scholar]
- 29.Wei S, Du H, Li Z, Tao G, Xu Z, Song X, et al. Transcription factors Sp8 and Sp9 regulate the development of caudal ganglionic eminence-derived cortical interneurons. J Comp Neurol. 2019. [DOI] [PubMed]
- 30.Wen Y, Su Z, Wang Z, Yang L, Liu G, Shang Z, et al. Transcription factor VAX1 regulates the regional specification of the subpallium through repressing Gsx2. Mol Neurobiol. 2021;58:3729–44. doi: 10.1007/s12035-021-02378-x. [DOI] [PubMed] [Google Scholar]
- 31.Lobo MK, Karsten SL, Gray M, Geschwind DH, Yang XW. FACS-array profiling of striatal projection neuron subtypes in juvenile and adult mouse brains. Nat Neurosci. 2006;9:443–52. doi: 10.1038/nn1654. [DOI] [PubMed] [Google Scholar]
- 32.Ehrman LA, Mu X, Waclaw RR, Yoshida Y, Vorhees CV, Klein WH, et al. The LIM homeobox gene Isl1 is required for the correct development of the striatonigral pathway in the mouse. Proc Natl Acad Sci USA. 2013;110:E4026–35. doi: 10.1073/pnas.1308275110. [DOI] [PMC free article] [PubMed] [Google Scholar]
- 33.Lu KM, Evans SM, Hirano S, Liu FC. Dual role for Islet-1 in promoting striatonigral and repressing striatopallidal genetic programs to specify striatonigral cell identity. Proc Natl Acad Sci USA. 2014;111:E168–177. doi: 10.1073/pnas.1319138111. [DOI] [PMC free article] [PubMed] [Google Scholar]
- 34.Zhang Z, Wei S, Du H, Su Z, Wen Y, Shang Z, et al. Zfhx3 is required for the differentiation of late born D1-type medium spiny neurons. Exp Neurol. 2019;322:113055. [DOI] [PubMed]
- 35.Soleilhavoup C, Travaglio M, Patrick K, Garcao P, Boobalan E, Adolfs Y, et al. Nolz1 expression is required in dopaminergic axon guidance and striatal innervation. Nat Commun. 2020;11:3111. doi: 10.1038/s41467-020-16947-6. [DOI] [PMC free article] [PubMed] [Google Scholar]
- 36.Chen SY, Lu KM, Ko HA, Huang TH, Hao JH, Yan YT, et al. Parcellation of the striatal complex into dorsal and ventral districts. Proc Natl Acad Sci USA. 2020;7418–29. [DOI] [PMC free article] [PubMed]
- 37.Garel S, Marin F, Grosschedl R, Charnay P. Ebf1 controls early cell differentiation in the embryonic striatum. Development. 1999;126:5285–94. doi: 10.1242/dev.126.23.5285. [DOI] [PubMed] [Google Scholar]
- 38.Waclaw RR, Ehrman LA, Merchan-Sala P, Kohli V, Nardini D, Campbell K. Foxo1 is a downstream effector of Isl1 in direct pathway striatal projection neuron development within the embryonic mouse telencephalon. Mol Cell Neurosci. 2017;80:44–51. doi: 10.1016/j.mcn.2017.02.003. [DOI] [PMC free article] [PubMed] [Google Scholar]
- 39.Lobo MK, Yeh C, Yang XW. Pivotal role of early B-cell factor 1 in development of striatonigral medium spiny neurons in the matrix compartment. J Neurosci Res. 2008;86:2134–46. doi: 10.1002/jnr.21666. [DOI] [PubMed] [Google Scholar]
- 40.Liu Z, Zhang Z, Lindtner S, Li Z, Xu Z, Wei S, et al. Sp9 regulates medial ganglionic eminence-derived cortical interneuron development. Cereb Cortex. 2019;29:2653–67. doi: 10.1093/cercor/bhy133. [DOI] [PMC free article] [PubMed] [Google Scholar]
- 41.Wen Y, Zhang Z, Li Z, Liu G, Tao G, Song X, et al. The PROK2/PROKR2 signaling pathway is required for the migration of most olfactory bulb interneurons. J Comp Neurol. 2019;527:2931–47. [DOI] [PubMed]
Associated Data
This section collects any data citations, data availability statements, or supplementary materials included in this article.
Supplementary Materials
Data Availability Statement
Bulk RNA-Seq and scRNA-Seq data are available from the Gene Expression Omnibus (GEO) database under accession number GSE202551.


