Phostensin, a protein phosphatase 1 regulatory subunit, supports lymphocyte integrin-dependent functions by mediating dephosphorylation of Rap1 to stabilize the MIT complex, thereby enabling the population of peripheral lymphoid organs and T cell–mediated colitis.
Abstract
Rap1 GTPase drives assembly of the Mig-10/RIAM/Lamellipodin (MRL protein)–integrin–talin (MIT) complex that enables integrin-dependent lymphocyte functions. Here we used tandem affinity tag–based proteomics to isolate and analyze the MIT complex and reveal that Phostensin (Ptsn), a regulatory subunit of protein phosphatase 1, is a component of the complex. Ptsn mediates dephosphorylation of Rap1, thereby preserving the activity and membrane localization of Rap1 to stabilize the MIT complex. CRISPR/Cas9-induced deletion of PPP1R18, which encodes Ptsn, markedly suppresses integrin activation in Jurkat human T cells. We generated apparently healthy Ppp1r18−/− mice that manifest lymphocytosis and reduced population of peripheral lymphoid tissues ascribable, in part, to defective activation of integrins αLβ2 and α4β7. Ppp1r18−/− T cells exhibit reduced capacity to induce colitis in a murine adoptive transfer model. Thus, Ptsn enables lymphocyte integrin-mediated functions by dephosphorylating Rap1 to stabilize the MIT complex. As a consequence, loss of Ptsn ameliorates T cell–mediated colitis.
Introduction
Integrin-mediated lymphocyte adhesion plays an essential role in lymphocyte development and their capacity to populate lymphoid organs and sites of inflammation. Furthermore, by playing a critical accessory role in the formation of immunological synapses, integrins facilitate processes such as cytotoxic killing and antigen presentation. Integrins αLβ2 (LFA-1), α4β1 (VLA-4), and α4β7 (LPAM) are the lymphocyte integrins most commonly involved in these functions, and each has served as a therapeutic target in autoimmune and inflammatory diseases (Hogg et al., 2011; Ley et al., 2016). Lymphocyte integrins are constitutively in a low-affinity state until agonist stimulation induces high affinity, a process operationally defined as “integrin activation” (Luo et al., 2007; Takagi et al., 2002; Xiong et al., 2001). Integrin activation is essential to their capacity to mediate the lymphocyte functions enumerated above (Hynes, 2002; Ley et al., 2007).
Stimulation via agonists such as chemokines or cytokines initiates a spectrum of intracellular signaling pathways to trigger integrin activation. These pathways ultimately converge on the binding of talin1 to the integrin β cytoplasmic tail (Kim et al., 2011; Lefort et al., 2012; Tadokoro et al., 2003; Ye et al., 2010), a final common step in integrin activation. The small GTPase Rap1 is a dominant hub in the signaling pathways that control the talin–integrin interaction (Bos, 2005). In conventional T cells, Rap1 uses Rap1-interacting adaptor molecule (RIAM) as an effector for integrin activation, whereas in CD4+Foxp3+ regulatory T cells, another MRL protein, Lamellipodin (LPD), makes a more important contribution (Sun et al., 2021). We previously showed that the Mig-10/RIAM/LPD protein–integrin–talin (MIT) complex forms the “sticky fingers” that drive cell protrusion and enable migratory pathfinding (Lagarrigue et al., 2015).
RIAM is abundant in hematopoietic cells. Unlike talin1 deletion, germline loss of RIAM in mice does not affect development, hemostasis, or platelet integrin function (Klapproth et al., 2015; Stritt et al., 2015; Su et al., 2015). However, RIAM plays an important role in the activation of β2 and β7 integrins in neutrophils, macrophages, and T cells (Boussiotis et al., 1997; Medrano-Fernandez et al., 2013; Klapproth et al., 2015; Su et al., 2015; Sun et al., 2021). β1 and β3 integrin functions are less affected by the absence of RIAM in these leukocytes (Klapproth et al., 2015; Su et al., 2015). RIAM-deficient mice exhibit significant leukocytosis associated with leukocyte adhesion deficiency and impaired leukocyte extravasation. The apparently normal development and lack of bleeding in RIAM-null mice, combined with their protection in models of autoimmune disease such as inflammatory bowel disease (Sun et al., 2021) or type 1 diabetes (Lagarrigue et al., 2017), suggests that targeting the regulation of the RIAM MIT complex could serve as a strategy to inhibit pathological inflammation or autoimmunity.
Here we analyzed the mechanisms that orchestrate the function of the MIT complex by using a tandem affinity purification tag to isolate the native complex and mass spectrometry to identify associated proteins. We focused our attention on Phostensin (Ptsn), an actin-binding regulatory subunit of protein phosphatase 1 (PP1) encoded by the PPP1R18 gene (Kao et al., 2007) because Ptsn is mainly expressed in leukocytes (Lin et al., 2011) and shares similar tissue distribution with RIAM. Here, we report that Ptsn is physically associated with the MIT complex and that it stabilizes the complex by mediating the dephosphorylation of Rap1, thereby preserving Rap1 activity and enabling integrin activation. We generated viable and fertile Ppp1r18−/− mice that exhibited impaired population of peripheral lymphoid tissues and defective activation of T cell integrins αLβ2 and α4β7. Because Ppp1r18−/− mice appear healthy yet have a defect in lymphocyte integrin function, we suggest that Ptsn may be a therapeutic target in autoimmune and inflammatory diseases. In support of this idea, Ppp1r18−/− T cells manifested reduced capacity to induce colitis in an adoptive transfer model. In sum, we identify Ptsn as a new regulator of lymphocyte integrin-mediated functions; show that it acts, in part, via stabilization of the RIAM MIT complex by dephosphorylating Rap1; and identify it as a potential therapeutic target in T cell–mediated diseases.
Results
Ptsn is a component of the MIT complex
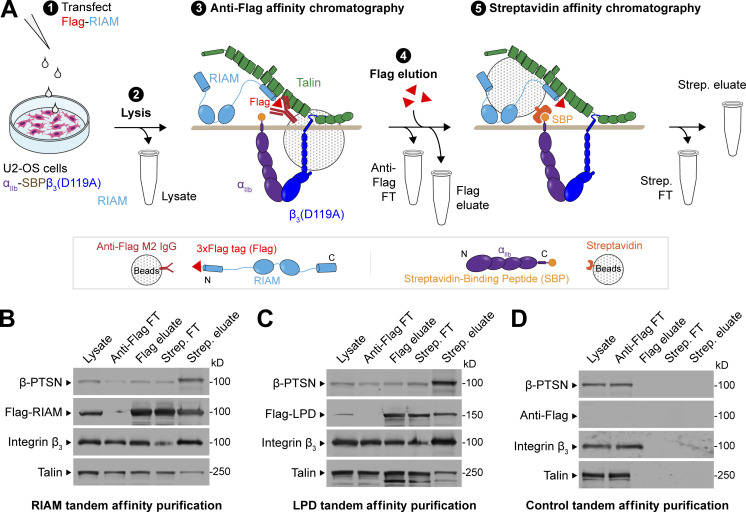
To isolate an MIT complex, we devised a split tandem affinity purification method that isolates the native complex formed before ligand engagement (Fig. 1 A). We transfected Flag-RIAM into U2-OS cells stably expressing integrin αIIb-streptavidin-binding peptide (SBP) and β3(D119A) to form ligand binding-defective αIIb(SBP)β3(D119A). RIAM and associated proteins were isolated by anti-Flag affinity chromatography of cell lysates, and the native proteins were eluted with 200 μg/ml Flag peptide. The eluate was then passed through a streptavidin column to bind the αIIb(SBP), and the native MIT complex was eluted with 5 mM biotin. In five experiments, an average of 100 µg of complex was isolated from 2 × 10⁷ cells. The eluate of the streptavidin column was fractionated on SDS-PAGE, and major protein components were visualized by immunoblotting with antibodies against talin, integrin, or RIAM (Fig. 1 B). In a proteomic analysis (Table S1), we noted that Ptsn was a prominent component of the isolated complex. Ptsn, encoded by PPP1R18, is an actin-binding regulatory subunit of PP1. Ptsn shares these biochemical functions with Phactr4, which modulates integrin signaling and cofilin activity to coordinate enteric neural crest cell migration (Zhang et al., 2012). Ptsn was also present in the LPD MIT complex (Fig. 1 C). Importantly, Ptsn was absent from the eluates of both Flag and streptavidin columns in the absence of Flag-RIAM (Fig. 1 D).
Figure 1.
Ptsn associates with the MIT complex. (A–D) Schematic of a split tandem affinity purification method to isolate the proteins associated with the MIT complex (A). 1: U2-OS cells stably expressing integrin αIIb-SBP and β3(D119A) to form ligand binding–defective αIIb(SBP)β3(D119A) were transfected with a plasmid encoding Flag-tagged RIAM (B), Flag-tagged LPD (C), or no insert (D). 2: Cell lysis. 3: Anti-Flag affinity chromatography of cell lysates. 4: Native proteins were eluted with 200 μg/ml Flag peptide. 5: The eluate was passed through a streptavidin column. Bound MIT complexes were washed, eluted with 5 mM biotin, and separated by SDS-PAGE. Both RIAM– and LPD–MIT complexes contain Ptsn. All fractions including whole-cell lysate (0.5% of total), anti-Flag flow-through (FT, 0.5%), Flag eluate (10%), streptavidin FT (10%), and streptavidin eluate (50%) were analyzed by immunoblotting. Results are representative of three independent experiments. Source data are available for this figure: SourceData F1.
Both isoforms of Ptsn regulate integrin activation
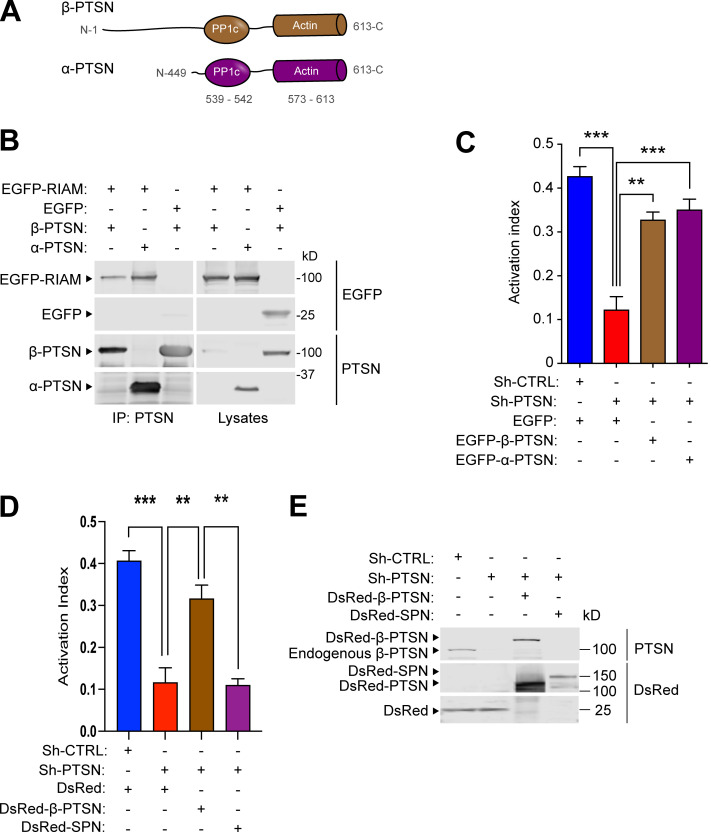
To examine the role of Ptsn in integrin function, we used 293A cells constitutively expressing a recombinant talin-dependent (Tadokoro et al., 2003) activated integrin αIIb(R995A)β3. Ptsn has short and long isoforms, termed α and β, respectively (Lin et al., 2014), and both contain actin- and protein phosphatase 1 (PP1)-binding domains (Fig. 2 A). Both isoforms associated with RIAM (Fig. 2 B). Silencing Ptsn inhibited integrin activation, and co-expressing either isoform of shRNA-resistant Ptsn rescued activation of this integrin (Fig. 2 C). Like Ptsn, spinophilin (neurabin), encoded by Ppp1r9b, is an actin-associated regulatory subunit of PP1 (Allen et al., 1997) and was present in the MIT complex (Table S1). Overexpression of spinophilin did not complement the reduced integrin activation in Ptsn-silenced 293A cells (Fig. 2, D and E).
Figure 2.
Ptsn regulates integrin activation. Silencing of Ptsn reduces integrin activation. (A) Domain organization of α-Ptsn (short) and β-Ptsn (long) isoforms. (B) Both isoforms of Ptsn associate with RIAM. 293A cells were transfected with plasmids encoding Flag-tagged α- or β-Ptsn in combination with vectors encoding EGFP-RIAM or EGFP. Immunoblots were used to analyze proteins binding to an anti-Flag affinity matrix. IP, immunoprecipitation. (C) Both isoforms of Ptsn restore integrin activation in Ptsn-silenced cells. 293A cells that express constitutively active αIIb(R995A)β3 were transduced with a lentivirus encoding an shRNA against Ptsn. A scrambled shRNA was used as a negative control. Cells were then transfected with a plasmid encoding either EGFP-tagged shRNA resistant α- or β-Ptsn or EGFP alone. Integrin activation was measured by flow cytometry using the monoclonal antibody PAC1 that specifically recognizes the activated form of αIIbβ3. The activation index was calculated as (F − Fo)/(Fm − Fo), where F is the geometric mean fluorescence intensity (MFI) of PAC1 binding, Fo is the MFI in presence of the competitive inhibitor integrilin, and Fm is the MFI upon addition of the integrin-activating anti-LIBS6 antibody. Bar graphs represent mean ± SEM (n = 3 independent experiments). One-way ANOVA with Tukey post-test; **, P < 0.01; ***, P < 0.001. In C, the expression of Ptsn was confirmed by immunoblotting. (D) Expression of spinophilin does not complement the loss of Ptsn. The expression of Ptsn was silenced in αIIb(R995A)β3-expressing 293A cells, and the activation index was determined as in C in cells transfected with Ds Red β-Ptsn or spinophilin (SPN). Bar graphs represent mean ± SEM (n = 3 independent experiments). One-way ANOVA with Tukey post-test; **, P < 0.01; ***, P < 0.001. (E) Protein expression was assessed by immunoblotting. Source data are available for this figure: SourceData F2.
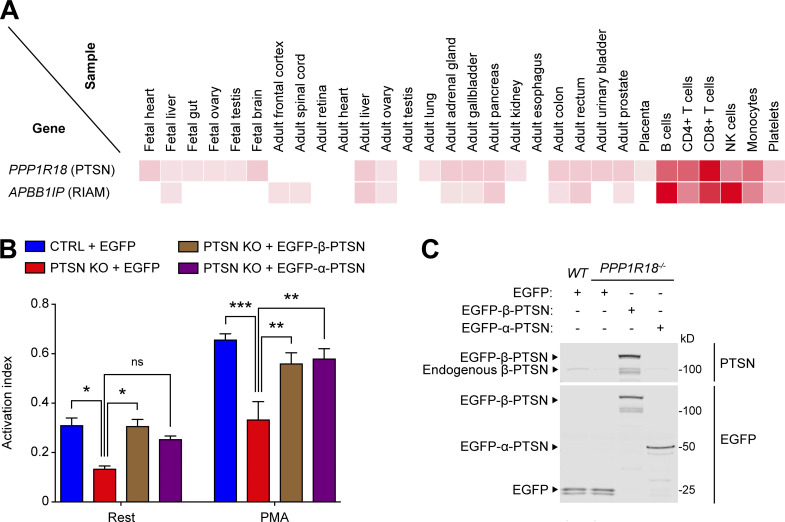
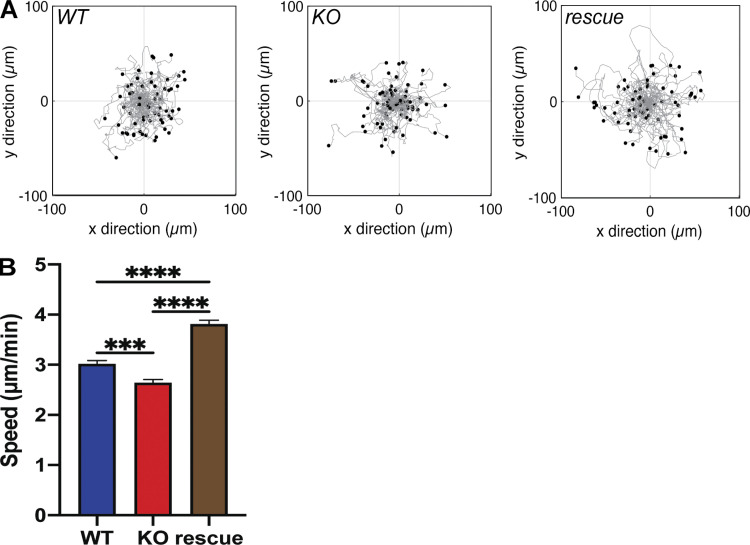
Analysis using the human proteome map (http://www.humanproteomemap.org/batch.php) confirmed that both RIAM and Ptsn are particularly well expressed in lymphoid cells (Fig. 3 A). We therefore used CRISPR/Cas9 mutagenesis to inactivate PPP1R18 in the Jurkat T cell line and observed a marked reduction in basal and PMA-stimulated activation of an endogenous integrin (Fig. 3, B and C). In both cases, activation was rescued by re-expressing either α- or β-Ptsn. Thus, both isoforms of Ptsn regulate integrin activation in a model system and a human T cell line. We also noted that these changes in integrin activation were associated with changes in cell migration speed. Individual trajectories of Ptsn-null Jurkat T cells migrating on 2 µg/ml VCAM-1–coated surfaces revealed a decreased migration speed compared with the parental WT Jurkat cells. This defect in cell migration was reversed by re-expressing β-Ptsn in the Ptsn-null cells (Fig. 4, A and B). Thus Ptsn plays a role in both integrin activation and random migration of Jurkat T cells.
Figure 3.
Ptsn enables integrin activation in a human T cell line. (A) Relative expression of Ptsn and RIAM in human tissues. Adapted from the Human Proteome Map portal (https://www.humanproteomemap.org). (B) KO of Ptsn in Jurkat T cells reduces integrin activation. PPP1R18 gene encoding Ptsn was knocked out in Jurkat T cells using CRISPR/Cas9, and soluble VCAM-1 binding was assessed by flow cytometry. Cellular stimulation was performed using PMA (100 nM). The activation index was calculated as (F − Fo)/(Fm − Fo), where F is the MFI of VCAM-1 binding, Fo is the MFI in presence of EDTA, and Fm is the MFI upon addition of MnCl2. Bar graphs represent mean ± SEM (n = 3 independent experiments). Two-way ANOVA with Tukey post-test; *, P < 0.05; **, P < 0.01; ***, P < 0.001. (C) The expression of Ptsn was confirmed by immunoblotting. Results are representative of three independent experiments. Source data are available for this figure: SourceData F3.
Figure 4.
Ptsn contributes to lymphocyte migration. WT, Ptsn-null, or β-Ptsn–reconstituted Ptsn-null Jurkat T cells described in Fig. 3 were adhered to VCAM-1–coated 24-well glass-bottom plates and were imaged every min for 30 min. (A) Scattergrams of individual cell trajectories of Jurkat WT, Ptsn KO, and β-Ptsn rescue cells. (B) Average speed of Jurkat WT, Ptsn KO, and β-Ptsn rescue cells. Data are presented as mean ± SEM with n = total number of cells tracked (n = 258 WT, 250 KO, and 270 rescue). Significance was tested with one-way ANOVA using multiple comparisons with a Tukey post-test. ***, P < 0.001; ****, P < 0.0001.
Ptsn regulates the assembly of the MIT complex
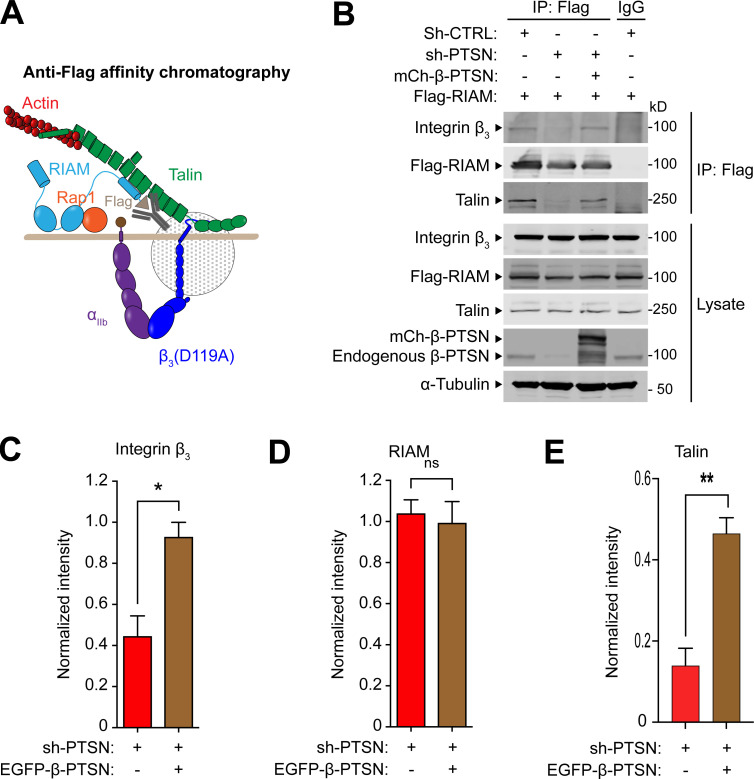
To investigate how Ptsn regulates integrin activation, we tested the role of Ptsn in the assembly of the RIAM MIT complex. We silenced Ptsn expression in cells expressing recombinant Flag-RIAM and integrin αIIbβ3, and purified Flag-RIAM by immunoaffinity chromatography (Fig. 5 A). Silencing Ptsn dramatically reduced the association of both integrin β3 and talin with RIAM, indicating disassembly of the MIT complex. The complex was assembled when shRNA-resistant β-Ptsn was co-expressed with the Ptsn shRNA (Fig. 5, B–E). Thus, Ptsn regulates the assembly of the MIT complex.
Figure 5.
Ptsn enables the assembly of the RIAM–MIT complex. (A and B) U2-OS cells that stably express integrin αIIb-SBP and β3(D119A) to form ligand binding–defective αIIb(SBP)β3(D119A) were transduced with a lentivirus encoding a shRNA against Ptsn before transfection with mCherry-tagged β-Ptsn in combination with Flag-RIAM. Flag-tagged RIAM was captured by anti-Flag immunoprecipitation (IP; A) and associated proteins were analyzed by immunoblotting (B). (C–E) Integrated density values for immunoreactive bands corresponding to integrin β3 (C), RIAM (D), or talin (E). Bar graphs represent mean ± SEM (n = 3 independent experiments) normalized to control condition (sh-, scrambled). Two-tailed t test; *, P < 0.05; **, P <0.01. Source data are available for this figure: SourceData F5.
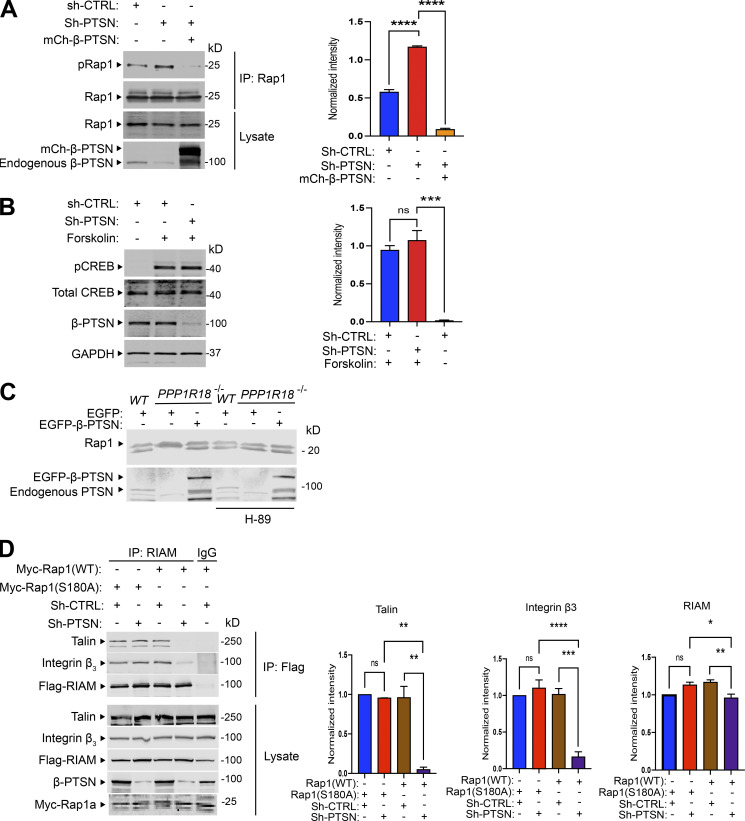
Activated Rap1 drives the formation of the MIT complex and resulting integrin activation (Lagarrigue et al., 2015), leading us to examine the potential role of Ptsn in regulating Rap1. Protein kinase A (PKA) phosphorylation of Rap1 inhibits Rap1 activity (Takahashi et al., 2013). To assess whether silencing Ptsn could affect Rap1 phosphorylation, Rap1 was immunoprecipitated from cells in which endogenous Ptsn expression was silenced by Ptsn-specific shRNA. Rap1 phosphorylation was assessed by an antibody specific for phosphorylated PKA substrates. Silencing endogenous Ptsn led to increased Rap1 phosphorylation, and overexpression of shRNA-resistant Ptsn abolished Rap1 phosphorylation (Fig. 6 A). To examine the specificity of increased phosphorylation by Ptsn silencing, we examined cAMP response element–binding protein (CREB), an abundant PKA substrate. Silencing Ptsn expression had no effect on Forskolin-induced CREB phosphorylation (Fig. 6 B). We used a gel shift assay (Takahashi et al., 2013) to assess the effect of loss of Ptsn on phosphorylation of endogenous Rap1 in Jurkat T cells. Use of a 12% SDS-PAGE enabled us to resolve two bands that reacted with an anti-Rap1 monoclonal antibody, E6. The mobility of the lower band was reduced in the Ptsn-null cells compared with WT or Ptsn-reconstituted null cells (Fig. 6 C), indicating an increase in phosphorylation. Furthermore, a PKA inhibitor, H89, reversed this gel shift in Ptsn-null cells, confirming that it was ascribable to phosphorylation (Fig. 6 C). Rap1a is phosphorylated at COOH-terminal Serine residue 180 by PKA both in vivo and in vitro (Takahashi et al., 2013). To directly address if Rap1 dephosphorylation is important for RIAM MIT complex assembly, we asked if phosphorylation-resistant Rap1a mutant (S180A) could support RIAM MIT assembly when Ptsn was silenced. We generated an internal ribosome entry site–based bicistronic construct expressing both Flag-RIAM and Myc-Rap1a(S180A) and transfected it into the cells expressing integrin αIIbβ3 and Flag-RIAM. Expression of Rap1a(S180A) but not WT Rap1a restored the association of integrin β3 and talin with RIAM, indicative of the intact RIAM MIT complex, in Ptsn-silenced cells (Fig. 6 D). Importantly, silencing Ptsn did not affect the similar expression levels of Rap1a(S180A) or Rap1a, nor did it affect expression of Flag-RIAM or α-tubulin (Fig. 6 D). Together, these data show that Ptsn stabilizes the MIT complex by reducing the phosphorylation of Rap1.
Figure 6.
Ptsn mediates Rap1 dephosphorylation. (A) Silencing of Ptsn expression promotes Rap1 phosphorylation. αIIb(SBP)β3(D119A)–expressing U2-OS cells were transduced with a lentivirus encoding an shRNA against Ptsn or sh-CTRL (scrambled) and then transfected with a plasmid encoding Myc-tagged Rap1 in combination with a vector encoding mCherry-tagged Ptsn or empty vector. Rap1 was immunoprecipitated (IP) using an anti-Myc antibody, and phosphorylation of Rap1 was revealed by an antibody recognizing phosphorylated PKA substrates (pRap1). (B) As a control, the phosphorylation of CREB was assayed in Ptsn-depleted cells using an antibody that specifically recognizes the phosphorylated form of CREB. U2-OS cells were treated with 10 μM forskolin for 30 min to induce CREB phosphorylation. (C) The phosphorylation of endogenous Rap1 was assessed by gel mobility shift assay. WT, Ptsn-null, or β-Ptsn–reconstituted Ptsn-null Jurkat T cells described in Fig. 3 were left untreated or treated with H-89. The mobility of Rap1 was measured on an immunoblot of proteins separated on 12% SDS-PAGE. The mobility of the lower band was reduced in Ptsn-null cells compared with WT and β-Ptsn–reconstituted Ptsn-null cells or Ptsn-null cells treated with a PKA inhibitor, H-89. (D) Phosphorylation-resistant Rap1 mutant (S180A) rescues RIAM MIT complex assembly. αIIb(SBP)β3(D119A)–expressing U2-OS cells were transduced with a lentivirus encoding a shRNA against Ptsn and transfected with a bicistronic plasmid encoding Myc-tagged Rap1 in combination with Flag-RIAM. RIAM was immunoprecipitated using an anti-Flag antibody, and the associated β3 integrin was revealed by immunoblotting and quantified by infrared spectroscopy. Bar graphs represent mean ± SEM (n = 3 independent experiments). Significance was tested with one-way ANOVA with Tukey post-test; *, P < 0.05,**, P < 0.01; ***, P < 0.001; ****, P < 0.0001. Source data are available for this figure: SourceData F6.
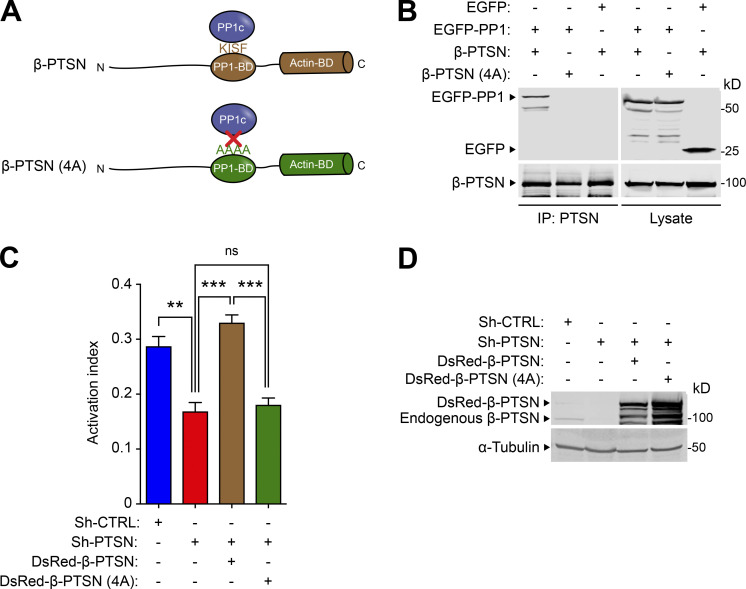
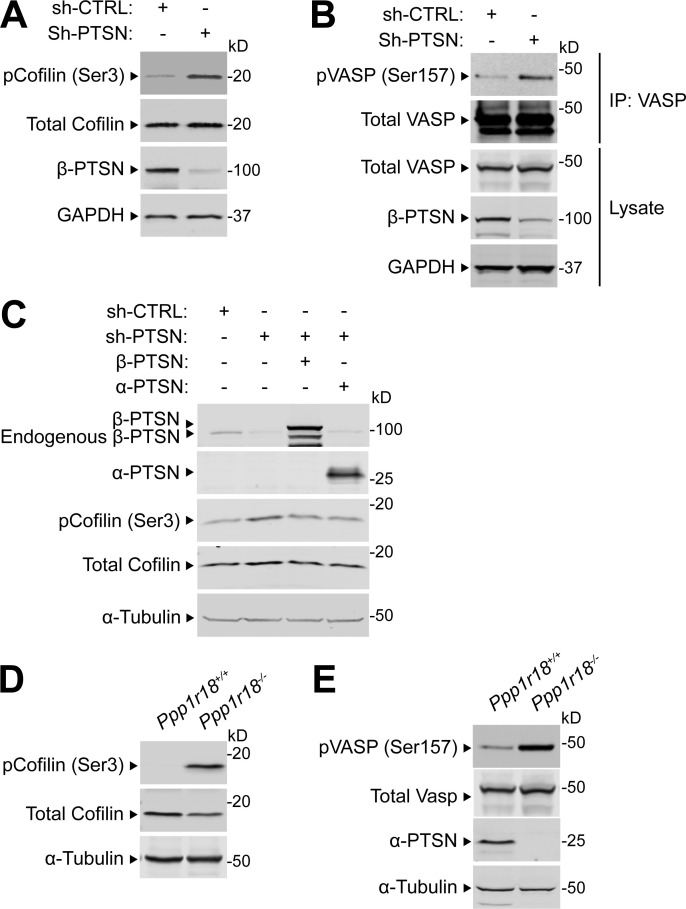
Ptsn is a PP1 regulatory subunit, and we confirmed that mutation of the PP1 catalytic subunit (PP1c) binding site disrupted its association with Ptsn (Fig. 7 A). This PP1c- binding–defective mutant Ptsn was unable to support integrin activation (Fig. 7, B and C). Ptsn is an actin-associated protein (Lai et al., 2009; Wang et al., 2012); therefore, we tested if silencing Ptsn expression could affect the phosphorylation of regulators of actin dynamics whose activities are controlled by phosphorylation. Silencing of Ptsn increased the phosphorylation of cofilin (Fig. S1 A) and vasodilator-stimulated phosphoprotein (VASP; Fig. S1 B). Overexpression of shRNA-resistant Ptsn, either α or β isoform, abolished the increased phosphorylation of cofilin (Fig. S1 C). Thus, in addition to preserving the activity of Rap1 and thus integrins, Ptsn can induce dephosphorylation of regulators of actin dynamics.
Figure 7.
The capacity of Ptsn to support integrin activation depends on binding to PP1c. (A) Schematic of β-Ptsn indicating the PP1c- binding domain containing a KISF motif. (B) Mutation of the KISF residues to four Ala (4A) in Ptsn blocks its interaction with PP1c. 293A cells were transfected with plasmids encoding EGFP-tagged PP1c in combination with either β-Ptsn WT or 4A mutant. Ptsn was immunoprecipitated (IP) using an anti-Flag antibody before immunoblotting. (C and D) 293A cells that express constitutively active αIIb(R995A)β3 were transduced with a lentivirus encoding a shRNA against Ptsn and transfected with a plasmid encoding EGFP-tagged shRNA-resistant Ptsn either WT or 4A mutant. (C) 293A cells that express constitutively active αIIb(R995A)β3 were transduced with a lentivirus encoding a shRNA against Ptsn. A scrambled shRNA was used as a negative control. Cells were then transfected with a plasmid encoding DsRed-tagged shRNA-resistant β-Ptsn either WT or 4A mutant. Integrin activation was measured by flow cytometry using the monoclonal antibody PAC1 that specifically recognizes the activated form of αIIbβ3. The activation index was calculated as (F − Fo)/(Fm − Fo), where F is the MFI of PAC1 binding, Fo is the MFI in presence of the competitive inhibitor integrilin, and Fm is the MFI upon addition of the integrin-activating anti-LIBS6 antibody. Bar graphs represent mean ± SEM (n = 3 independent experiments). One-way ANOVA with Tukey post-test; **, P < 0.01; ***, P < 0.001. (D) The expression of 4A Ptsn was confirmed by immunoblotting. Source data are available for this figure: SourceData F7.
Figure S1.
Ptsn regulates the phosphorylation of cofilin and VASP. (A–C) 293A cells were transduced with a lentivirus encoding a shRNA against Ptsn. A scrambled shRNA was used as a negative control. (A) Cell lysates were separated by SDS-PAGE and immunoblotted with an anti-phospho Ser(3) cofilin. (B) VASP was captured by immunoprecipitation (IP) and immunoblotted with an anti-phospho Ser(157) VASP. (C) Ptsn-silenced cells were transfected with a plasmid encoding either Flag-tagged α- or β-Ptsn isoforms, and phosphorylation of endogenous cofilin or VASP was assessed as described in A and B, respectively. (D and E) Phosphorylation of endogenous cofilin or VASP lysates of splenocytes isolated from WT or Ppp1r18−/− mice analyzed as described in A and B. Results are representative of three independent experiments. Source data are available for this figure: SourceData FS1.
Ppp1r18−/− mice are viable and fertile and manifest reduced integrin activation
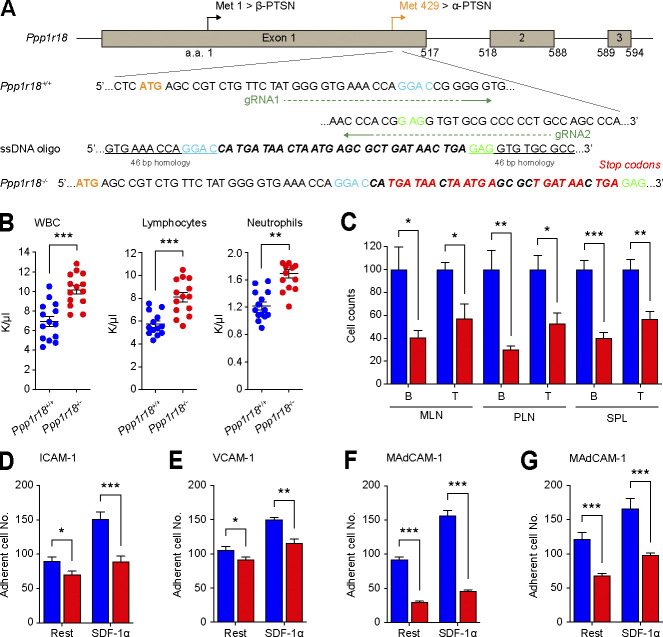
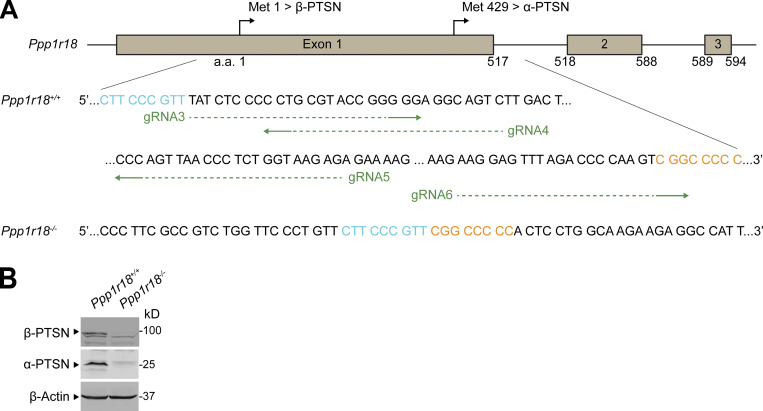
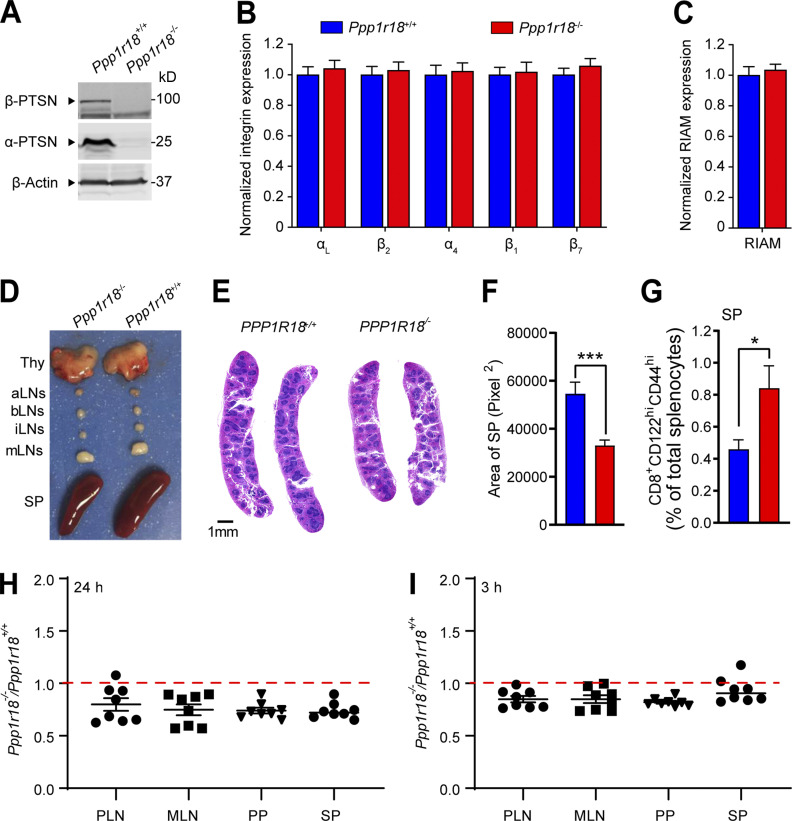
The foregoing data show that Ptsn, a component of the MIT complex, stabilizes the assembly of that complex and resulting integrin activation by regulating the phosphorylation of Rap1. We therefore created Ppp1r18−/− mice to assess a potential role for Ptsn in vivo. We devised three different CRISPR/Cas9 strategies to inactivate Ppp1r18. We first used a combination of two different gRNAs to introduce 7 stop codons downstream of the codon for the initiator methionine residue 429 of the α form of Ptsn (Fig. 8 A). To eliminate possible off-target effects, we used different gRNAs to delete the whole coding sequence of exon 1 that contains initiator methionine of both α and β forms of Ptsn (Fig. S3 A). In both cases, homozygous Ppp1r18−/− offspring mice were viable and fertile, their splenocytes lacked both Ptsn α and β isoforms (Figs. S2 A and S3 B), and they exhibited no change in expression of integrins αL, α4, β2, β1, or β7 (Fig. S2 B) or of RIAM (Fig. S2 C) in comparison with WT littermates. The overall size of lymph nodes in Ppp1r18−/− mice was similar to that of WT littermates (Fig. S2 D). However, Ppp1r18−/− spleens exhibited reduced size and cellularity (Fig. S2, D–F; and Fig. 8 C).
Figure 8.
Ppp1r18−/− mice are viable with impaired T cell integrin activation. (A) Generation of Ppp1r18−/− mice. Two sgRNAs targeting the exon1 downstream of methionine residue 429, which drives the expression of α-Ptsn, were used in combination with a single-stranded DNA (ssDNA) oligonucleotide to introduce seven stop codons. (B and C) Ppp1r18−/− mice exhibit leukocytosis. (B) Peripheral blood cell counts of WT or Ppp1r18−/− mice. Mean ± SEM are plotted. Two-tailed t test; **, P < 0.01; ***, P < 0.001. (C) Abundance of T and B cells in MLN, PLN, and spleen (SPL) from WT or Ppp1r18−/− mice. Data are normalized to Ppp1r18+/+ samples = 100. Bar graphs represent mean ± SEM (n = 4 mice). Two-tailed t test; *, P < 0.05; **, P < 0.01; ***, P < 0.001. (D–G) Loss of Ptsn reduces T and B cell adhesion. CD4+ T cells (D–F) or B cells (G) were isolated from the spleen of WT or Ppp1r18−/− mice. Cell adhesion to immobilized ICAM-1, VCAM-1, or MAdCAM-1 was assayed in flow condition upon stimulation with SDF-1α. Rest, no stimulation. Bar graphs represent mean ± SEM (n = 5 mice). Two-tailed t test; *, P < 0.05; **, P < 0.01; ***, P < 0.001.
Figure S3.
Alternative generation of Ppp1r18−/− mice. (A) Generation of Ppp1r18−/− mice by deleting the entire coding sequence of exon1. Four sgRNAs targeting the exon1 were used. The edited sequence of the repaired Ppp1r18−/− allele is shown. (B) Ppp1r18−/− mice manifested loss of both α- and β-Ptsn isoforms. Ptsn expression in splenocytes was assayed by immunoblotting using an antibody that reacts with the C-terminus of Ptsn and recognizes both α- and β-Ptsn isoforms. Source data are available for this figure: SourceData FS3.
Figure S2.
Characterization of Ppp1r18−/− mice. (A) Ppp1r18−/− mice manifest loss of both α- and β-Ptsn isoforms. Ptsn expression in splenocytes was assayed by immunoblotting using an antibody that reacts with the C-terminus of Ptsn and recognizes both α- and β-Ptsn isoforms. (B and C) Surface expression of αL (CD11a), β2 (CD18), α4 (CD49d), β1 (CD29), and β7 integrins (B), and intracellular staining of RIAM in splenocytes (C) was measured by flow cytometry. Bar graphs represent mean ± SEM (n = 5 mice). Data are normalized to Ppp1r18+/+ samples = 1. Two-tailed t test; no significant differences were observed. (D) Representative lymphoid tissues of Ppp1r18−/− and WT mice. aLN, aortic lymph nodes; bLN, brachial lymph nodes; iLN, inguinal lymph nodes; Thy, thymus; SP, spleen. (E) Representative H&E staining of spleen sections from Ppp1r18−/− or WT mice. Scale bars: 1 mm. (F) Spleen area calculated by H&E staining of spleen sections. Two-tailed t test; ***, P < 0.001. (G) Percentage of memory CD8 T cells (CD8+CD44hiCD122hi) in splenocytes (SP) from Ppp1r18−/− or WT mice. Bar graphs represent mean ± SEM (n = 4 mice). Two-tailed t test; *, P < 0.05. (H and I) In vivo competitive homing of Ppp1r18−/− CD4+ T cells to different lymphoid tissues. CD4+ T cells were isolated from either control or Ppp1r18−/− mice, differentially labeled, and mixed before injection into C57BL/6 mice. The ratio of Ppp1r18−/− to control CD4+ T cells was determined by flow cytometry from PLN, MLN, Peyer’s patches (PP), and spleen (SP) 24 h (H) or 3 h (I) after injection. Data represent mean ± SEM (n = 8 mice). Source data are available for this figure: SourceData FS2.
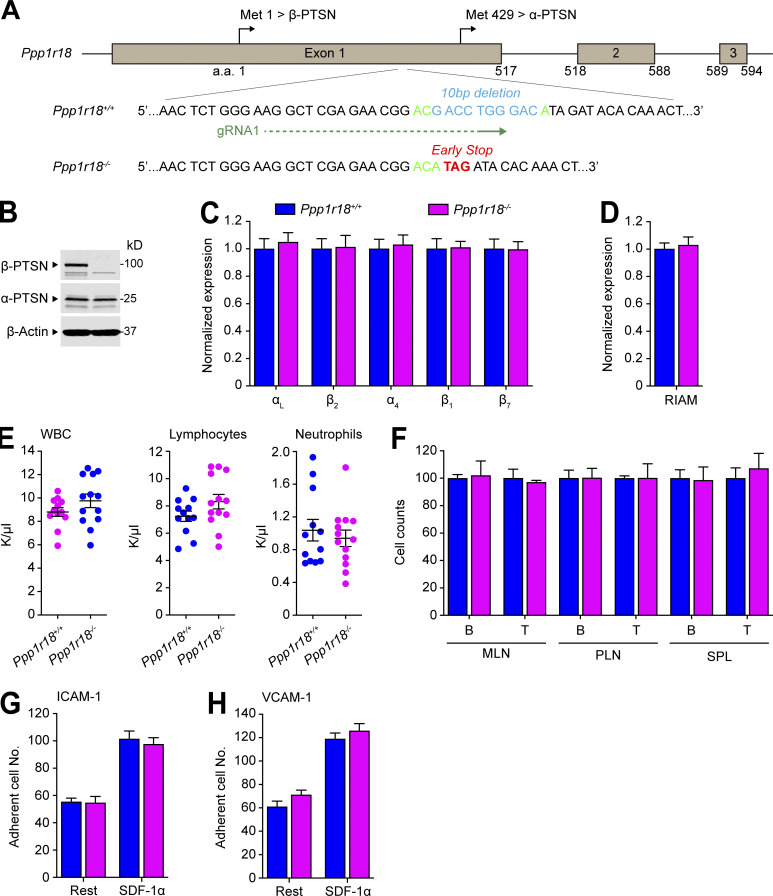
To specifically inactivate the β form of Ptsn, we used a gRNA upstream of the alternative translation start site at methionine residue 429, resulting in a 10-bp deletion that provokes a premature stop codon (Fig. S4 A) and absence of the β-Ptsn form, but intact expression of the α form, in splenocytes (Fig. S4 B). Homozygotes of Ppp1r18β−/− mice, lacking only the β form of Ptsn, were viable and fertile, and their splenocytes expressed a normal complement of integrins αL, α4, β2, β1, or β7 (Fig. S4 C) or of RIAM (Fig. S4 D).
Figure S4.
Deletion of the Ptsn β isoform in mice does not alter peripheral blood leukocyte counts, population of peripheral lymphoid organs, or T cell integrin activation. (A) Generation of Ppp1r18β−/− mice. Two sgRNAs targeting a site in exon1 that lies downstream of the initiator methionine for β-Ptsn (Met1) and upstream of that for α-Ptsn (Met429), causing a 10-bp deletion that results in an early stop codon in β-Ptsn. (B) Ppp1r18β−/− mice manifested loss of β-Ptsn isoform, but not α-Ptsn. Ptsn expression in splenocytes was assayed by immunoblotting using an antibody that reacts with the C-terminus of Ptsn and recognizes both α- and β-Ptsn isoforms. (C and D) Surface expression of αL (CD11a), β2 (CD18), α4 (CD49d), β1 (CD29), and β7 integrins (C) or intracellular staining of RIAM (D) in splenocytes was measured by flow cytometry. Bar graphs represent mean ± SEM (n = 3 mice). Data are normalized to Ppp1r18β+/+ samples = 1. Two-tailed t test; no significant differences were observed. (E) Ppp1r18β−/− mice exhibit normal peripheral blood leukocyte counts. Mean ± SEM are plotted. Two-tailed t test; no significant differences were observed. (F) The number of T and B cells in MLN, PLN, and spleen (SPL) from WT or Ppp1r18β−/− mice. Data are normalized to Ppp1r18β+/+ samples = 100. Bar graphs represent mean ± SEM (n = 4 mice). Two-tailed t test; no significant differences were observed. (G and H) Deletion of Ppp1r18β−/− does not impair T cell adhesion. CD4+ T cells were isolated from the spleen of WT or Ppp1r18β−/− mice. Cell adhesion to immobilized ICAM-1 or VCAM-1 was assayed in flow conditions upon stimulation with SDF-1α. Rest, no stimulation. Bar graphs represent mean ± SEM (n = 6 mice). Two-tailed t test; no significant differences were observed. Source data are available for this figure: SourceData FS4.
Because integrins play an important role in mediating the trafficking of lymphocytes to lymph nodes(DeNucci et al., 2009; Sun et al., 2021), we performed a competitive homing assay to measure the capacity of Ppp1r18−/− T cells to migrate in vivo (Fig. S2, H and I). Ppp1r18−/− CD4+ T cells manifested a slightly reduced homing to all peripheral lymphoid organs. Ppp1r18−/− mice lacking both forms of Ptsn exhibited an approximate twofold increase in blood leukocytes that affected both lymphocytes and neutrophils (Fig. 8 B) and an accompanying decrease in T and B cells in peripheral lymphatic organs (Fig. 8 C). The leukocytosis in these mice, combined with a reduction in lymphocytes in lymph nodes, is similar to that observed in RIAM-deficient Apbb1ip−/− mice (Klapproth et al., 2015; Su et al., 2015) and is partially explained by the reduction in T cell (Fig. 8, D–F) and B cell (Fig. 8 G) integrin activation. Importantly, the reduced cellularity (Fig. S2, D–F; and Fig. 8 C) in spleens suggested additional defects in Ptsn-null lymphocytes. Indeed, Ppp1r18−/− splenocytes exhibited increased phosphorylation of cofilin (Fig. S1 D) and VASP (Fig. S1 E) similar to that observed in U2-OS cells (Fig. S1, A and B), suggesting potential altered actin dynamics that can also contribute to migration defects. The increased peripheral blood lymphocytes in spite of reduced cellularity of the spleen suggested an increase in homeostatic proliferation, a possibility supported by the increase of CD8 T cells with a memory phenotype (CD8+CD44hiCD122hi; Fig. S2 G; Goldrath et al., 2000). Thus, Ptsn enables activation of lymphocyte integrins, regulates the phosphorylation of important regulators of actin dynamics, and supports population of peripheral lymphoid organs.
In sharp contrast to Ppp1r18−/− mice, Ppp1r18β−/− mice exhibited blood counts indistinguishable from those of WT littermates (Fig. S4 E). Consistent with the absence of leukocytosis, Ppp1r18β−/− T cells exhibited similar activation of T cell αLβ2 and α4β1 integrins as judged by adhesion on ICAM-1 or VCAM-1, respectively (Fig. S4, G and H). Furthermore, in the absence of β-Ptsn, α-Ptsn was sufficient to support the normal population of peripheral lymphatic tissues by B cells and T cells (Fig. S4 F), and lack of leukocytosis in Ppp1r18β−/− mice (Fig. S4 E). Because Ppp1r18β−/− mice exhibited no obvious phenotype, α-Ptsn is sufficient for these lymphocyte functions.
Ppp1r18−/− T cells exhibit reduced capacity to induce colitis
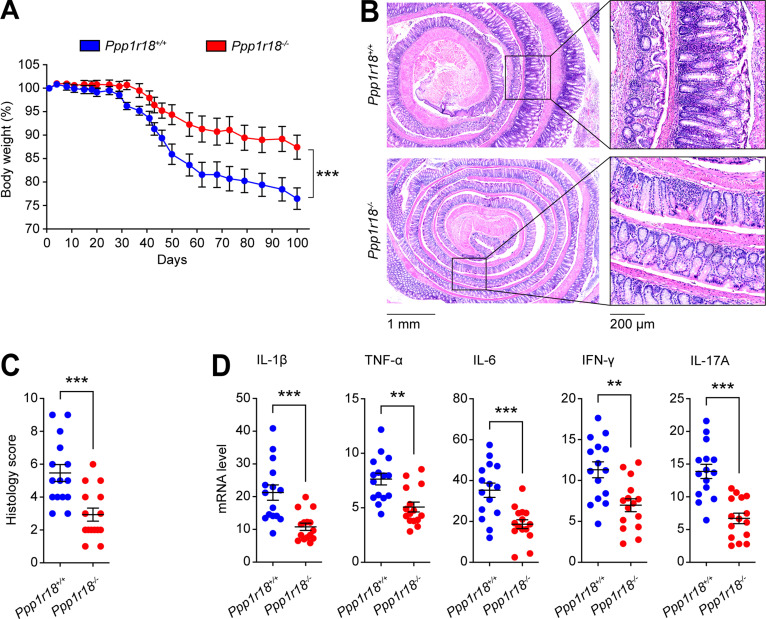
Because Ptsn-null mice were apparently healthy, yet exhibited defects in T cell integrin activation, we hypothesized that their T cells might lack the capacity to provoke autoimmune inflammation. We induced experimental autoimmune colitis (Sun et al., 2020) by infusing CD4+CD25−CD45RBhigh T cells (TCONV) from Ppp1r18−/− mice or WT mice into Rag1−/− recipient mice. Rag1−/− mice injected with WT TCONV manifested a progressive loss in body weight 20–30 d after the infusion (Fig. 9 A). In contrast, Rag1−/− mice injected with Ppp1r18−/− TCONV exhibited significantly less weight loss. Histologically, WT TCONV infusion led to a severe colitis in Rag1−/− mice, with almost complete loss of crypts, dense infiltrates of leukocytes in both mucosa and submucosa, and thickening of the bowel wall (Fig. 9 B). By contrast, the inflammatory infiltrates in the Rag1−/− mice infused with Ppp1r18−/− TCONV were much reduced and less tissue damage was observed (Fig. 9 B). Blinded histological scoring for inflammatory cell infiltrates and epithelial damage confirmed a reduction in the severity of colitis in Ppp1r18−/− TCONV–infused Rag1−/− mice (Fig. 9 C). The difference in inflammatory cell infiltration between Ppp1r18−/− and WT TCONV–infused Rag1−/− mice was confirmed by the reduction in colonic expression of proinflammatory cytokines (IL-1β, TNF-α, IL-6, IFN-γ, and IL-17A) in Ppp1r18−/− TCONV recipients (Fig. 9 D). Thus, the defect in T cell function in Ptsn-null CD4+ T cells is associated with impaired capacity to induce intestinal inflammation.
Figure 9.
Loss of Ptsn expression protects mice from colitis. Conventional T cells (1 × 10⁶) from WT or Ppp1r18−/− mice were adoptively transferred into Rag1−/− mice. (A) Changes in body weight are plotted. Values are normalized as a percentage of the original weight. Two-way ANOVA with Bonferroni post-test. ***, P < 0.001. (B) Representative H&E staining of distal colon sections wrapped like Swiss rolls from Rag1−/− mice injected with conventional T cells from WT or Ppp1r18−/− mice sacrificed on day 100. Scale bars: 1 mm or 200 μm. (C) Histology score. Two-tailed t test; ***, P < 0.001. (D) mRNA expression of IL-1β, TNF-α, IL-6, IFN-γ, and IL-17A in distal colon tissues on day 100. Results are normalized to expression of GAPDH. Mean ± SEM are plotted. Two-tailed t test; **, P < 0.01; ***, P < 0.001.
Discussion
The MIT complex plays an essential role in leukocyte integrin activation and thus in the trafficking and functions of lymphocytes in immunity and immunopathology (Su et al., 2015). Here we report that an actin binding regulatory subunit of PP1, Ptsn, encoded by the Ppp1r18 gene (Kao et al., 2007), stabilizes the MIT complex by mediating the dephosphorylation of Rap1, thereby preserving Rap1 activity. The stabilization of the MIT complex enables lymphocyte integrin activation and cell adhesion. Ppp1r18−/− mice are viable, fertile, and apparently healthy. These mice exhibit reduced lymphocyte population of peripheral lymphoid tissues associated with lymphocytosis in peripheral blood, findings ascribable in part to defective activation of lymphocyte integrins αLβ2 and α4β7. Furthermore, Ppp1r18−/− T cells manifested reduced capacity to induce colitis in an adoptive transfer model. Thus, Ptsn stabilizes the RIAM MIT complex by mediating dephosphorylation of Rap1 and is a regulator of T cell integrin–mediated functions. In spite of this defect in T cell integrin function, Ppp1r18−/− mice appear healthy, suggesting that Ptsn may be a therapeutic target in T cell–mediated autoimmune diseases.
Ptsn is physically associated with MIT complex and enables integrin activation by mediating dephosphorylation of Rap1, thereby stabilizing the complex. Ptsn was associated with the MIT complex formed by a ligand binding–defective integrin (Loftus et al., 1990), explaining why this association can form in nonadherent lymphocytes. Activation of integrins in lymphocytes requires Rap1 (Su et al., 2015), and we find that Ptsn helps maintain Rap1 in a functional nonphosphorylated state. In particular, we find that silencing of Ptsn destabilizes the MIT complex, and this destabilization can be prevented by a nonphosphorylatable mutant of Rap1a. In addition to reducing Rap1 activity, Rap1 phosphorylation results in prolonged activation of ERK 1/2 (Takahashi et al., 2017), an event that can also suppress integrin activation (Hughes et al., 1997) and assembly of the MIT complex (Lagarrigue et al., 2015). Thus, Ptsn joins Phactr4 (Zhang et al., 2012) as actin-associated protein phosphatase 1 regulators that modulate integrin functions.
Ppp1r18−/− mice exhibited lymphocytosis accompanied by a reduced population of peripheral lymphoid organs, a phenotype associated with a failure of lymphocyte migration out of the blood. We found that loss of Ptsn impairs lymphocyte migration and homing (Fig. 4 and Fig. S2, H and I). Cell migration requires anterior–posterior polarization of processes such as integrin activation and of actin dynamics to support directional migration (Ridley et al., 2003). The MIT complex is localized to and mediates the protrusions that form at the leading edge of migrating cells (Lagarrigue et al., 2015; Lee et al., 2013), a site at which α4 integrins can anchor type I PKA (Lim et al., 2007; Lim et al., 2008) to enable PKA activation. PKA phosphorylation of RhoA forms protrusion-retraction pacemaker at the leading edge of migrating cells (Tkachenko et al., 2011). Ptsn, by opposing PKA-mediated Rap1 phosphorylation, can preserve stability of the MIT complex at sites of increased PKA activity such as the leading edge (Lim et al., 2008). Conversely, overexpression of phospho-resistant Rap1 can arrest migration (Takahashi et al., 2013), suggesting that the dynamic interplay between PKA and Ptsn in Rap1 phosphorylation can contribute to the protrusion–retraction cycles that govern cell migration. Similarly, Apbb1ip−/− mice also exhibited lymphocytosis and a reduced integrin activation (Lagarrigue et al., 2016; Sun et al., 2021). Apbb1ip−/− mice showed a normal splenic cellularity in contrast to reduction in lymphocytes in the spleens of Ppp1r18−/− mice, raising the possibility that loss of Ptsn causes integrin-independent defects in lymphocyte function. In sum, Ptsn contributes to integrin-dependent and potentially to integrin-independent mechanisms of lymphocyte trafficking.
Preclinical research identified inhibition of ligand binding to lymphocyte integrins as a potential therapeutic target in autoimmune and inflammatory diseases (Dustin, 2019; von Andrian and Engelhardt, 2003). This idea was validated by the success of vedolizumab anti-α4β7 in inflammatory bowel disease (Feagan et al., 2013), natalizumab anti-α4β1 in multiple sclerosis (Rice et al., 2005), and efalizumab anti-αLβ2 in psoriasis (Dedrick et al., 2002). Serious mechanism-based toxicities such as progressive multifocal leukoencephalopathy have limited the use of natalizumab and efalizumab. Inhibition of integrin signaling can preserve some integrin function and can therefore ameliorate mechanism-based toxicities of complete blockade of integrin function (Feral et al., 2006; Petrich et al., 2007). Talin and Rap1 are major elements in signaling pathways that activate leukocyte integrins; however, global loss of talin1 or combined loss of Rap1a and Rap1b leads to embryonic lethality in mice (Calderwood et al., 2013; Li et al., 2007). RIAM plays a key role in Rap1-dependent talin-mediated activation of αLβ2 and α4β7 integrins (Su et al., 2015; Sun et al., 2021) in most leukocytes, and lack of RIAM leads to no obvious developmental defects or abnormalities in platelet functions (Klapproth et al., 2015; Stritt et al., 2015; Su et al., 2015). Here we show that Ptsn supports Rap1-induced assembly of the RIAM–talin–integrin complex required for integrin activation. In the absence of Ptsn, a defect in lymphocyte trafficking is associated with the inability of T cells to provoke experimental colitis. Importantly, like RIAM, Ptsn is expressed at low levels in platelets (Fig. 3 A), and we observed no gross bleeding tendency or anemia in Ppp1r18−/− mice. Thus, Ptsn inhibition may provide a means to blunt immune-mediated inflammation with less mechanism-based toxicity than direct blockade of ligand binding to leukocyte integrins.
Materials and methods
Cell lines and plasmids
U2-OS and HEK 293A cells were grown in DMEM supplemented with 10% (vol/vol) FBS, nonessential amino acids, 1× penicillin/streptomycin, and 2 mM L-glutamine at 37°C in a 5% CO2 incubator. Jurkat T cells were from American Type Culture Collection and cultured in RPMI supplemented with 10% (vol/vol) FBS, nonessential amino acids, 1× penicillin/streptomycin, and 2 mM L-glutamine. U2-OS stable cell lines expressing αΙΙb-streptavidin(SBP)-β3 or αΙΙb-SBPβ3(D119A) were generated by lentiviral infection of αIIb-SBP with β3 or αIIb-SBP with β3(D119A), respectively. Monoclonal cell populations were selected by flow cytometry.
Mammalian expression plasmids encoding full-length integrin αIIb-SBP and β3 (WT) or (D119A) were cloned into pcDNA3.1(−). Myc-, Myc-mCherry–, or DsRed-tagged human β-Ptsn (aa 1–613) and α-Ptsn (aa 249–613) were cloned into pcDNA3.1(−). Full-length RIAM cDNA was cloned into p3xFlag-CMV-7.1 (Sigma-Aldrich). Constructs encoding EGFP-tagged full-length talin1 WT were previously described (Wegener et al., 2007). Coding sequences of β- and α-Ptsn were cloned into pEGFP-C1 and p3xFlag-CMV-7.1 (Sigma-Aldrich), respectively. β-Ptsn 4A mutation (residues K539, I540, S541, and F542 into four Ala) predicted to block binding to PP1 (Kao et al., 2007) was produced by site-directed mutagenesis. Bicistronic constructs expressing Flag-RIAM together with either Myc-His-Rap1a WT or S180A mutant were generated into pcDNA3.1(−). Plasmid encoding EGFP-tagged PP1 catalytic subunit γ was obtained from Addgene (plasmid # 44225; Addgene). Expression of Ptsn was silenced in U2-OS and 293A cells by lentiviral transduction of a pLKO1 shRNA against both β- and α-Ptsn (TRCN0000282572; Sigma-Aldrich). pLKO1 shRNA (SHC016V; Sigma-Aldrich) was used as a control.
Antibodies and reagents
Antibodies against talin (8d4; Sigma-Aldrich) and Flag (M2) were from Sigma-Aldrich. Antibodies against Rap1 (E-6, sc-398755) and DsRed (sc-33354) were from Santa Cruz Biotechnology. Anti-integrin αIIb (PMI-1), anti-β3 (Rb8257 and Rb8053; Frelinger et al., 1990; Frelinger et al., 1988), and activated anti-αIIbβ3 (Pac1; Shattil et al., 1985) were described previously. Polyclonal anti-EGFP antibody was produced in rabbits immunized with recombinant EGFP. Anti-Flag M2 affinity gel was purchased from Sigma-Aldrich, and Pierce Streptavidin Plus UltraLink Resin and Pierce Monomeric Avidin Agarose were from Thermo Fisher Scientific. 3xFlag peptide (MDYKDHDGDYKDHDIDYKDDDDK) was synthesized by United BioSystems. Fluorophore-conjugated antibodies against CD3 (17A2, 2C11), B220 (RA3-6B2), CD8 (53-5.8), CD122 (TM-β1), CD49d (9F10), CD11a (M17/4), CD29 (HMβ1-1), CD18 (M18/2), and β7 (FIB 504) were purchased from BioLegend. Secondary Alexa Fluor–labeled antibodies were from Jackson ImmunoResearch. MojoSort mouse CD4+ T cell isolation kit and SDF-1α were from BioLegend. Recombinant human VCAM-1-Fc, mouse ICAM-1-Fc, and VCAM-1-Fc were from BioLegend. Recombinant mouse MAdCAM-1-Fc was from R&D Systems.
Antibody against β-Ptsn was from Santa Cruz Biotechnology. To generate antibody against α-Ptsn, mouse Ptsn C-terminus (aa 429–594) was cloned into pETM-11 vector. His-Ptsn fusion protein was solubilized from inclusion bodies with 6 M urea and purified under denaturing conditions using His-Bind resin. The protein was dialyzed against PBS multiple times and used to raise polyclonal rabbit antisera (Abgent).
Purification of MIT complex by split tandem affinity purification
Split tandem affinity purification allows the isolation of native protein complexes in high purity that contain two predefined components. A different affinity tag is fused to each protein of interest, and sequential affinity chromatography enables the purification of complexes containing both proteins. Subconfluent U2-OS cells stably expressing SBP joined to integrin αIIb (αIIb-SBP) and ligand binding defective β3(D119A) were transfected with plasmids encoding Flag-tagged RIAM and cultured for 24–48 h. After washing with PBS, cells were harvested, and lysates were prepared in lysis buffer (50 mM Tris-HCl, pH 7.4, 100 mM NaCl, 0.5% NP-40, 0.5 mM MgCl2, 0.5 mM CaCl2, 0.2 mM 5'-Guanylyl-imidodiphosphate trisodium salt hydrate, 10 mM N-ethylmaleimide, 1 μM calpeptin, PhosStop, and protease inhibitor cocktails). Cell lysates were centrifuged at 22,000 g for 30 min. The supernatant was collected and precleared with anti-mouse IgG coupled to agarose beads (Sigma-Aldrich) for 2 h at 4°C. Cell lysates were then loaded into anti-Flag affinity column and incubated for 4 h at 4°C. After washing, RIAM and associated proteins were eluted under native conditions with 200 μg/ml 3xFlag peptide. The eluate was loaded into a streptavidin plus ultralink column (Thermo Fisher Scientific) and incubated for 2 h at 4°C and washed. αIIb and associated proteins were eluted by 5 mM D-biotin to isolate native complexes containing both RIAM and αIIb. In some cases, complexes containing both RIAM and αIIb were analyzed by eluting the streptavidin column in boiling Laemmli buffer for SDS-PAGE and immunoblotting.
Identification of MIT complex–associated proteins
The gel piece was transferred to a siliconized tube and washed and unstained in 200 µl of 50% methanol overnight. The gel pieces were dehydrated in acetonitrile, rehydrated in 30 µl of 10 mM dithiothreitol in 0.1 M ammonium bicarbonate, and reduced at room temperature for 30 min. The dithiothreitol solution was removed, and the sample was alkylated in 30 µl of 50 mM iodoacetamide in 0.1 M ammonium bicarbonate at room temperature for 30 min. The reagent was removed, and the gel pieces were dehydrated in 100 µl acetonitrile. The acetonitrile was removed, and the gel pieces were rehydrated in 100 µl of 0.1 M ammonium bicarbonate and the pieces completely dried by vacuum centrifugation. The gel pieces were rehydrated in 20 ng/µl trypsin in 50 mM ammonium bicarbonate and digested overnight at 37°C, and the peptides formed were extracted from the polyacrylamide in two 30-µl aliquots of 50% acetonitrile/5% formic acid. These extracts were combined and evaporated to 15 µl for mass spectrometry analysis performed as previously described (Goldfinger et al., 2007).
Immunoprecipitation and gel mobility shift assay
Cells were harvested and lysed by NP-40 lysis buffer (50 mM Tris-HCl, pH 7.4, 150 mM NaCl, 0.5% NP-40, 0.5 mM CaCl2, 0.5 mM MgCl2, 1 μM calpeptin, protease inhibitor cocktail, and PhosStop) on ice for 15 min. The lysate was centrifuged at 14,000 rpm at 4°C for 15 min. Protein concentration of the lysate was determined using a bicinchoninic acid assay (Thermo Fisher Scientific). The lysate was immunoprecipitated using designated primary antibodies with protein G resin (GenScript) or anti-Flag M2 affinity agarose gel at 4°C. Immune complexes were washed for extended times with the lysis buffer and separated by SDS-PAGE gels. Proteins on the gel were transferred to nitrocellulose membrane and probed with indicated primary and secondary antibodies. We used a gel shift assay (Takahashi et al., 2013) to detect phosphorylation of endogenous Rap1. WT, Ptsn-null, or β-Ptsn–reconstituted Ptsn-null Jurkat T cells were left untreated or treated with H-89 (10 μM) for 30 min. Cell lysates were prepared in the lysis buffer, and the mobility of Rap1 was measured on 12% SDS-PAGE followed by immunoblotting with anti-Rap1(E-6, sc-398755) to visualize Rap1.
Flow cytometry
Cells isolated from mouse tissues were washed and resuspended in PBS containing 0.1% BSA and stained with conjugated antibody for 30 min at 4°C. Then cells were washed twice before flow cytometry analysis using an Accuri C6 Plus (BD Biosciences). Data were analyzed using FlowJo software (BD Biosciences).
Integrin activation assay
The activation state of αIIb(R995A)β3 was assessed by measuring the binding of the ligand mimetic anti-αIIbβ3 monoclonal antibody PAC1 in two-color flow cytometric assays as described previously (O’Toole et al., 1994). Ptsn expression in 293A cells stably expressing integrin αIIb(R995A)β3 was silenced by shRNA, and the cells were transfected with shRNA-resistant EGFP-Ptsn or EGFP vector as a transfection marker. After 24 h, cells were suspended and stained with PAC1. Then, cells were washed and analyzed by flow cytometry. Background binding was measured in presence of the αIIbβ3 antagonist integrilin (10 μM), whereas maximum binding was quantified upon addition of the anti-LIBS6 monoclonal antibody (Frelinger et al., 1991) against αIIbβ3 (2 μM). To measure the activation of α4β1 (Rose et al., 2000), cells (5 × 10⁵) were resuspended in HBSS (Mediatech) containing 5 μg/ml human VCAM-1-Fc for 30 min at 37°C. Afterward, cells were washed with 0.5 ml of HBSS, resuspended in the same buffer containing Alexa Fluor 647–conjugated anti-human antibody, and incubated for 30 min on ice. Cells were washed twice before analysis by flow cytometry. Background binding was measured in presence of 5 mM EDTA, whereas maximum binding was quantified upon addition of 1 mM MnCl2.
Flow chamber assay
A polystyrene Petri dish was coated with 20 μl of 10 μg/ml MAdCAM-1/Fc, 5 μg/ml VCAM-1/Fc, or 10 μg/ml ICAM-1/Fc/20 μg/ml P-selectin alone or with SDF-1α (2 μg/ml) in coating buffer (PBS and 10 mM NaHCO3, pH 9.0) for 1 h at 37°C, washed with PBS then blocked with 2% BSA in coating buffer for 1 h at 37°C, and washed with PBS. Cells were diluted to 106 cells/ml in HBSS (Mediatech) and immediately perfused through the flow chamber at a constant flow rate to produce a shear stress of 2 dyn/cm2. Adhesive interactions between the flowing cells and the coated substrates were assessed by manually tracking the motions of individual cells for 1 min as previously described (Sun et al., 2020; Sun et al., 2014). The motion of each adherent cell was monitored for 10 s after the initial adhesion point, and two categories of cell adhesion were defined: rolling adhesion (cells with rolling motions for >10 s with a velocity >1 μm/s) and arrested adhesion (cells that remained adherent and stationary for >10 s with a velocity <1 μm/s). The total adherent cell number includes both rolling and arrested adherent cells.
Mice
All animal experiments were approved by the Institutional Animal Care and Use Committee of the University of California, San Diego, and were conducted in accordance with federal regulations as well as institutional guidelines and regulations on animal studies. All mice were housed in specific pathogen–free conditions. C57BL/6J (CD45.1), C57BL/6J (CD45.2), and Rag1−/− mice were from The Jackson Laboratory. For experiments, 8–12-wk-old mice were used. All injections of cells were performed during the light cycle. All experiments were performed by comparing mutant mice with littermate controls. Mononuclear cells were isolated from mesenteric lymph node (MLN), Peyer’s patch, peripheral lymph node (PLN), spleen, and colonic lamina propria as previously described. Ppp1r18−/− mice were generated using a CRISPR/Cas9 approach at the University of California, Irvine Transgenic Mouse Facility. The complex Cas9 mRNA/sgRNA/tracRNA (3 μM) was injected into the pronuclei of C57BL/6N embryos. Surviving embryos were implanted into imprinting control-region pseudo-pregnant females, and pregnancies went to full term. Tissue biopsies for genomic DNA were taken from pups between 7 and 10 d. Mice were genotyped by PCR using forward primer 5′-GGACGACCTGGGACATAGATACA-3′ and reverse primer 5′-TTTTCACACGCCTTCACAGGTA-3′, followed by Sanger sequencing using forward primer 5′-TCCAGACAGCAGGAAGAGGAAG-3′ and reverse primer 5′-TCTACCCAGTCAGGCATGGT-3′. Founders were selected and backcrossed to the C57BL/6J strain (more than five times) to establish the Ppp1r18−/− strain. To generate Ppp1r18β−/− mice, a similar CRISPR/Cas9 approach was used to inject a complexed Cas9 mRNA/sgRNA (3 μM) into the pronuclei of C57BL/6NHsd embryos at the University of California, San Diego Transgenic Mouse Facility. One homozygous pup harboring a 10-bp deletion resulting in the appearance of a downstream premature stop codon was selected and backcrossed to the C57BL/6J strain (more than five times) to establish the Ppp1r18β−/− strain, which lacks the only β form of Ptsn. Mice were genotyped by PCR using forward primer 5′-CTGAGCAGAGACCCACTGAAAG-3′ and reverse primer 5′-GGATCTGGCTTCTGAGTTTGTGTA-3′, and amplicons were run in 6% Tris-borate-EDTA gels (Life Technologies).
Competitive homing assays
Competitive homing of CD4+ T cells was performed as previously described (Sun et al., 2021). Briefly, CD4+ T cells from Ppp1r18−/− mice and WT littermates were labeled with CFSE and eflour670, respectively. Equal numbers of differentially labeled cells were mixed and then intravenously injected into C57BL/6 recipient mice. Lymphoid organs were harvested 3 or 24 h after injection, and isolated cells were analyzed by flow cytometry for the ratio of Ppp1r18−/− to WT CD4+ T cells in various lymphoid organs.
Mouse colitis models
The adoptive T cell transfer model was described before (Sun et al., 2020). Briefly, 8–10-wk-old mice were used. 5 × 10⁵ CD4+CD25−CD45RBhigh conventional T cells from WT or Ppp1r18−/− mice were injected intraperitoneally into Rag1−/− mice (Mombaerts et al., 1992). All comparisons were made between littermates. Mouse body weight was measured every day, and values are shown as a percentage of the original weight. During the duration of the experiment, we assessed the clinical progression of colitis by daily blinded scoring of disease activity index by two independent investigators. The disease activity index is the combined score of body weight loss, stool consistency, and rectal bleeding and prolapse as follows: (a) weight loss: 0 (no loss), 1 (1–5%), 2 (5–10%), 3 (10–20%), 4 (>20%); (b) stool consistency: 0 (normal), 1 (soft), 2 (very soft), 3 (diarrhea); (c) rectal bleeding: 0 (none), 1 (red), 2 (dark red), 3 (gross bleeding); and (d) rectal prolapse: 0 (none), 1 (signs of prolapse), 2 (clear prolapse), 3 (extensive prolapse). Mice were sacrificed at week 15.
Histology
Formalin-fixed, paraffin-embedded Swiss-rolled colon sections of 4-mm thickness were mounted on glass slides followed by H&E or periodic acid–Schiff staining. Images were acquired with a Nanozoomer Slide Scanner (Hamamatsu). Blinded histological scoring was performed by two investigators based on the method described previously (Erben et al., 2014), and total scoring range was 0–12.
Blood counts
Peripheral blood was collected from the retroorbital plexus and transferred to tubes containing K+EDTA. Cell counts were performed using a Hemavet 950FS Hematology System programmed with mouse-specific settings (Drew Scientific). All samples were tested in duplicate, and the mean for each animal was plotted.
Real-time quantitative PCR analyses
Total RNA was isolated from colon using a tissue homogenizer (JXFSTPRP-24; ThunderSci) and TRIzol reagent according to the manufacturer’s protocol (Thermo Fisher Scientific). For gene expression analysis, single-stranded cDNA was produced from 10 μg total RNA of colon using SuperScript III First-Strand synthesis and oligonucleotide-dT primers according to the manufacturer’s protocol (Thermo Fisher Scientific). Kapa SybrFast qPCR kit (Kapa Biosystems) and a thermal cycler (CFX96 Real-Time System; Bio-Rad) were used to determine the relative levels of the genes analyzed (primer sequences are shown in Table S2) according to the manufacturer’s protocol. The 2−ΔΔCt method was used for analysis, and data were normalized to GAPDH. Control values (Rag1−/− mice injected with PBS) were set to 1 for comparisons.
Statistics
Statistical significance was assayed by a two-tailed t test for single comparisons. ANOVA with a Tukey post-test was used to assay statistical significance for multiple comparisons. A P value <0.05 was considered significant.
Online supplemental material
Fig. S1 shows effect of loss of Ptsn on phosphorylation of VASP and cofilin. Fig. S2 shows effect of loss of Ptsn on cellularity of lymphoid organs and homing of lymphocytes. Fig. S3 shows alternative strategy for creating Ppp1R18−/− mouse. Fig. S4 shows strategy for creating and phenotype of Ppp1R18β−/− mouse. Table S1 contains the proteomic analysis of the purified MIT complex. Table S2 lists the sequences of primers for the real-time quantitative PCR analyses.
Supplementary Material
describes the proteomic analysis of the purified MIT complex.
lists the sequences of primers for real-time quantitative PCR analyses.
contains original blots for Fig. 1.
contains original blots for Fig. 2.
contains original blots for Fig. 3.
contains original blots for Fig. 5.
contains original blots for Fig. 6.
contains original blots for Fig. 7.
contains original blots for Fig. S1.
contains original blots for Fig. S2.
contains original blots for Fig. S3.
contains original blots for Fig. S4.
Acknowledgments
We thank the University of California, Irvine and the University of California, San Diego Transgenic Mouse Facilities for design help and production of CRISPR-modified mice; Jennifer Santini for microscopy technical assistance; and the University of California, San Diego School of Medicine Microscopy Core (NINDS P30NS047101). We thank Dr. Lifan Lu for valuable discussion.
The University of California, Irvine Transgenic Mouse Facility is a shared resource funded in part by the Chao Family Comprehensive Cancer Center Support Grant (P30CA062203) from the National Cancer Institute. This work was supported by grants HL 139947 and HL 151433 from the National Heart Lung and Blood Institute (M.H. Ginsberg) and by the Crohn’s & Colitis Foundation Career Development Award 902590 (H. Sun), the American Heart Association Career Development Award 18CDA34110228 (F. Lagarrigue), and the American Heart Association Scientist Development Grant 14SDG18440023 (H.-S. Lee).
Author contributions: M.H. Ginsberg conceived the study, designed experiments, analyzed data, and wrote the manuscript. H.-S. Lee, H. Sun, S.H.J. Kim, and F. Lagarrigue designed and executed experiments, analyzed data, and wrote the manuscript. J.W. Fox and N.E. Sherman performed mass spectroscopic analysis. A.R. Gingras designed and produced recombinant Ptsn antigen and tested the antibody produced. M.H. Ginsberg, H.-S. Lee, H. Sun, F. Lagarrigue, and A.R. Gingras edited the manuscript.
References
- Allen, P.B., Ouimet C.C., and Greengard P.. 1997. Spinophilin, a novel protein phosphatase 1 binding protein localized to dendritic spines. Proc. Natl. Acad. Sci. USA. 94:9956–9961. 10.1073/pnas.94.18.9956 [DOI] [PMC free article] [PubMed] [Google Scholar]
- Bos, J.L. 2005. Linking rap to cell adhesion. Curr. Opin. Cell Biol. 17:123–128. 10.1016/j.ceb.2005.02.009 [DOI] [PubMed] [Google Scholar]
- Boussiotis, V.A., Freeman G.J., Berezovskaya A., Barber D.L., and Nadler L.M.. 1997. Maintenance of human T cell anergy: Blocking of IL-2 gene transcription by activated Rap1. Science. 278:124–128. 10.1126/science.278.5335.124 [DOI] [PubMed] [Google Scholar]
- Calderwood, D.A., Campbell I.D., and Critchley D.R.. 2013. Talins and kindlins: Partners in integrin-mediated adhesion. Nat. Rev. Mol. Cell Biol. 14:503–517. 10.1038/nrm3624 [DOI] [PMC free article] [PubMed] [Google Scholar]
- Dedrick, R.L., Walicke P., and Garovoy M.. 2002. Anti-adhesion antibodies efalizumab, a humanized anti-CD11a monoclonal antibody. Transpl. Immunol. 9:181–186. 10.1016/s0966-3274(02)00029-1 [DOI] [PubMed] [Google Scholar]
- DeNucci, C.C., Mitchell J.S., and Shimizu Y.. 2009. Integrin function in T-cell homing to lymphoid and nonlymphoid sites: getting there and staying there. Crit. Rev. Immunol. 29(2):87–109. 10.1615/critrevimmunol.v29.i2.10 [DOI] [PMC free article] [PubMed] [Google Scholar]
- Dustin, M.L. 2019. Integrins and their role in immune cell adhesion. Cell. 177:499–501. 10.1016/j.cell.2019.03.038 [DOI] [PubMed] [Google Scholar]
- Erben, U., Loddenkemper C., Doerfel K., Spieckermann S., Haller D., Heimesaat M.M., Zeitz M., Siegmund B., and Kuhl A.A.. 2014. A guide to histomorphological evaluation of intestinal inflammation in mouse models. Int. J. Clin. Exp. Pathol. 7:4557–4576 [PMC free article] [PubMed] [Google Scholar]
- Feagan, B.G., Rutgeerts P., Sands B.E., Hanauer S., Colombel J.F., Sandborn W.J., Van Assche G., Axler J., Kim H.J., Danese S., et al. 2013. Vedolizumab as induction and maintenance therapy for ulcerative colitis. N. Engl. J. Med. 369:699–710. 10.1056/NEJMoa1215734 [DOI] [PubMed] [Google Scholar]
- Feral, C.C., Rose D.M., Han J., Fox N., Silverman G.J., Kaushansky K., and Ginsberg M.H.. 2006. Blocking the alpha 4 integrin-paxillin interaction selectively impairs mononuclear leukocyte recruitment to an inflammatory site. J. Clin. Invest. 116:715–723. 10.1172/JCI26091 [DOI] [PMC free article] [PubMed] [Google Scholar]
- Frelinger, A.L., III, Cohen I., Plow E.F., Smith M.A., Roberts J., Lam S.C., and Ginsberg M.H.. 1990. Selective inhibition of integrin function by antibodies specific for ligand-occupied receptor conformers. J. Biol. Chem. 265:6346–6352. 10.1016/s0021-9258(19)39332-9 [DOI] [PubMed] [Google Scholar]
- Frelinger, A.L., III, Du X.P., Plow E.F., and Ginsberg M.H.. 1991. Monoclonal antibodies to ligand-occupied conformers of integrin alpha IIb beta 3 (Glycoprotein IIb-IIIa) alter receptor affinity, specificity, and function. J. Biol. Chem. 266:17106–17111. 10.1016/s0021-9258(19)47346-8 [DOI] [PubMed] [Google Scholar]
- Frelinger, A.L., III, Lam S.C., Plow E.F., Smith M.A., Loftus J.C., and Ginsberg M.H.. 1988. Occupancy of an adhesive glycoprotein receptor modulates expression of an antigenic site involved in cell adhesion. J. Biol. Chem. 263:12397–12402. 10.1016/s0021-9258(18)37769-x [DOI] [PubMed] [Google Scholar]
- Goldfinger, L.E., Ptak C., Jeffery E.D., Shabanowitz J., Han J., Haling J.R., Sherman N.E., Fox J.W., Hunt D.F., and Ginsberg M.H.. 2007. An experimentally derived database of candidate Ras-interacting proteins. J. Proteome Res. 6:1806–1811. 10.1021/pr060630l [DOI] [PMC free article] [PubMed] [Google Scholar]
- Goldrath, A.W., Bogatzki L.Y., and Bevan M.J.. 2000. Naive T cells transiently acquire a memory-like phenotype during homeostasis-driven proliferation. J. Exp. Med. 192:557–564. 10.1084/jem.192.4.557 [DOI] [PMC free article] [PubMed] [Google Scholar]
- Hogg, N., Patzak I., and Willenbrock F.. 2011. The insider’s guide to leukocyte integrin signalling and function. Nat. Rev. Immunol. 11:416–426. 10.1038/nri2986 [DOI] [PubMed] [Google Scholar]
- Hughes, P.E., Renshaw M.W., Pfaff M., Forsyth J., Keivens V.M., Schwartz M.A., and Ginsberg M.H.. 1997. Suppression of integrin activation: A novel function of a Ras/Raf-initiated MAP kinase pathway. Cell. 88:521–530. 10.1016/s0092-8674(00)81892-9 [DOI] [PubMed] [Google Scholar]
- Hynes, R.O. 2002. Integrins: Bidirectional, allosteric signaling machines. Cell. 110:673–687. 10.1016/s0092-8674(02)00971-6 [DOI] [PubMed] [Google Scholar]
- Kao, S.C., Chen C.Y., Wang S.L., Yang J.J., Hung W.C., Chen Y.C., Lai N.S., Liu H.T., Huang H.L., Chen H.C., et al. 2007. Identification of phostensin, a PP1 F-actin cytoskeleton targeting subunit. Biochem. Biophys. Res. Commun. 356:594–598. 10.1016/j.bbrc.2007.03.026 [DOI] [PubMed] [Google Scholar]
- Kim, C., Ye F., and Ginsberg M.H.. 2011. Regulation of integrin activation. Annu. Rev. Cell Dev. Biol. 27:321–345. 10.1146/annurev-cellbio-100109-104104 [DOI] [PubMed] [Google Scholar]
- Klapproth, S., Sperandio M., Pinheiro E.M., Prunster M., Soehnlein O., Gertler F.B., Fassler R., and Moser M.. 2015. Loss of the Rap1 effector RIAM results in leukocyte adhesion deficiency due to impaired β2 integrin function in mice. Blood. 126:2704–2712. 10.1182/blood-2015-05-647453 [DOI] [PMC free article] [PubMed] [Google Scholar]
- Lagarrigue, F., Gertler F.B., Ginsberg M.H., and Cantor J.M.. 2017. Cutting edge: Loss of T cell RIAM precludes conjugate formation with APC and prevents immune-mediated diabetes. J. Immunol. 198:3410–3415. 10.4049/jimmunol.1601743 [DOI] [PMC free article] [PubMed] [Google Scholar]
- Lagarrigue, F., Kim C., and Ginsberg M.H.. 2016. The Rap1-RIAM-talin axis of integrin activation and blood cell function. Blood. 128:479–487. 10.1182/blood-2015-12-638700 [DOI] [PMC free article] [PubMed] [Google Scholar]
- Lagarrigue, F., Vikas Anekal P., Lee H.S., Bachir A.I., Ablack J.N., Horwitz A.F., and Ginsberg M.H.. 2015. A RIAM/lamellipodin-talin-integrin complex forms the tip of sticky fingers that guide cell migration. Nat. Commun. 6:8492. 10.1038/ncomms9492 [DOI] [PMC free article] [PubMed] [Google Scholar]
- Lai, N.S., Wang T.F., Wang S.L., Chen C.Y., Yen J.Y., Huang H.L., Li C., Huang K.Y., Liu S.Q., Lin T.H., and Huang H.B.. 2009. Phostensin caps to the pointed end of actin filaments and modulates actin dynamics. Biochem. Biophys. Res. Commun. 387:676–681. 10.1016/j.bbrc.2009.07.086 [DOI] [PubMed] [Google Scholar]
- Lee, H.S., Anekal P., Lim C.J., Liu C.C., and Ginsberg M.H.. 2013. Two modes of integrin activation form a binary molecular switch in adhesion maturation. Mol. Biol. Cell. 24:1354–1362. 10.1091/mbc.E12-09-0695 [DOI] [PMC free article] [PubMed] [Google Scholar]
- Lefort, C.T., Rossaint J., Moser M., Petrich B.G., Zarbock A., Monkley S.J., Critchley D.R., Ginsberg M.H., Fassler R., and Ley K.. 2012. Distinct roles for talin-1 and kindlin-3 in LFA-1 extension and affinity regulation. Blood. 119:4275–4282. 10.1182/blood-2011-08-373118 [DOI] [PMC free article] [PubMed] [Google Scholar]
- Ley, K., Laudanna C., Cybulsky M.I., and Nourshargh S.. 2007. Getting to the site of inflammation: The leukocyte adhesion cascade updated. Nat. Rev. Immunol. 7:678–689. 10.1038/nri2156 [DOI] [PubMed] [Google Scholar]
- Ley, K., Rivera-Nieves J., Sandborn W.J., and Shattil S.. 2016. Integrin-based therapeutics: Biological basis, clinical use and new drugs. Nat. Rev. Drug Discov. 15:173–183. 10.1038/nrd.2015.10 [DOI] [PMC free article] [PubMed] [Google Scholar]
- Li, Y., Yan J., De P., Chang H.C., Yamauchi A., Christopherson K.W. 2nd, Paranavitana N.C., Peng X., Kim C., Munugalavadla V., et al. 2007. Rap1a null mice have altered myeloid cell functions suggesting distinct roles for the closely related Rap1a and 1b proteins. J. Immunol. 179:8322–8331. 10.4049/jimmunol.179.12.8322 [DOI] [PMC free article] [PubMed] [Google Scholar]
- Lim, C.J., Han J., Yousefi N., Ma Y., Amieux P.S., McKnight G.S., Taylor S.S., and Ginsberg M.H.. 2007. Alpha4 Integrins are Type I cAMP-dependent protein kinase-anchoring proteins. Nat. Cell Biol. 9:415–421. 10.1038/ncb1561 [DOI] [PubMed] [Google Scholar]
- Lim, C.J., Kain K.H., Tkachenko E., Goldfinger L.E., Gutierrez E., Allen M.D., Groisman A., Zhang J., and Ginsberg M.H.. 2008. Integrin-mediated protein kinase A activation at the leading edge of migrating cells. Mol. Biol. Cell. 19:4930–4941. 10.1091/mbc.e08-06-0564 [DOI] [PMC free article] [PubMed] [Google Scholar]
- Lin, Y.S., Huang H.L., Liu W.T., Lin T.H., and Huang H.B.. 2014. Identification of the high molecular weight isoform of phostensin. Int. J. Mol. Sci. 15:1068–1079. 10.3390/ijms15011068 [DOI] [PMC free article] [PubMed] [Google Scholar]
- Lin, Y.S., Huang K.Y., Wang T.F., Huang H.L., Yu H.C., Yen J.Y., Hung S.H., Liu S.Q., Lai N.S., and Huang H.B.. 2011. Immunolocalization of phostensin in lymphatic cells and tissues. J. Histochem. Cytochem. 59:741–749. 10.1369/0022155411411303 [DOI] [PMC free article] [PubMed] [Google Scholar]
- Loftus, J.C., O’Toole T.E., Plow E.F., Glass A., Frelinger A.L. III, and Ginsberg M.H.. 1990. A β3 integrin mutation abolishes ligand binding and alters divalent cation-dependent conformation. Science. 249:915–918. 10.1126/science.2392682 [DOI] [PubMed] [Google Scholar]
- Luo, B.H., Carman C.V., and Springer T.A.. 2007. Structural basis of integrin regulation and signaling. Annu. Rev. Immunol. 25:619–647. 10.1146/annurev.immunol.25.022106.141618 [DOI] [PMC free article] [PubMed] [Google Scholar]
- Medrano-Fernandez, I., Reyes R., Olazabal I., Rodriguez E., Sanchez-Madrid F., Boussiotis V.A., Reche P.A., Cabanas C., and Lafuente E.M.. 2013. RIAM (Rap1-interacting adaptor molecule) regulates complement-dependent phagocytosis. Cell. Mol. Life Sci. 70:2395–2410. 10.1007/s00018-013-1268-6 [DOI] [PMC free article] [PubMed] [Google Scholar]
- Mombaerts, P., Iacomini J., Johnson R.S., Herrup K., Tonegawa S., and Papaioannou V.E.. 1992. RAG-1-deficient mice have no mature B and T lymphocytes. Cell. 68:869–877. 10.1016/0092-8674(92)90030-g [DOI] [PubMed] [Google Scholar]
- O’Toole, T.E., Katagiri Y., Faull R.J., Peter K., Tamura R., Quaranta V., Loftus J.C., Shattil S.J., and Ginsberg M.H.. 1994. Integrin cytoplasmic domains mediate inside-out signal transduction. J. Cell Biol. 124:1047–1059. 10.1083/jcb.124.6.1047 [DOI] [PMC free article] [PubMed] [Google Scholar]
- Petrich, B.G., Fogelstrand P., Partridge A.W., Yousefi N., Ablooglu A.J., Shattil S.J., and Ginsberg M.H.. 2007. The antithrombotic potential of selective blockade of talin-dependent integrin alpha IIb beta 3 (platelet GPIIb-IIIa) activation. J. Clin. Invest. 117:2250–2259. 10.1172/JCI31024 [DOI] [PMC free article] [PubMed] [Google Scholar]
- Rice, G.P.A., Hartung H.P., and Calabresi P.A.. 2005. Anti-alpha4 integrin therapy for multiple sclerosis: Mechanisms and rationale. Neurology. 64:1336–1342. 10.1212/01.WNL.0000158329.30470.D0 [DOI] [PubMed] [Google Scholar]
- Ridley, A.J., Schwartz M.A., Burridge K., Firtel R.A., Ginsberg M.H., Borisy G., Parsons J.T., and Horwitz A.R.. 2003. Cell migration: Integrating signals from front to back. Science. 302:1704–1709. 10.1126/science.1092053 [DOI] [PubMed] [Google Scholar]
- Rose, D.M., Cardarelli P.M., Cobb R.R., and Ginsberg M.H.. 2000. Soluble VCAM-1 binding to alpha4 integrins is cell type-specific, activation-dependent, and disrupted during apoptosis. Blood. 95:602–609. 10.1182/blood.v95.2.602 [DOI] [PubMed] [Google Scholar]
- Shattil, S.J., Hoxie J.A., Cunningham M., and Brass L.F.. 1985. Changes in the platelet membrane glycoprotein IIb-IIIa Complex during platelet activation. J. Biol. Chem. 260:11107–11114. 10.1016/s0021-9258(17)39154-8 [DOI] [PubMed] [Google Scholar]
- Stritt, S., Wolf K., Lorenz V., Vogtle T., Gupta S., Bosl M.R., and Nieswandt B.. 2015. Rap1-GTP-interacting adaptor molecule (RIAM) is dispensable for platelet integrin activation and function in mice. Blood. 125:219–222. 10.1182/blood-2014-08-597542 [DOI] [PMC free article] [PubMed] [Google Scholar]
- Su, W., Wynne J., Pinheiro E.M., Strazza M., Mor A., Montenont E., Berger J., Paul D.S., Bergmeier W., Gertler F.B., and Philips M.R.. 2015. Rap1 and its effector RIAM are required for lymphocyte trafficking. Blood. 126:2695–2703. 10.1182/blood-2015-05-644104 [DOI] [PMC free article] [PubMed] [Google Scholar]
- Sun, H., Kuk W., Rivera-Nieves J., Lopez-Ramirez M.A., Eckmann L., and Ginsberg M.H.. 2020. Beta7 integrin inhibition can increase intestinal inflammation by impairing homing of CD25hi FoxP3+ regulatory T cells. Cell Mol. Gastroenterol. Hepatol. 9:369–385. 10.1016/j.jcmgh.2019.10.012 [DOI] [PMC free article] [PubMed] [Google Scholar]
- Sun, H., Lagarrigue F., Wang H., Fan Z., Lopez-Ramirez M.A., Chang J.T., and Ginsberg M.H.. 2021. Distinct integrin activation pathways for effector and regulatory T cell trafficking and function. J. Exp. Med. 218:e20201524. 10.1084/jem.20201524 [DOI] [PMC free article] [PubMed] [Google Scholar]
- Sun, H., Liu J., Zheng Y., Pan Y., Zhang K., and Chen J.. 2014. Distinct chemokine signaling regulates integrin ligand specificity to dictate tissue-specific lymphocyte homing. Dev. Cell. 30:61–70. 10.1016/j.devcel.2014.05.002 [DOI] [PubMed] [Google Scholar]
- Tadokoro, S., Shattil S.J., Eto K., Tai V., Liddington R.C., de Pereda J.M., Ginsberg M.H., and Calderwood D.A.. 2003. Talin binding to integrin beta tails: A final common step in integrin activation. Science. 302:103–106. 10.1126/science.1086652 [DOI] [PubMed] [Google Scholar]
- Takagi, J., Petre B.M., Walz T., and Springer T.A.. 2002. Global conformational rearrangements in integrin extracellular domains in outside-in and inside-out signaling. Cell. 110:599–611. 10.1016/s0092-8674(02)00935-2 [DOI] [PubMed] [Google Scholar]
- Takahashi, M., Dillon T.J., Liu C., Kariya Y., Wang Z., and Stork P.J.. 2013. Protein kinase A-dependent phosphorylation of Rap1 regulates its membrane localization and cell migration. J. Biol. Chem. 288:27712–27723. 10.1074/jbc.M113.466904 [DOI] [PMC free article] [PubMed] [Google Scholar]
- Takahashi, M., Li Y., Dillon T.J., and Stork P.J.. 2017. Phosphorylation of Rap1 by cAMP-dependent protein kinase (PKA) creates a binding site for KSR to sustain ERK activation by cAMP. J. Biol. Chem. 292:1449–1461. 10.1074/jbc.M116.768986 [DOI] [PMC free article] [PubMed] [Google Scholar]
- Tkachenko, E., Sabouri-Ghomi M., Pertz O., Kim C., Gutierrez E., Machacek M., Groisman A., Danuser G., and Ginsberg M.H.. 2011. Protein kinase A governs a RhoA-RhoGDI protrusion-retraction pacemaker in migrating cells. Nat. Cell Biol. 13:660–667. 10.1038/ncb2231 [DOI] [PMC free article] [PubMed] [Google Scholar]
- von Andrian, U.H., and Engelhardt B.. 2003. Alpha4 integrins as therapeutic targets in autoimmune disease. N. Engl. J. Med. 348:68–72. 10.1056/NEJMe020157 [DOI] [PubMed] [Google Scholar]
- Wang, T.F., Lai N.S., Huang K.Y., Huang H.L., Lu M.C., Lin Y.S., Chen C.Y., Liu S.Q., Lin T.H., and Huang H.B.. 2012. Identification and characterization of the actin-binding motif of phostensin. Int. J. Mol. Sci. 13:15967–15982. 10.3390/ijms131215967 [DOI] [PMC free article] [PubMed] [Google Scholar]
- Wegener, K.L., Partridge A.W., Han J., Pickford A.R., Liddington R.C., Ginsberg M.H., and Campbell I.D.. 2007. Structural basis of integrin activation by talin. Cell. 128:171–182. 10.1016/j.cell.2006.10.048 [DOI] [PubMed] [Google Scholar]
- Xiong, J.P., Stehle T., Diefenbach B., Zhang R., Dunker R., Scott D.L., Joachimiak A., Goodman S.L., and Arnaout M.A.. 2001. Crystal structure of the extracellular segment of integrin alpha Vbeta3. Science. 294:339–345. 10.1126/science.1064535 [DOI] [PMC free article] [PubMed] [Google Scholar]
- Ye, F., Hu G., Taylor D., Ratnikov B., Bobkov A.A., McLean M.A., Sligar S.G., Taylor K.A., and Ginsberg M.H.. 2010. Recreation of the terminal events in physiological integrin activation. J. Cell Biol. 188:157–173. 10.1083/jcb.200908045 [DOI] [PMC free article] [PubMed] [Google Scholar]
- Zhang, Y., Kim T.H., and Niswander L.. 2012. Phactr4 regulates directional migration of enteric neural crest through PP1, integrin signaling, and cofilin activity. Genes Dev. 26:69–81. 10.1101/gad.179283.111 [DOI] [PMC free article] [PubMed] [Google Scholar]
Associated Data
This section collects any data citations, data availability statements, or supplementary materials included in this article.
Supplementary Materials
describes the proteomic analysis of the purified MIT complex.
lists the sequences of primers for real-time quantitative PCR analyses.
contains original blots for Fig. 1.
contains original blots for Fig. 2.
contains original blots for Fig. 3.
contains original blots for Fig. 5.
contains original blots for Fig. 6.
contains original blots for Fig. 7.
contains original blots for Fig. S1.
contains original blots for Fig. S2.
contains original blots for Fig. S3.
contains original blots for Fig. S4.


