Abstract
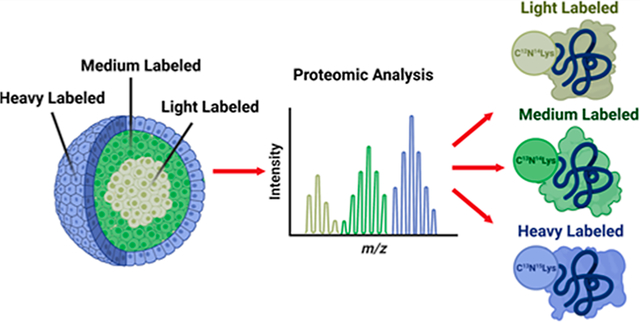
Three-dimensional cell cultures, or spheroids, are important model systems for cancer research because they recapitulate chemical and phenotypic aspects of in vivo tumors. Spheroids develop radially symmetric chemical gradients, resulting in distinct cellular populations. Stable isotopic labeling by amino acids in cell culture (SILAC) is a well-established approach to quantify protein expression and has previously been used in a pulse-chase format to evaluate temporal changes. In this article, we demonstrate that distinct isotopic signatures can be introduced into discrete spatial cellular populations, effectively tracking proteins to original locations in the spheroid, using a platform that we refer to as spatial SILAC. Spheroid populations were grown with light, medium, and heavy isotopic media, and the concentric shells of cells were harvested by serial trypsinization. Proteins were quantitatively analyzed by ultraperformance liquid chromatography–tandem mass spectrometry. The isotopic signatures correlated with the spatial location and the isotope position do not significantly impact the proteome of each individual layer. Spatial SILAC can be used to examine the proteomic changes in the different layers of the spheroid and to identify protein biomarkers throughout the structure. We show that SILAC labels can be discretely pulsed to discrete positions, without altering the spheroid’s proteome, promising future combined pharmacodynamic and pharmacokinetic studies.
Graphical Abstract
INTRODUCTION
There are roughly 150,000 new cases of colorectal cancer diagnosed each year in the United States, and it remains the third most common cancer worldwide.1,2 Effective model systems are needed to study the molecular changes that accompany the development and progression of colon and rectal tumors. Equally important, there is a need to evaluate potentially new therapeutics for these tumors. Evaluating both the pharmacokinetics and pharmacodynamics of a new treatment is an important consideration and requires appropriate measurements. In vivo tumors have a complex microenvironment, and researchers have spent decades developing different models to test the efficacy of novel treatments.3
Simplistic model systems, such as two-dimensional monolayer cell cultures, have historically been used to evaluate new drug compounds.4 Two-dimensional cell cultures have many advantages, namely, versatility, cost effectiveness, and compatibility with high-throughput assays.5–7 Although these systems are effective at gaining preliminary insights, they lack the complexity of the tumor microenvironment. As a compromise between cost, complexity, and simplicity, a three-dimensional cell culture, or spheroid, can be utilized.8,9 Spheroids share many of the advantages described for two-dimensional monolayers but are more accurate models of solid epithelial tumors.5–7,10 Their enhanced accuracy, compared to that of monolayers, arises from increased numbers of cell–cell contacts and the presence of radially symmetric chemical gradients. As a result, cells grown in three dimensions have fundamentally different cellular responses from those in two-dimensional cultures, including substantial differences in proteomic expression.11–17
Spheroids are unique three-dimensional cell culture models not only due to their distinct chemical microenvironments, which mimic in vivo tumors, but also due to their growth patterns.5,7,18 Spheroids grow in a radially symmetric fashion from a central aggregation of cells when seeded into a concave vessel in the presence of cell culture media. The concavity of the growing vessel forces contacts between the cells, and they adhere to one another, resulting in the spheroid structure. As the cells continue to divide, the spheroid will grow outward in a radially symmetric fashion, with older cells near the central core and newer cells dividing on the outer shells. As the spheroid grows in size, diffusion gradients develop, limiting the movement of oxygen, nutrients, and other chemicals into the center of the spheroid (Figure 1).5,19 Likewise, metabolic waste products and carbon dioxide accumulate in the center of the spheroid due to reduced diffusion, driving down the pH in the center of the spheroid to ~5, a difference of 2 pH units from the outer periphery in fully mature spheroids.7 The health of the cells changes in response to chemical microenvironments, and distinct cellular populations develop.7 In the center of the spheroid, where waste products accumulate and the pH is acidic, a central necrotic core is formed. The cells on the outside of the spheroid, where nutrients and oxygen are abundant and the pH remains at around 7, are proliferative and viable.7 The spatial region between the proliferative outer rim and the inner necrotic core experiences an intermediate chemical environment, and many of the cells become senescent, resulting in a middle quiescent layer. These three layers, the necrotic core, a quiescent middle layer, and a proliferating outer layer, are characteristic of the spheroids and make them a valuable system to model the different cellular populations present in a tumor. It is worth noting that while we, and others in the field, often describe the cellular layers as distinct and sharp, their phenotypic properties also show a gradient that correlates with a continuum of chemical changes. Therefore, while the three populations show distinct characteristics, the “lines” demarcating them can be a bit blurred, as the cellular gradients are a result of the chemical diffusion patterns. Understanding the chemical properties of the three cellular populations is critical in advancing therapeutic development; however, due to the nature of the diffusion patterns, this can be quite challenging and requires techniques to separate the spheroid layers.
Figure 1.
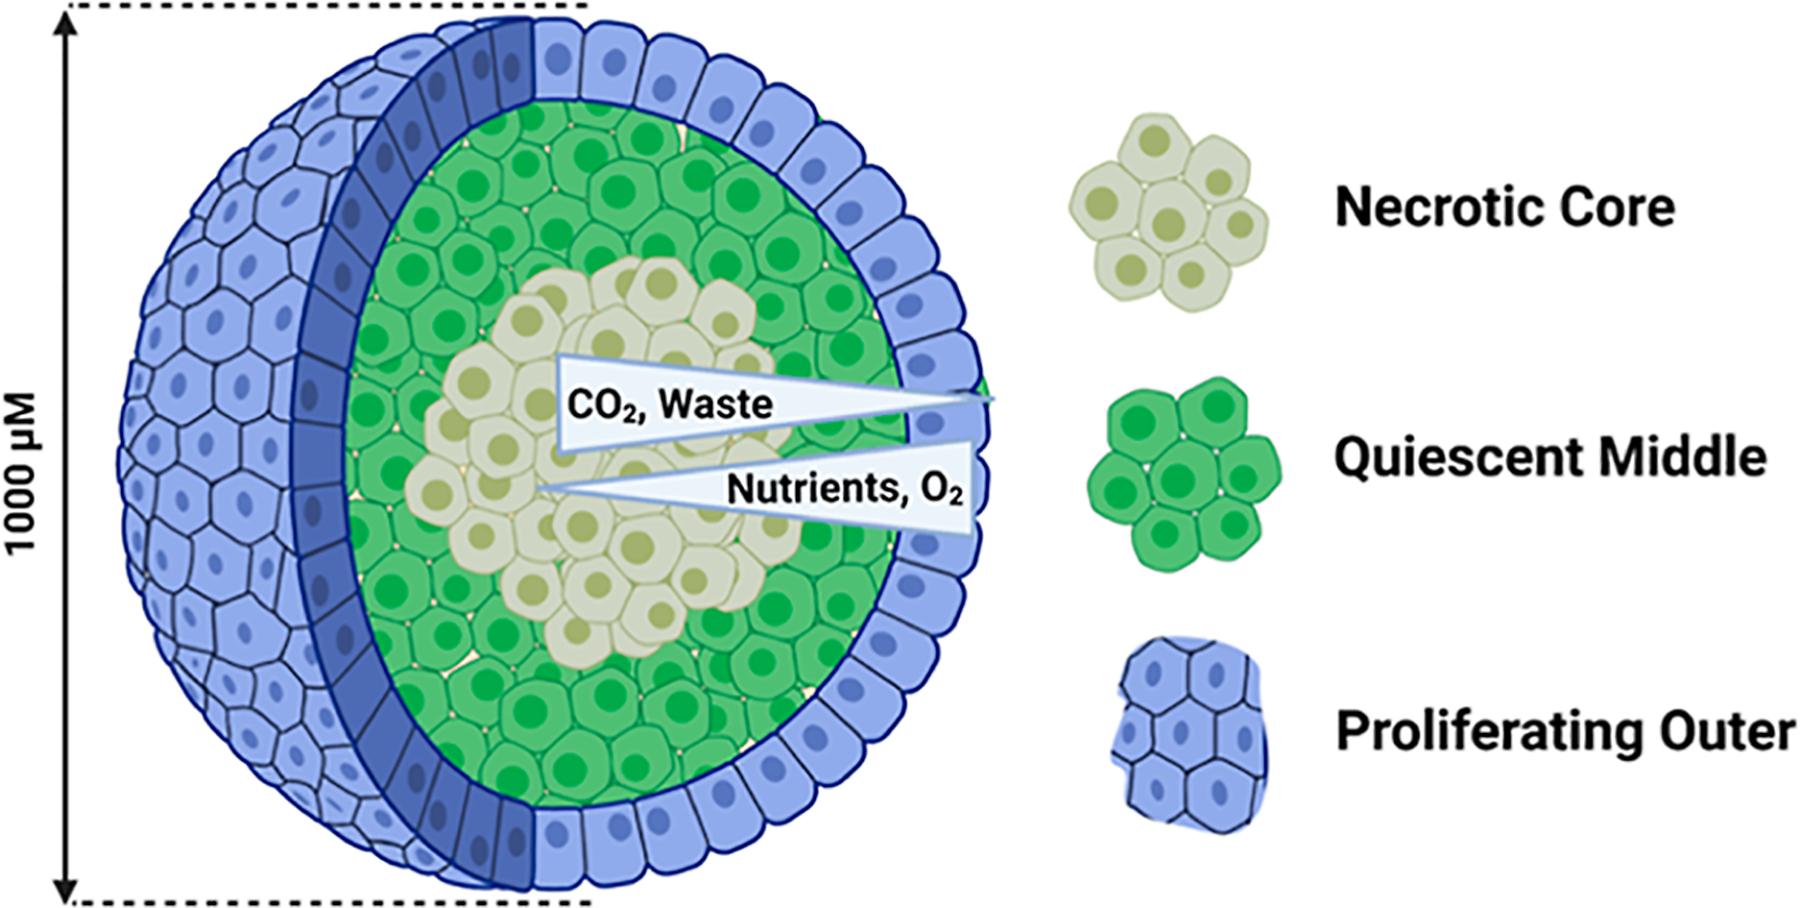
Schematic of a 12 day old spheroid (cells are not drawn to scale). Nutrients and oxygen are most abundant at the outside of the spheroid and decrease in the center. The pH changes from 7 to 5 in the center of the spheroid due to the accumulation of waste. Three populations of cells develop in response to the radially symmetric chemical gradients—the inner necrotic core, the middle quiescent layer, and the outer proliferating rim—although the boundaries between the cellular populations also represent a subtle gradient. The total spheroid diameter at 12 days of growth is ~1 mm and contains ~1 million cells.19
The different cellular populations in a spheroid can be isolated by a method called serial trypsinization. Serial trypsinization involves the sequential peeling of cell layers from spheroids through the use of dilute trypsin—a process analogous to “peeling an onion”.20 Spheroids are rotated or agitated in the presence of a dilute trypsin solution, causing dissociation of the outer-most cellular layers from the spheroid. Cell culture medium washes are interspersed with the trypsin incubations to limit the extent of dissociation and allow collection of the isolated cells. Importantly, this process occurs in a controlled manner, and we have verified that only the most peripheral layers of cells are removed with each trypsin incubation.21 By regulating the trypsin incubation time, the number of cells removed with each trypsin wash can be controlled.22 We have previously characterized both the proteomic changes and drug metabolism in discrete spheroid populations, using the serial trypsinization approach.23,24
Stable isotope labeling by amino acids in cell culture (SILAC) is a highly effective isotopic labeling technique developed by the Mathias Mann group in the early 2000’s.25 This technique introduces heavy isotope-labeled amino acids, typically lysine and arginine, to cell culture medium. Cells grown in this medium metabolically incorporate the labeled amino acids as the cells grow and divide. This type of metabolic labeling allows for multiple differentially labeled samples to be combined immediately at a 1:1 level after cell lysis, eliminating variability that is often introduced when performing parallel sample preparations all while allowing for quantification.25 Additionally, SILAC has been shown to have an extremely high labeling efficiency, which makes this approach a robust quantification technique.26
In the last few years, the idea of combining pulse-chase experiments with metabolic labeling has become a powerful tool in determining protein turnover.27–30 Pulse-chase SILAC, referred to as pSILAC, has shown great utility for temporal studies.31–33 In this article, we demonstrate the use of isotopic labeling for spatial studies, which we refer to as spatial SILAC. We hypothesized that isotopic labels could be incorporated into the proteins of the individual spheroid cellular layers by using timed cell culture medium pulses, because of the unique and highly reproducible growing pattern of the spheroids. Ultimately, these pulsed labels will create a spatial map of the spheroid’s proteome, tracing proteins back to their layer of origin. As the cell’s chemical microenvironment is determined by its location within a spheroid, and the addition of a chemical label is specific to the radial region of the spheroid, and we are ultimately able to correlate a particular chemical label to a particular layer within the spheroid. Therefore, any resulting proteomic changes associated with a particular label can be inferred as resulting from that corresponding distinct chemical microenvironment.
MATERIALS AND METHODS
Cell Culture and Tumor Spheroid Formation.
Two experiments were conducted: the first testing labeling specificity using duplex labeling in the spheroid and the second testing the effect of label position variance with triplex labeling. Both experiments followed similar sample preparation protocols. HCT 116 cells were purchased from ATCC (Manassas, VA), cultured in McCoy’s 5A cell culture medium (Life Technologies, Grand Island, NY), and supplemented with 10% fetal bovine serum (Thermo Scientific, Gaithersburg, MD) and 1% l-glutamine (Invitrogen, San Diego, CA) (Gibco).34 The cells were used within 2 months after resuscitation of frozen aliquots from −80 °C.
Cells were passed into SILAC McCoy’s 5A cell culture media supplemented with 10% dialyzed fetal bovine serum (Fisher Scientific, Pittsburgh, PA), 1% l-glutamine (Invitrogen, San Diego, CA) (Gibco), leucine, and one of three combinations of labeled lysine and arginine (Fisher Scientific, Pittsburgh, PA). Light-labeled cells were grown with 12C14N lysine and 12C14N arginine. Medium-labeled cells were grown in 13C14N-labeled lysine and 13C14N arginine. Heavy-labeled cells were grown in 13C15N lysine and 13C15N arginine. Cells were grown in an incubator at 37 °C with 5% CO2. Cells were split every 3 days. The cells were grown for 5 passages at a doubling time of 21 h, which surpasses the minimum five doublings required to ensure that the SILAC labels were fully incorporated.34
Upon complete label incorporation, spheroids were prepared in an agarose-coated 96-well plate. 7,000 cells per well were introduced to each well in 200 μL aliquots of media as previously described in Hummon Lab protocols.35–38 Spheroids were incubated at 37 °C with 5% CO2. Starting on day 2, 50% of cell culture media were changed every 48 h. At day 4 and 8, the cell culture media were changed to different SILAC-labeled media. After 12 days in the culture, tumor spheroids reached their maximum growth (~1 mm) and were harvested for serial trypsinization. For the first duplex experiment, 900 spheroids were prepared. For each population, 120 spheroids were used for serial trypsinization, and 60 were used for full lysis. The triplex experiment utilized a total of 600 spheroids, with 6 different combinations of labels grown.
Serial Trypsinization.
Serial trypsinization is a technique that utilizes dilute trypsin to dissociate the discrete layers of cells from the spheroids.39 For both experiments, spheroids were collected from the 96-well plates, and excess media and debris were removed through aspiration. Sets of 60 spheroids were placed in 3 cm cell culture dishes and rinsed twice with 2 mL of PBS. After washing the spheroids, all PBS was removed, and 1.5 mL of 0.05% trypsin/EDTA solution, which was maintained on ice, was added to each plate of spheroids and placed onto an orbital shaker set to 90 rpm for 3 min. The trypsin was then quenched with 1.5 mL of McCoy’s 5A cell culture medium containing FBS and allowed to rotate for an additional 3 min. The cell suspension was collected into a fresh conical tube, avoiding the remaining intact spheroids. After the cell suspension was removed, 1.5 mL of serum-free McCoy’s 5A was added to the plates to wash away any remaining serum, which would prevent further proteolysis. The suspension was collected and combined with the previously collected aliquot. This process was repeated two additional times with all the collected media combined, which constitute the outer layer of cells from the spheroid.
The middle quiescent cells were collected by repeating an additional 3 cycles of this process, as shown in (Figure 2). To dissociate cells from the necrotic core, the remaining spheroid portions were manually dissociated via pipetting. The cell suspensions for each layer were then centrifuged at 4000×g for 5 min. The remaining supernatant was aspirated, and the pellet was resuspended in 200 μL of high-performance liquid chromatography grade water and transferred to a micro-centrifuge tube. The aqueous suspension was centrifuged again for 5 min at 15000×g. This process was repeated twice to ensure that all excess cell culture medium components were removed. The cells were then stored at −80 °C until they were prepared for analysis by mass spectrometry.
Figure 2.
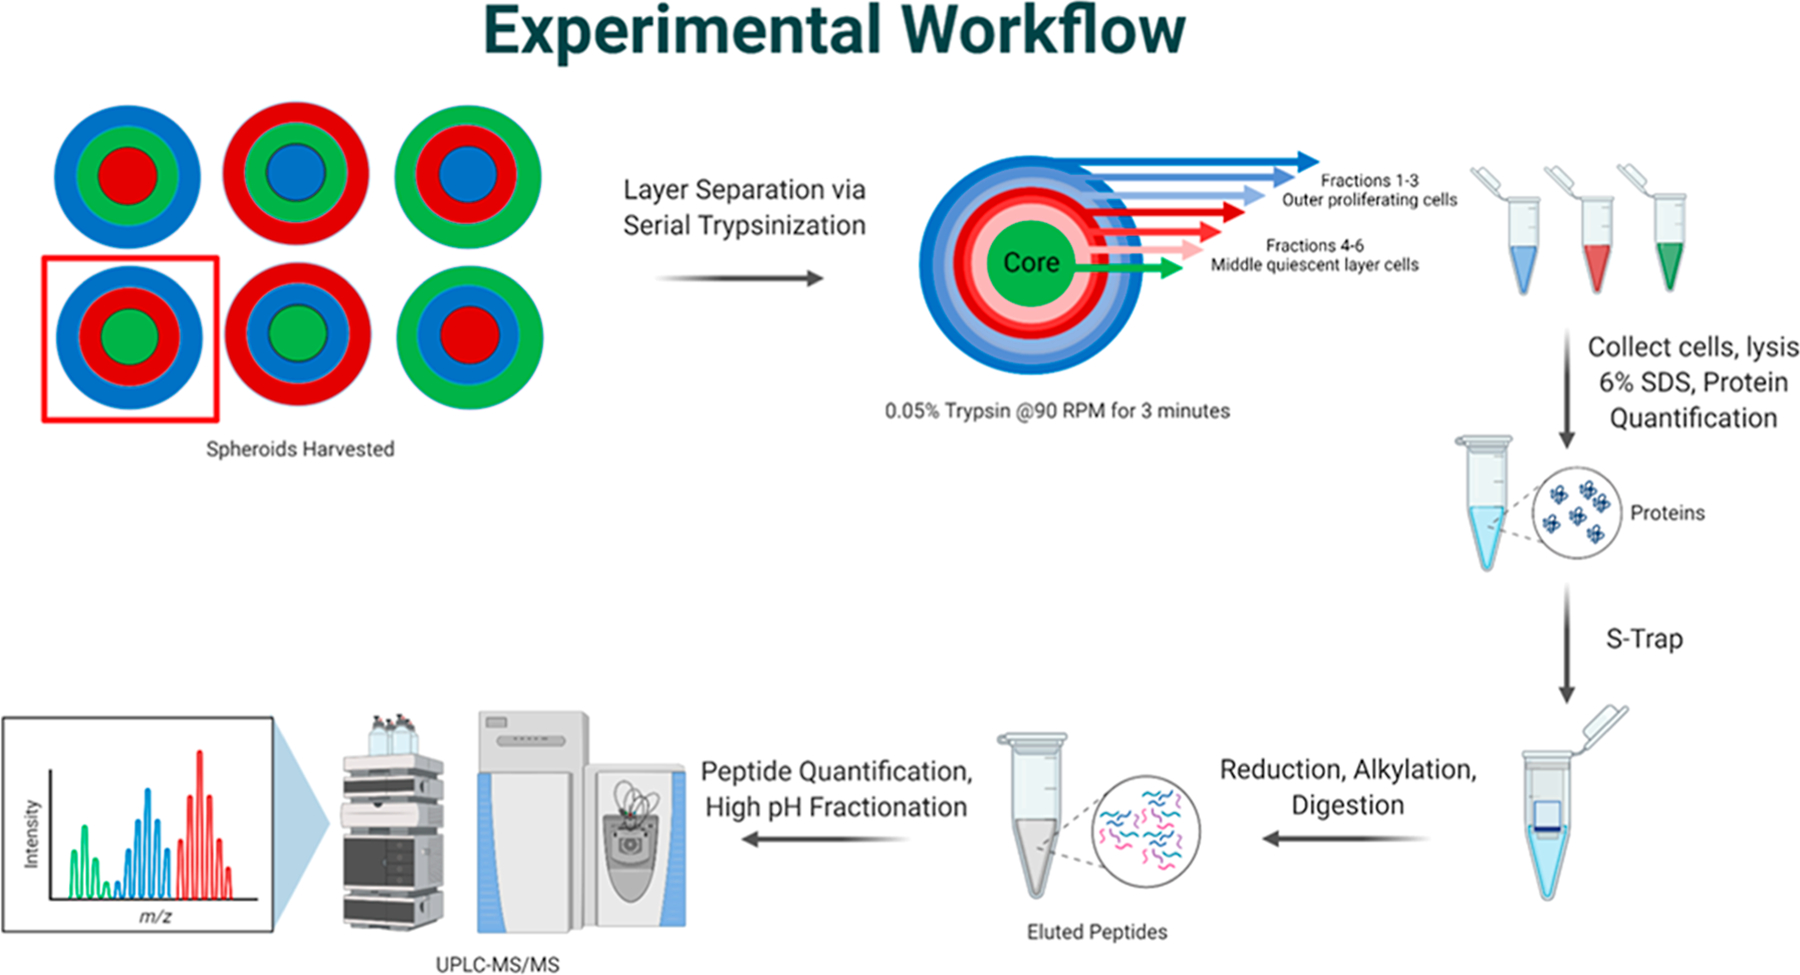
Experimental workflow. Spheroids were prepared with one of the three different pulsed isotopic cell culture media, and the red box specifies one spheroid population that is followed through the workflow. Each set of spheroids was subjected to serial trypsinization to harvest the three cellular populations. In this case, LC–MS/MS analysis of just the LHM spheroid is shown. Six rounds of serial trypsinization were performed and combined into three fractions, representing the three cellular populations. The cells were lysed in sodium dodecyl sulfate, and the proteins were quantified by BCA. Proteins were reduced, alkylated, and digested with the S-trap protocol, and the resulting peptides were analyzed by LC–MS/MS. The three distinct isotopic media are distinguishable in the MS mode.19
Cell Lysis and Protein Extraction.
Reagents for cell lysis buffer were purchased from Sigma-Aldrich (St. Louis, MO), and complete EDTA-free protease inhibitor cocktail tablets were purchased from Roche Diagnostics (Mannheim, Germany). After either serial trypsinization or full spheroid lysis, cells were lysed in an SDS cell lysis buffer containing 6% SDS in 50 mM Tris-HCl (pH 8), 1 mM sodium fluoride, 1 mM β-glycerophosphate, 1 mM sodium orthovanadate, and 1 tablet of the EDTA-free complete protease inhibitor cocktail. Cells were lysed using 250 μL of lysis buffer and sonicated on ice for 1 min at 15% amplitude 3 times. The proteins were clarified via centrifugation at 15000 rpm for 10 min and then quantified. Protein concentrations were determined by performing a bicinchoninic acid (BCA) protein assay (Thermo Scientific Pierce, Rockford, IL). Protein disulfide bonds were reduced with 5 mM dithiothreitol for 30 min at 90 °C followed by alkylation with iodoacetamide acquired from Sigma-Aldrich (St Louis, MO). After quenching the alkylation reaction, SDS was added to reach a final concentration of 5% prior to suspension-trapping.
Suspension Trapping (S-Trap) and Digestion.
Removal of SDS from the solubilized proteins was facilitated by suspension-trapping, which was performed using S-Traps from ProtiFi (Farmingdale, NY). Samples were prepared according to manufacturer’s protocol with slight modifications.40 In order to digest the proteins, trypsin (from bovine pancreas, Sigma-Aldrich, St. Louis, MO) was added to a 100 mM tetraethylammonium bromide (TEAB) solution, centrifuged through the S-Trap, and the flow-through trypsin was reloaded and allowed to digest overnight at 37 °C. The resulting peptides were eluted per the manufacturer’s instructions and vacuum-centrifuged to dryness.
High-pH Reverse-Phase Fractionation.
To reduce sample complexity, peptides from the triplex experiment were separated using high-pH reverse-phase fraction with an Oasis HLB 1cc 10 mg extraction cartridge (Waters). Prior to fractionation, peptides were resuspended in 5 mM TEAB, and a Pierce quantitative colorimetric peptide assay (Thermo Scientific) was performed in order to quantitate peptides and pool samples for normalization. The peptide resuspension was adjusted to 20 mM TEAB at pH 9. The column was conditioned with acetonitrile (ACN) and equilibrated with 10 mM TEAB (pH 9). The samples were applied to the column, washed with 10 mM TEAB (pH 9), and eluted. The peptides were eluted into three fractions: 8, 15, and 50% ACN in 10 mM TEAB (pH 9). The fractions were then vacuum-centrifuged to dryness.
Chromatography and Mass Spectrometry Specifications.
All peptides were resuspended in 0.1% formic acid in water. For the duplex analysis, peptides were resuspended at a concentration of 500 ng/μL. For the fractionated triplex samples, peptides were resuspended at a concentration of 50 ng/μL. Samples were injected via a Waters NanoAcquity liquid chromatography system coupled to a Q-Exactive HF mass spectrometer (Thermo). A C18 NanoEase m/z Peptide UPLC BEH column (1.7 μm particle size, 75 μm × 200 mm, Waters) was used and maintained at a temperature of 50 °C. The autosampler was set to inject 4 μL of each sample at a flow rate of 400 nL/min. The samples were separated using a 185 min gradient utilizing solvent A (0.1% formic acid in water) and solvent B (0.1% formic acid in ACN), as depicted in Supporting Information Table S1.
Mass spectrometry analysis was performed on a Q-Exactive HF mass spectrometer operating in a positive data-dependent acquisition mode. Ions were formed via nano-electrospray ionization. Full MS scans were acquired with a resolution of 60,000 with the AGC target set to 3 × 10⁶ and max IT 30 ms. The scan range was set at 375–1,575 m/z. Subsequent dd-MS2 resolution was set at 15,000 with AGC target 2 × 10⁵ and max IT 19 ms. The top 20 ions from precursor scanning were selected for fragmentation. The isolation window was set to 2.0 m/z, and the dynamic exclusion was set at 20 s.
Data Analysis.
Raw data files were searched against the Uniprot Human database using the Andromeda search engine within MaxQuant version 1.6.2.10 and uploaded to the PRIDE server (https://www.ebi.ac.uk/pride/). The search settings were specified for mass analysis via an orbitrap, with a first search peptide tolerance of 20 ppm and a main search peptide tolerance of 4.5 ppm. The specified digestion enzyme was set to trypsin with a maximum of two missed cleavages. The variable modification set included methionine oxidation, asparagine, and glutamine deamidation and acetylation of the protein N-terminus. The only fixed modification was cysteine carbamidomethylation. SILAC labels were specified for quantitation, and matching between runs was allowed. The PSM and protein false discovery rates were set at 0.01, and a minimum of two unique peptides were required to discriminate sequences with shared peptides.
The resulting data were then filtered and analyzed using Perseus software. The two separate experiments were analyzed separately with slight variations. The duplex labeling efficiency was determined by examination of the “all peptides” file output from MaxQuant. The MSMS label states were identified as either heavy, light, or both. The resulting peptides were counted, and labeling efficiencies were determined by the number of peptides identified by the specified label divided by all identified peptides. These results were also compared to the corresponding mass intensities. To verify these values at the protein level, the hierarchical clustering by Pearson’s correlation and principal component analysis (PCA) was performed on filtered, normalized protein ratios. Protein ratios were filtered in Perseus against proteins only identified by the site, matches to reverse sequences, potential contaminants, and finally based on valid values where evidence counts were only kept if they had a minimum of 70% data occurrence. The resulting 531 proteins were then normalized using classical SILAC ratios from the pulsed labels. The resulting ratios were then used for the hierarchical clustering by Pearson’s correlation and PCA.
After completing the analysis of the duplex spheroids, the triplex-labeled spheroids were examined. To facilitate the analysis of the second experiment, the “protein group” file was uploaded, and the normalized ratios for all three layers of the six spheroid populations (excluding the outer layer of MLH due to sample limitations) were used to generate a matrix. The matrix was filtered against proteins only identified by the site, matches to reverse sequences, potential contaminants, and finally based on valid values where evidence counts were only kept if they had a minimum of 70% data occurrence. The resulting 406 proteins were annotated and normalized by Z-scoring prior to undergoing PCA. The hierarchical clustering was performed using the Pearson Correlation clustering.
RESULTS AND DISCUSSION
In this study, we utilized both a duplex and triplex SILAC quantitative proteomic approach to label specific spatial regions of the spheroid proteome, using a platform we call spatial SILAC. This method allows for the rapid identification of where a protein originated from within the spheroid through a mass spectrometric analysis. Both experiments shed unique light on the spatial SILAC platform, highlighting both its successes and potential pitfalls.
To validate whether spatial SILAC is a robust method for the three-dimensional cell culture, two different experiments were completed to both test labeling specificity and to examine the effects of varying labels in different positions. These spheroids are referred to as a duplex (labeled with two SILAC labels: heavy and light) or triplex (labeled with three SILAC labels: heavy, medium, and light).
In the duplex spheroids (Figure 3a), the position of the heavy label was shifted among the three possible positions (core, middle, or outer rim) with the other two positions labeled with the light control media. Additional spheroids were also grown solely in either light or heavy media as controls. This duplex labeling experiment was designed to examine label specificity. In the triplex experiment (Figure 3b), spheroids were grown with three different isotopic media (referred to as light, medium, and heavy) with each medium pulsed into each position. There are six permutations, which are described in Figure 3b. All spheroids were grown for 12 days, with the distinct isotopic media introduced as 3 four-day pulses (media changed on days 0, 4, and 8) with harvesting on day 12 (Figure 3b). Roughly, the first isotopic cell culture medium labels the central necrotic core of the spheroid, the second pulse labels the middle quiescent region of cells, and the last pulse of media labels the outer proliferative rim. To ease the referral of the labeling order, we have developed a naming convention using the capital letter of each medium (H, M, or L) in the following order: the core, middle, and outer rim. Therefore, a spheroid labeled HML would contain a core labeled with the heavy isotopic media, medium isotopic media in the middle quiescent ring, and light isotopic media in the outer proliferative zone.
Figure 3.
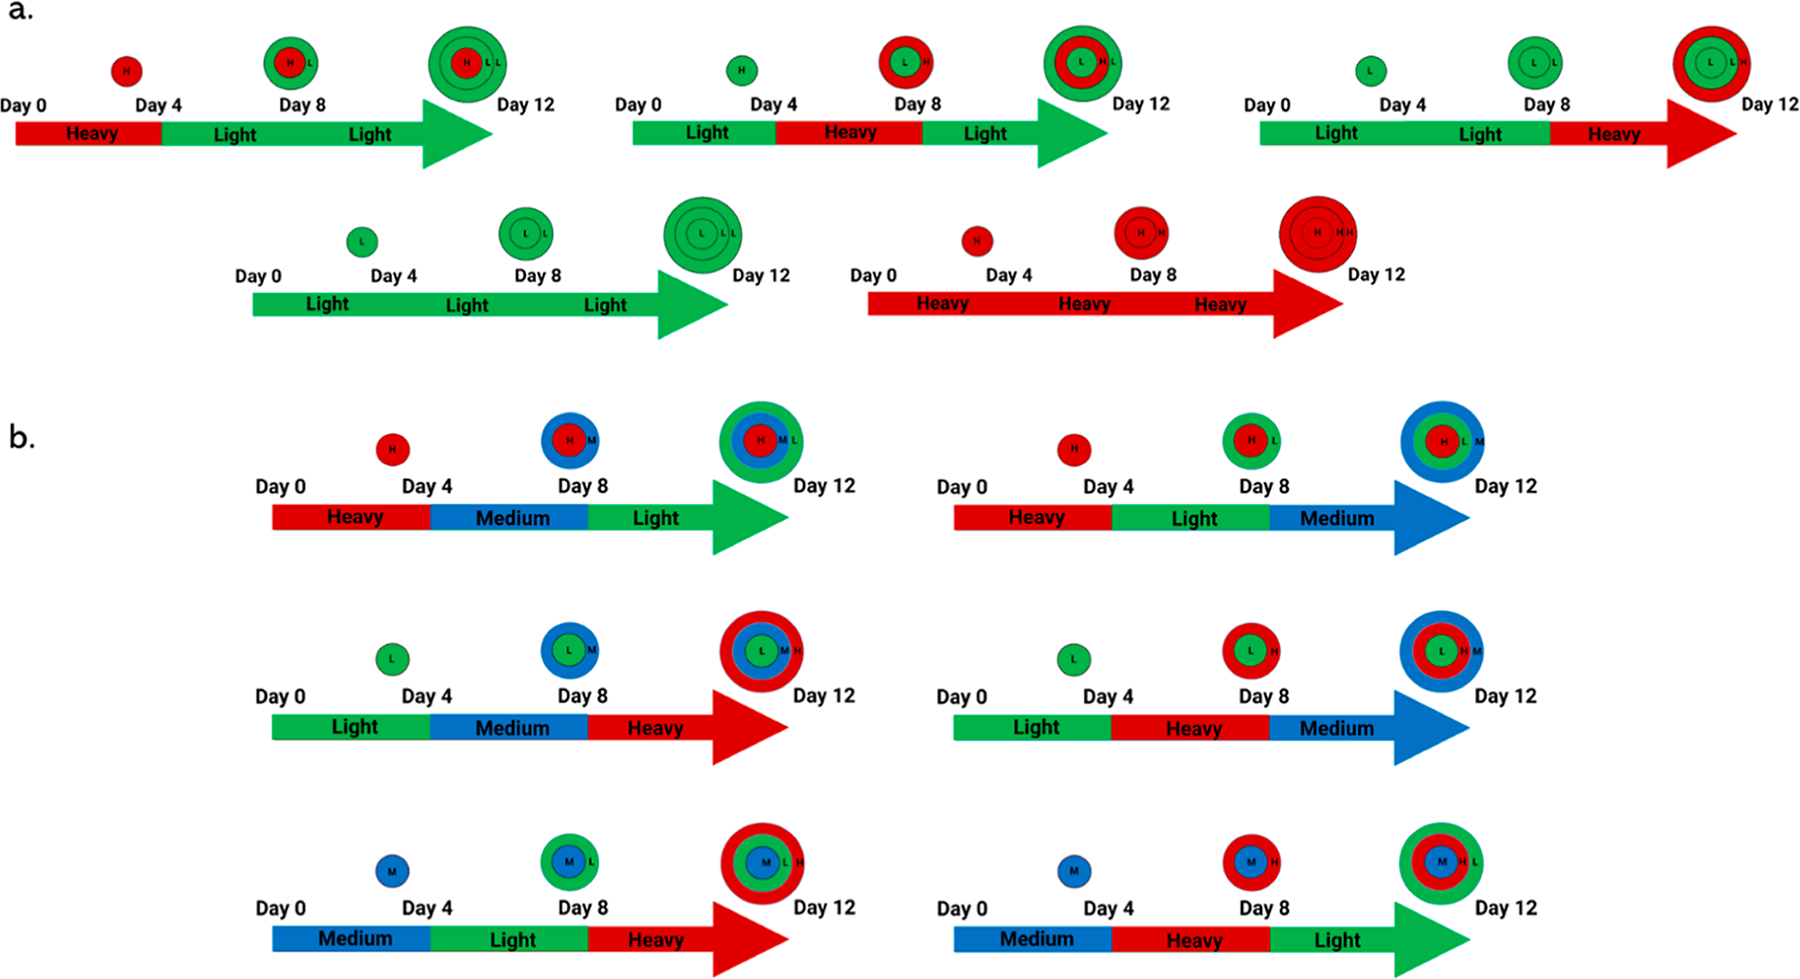
Growing order for pSILAC spheroids demonstrating the radial locations of the isotopic labels. Spheroids are grown for 12 days. The top (a) figure represents the spheroids used for duplex label specificity. Spheroids with a single heavy layer were prepared (top row) and control spheroids that were only grown in either light or heavy media. Light media (L) are green and heavy media (H) are red. The bottom (b) shows the triplex spheroids used to examine varying permutations. Each spheroid is grown with variations of three isotopic media, light (green), medium (blue), and heavy (red) for 4 days. The arrows represent growth time, and the colors indicate the presence of the isotopic labels. The labeling convention is core middle outer with respect to isotopic labels.19
For both experiments, isotopic labels were sequentially introduced in different orders to facilitate a distinct labeling system, encompassing all possible permutations. These spheroids underwent serial trypsinization to isolate the individual multicellular layers. These separate layers were then lysed and prepared individually for bottom-up proteomic analysis. The resulting protein identifications were used to compare the proteomes of similar spheroid regions containing differing isotopic labels. In this study, we aimed to determine whether the isotopic labels would migrate from their selective locations and whether the SILAC labels remained consistent enough in their radial locations for further proteomic studies involving perturbations of the model system.
Analysis of Label Specificity with Duplex Labels.
In developing the spatial SILAC approach, the first step was to verify label specificity within the spheroids and to assess whether isotopic labels would effectively label the cellular subpopulations. In our initial study, heavy- (13C15N lysine and 13C15N arginine) or light- (12C14N lysine and 12C14N arginine) labeled cells were seeded into spheroids to form the necrotic core. The spheroids were allowed to grow in isotopic cell culture media for 4 days. On day 4, a complete medium change was performed and either light or heavy media were added. The spheroids were grown for an additional 8 days with half culture medium changes occurring every 48 h, followed by an additional labeled medium swap on day 8 to form one of the five control permutations, as shown in Figure 4. Upon maturation on day 12, the spheroids were harvested. Spheroids were either serially trypsinized or lysed whole, and then, the resulting cells were washed, lysed, and prepared for mass spectrometry analysis.
Figure 4.
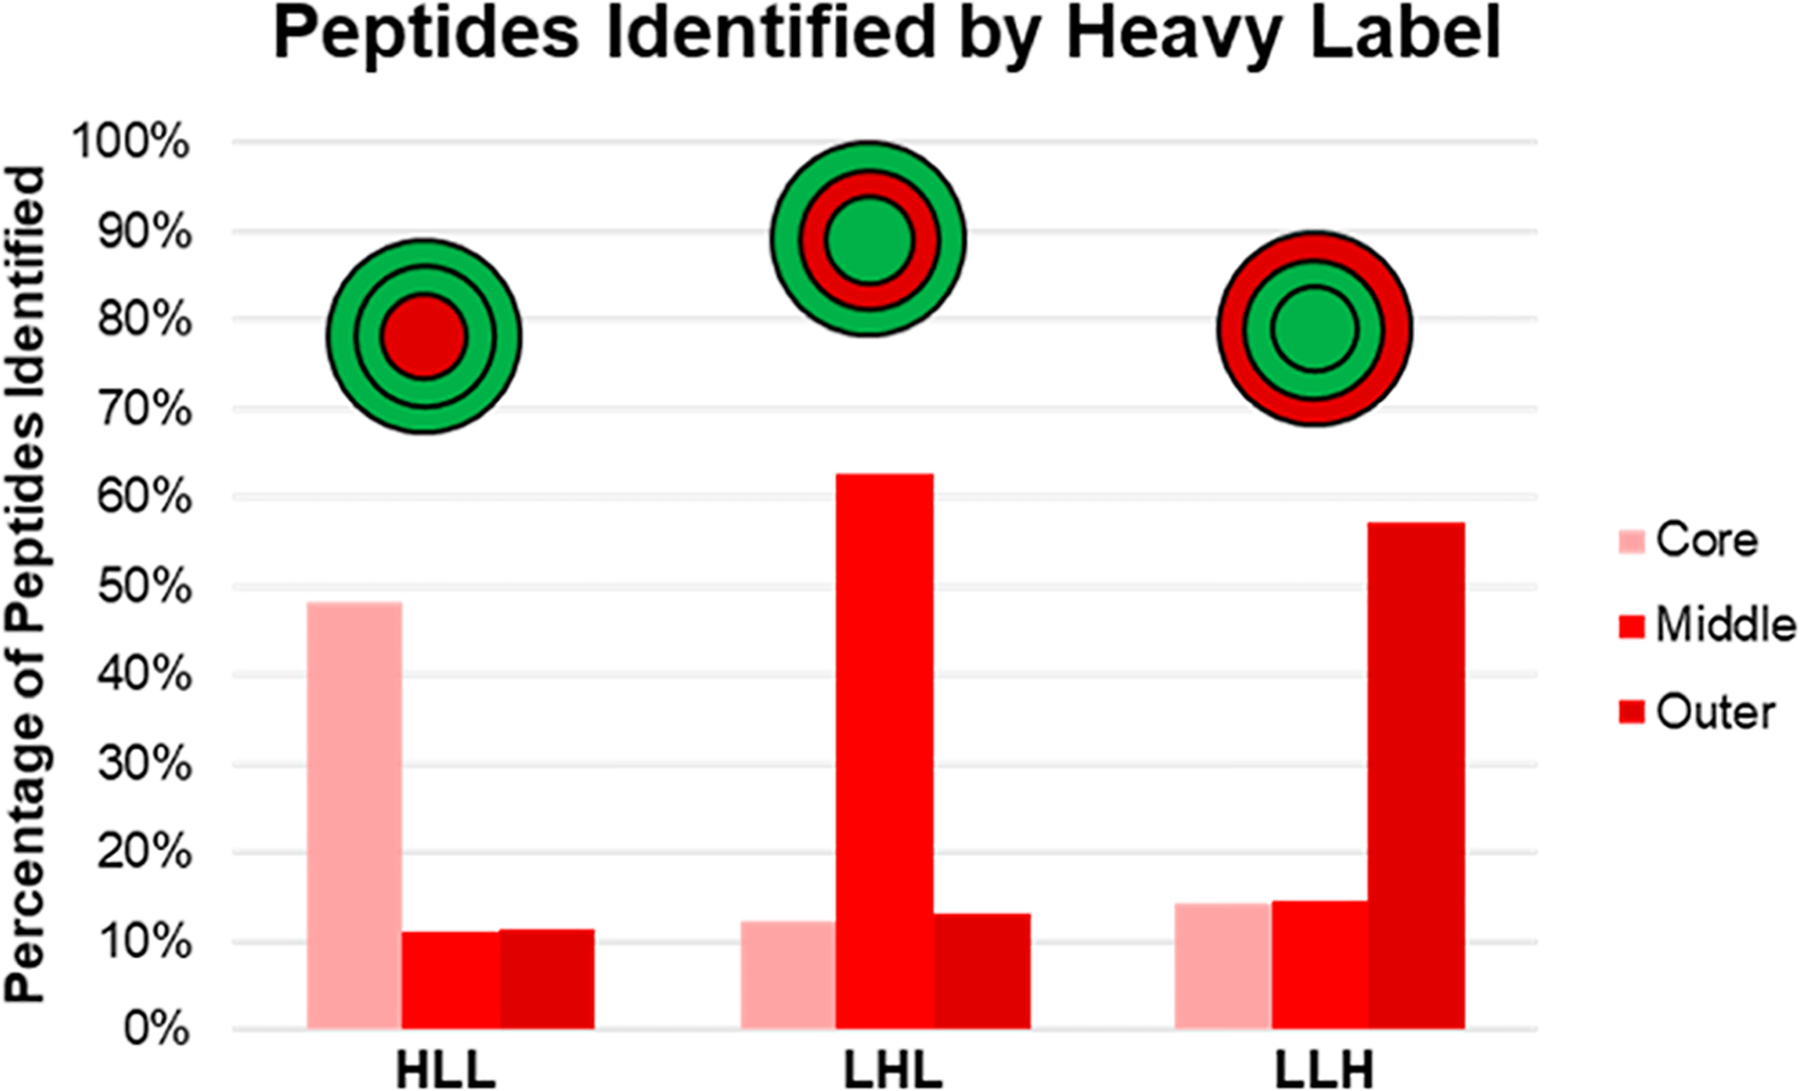
SILAC label incorporation percentages were calculated by counting the number of peptides identified by each label type. The red bars show the percentage of peptides identified by the heavy isotopic label in each layer of the spheroids. The red and green circle diagrams represent the spheroid population being examined, with green referring to light-label presence and red indicating heavy labeling.
Upon mass spectrometry analysis, we first determined the labeling efficiencies for both the monolayer cells used for seeding the cores and for each individual spheroid layer from the five populations. Using the total peptide intensity for each label, it was determined that the heavy-labeling efficiency for the initial HCT116 cells grown in the monolayer was 94.47%, and the light-labeling efficiency was 97.70% (Figure S1). These spheroids were grown for six doublings to allow for complete label incorporation, and this high percentage confirms that the monolayer cells were indeed fully labeled prior to being seeded for spheroids. We then determined labeling efficiencies for each individual spheroid layer by comparing the MSMS label states, which are directly related to the label partner detected for each peptide, the results of which are shown in (Figure 4). The total peptide counts shown in shades of red indicate a clear trend in the label location. The sum of the peptides identified by a heavy SILAC label is upregulated in the layers which they were pulsed into and are not significantly “bleeding out” into the neighboring layers. Additionally, the overlapping percentages were examined to determine the origin of the peptides identified as heavy in the neighboring layers. It was determined that approximately 25% of those heavy-labeled peptides actually originated in the layer that was pulsed with the heavy-labeled cell culture medium (Figure S2). These data demonstrate that we can preferentially and discretely label each individual spheroid layer, allowing for proteins associated with a particular label to be traced back to their spatial origins with an associated probability.
After establishing the label incorporations for the duplex spheroids, the next step was to evaluate the protein abundances in each position. The initially identified 4,060 proteins were filtered and normalized in Perseus. From the given SILAC ratios for each protein group identified, classical SILAC ratios were generated based on turnover from the light control. This normalization was completed to control for any possible layer mixing caused during serial trypsinization. The normalized and filtered ratios were then used for the hierarchical clustering by Pearson’s correlation and PCA (Figure 5). In the hierarchical clustering, the samples cluster according to the protein groups that correspond to their original position in the spheroid without reference to the label. Put another way, the identity of the label does not have a significant effect on the resulting protein abundances. For example, the protein abundances are extremely similar in the LHL, LLH, and HLL spheroids on the far-left side of the heat map, representing the protein abundance in the outer core, regardless of the isotopic label used. These data indicate that once the label state of a protein is determined, it can then be traced back to its spheroid origin. The results of the PCA also confirm this finding as the samples neatly cluster according to the position in the spheroid in which they originated. The clustering of these samples is particularly notable as this unsupervised analysis is only considering the data’s covariance matrix. The 95% confidence region is indicated by the shaded regions around the data points and shows a significantly discrete clustering without overlap. These results show that it is possible to selectively label the different cellular populations within the tumor spheroid by introducing the different cell culture medium conditions throughout the growth period. Importantly, it shows that there was minimal migration of labels after medium switches as most of the heavy label overwhelmingly stayed in the core, middle, or outer layer when pulsed in at the corresponding time point and that the presence of the different labels does not significantly affect protein abundance.
Figure 5.
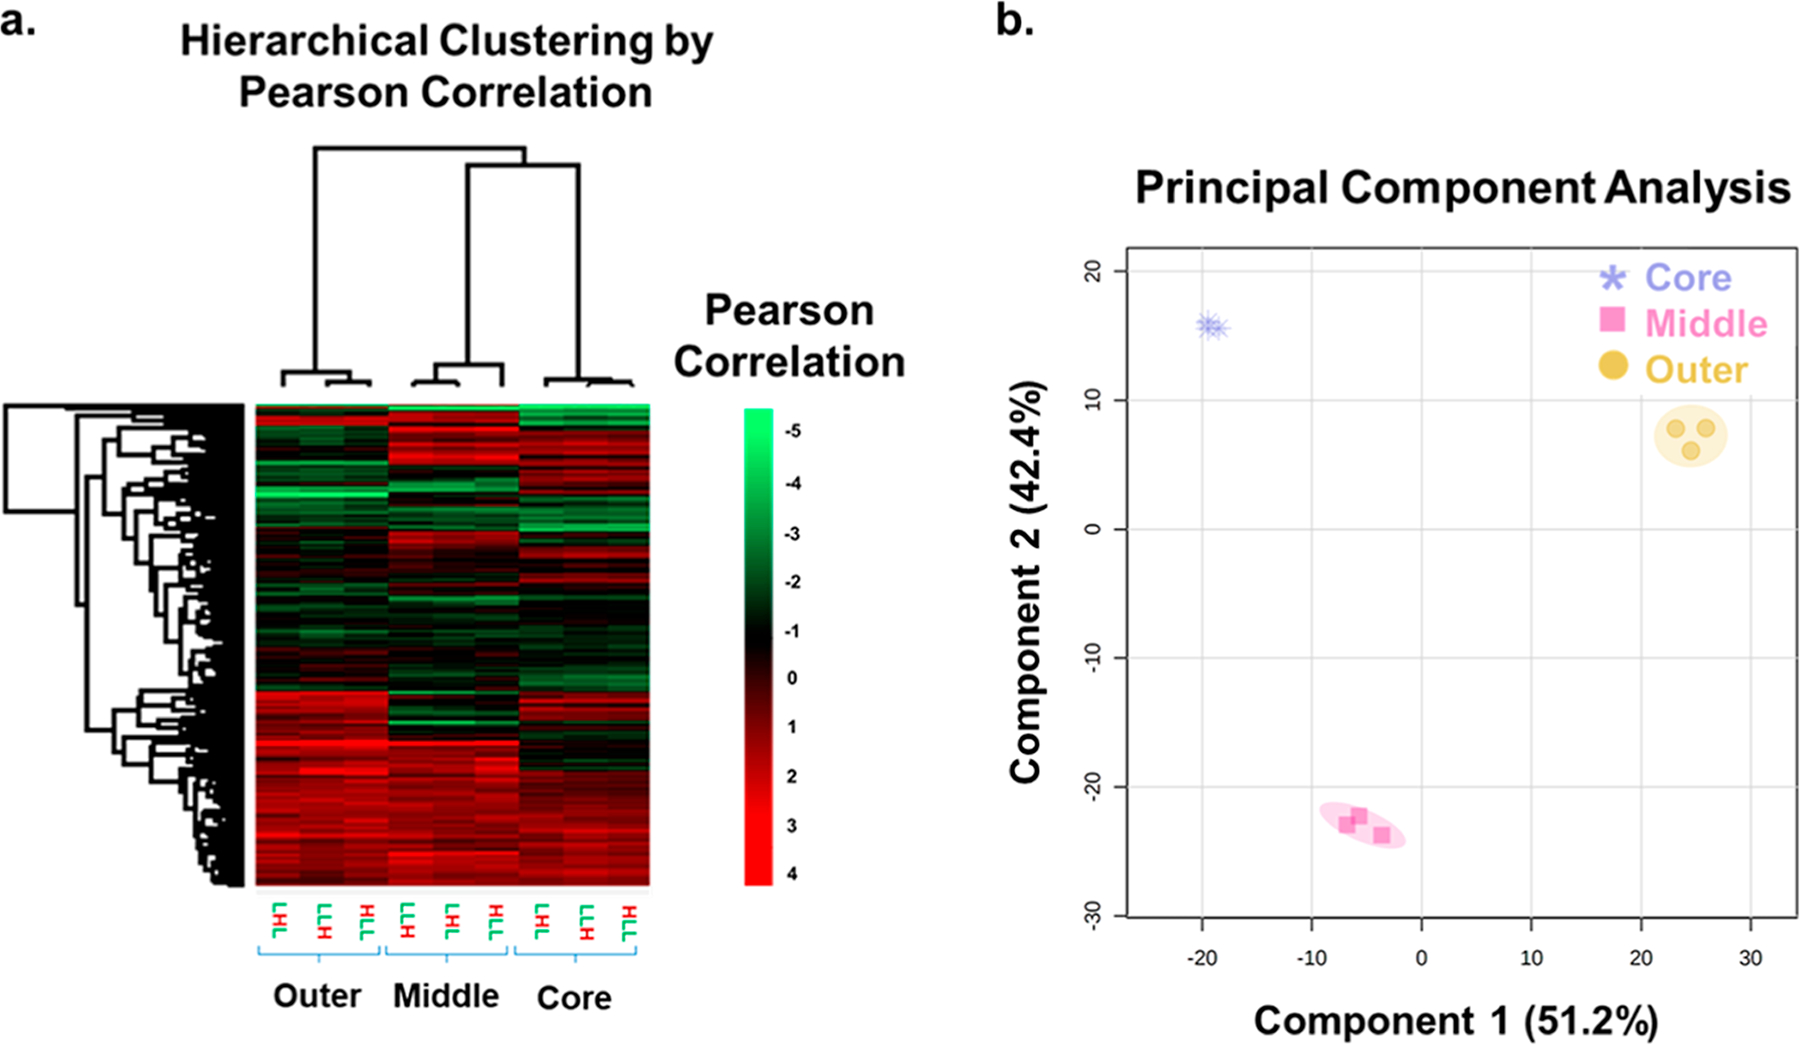
Hierarchical clustering by Pearson correlation and PCA suggests layer specific separation for the proteins identified by layer. In the hierarchical clustering (a), more abundant proteins are shown in red, with less abundant proteins shown in bright green. PCA (b) of each labeled layer of the spheroid populations. The layers are represented by the shape of the data points and color (purple = core, pink = middle, and yellow = outer). The shading around the data points is representative of the 95% confidence regions. Spatial origin (core, middle, or outer) is the primary determinant of the clustering.
Spatial SILAC Triplex Spheroids.
The triplex spheroids were prepared using heavy (13C15N lysine and 13C15N arginine), medium (13C14N lysine and 13C14N arginine), and light (12C14N lysine and 12C14N arginine) cell culture media. The media were introduced and exchanged in 4 day pulse-chase increments during the 12 day growth period of the tumor spheroids. Spheroids were grown in six different permutations. After harvesting the cells from the different radial layers by serial trypsinization, the individual layer protein abundances were analyzed by UPLC-MS/MS. Prior to filtering, a total number of 3,051 proteins were identified. Using the total proteins identified, these results were strictly filtered and normalized. SILAC is a relative quantification strategy, so all final values represent ratios between two labels. In this study, each position was normalized to the label present in the necrotic core, and the core labels were compared to the label present in the quiescent layer. This normalization allowed for the comparison of different isotopic labels among each of the three spheroid layers.
Once the ratios were calculated for the identified proteins, we investigated whether labeling bias was present in the data set. In simpler terms, we examined whether the specific location of an isotopic label affected the relative quantification value observed. To address this question, quantification ratios for each of the 406 protein groups identified were calculated in every sample and then compared against all other quantification ratios to determine if a positive correlation was present (Figure 6). In every case tested, the data show that regardless of the comparison, there was a strong positive correlation between the ratios, indicating that the labels do not show significant bias in any location and can be used interchangeably (Figure S3). Please note that there is some natural spread in the correlation, which is due to the biological variation of the proteins in the distinct layers of the spheroid.
Figure 6.
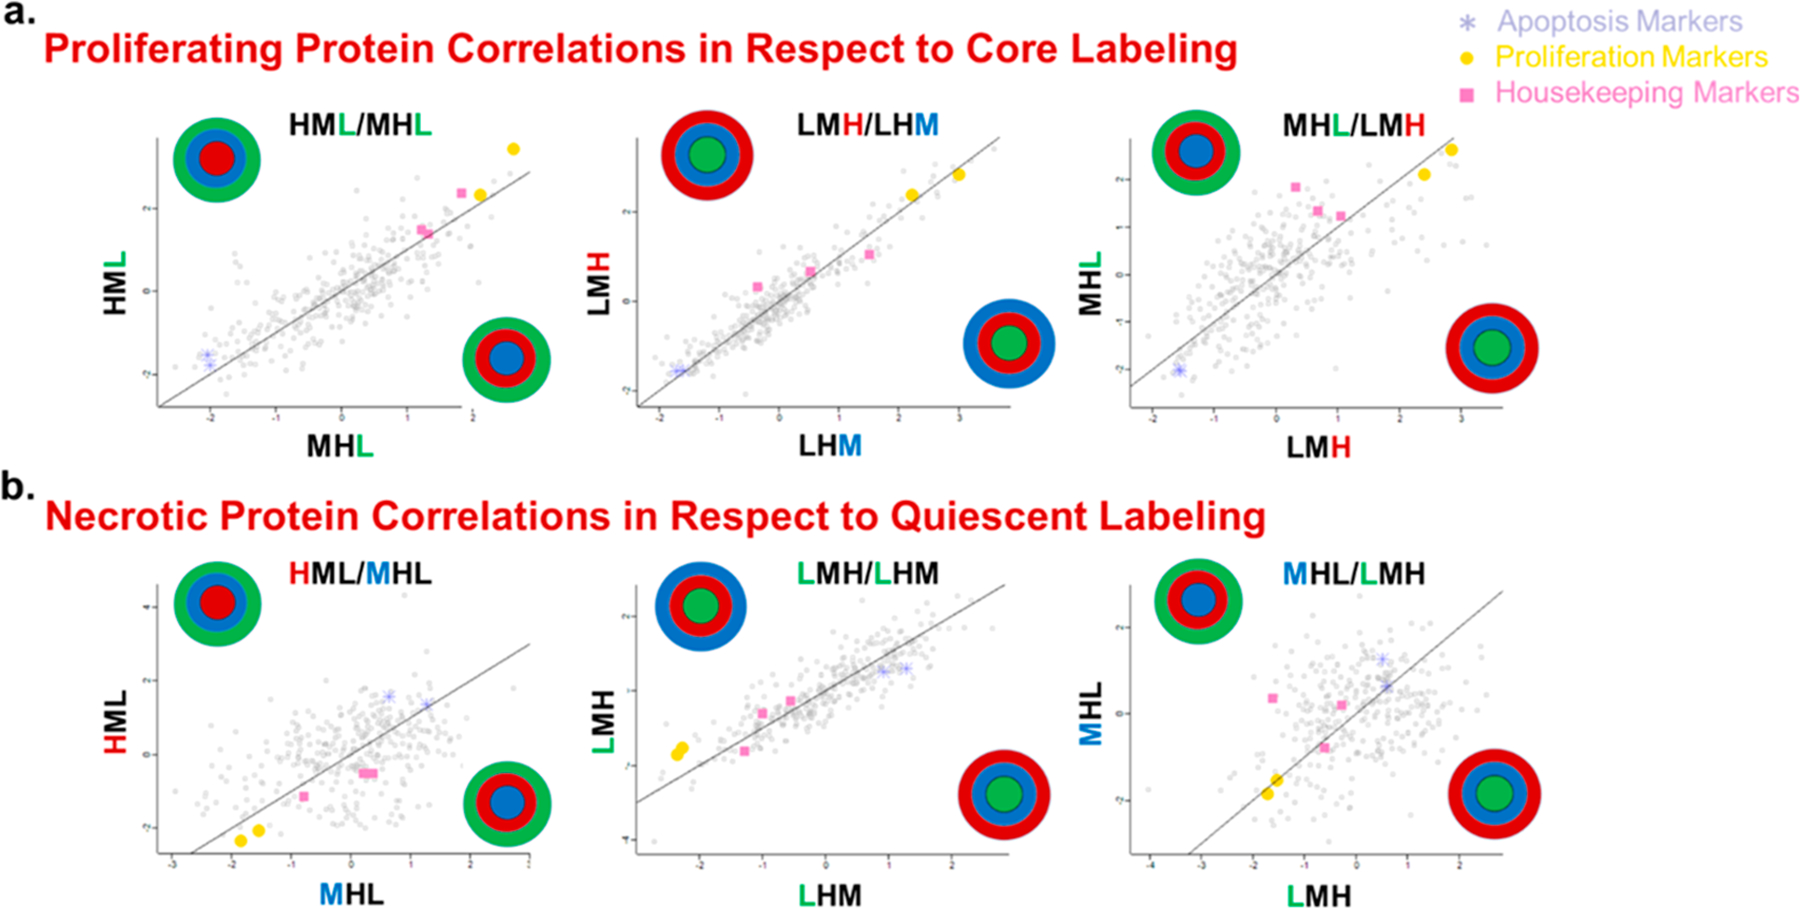
Comparison of the 406 protein quantification ratios that were present in every layer to examine labeling bias in the different spheroid layers. Each data point represents the ratio of two ratios (one on the X axis and one on the Y axis) for the SILAC ratio corresponding to each protein group. The labeled spheroids are shown on the X and Y axes, and the colored letter is the label being compared. Three comparisons are shown here for the outer layer (a), and three are shown for the core (b), while the rest can be seen in Supporting Information Figure S2. In all the comparisons, a positive correlation is present, indicating that the position of the label does not significantly affect the quantification. Positive protein correlations with respect to core labeling suggest that this technique is not biasing the observable proteome of each layer. Significant apoptosis, proliferation, and housekeeping markers are also identified to confirm that these trends are biologically relevant. (a) Proliferating protein correlations with respect to the core labeling. (b) Necrotic core correlations with respect to quiescent labeling.
To further validate that the underlying biology remains unaffected, a few proteins were selected to evaluate consistency in the abundance ratios. First, three proteins associated with housekeeping genes were selected: tyrosine 3-monooxygenase/tryptophan5-monooxygenase activation protein zeta polypep-tide, phosphoglycerate kinase 1, and peptidylprolyl isomerase A.41 The proteins associated with these genes were selected to establish a baseline, because we expected these proteins to be consistent in every sample. Next, proteins were selected for their roles in either cellular proliferation or apoptosis. Two proteins were selected to represent proliferation: fructose-bisphosphate aldolase A and alpha-enolase (ENOA).42,43 Both of these proteins have been noted as being upregulated in cancer and are known to support cell growth, making them ideal targets to track proliferation in our spheroid layers.42,43 Two proteins were also chosen as apoptosis markers: prohibitin-1 (PHB1) and prohibitin-2 (PHB2).44,45 The prohibitin family of proteins has been widely implicated in cancer cell survival and apoptosis. Both PHB1 and PHB2 have been specifically associated with apoptosis, and prohibitin-1, when knocked down, has been shown to decrease apoptosis in CRC cells.44,46 These two targets were evaluated specifically in the necrotic population of cells.
In Figure 6, three categories of protein groups are identified as being housekeeping, proliferative, or apoptosis markers. In Figure 6a, where proliferating protein correlations with respect to the core labeling are shown, a clear trend is present; the proliferative markers show a clear more abundant positive correlation, the housekeeping proteins are in the middle, while the apoptosis markers display a less abundant correlation. These relative ratios indicate that the proliferation markers are more abundant in the labeled proliferative layer, which supports the idea that we are discretely labeling a particular layer of the spheroids. In Figure 6b, where the necrotic protein correlations are shown with respect to quiescent labeling, an exciting reverse trend is evident. These proteins show the opposite trend when the core is considered, meaning that apoptosis markers are up-regulated in the necrotic core, and the proliferation markers are down-regulated there. In these graphs, the ratios for the apoptosis proteins display strong positive correlations, while the proliferation proteins are down-regulated, as would be expected in the central, acidic core of the spheroids. This confirmation of the underlying biology is extremely promising with respect to future pharmacodynamic and pharmacokinetic studies.
Comparing the Proteome in Different Cellular Layers.
We next examined spatially related changes that occurred in the spheroid proteome. As mentioned above, the spheroid model system is well-known for having distinct cellular layers that reflect their radially symmetric chemical gradients.5,7 It is also well-established that the proteome changes in response to these distinct chemical microenvironments, and we next aimed to determine if those same patterns were evident in our triplex spatial SILAC data set.20,47 A PCA was performed on the filtered SILAC ratios associated with protein groups and is shown in Figure 7b. Each data point represents a reduced covariance matrix stemming from the original SILAC ratio for each protein identified within each individual sample. As stated previously, this analysis is unsupervised and thus does not consider the origin of the samples. Again, the shaded regions around the data points indicate the 95% confidence region.
Figure 7.
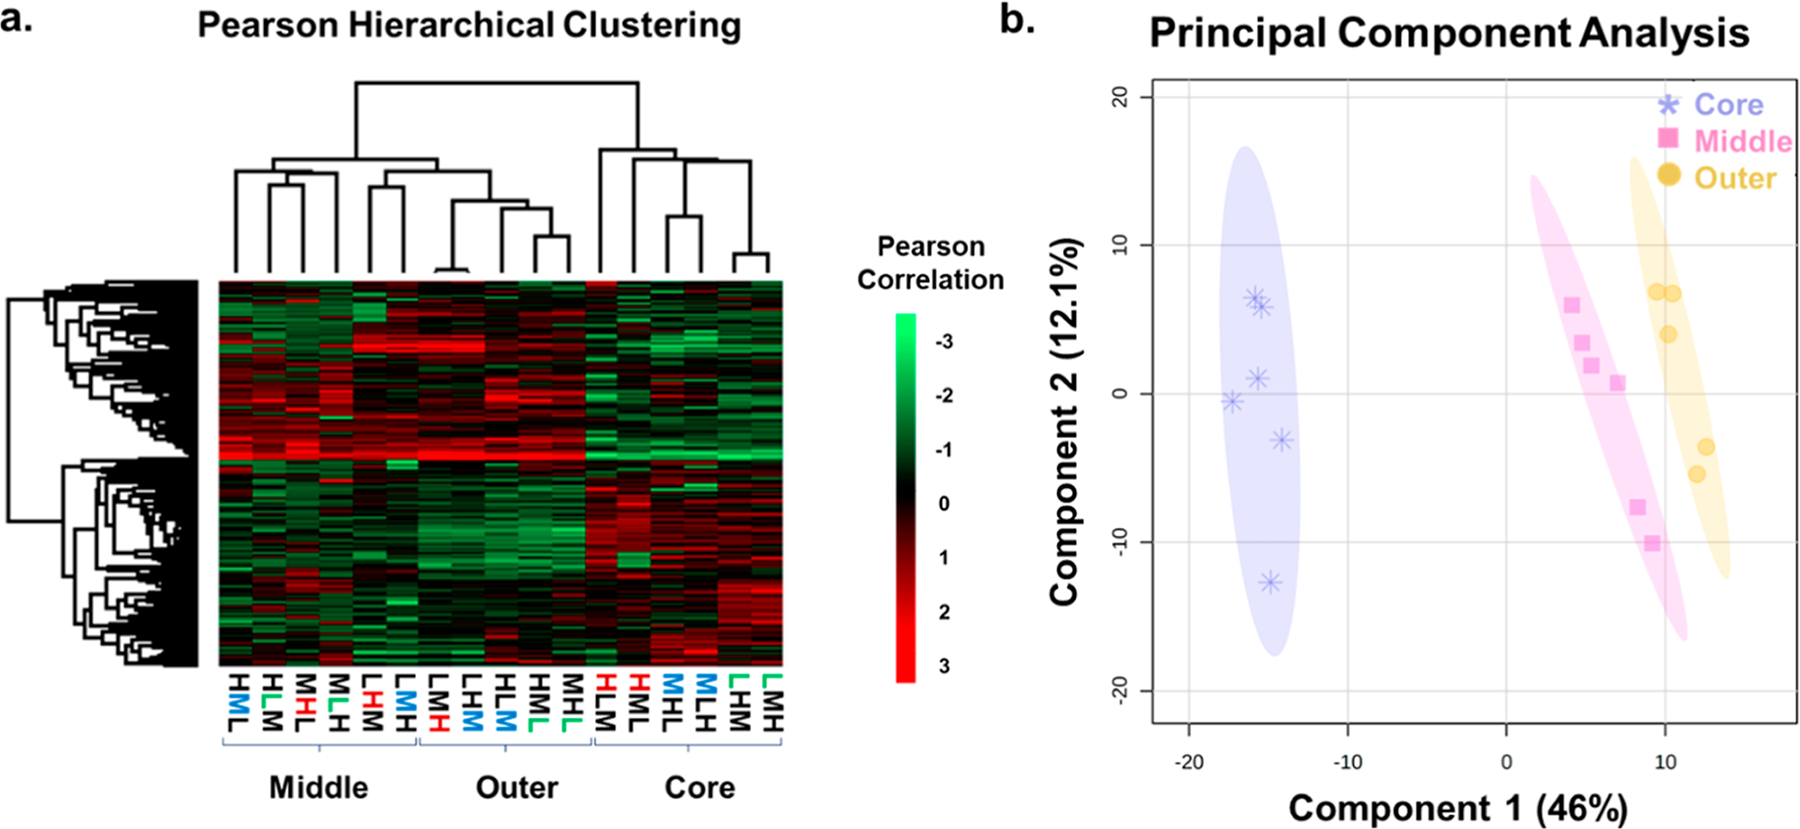
(a) Hierarchical clustering by a Pearson correlation representing the proteome of each layer of the spheroid populations. Significantly upregulated proteins are shown in red, with down-regulated proteins shown in bright green. (b) PCA of each labeled layer of the spheroid populations. The layers are represented by the shape and color of the data points (purple = core, yellow = outer, and pink = middle). The spatial location (core, middle, or outer) is the primary determinant of the clustering. The protein ratios from the necrotic core cluster separated from the two outer layers. The middle and outer layers show some modest overlap with the outer cells.
Ultimately, this means that the data will be sorted by their principal components independent of anything besides the normalized SILAC ratios associated with each protein, which allows us to draw conclusions based purely on the observed clustering. The principal components shown in Figure 7b, from left to right, show that there are three distinct groups of the samples, each representing a different layer of the spheroid. The 95% confidence ellipses indicated by the shading show no overlap in their regions. This analysis shows a distinct clustering for each of the spheroid layers, with complete separation of the necrotic core, the quiescent middle, and proliferating outer layers, regardless of the isotopic label used.
We next examined the relative abundance of the quantified proteins in each layer and performed the hierarchical clustering using a Pearson correlation. This unsupervised analysis was to determine whether the proteins changed in abundance based on the spatial location. The results of this analysis are shown in Figure 7a and represent relative abundance of 406 proteins. This heat map shows that not only do the layers cluster together but the abundance of individual proteins within each layer is consistent regardless of the presence of a heavy-, medium-, or light-labeling approach. The results of the more global, unfiltered data set with 2,873 proteins included exhibit a similar clustering (Figure S4).
Within the heat map (Figure 7a), there is a complete separation between the core and the two outer layers. The middle quiescent and outer proliferative layers are mostly separated, with minimal overlap. This pattern is a robust trend appearing in each population of spheroids, regardless of the labeling sequence. However, these similarities in the quiescent and proliferating layers are not a surprise and must be taken into further consideration. Due to the nature of these two regions, many similar protein expression patterns are expected to be seen. In the core, there is a distinct change in the proteome as apoptotic signaling pathways had been previously activated leading to an increase in necrotic cells. By confirming the biological trends within the unbiased clustering to the previous correlation graphs, it can be concluded that discrete labeling exists in the triplex spheroids and that this platform can be used to trace proteome changes to individual layers within the spheroid.
With any new method, there are complications. One potential pitfall for this platform is the complexity of the data analysis. Many previous publications have mentioned various techniques for assessing SILAC labeling efficiencies. Although using a single technique may be sufficient in some circumstances, for the spatial SILAC platform, we have found better success utilizing a combination of techniques to not only evaluate the percentage of peptides identified by a designated label but also by looking into the corresponding peptide mass intensities. By looking at how the peptide was identified and at the corresponding light and heavy mass intensities, we gain a fuller understanding of where labeled peptides are being incorporated and to what degree they are being detected.
CONCLUSIONS
In this article, we describe the development of spatial SILAC, an approach to isotopically label the proteins in the different layers of the multicellular spheroid. By measuring the isotopic composition of a protein by mass spectrometry, one can infer its spatial origin in the spheroid and the corresponding chemical microenvironment. We demonstrate that due to the radial growth pattern of the spheroids, we can selectively label the three primary cell populations of the spheroid with different SILAC labels. We also demonstrated that the labels can be swapped without introducing labeling bias. The protein abundances measured with the spatial SILAC approach strongly correlate with the known physiological patterns within the spheroid, namely, in the unsupervised clustering of the quantified proteins into the three spatial regions of the spheroid.
Because the chemical and cellular gradients in the spheroid represent gradual changes across a continuum, there is some observed overlap in the isotopic patterns, most notably, between the middle quiescent and outer proliferative layer. However, even with some overlap, clear demarcations exist between the inner core and the rest of the spheroid, and the overlap between the middle and outer layers is modest. Future work will focus on refining the protocols to optimize the separation of samples in the outer and middle layers. This optimization will be achieved through optimization of the serial trypsinization procedure, using a combination of well-established immunological markers with flow cytometry and using the protein biomarkers identified in this analysis by mass spectrometry to refine the layers.
Spatial SILAC with spheroids has the potential to be a robust drug-screening proteomic platform. A substantial advantage of spheroids is that they can be produced in large quantities, making them an ideal drug-testing platform.24 The labels effectively create an isotopic address allowing for proteins to be linked to a specific spatial microenvironment. This unique platform allows for both spatial and temporal studies. Future directions for this research will involve extensive testing with chemotherapeutics to examine the proteomic responses in specific chemical contexts. In vivo tumors are highly heterogenous, and current drug-testing compounds do not adequately explore those chemical differences. The spatial SILAC platform offers exciting opportunities to evaluate proteomic responses to novel therapeutics in a more realistic tumor model.
Supplementary Material
ACKNOWLEDGMENTS
A.B.H., N.C.B., and K.R.L. were supported by R01GM110406 from the National Institute of General Medical Sciences. J.K.L. was supported by Career award 1351595 from the National Science Foundation.
Footnotes
Supporting Information
The Supporting Information is available free of charge at https://pubs.acs.org/doi/10.1021/acs.analchem.1c03461.
Liquid chromatography gradient, SILAC label incorporation percentages, heavy-labeled peptide overlap by layer, protein quantification ratios, and principal component analysis and hierarchical clustering for unfiltered data (PDF)
Complete contact information is available at: https://pubs.acs.org/10.1021/acs.analchem.1c03461
The authors declare no competing financial interest.
Contributor Information
Nicole C. Beller, Department of Chemistry and Biochemistry, The Ohio State University, Columbus, Ohio 43210, United States
Jessica K. Lukowski, Department of Chemistry and Biochemistry, University of Notre Dame, Notre Dame, Indiana 46556, United States
Katelyn R. Ludwig, Department of Chemistry and Biochemistry, University of Notre Dame, Notre Dame, Indiana 46556, United States
Amanda B. Hummon, Department of Chemistry and Biochemistry and Comprehensive Cancer Center, The Ohio State University, Columbus, Ohio 43210, United States.
REFERENCES
- (1).Siegel RL; Miller KD; Jemal A Ca-Cancer J. Clin 2020, 70, 7–30. [DOI] [PubMed] [Google Scholar]
- (2).World Cancer Research Fund—Colorectal Cancer Statistics 2020, https://www.wcrf.org/dietandcancer/cancer-trends/colorectal-cancer-statistics (accessed June 09, 2020).
- (3).Khoo CY; Chai X; Quek R; Teo MCC; Goh BKP Eur. J. Surg. Oncol 2018, 44, 388–394. [DOI] [PubMed] [Google Scholar]
- (4).Langhans SA Front. Pharmacol 2018, 9, 6. [DOI] [PMC free article] [PubMed] [Google Scholar]
- (5).Sutherland RM Science 1988, 240, 177–184. [DOI] [PubMed] [Google Scholar]
- (6).Sutherland RM; McCredie JA; Inch WR J. Natl. Cancer Inst 1971, 46, 113–120. [PubMed] [Google Scholar]
- (7).Sutherland RM; Sordat B; Bamat J; Gabbert H; Bourrat B; Mueller-Klieser W Cancer Res 1986, 46, 5320. [PubMed] [Google Scholar]
- (8).Hirschhaeuser F; Menne H; Dittfeld C; West J; Mueller-Klieser W; Kunz-Schughart LA J. Biotechnol 2010, 148, 3–15. [DOI] [PubMed] [Google Scholar]
- (9).Verjans E-T; Doijen J; Luyten W; Landuyt B; Schoofs LJ Cell. Physiol 2018, 233, 2993–3003. [DOI] [PubMed] [Google Scholar]
- (10).Mueller-Klieser WJ Cancer Res. Clin. Oncol 1987, 113, 101–122. [DOI] [PubMed] [Google Scholar]
- (11).Yue X; Lukowski JK; Weaver EM; Skube SB; Hummon AB J. Proteome Res 2016, 15, 4265–4276. [DOI] [PMC free article] [PubMed] [Google Scholar]
- (12).Tölle RC; Gaggioli C; Dengjel J J. Proteome Res 2018, 17, 2780–2789. [DOI] [PubMed] [Google Scholar]
- (13).Kim YE; Jeon HJ; Kim D; Lee SY; Kim KY; Hong J; Maeng PJ; Kim K-R; Kang D Sci. Rep 2018, 8, 13255. [DOI] [PMC free article] [PubMed] [Google Scholar]
- (14).Kumar HR; Zhong X; Hoelz DJ; Rescorla FJ; Hickey RJ; Malkas LH; Sandoval JA Pediatr. Surg. Int 2008, 24, 1229–1234. [DOI] [PMC free article] [PubMed] [Google Scholar]
- (15).He W; Kuang Y; Xing X; Simpson RJ; Huang H; Yang T; Chen J; Yang L; Liu E; He W; Gu J J. Proteome Res 2014, 13, 2272–2281. [DOI] [PubMed] [Google Scholar]
- (16).Wu Y-M; Tang J; Zhao P; Chen Z-N; Jiang J-L Exp. Mol. Pathol 2009, 87, 133–140. [DOI] [PubMed] [Google Scholar]
- (17).Chan Y-H; Huang T-W; Young T-H; Lou P-J J. Cell. Physiol 2011, 226, 3076–3085. [DOI] [PubMed] [Google Scholar]
- (18).Kunz-Schughart LA; Kreutz M; Knuechel R Int. J. Exp. Pathol 1998, 79, 1–23. [DOI] [PMC free article] [PubMed] [Google Scholar]
- (19).Created with BioRender.com. 2021, https://app.biorender.com (accessed Oct 11, 2021).
- (20).McMahon KM; Volpato M; Chi HY; Musiwaro P; Poterlowicz K; Peng Y; Scally AJ; Patterson LH; Phillips RM; Sutton CW J. Proteome Res 2012, 11, 2863–2875. [DOI] [PubMed] [Google Scholar]
- (21).Keithley RB; Weaver EM; Rosado AM; Metzinger MP; Hummon AB; Dovichi N J. Anal. Chem 2013, 85, 8910–8918. [DOI] [PMC free article] [PubMed] [Google Scholar]
- (22).Freyer JP; Sutherland RM Cancer Res 1980, 40, 3956. [PubMed] [Google Scholar]
- (23).Lukowski JK; Hummon AB Anal. Bioanal. Chem 2019, 411, 7087–7094. [DOI] [PubMed] [Google Scholar]
- (24).Feist PE; Sun L; Liu X; Dovichi NJ; Hummon AB Rapid Commun. Mass Spectrom 2015, 29, 654–658. [DOI] [PMC free article] [PubMed] [Google Scholar]
- (25).Ong S-E; Blagoev B; Kratchmarova I; Kristensen DB; Steen H; Pandey A; Mann M Mol. Cell. Proteomics 2002, 1, 376–386. [DOI] [PubMed] [Google Scholar]
- (26).Beynon RJ; Pratt JM Mol. Cell. Proteomics 2005, 4, 857–872. [DOI] [PubMed] [Google Scholar]
- (27).Cambridge SB; Gnad F; Nguyen C; Bermejo JL; Krüger M; Mann M J. Proteome Res 2011, 10, 5275–5284. [DOI] [PubMed] [Google Scholar]
- (28).Doherty MK; Hammond DE; Clague MJ; Gaskell SJ; Beynon RJ J. Proteome Res 2009, 8, 104–112. [DOI] [PubMed] [Google Scholar]
- (29).Doherty MK; Whitehead C; McCormack H; Gaskell SJ; Beynon RJ Proteomics 2005, 5, 522–533. [DOI] [PubMed] [Google Scholar]
- (30).Pratt JM; Petty J; Riba-Garcia I; Robertson DHL; Gaskell SJ; Oliver SG; Beynon RJ Mol. Cell. Proteomics 2002, 1, 579. [DOI] [PubMed] [Google Scholar]
- (31).Kristensen LP; Chen L; Nielsen MO; Qanie DW; Kratchmarova I; Kassem M; Andersen JS Mol. Cell. Proteomics 2012, 11, 989–1007. [DOI] [PMC free article] [PubMed] [Google Scholar]
- (32).Eldeeb MA; Siva-Piragasam R; Ragheb MA; Esmaili M; Salla M; Fahlman RP J. Neurochem 2019, 151, 520–533. [DOI] [PubMed] [Google Scholar]
- (33).Fierro-Monti I; Racle J; Hernandez C; Waridel P; Hatzimanikatis V; Quadroni M PLoS One 2013, 8, No. e80423. [DOI] [PMC free article] [PubMed] [Google Scholar]
- (34).Collection A. T. C., SOP: Thawing, Propagation and Cryopreservation of NCI-PBCF-CCL247 (HCT 116). Facility, P. S.-O. C. N. B. C.; NIH National Cancer Institute: Bioresource Core, 2012; Vol 1.6, p 24. [Google Scholar]
- (35).Ahlf Wheatcraft DR; Liu X; Hummon AB J. Visualized Exp 2014, 94, 52313. [DOI] [PMC free article] [PubMed] [Google Scholar]
- (36).Li H; Hummon AB Anal. Chem 2011, 83, 8794–8801. [DOI] [PubMed] [Google Scholar]
- (37).Liu X; Weaver EM; Hummon AB Anal. Chem 2013, 85, 6295–6302. [DOI] [PMC free article] [PubMed] [Google Scholar]
- (38).Lukowski JK Mass Spectrometry-Based Spatial Analysis of Endogeneous and Exogenous Molecules in Three-Dimensional Cell Culture; University of Notre Dame: Notre Dame, Indiana, 2019. [Google Scholar]
- (39).McMahon KM; Volpato M; Chi HY; Musiwaro P; Poterlowicz K; Peng Y; Scally AJ; Patterson LH; Phillips RM; Sutton CW J. Proteome Res 2012, 11, 2863–2875. [DOI] [PubMed] [Google Scholar]
- (40).Ludwig KR; Schroll MM; Hummon AB J. Proteome Res 2018, 17, 2480–2490. [DOI] [PMC free article] [PubMed] [Google Scholar]
- (41).Eisenberg E; Levanon EY Trends Genet 2013, 29, 569–574. [DOI] [PubMed] [Google Scholar]
- (42).Huang Z; Hua Y; Tian Y; Qin C; Qian J; Bao M; Liu Y; Wang S; Cao Q; Ju X; Wang Z; Gu M Oncol. Rep 2018, 39, 2996–3006. [DOI] [PubMed] [Google Scholar]
- (43).Díaz-Ramos A; Roig-Borrellas A; García-Melero A; López-Alemany R J. Biomed. Biotechnol 2012, 2012, 156795. [DOI] [PMC free article] [PubMed] [Google Scholar]
- (44).Peng Y-T; Chen P; Ouyang R-Y; Song L Apoptosis 2015, 20, 1135–1149. [DOI] [PMC free article] [PubMed] [Google Scholar]
- (45).Xu Y; Yang W; Shi J; Zetter BR J. Mol. Cell Biol 2016, 8, 282–285. [DOI] [PMC free article] [PubMed] [Google Scholar]
- (46).Yang J; Li B; He Q-Y Cell Death Dis 2018, 9, 580. [DOI] [PMC free article] [PubMed] [Google Scholar]
- (47).Feist PE; Sidoli S; Liu X; Schroll MM; Rahmy S; Fujiwara R; Garcia BA; Hummon AB Anal. Chem 2017, 89, 2773–2781. [DOI] [PMC free article] [PubMed] [Google Scholar]
Associated Data
This section collects any data citations, data availability statements, or supplementary materials included in this article.


