

Abstract
Background
To identify deprivation indicators usable in everyday practice and included in medico-administrative databases, particularly with infectious diseases, which represent the greatest proportion of hospitalizations. Our objective was to compare ecological indicators to individual questionnaires and apply both types to the study of the impact of deprivation on hospital efficiency.
Methods
We conducted an epidemiological observational prospective multicentre study in two French public hospitals between 20 October 2016 and 20 March 2017. Children hospitalized for one of the four most common infectious diseases were included and their parents were asked to answer the Evaluation of Precarity and Inequalities in Health Examination Centers (EPICES) questionnaire. The ecological indicator French DEPrivation index (FDep) was derived from patients’ address, both at the zip code and at a smaller geographical area (IRIS [ilôts de regroupement pour l'information statistique]) level. Correlation and concordance between the three indicators were assessed. The endpoint used to assess the impact on hospital efficiency was the ratio between patients’ length of stay (LOS) and the national LOS of their disease-related group.
Results
Data were available for 540 patients with a mean age of 9 mo. A total of 56.1% of patients were considered deprived with EPICES, 50.4% with zip code FDep and 45.7% with IRIS FDep. Concordance between EPICES and either type of FDep was <0.1. There was no increase in LOS compared with national LOS with any of the indicators.
Conclusions
Individual and ecological indicators do not measure the same aspects of deprivation. The decision to use one or the other must be carefully weighed when studying the impact of deprivation on the healthcare system.
Keywords: acute infectious diseases, deprivation, efficiency, length of stay, paediatric
Introduction
Social deprivation is a complex, multidimensional concept that cannot be reduced to a single economic dimension. It has been defined by the WHO as the absence of one or more of the factors that enable individuals and families to assume their elementary responsibilities and enjoy their fundamental rights, a definition that is similar to that of Joseph Wresinski.1 Peter Townsend, in the UK, also pioneered an approach that covered a wide range of living standards, both material and social: ‘Individuals, families and groups in the population can be said to be in poverty when they lack the resources to obtain the types of diet, participate in the activities, and have the living conditions and amenities which are customary, or at least widely encouraged or approved, in the societies to which they belong’.2 Due to its multidimensional aspect, it is difficult to assess deprivation in practice, particularly on a large scale, and its assessment is often further limited by data availability on relevant factors.
Individual questionnaires filled out by the patient or his/her family, or in the case of children, his/her parent, are the best way to evaluate all dimensions of deprivation accurately, whether it be economic, social, family or cultural. As such, many questionnaires have been developed and used in the general population in national surveys. In France, individual questionnaires cannot always be used, particularly in large-scale hospital studies, as they are time-consuming, or in studies that only mobilize administrative databases.3,4
Alternative deprivation indicators that are usable in everyday practice, even in the absence of the patient, have therefore been developed. For example, the French Ministry of Health currently uses health insurance aid indicators to allocate extra funds to hospitals to help them cope with the additional costs associated with deprivation is patients.5,6 In practice, this means that children’s deprivation is proxied by their parents’, as it stands to reason that the two would be closely linked. However, these indicators have many limits. First, they underestimate the number of deprived patients in the establishment, as it is well known that not all patients who could benefit from assistance actually do.5 Second, as they are dichotomous, they create a very clear threshold effect. Finally, they only take into account the financial dimension of deprivation, thus excluding notions such as education and social isolation.
An alternative way is to use ecological indicators of social deprivation.2 They provide a proxy of the socio-economic status of individuals by using their place of residence, and their main advantage is that they can include a wide range of variables and can be calculated with administrative data, although they have limits as well, in particular, that of ecological fallacy. Those types of indicators can be calculated at the municipal level using a patient’s zip code of residence or, for smaller geographical areas, the patient’s address.
While their use by healthcare institutions has increased,7,8 they have never (to the best of our knowledge) been compared with individual questionnaires. In this context, infectious diseases represent an opportunity to do so, as they correspond to an important proportion of admissions of deprived patients and very few paediatric studies have focused on this subject. It is also a field where the family environment can be directly related to the child’s health and the decision to discharge a patient often depends on this environment.
Our objective was therefore to assess the concordance between the two types of indicators and apply them to a case study, the association between deprivation and hospital efficiency in infectious diseases in paediatrics.
Methods
Study design
An observational prospective multicentre study was conducted in two university hospitals in Paris, Robert Debré and Jean Verdier. These hospitals are located in areas considered to be deprived and therefore have a large disadvantaged population.
The study was approved by an independent ethics committee (committee of ‘Ile-De-France n°2’, IRB registration 00001072, project number 2016-12-09) and the National Commission of Informatics and Liberties granted its agreement for the data collection (reference 1997097). The written consent was approved by the ethics committee. No funding was received for this study.
Population
All children <15 y of age hospitalized for one of the four most common infectious diseases (bronchiolitis, acute gastroenteritis, acute pneumonia or acute pyelonephritis) were eligible for the study. They were included during the winter epidemic period (20 October 2016–20 March 2017). Parents were informed about the study and their consent was obtained. Infectious diseases were chosen because they represent an important proportion of admissions in general paediatric departments, as well as an important cause of admissions for deprived patients in hospitals.9 They therefore represent an important challenge for paediatric hospitals located in disadvantaged areas. Children who were not living at their parents’ place of residence, who were living abroad, whose parents were absent at the time of inclusion or who developed one of the four infectious diseases while hospitalized for another disease were not included.
Measures of deprivation
The individual questionnaire chosen for this study was the Evaluation of Precarity and Inequalities in Health Examination Centers (EPICES) questionnaire, developed by the French statutory health insurance’s health examination centres to assess the deprivation of patients10 (Appendix A). It has also been used in different pathologies and different care settings.11–14 To the best of our knowledge, it is the only available French validated questionnaire that allows the calculation of a deprivation score at an individual level. It was constructed in 1998 from 42 questions taking into account several dimensions of deprivation (employment, education, housing, family composition etc.). Of the 42 questions, 11 binary questions were selected because they summarized 90% of the deprivation situation of a subject. Each response is associated with a coefficient, which are then added to a constant to make the EPICES score, which varies between 0 (no deprivation) and 100 (maximum deprivation). A score of 30 is considered to be the deprivation threshold.
Regarding the ecological indicators, we used the French DEPrivation index (FDep), which was developed specifically for the French context and has been used in the past to study the impact of deprivation on the use or consumption of care.11,12 It contains four variables: the percentage of blue-collar workers in the labour force, the percentage of high school graduates in the population ≥15 y of age, the unemployment rate in the labour force and the median income per household. It has been validated in comparison with other international indicators.8 It was calculated at two levels: at the patient’s zip code and for a smaller area (IRIS [ilôts de regroupement pour l'information statistique] derived from their address with the following website: www.geoportail.gouv.fr/donnees/iris. Our hypotheses were that we would be able to better assess deprivation with the EPICES questionnaire and that, when comparing it with our ecological indicators, the loss of information would be less with the indicator assessed at the address level, due to a lower risk of ecological fallacy.
Case study
Within our study population we aimed to assess whether deprivation had any impact on hospital efficiency using the three indicators, whether one performed best and whether they could be used together. Efficiency was assessed using the ratio between the patient’s length of stay (LOS) and the national LOS of their diagnosis-related group. A ratio >1 for a given patient meant that he or she was hospitalized longer than the reference LOS for patients with a similar condition and severity, on which the hospital tariff is based. As such, a higher ratio was indicative of inefficiency for a hospital. Mean ratios were assessed overall and for each national quintile of the three indicators.
Statistical analysis
The link between the three indicators was assessed by correlation (for the scores) and by concordance (for the quintiles) with Cohen’s κ. The association between quintiles of deprivation and efficiency loss was tested with a Kruskal–Wallis test, because of the non-equality of the variance.
A multivariate regression model was carried out to assess the association between deprivation and LOS. Adjustment factors such as age, sex, centre, diagnosis, severity, admission and discharge mode were introduced in the model if they were associated with LOS in the univariate analysis at a significance level of 0.2. Age, sex, centre and diagnosis were added to the final model regardless of the association.
All analyses were performed using R version 3.3.3 (R Foundation, Vienna, Austria) and SAS software version 9.4 (SAS Institute, Cary, NC, USA). All p-values were two-sided, with a significance threshold of <0.05.
Results
Description of the population
The descriptive results have been published previously.15 Of 677 patients hospitalized during the study period for one of the four diagnoses, 556 met our inclusion and non-inclusion criteria and 540 were included in the analysis.
The majority of patients were male (60.6%) and the average age was 9 mo. Bronchiolitis represented more than two-thirds of admissions. Patients in Jean Verdier Hospital were younger than in Robert Debré Hospital (mean age 7.3 vs 10.5 mo, p=0.026).
Comparison of the deprivation indicators
A total of 56.1% of patients were in EPICES quintiles 4 and 5, 50.4% were in IRIS FDep quintiles 4 and 5 and 45.8% were in zip code FDep quintiles 4 and 5 (p=0.003) (Table 1). However, although the indicators agreed on the percentage of deprived patients, the distribution of the patients at the other end of the spectrum varied depending on the indicator used. Indeed, with the EPICES score, only 6.3% of the population was in the first quintile vs 23% with the IRIS FDep and 29% with the zip code FDep (p=0.057). There was no difference between pathologies.
Table 1.
Partition of patients in the different quintiles of deprivation
| Quintiles | Total sample (N=540), n (%) | Robert Debré Hospital (N=304), n (%) | Jean Verdier Hospital (N=236), n (%) |
|---|---|---|---|
| EPICES score | |||
| 1 | 34 (6.3) | 17 (5.6) | 17 (7.2) |
| 2 | 107 (19.8) | 57 (18.7) | 50 (21.2) |
| 3 | 96 (17.8) | 57 (18.7) | 39 (16.5) |
| 4 | 129 (23.9) | 73 (24) | 56 (23.7) |
| 5 | 174 (32.2) | 100 (33) | 74 (31.4) |
| Zip code FDep | |||
| 1 | 161 (29.8) | 115 (37.8) | 46 (19.5) |
| 2 | 88 (16.3) | 59 (19.4) | 29 (12.3) |
| 3 | 19 (3.5) | 13 (4.3) | 6 (2.5) |
| 4 | 145 (26.9) | 55 (18.1) | 90 (38.1) |
| 5 | 127 (23.5) | 62 (20.4) | 65 (27.6) |
| IRIS FDep | |||
| 1 | 127 (23.5) | 85 (28) | 42 (17.8) |
| 2 | 73 (13.5) | 37 (12.2) | 36 (15.3) |
| 3 | 93 (17.2) | 45 (14.8) | 48 (20.3) |
| 4 | 54 (10) | 38 (12.5) | 16 (6.8) |
| 5 | 193 (35.8) | 99 (32.5) | 94 (39.8) |
As expected, there was a high correlation between the two FDep values, but the correlation between either type of FDep and EPICES was very poor (Figure 1).
Figure 1.
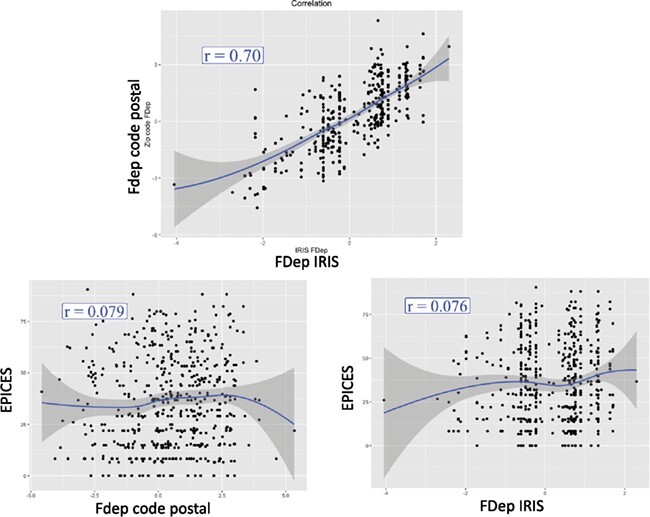
Correlation between the three indicators of deprivation.
The concordance between EPICES and IRIS FDep was poor, with a κ coefficient of 0.009 (weighted κ=0.07). Only 19% of patients were in the same quintile with both indicators, which rose to 55% when allowing for a difference of 1 quintile (Table 2). When looking at the concordance between EPICES and zip code FDep quintiles, we found similar results (Table 3), with a κ coefficient of 0.015 (weighted κ=0.038). Only 21% of patients were in the same quintile with both indicators, which rose to 52% when allowing for a difference of 1 quintile. Finally, as expected, the concordance was better when comparing the two FDep values (Table 4), with a κ of 0.24 (weighted κ=0.47). A total of 40% of patients were in the same quintile with both indicators and 77% were in the same quintile ±1 quintile.
Table 2.
Concordance between IRIS FDep quintiles and EPICES quintiles
| EPICES quintiles | |||||
|---|---|---|---|---|---|
| IRIS FDep quintiles | 1 | 2 | 3 | 4 | 5 |
| 1 | 13 (2.4) | 31 (5.7) | 23 (4.3) | 20 (3.7) | 40 (7.4) |
| 2 | 5 (0.9) | 16 (3) | 16 (3) | 13 (2.4) | 23 (4.3) |
| 3 | 6 (1.1) | 19 (3.5) | 12 (2.2) | 25 (4.6) | 31 (5.7) |
| 4 | 1 (0.2) | 10 (1.9) | 10 (1.9) | 15 (2.8) | 18 (3.3) |
| 5 | 9 (1.7) | 31 (5.7) | 35 (6.5) | 56 (10.3) | 62 (11.5) |
Values presented as n (%).
Table 3.
Concordance between zip code FDep quintiles and EPICES quintiles
| EPICES quintiles | |||||
|---|---|---|---|---|---|
| Zip code FDep quintiles | 1 | 2 | 3 | 4 | 5 |
| 1 | 7 (1.3) | 36 (6.7) | 31 (5.7) | 37 (6.9) | 50 (9.3 |
| 2 | 11 (2) | 17 (3.1) | 14 (2.6) | 18 (3.3) | 28 (5.2) |
| 3 | 1 (0.2) | 4 (0.7) | 4 (0.7) | 3 (0.5) | 7 (1.3) |
| 4 | 10 (1.9) | 34 (6.3) | 23 (4.3 | 37 (6.9) | 41 (7.6) |
| 5 | 5 (0.9) | 16 (3) | 24 (4.4) | 34 (6.3) | 48 (8.9) |
Values presented as n (%).
Table 4.
Concordance between IRIS FDep quintiles and zip code FDep quintiles
| Zip code FDep quintiles | |||||
|---|---|---|---|---|---|
| IRIS FDep quintiles | 1 | 2 | 3 | 4 | 5 |
| 1 | 88 (16.3) | 29 (5.4) | 5 (0.9) | 5 (0.9) | 0 (0) |
| 2 | 28 (5.2) | 13 (2.4) | 5 (0.9) | 23 (4.3) | 4 (0.7) |
| 3 | 20 (3.7) | 20 (3.7) | 3 (0.5) | 35 (6.5) | 15 (2.8) |
| 4 | 10 (1.9) | 11 (2) | 3 (0.5) | 16 (3) | 14 (2.6) |
| 5 | 15 (2.8) | 15 (2.8) | 3 (0.5) | 66 (12.2) | 94 (17.4) |
Values presented as n (%).
When looking at each EPICES question and whether people who answered yes or no had significantly different mean FDep values, we found that people who were homeowners or who had been to a show or done sporting activities in the past 12 mo were significantly less deprived than those who had not (see the Supplementary material).
Impact of deprivation on hospital efficiency
The patients’ mean LOS was 4.6±3.5 d (median 4 d [min 0.5, max 32]). The mean ratio between patient LOS and national LOS was 1±0.5 d (median 0.9 d [Q1 0.7, Q3 1.3]). There was no statistical difference between quintiles for either indicator (p=0.69 for EPICES, p=0.69 for IRIS FDep and p=0.08 for the zip code FDep) (Figure 2).
Figure 2.

Ratio between LOS and national LOS according to the type of indicator.
In the multivariate modelling, we found no association between any of the scores and our outcome, although all models performed very poorly. When all three indicators were introduced at the same time, the ratio was significantly related to sex, age and diagnosis (Table 5).
Table 5.
Results of the multivariate regression model for the ratio between patients LOS and national LOS of their diagnosis-related group
| Quintiles | Estimate | 95% confidence interval |
|---|---|---|
| EPICES | ||
| 1 | ref | ref |
| 2 | 0.07 | 0.065 to 0.09 |
| 3 | 0.03 | 0.029 to 0.94 |
| 4 | 0.06 | 0.06 to 0.09 |
| 5 | 0.02 | 0.02 to 0.09 |
| IRIS FDep | ||
| 1 | ref | ref |
| 2 | −0.04 | −0.04 to 0.07 |
| 3 | 0.02 | 0.023; 0.07 |
| 4 | 0.13 | 0.13; 0.082 |
| 5 | 0.14 | 0.14; 0.07 |
| Zip code FDep | ||
| 1 | ref | ref |
| 2 | −0.01 | −0.006 to 0.06 |
| 3 | −0.02 | −0.02 to 0.11 |
| 4 | −0.2 | −0.2 to 0.06 |
| 5 | −0.18 | −0.18 to 0.07] |
| Diagnostic | ||
| Pneumonia | ref | ref |
| Bronchiolitis | 0.08 | −0.056 to 0.22 |
| Gastroenteritis | 0.0001 | −0.158 to −0.159 |
| Pyelonephritis | 0.28 | 0.036 to 0.52 |
| Age (mo) | 0.0004 | −0.0022 to 0.0029 |
| Sex | ||
| Male | ref | ref |
| Female | −0.13 | −0.21 to −0.04 |
| Hospital | ||
| Robert Debré | ref | ref |
| Jean Verdier | 0.07 | −0.012 to 0.16 |
| Severity | ||
| Grade 1 | ref | ref |
| Grade 2 | −0.24 | −0.34 to −0.14 |
| Grade 3 | −0.11 | −0.22 to −0.006 |
| Grade 4 | −0.14 | −0.8 to 0.5] |
Discussion
We found that our ecological indicator, FDep, was poorly correlated to an individual patient questionnaire regardless of the level of the analysis (zip code vs IRIS). When looking at the association between deprivation and hospital efficiency in a population of children hospitalized for an acute infectious disease, the three indicators performed similarly, with none of them finding an association, contrary to what was expected.
The absence of correlation may be due to different aspects of deprivation being captured by the two types of indicators: the EPICES questionnaire takes into account a wide range of variables, focusing in particular on the psychosocial aspect of deprivation, while the FDep only takes four variables into account, most of which are about employment. In this context, it is possible that the psychosocial aspect of deprivation may be more important than the financial aspect.6 The two indicators have very few variables in common: in fact, only the question ‘Are there times during the month when you face real financial difficulties to support yourself?’ in the EPICES questionnaire could be deemed similar to the median income per household. In addition, neither of them takes into account the homeless aspect, which is an important parameter because of the increase in migrant populations. Unfortunately, homeless patients do not have an FDep and therefore they were excluded from the analysis. However, Labbe et al.16 compared the EPICES questionnaire with two ecological indicators of deprivation and found differing results from ours. This is likely due to the population included in each study. While Labbe et al. included a large sample of people >16 y of age in the north of France, we included young patients in two hospitals with highly deprived catchment areas. On the other hand, Pardo-Crespo et al.17 found that indirect socio-economic status measures at the regional level strongly disagreed with individual socio-economic status measures.
We found no impact of deprivation on healthcare consumption, which is contrary to many studies in adult populations3,18,19 but similar to what another study on paediatric patients admitted for bronchiolitis found.20 This could be explained in two ways. One, there is an impact of deprivation on LOS in paediatrics, but this study could not show it. This may be because our indicators do not capture what is important in the paediatric context. Indeed, deprived parents may focus all their available resources on their children and not themselves, which would partly erase the impact of deprivation. For example, a child from a deprived family may be able to go on holiday or to see shows thanks to social support. In addition, both types of indicators have limits. EPICES was created almost 20 y ago, and as with any questionnaire, parents may either minimize their deprivation when answering the questionnaire because of shame or fear of being blamed or exaggerate their situation in the hope that it will bring them financial support. The FDep indicators, although calculated with more recent data, have not been updated recently (2008 for zip codes and 2009 for IRIS), and they remain proxies and not individual measures of deprivation. This makes it difficult to evaluate actual deprivation with the address, especially in the current evolving economic situation and with recent migrations, especially in the areas around the two participating hospitals.
The other possibility is that there is no impact of deprivation on hospital efficiency in this population. This could be because LOS is not the right endpoint and that the admission rate would be more appropriate. Indeed, an increase in the probability that deprived patients would be hospitalized compared with non-deprived patients has been shown in the literature.21,22 The high proportion of patients in the more deprived quintiles in our study may indicate that this is the case here, although it could also be due to the patient population of the two hospitals. It is also possible that, because of their location and highly deprived catchment areas, the two hospitals included in the study have learned to adapt to their population and have developed ways to increase their efficiency in this particular context. Qualitative studies should be carried out to explore this further.
Other studies are currently ongoing to assess the impact of deprivation on hospital efficiency using ecological deprivation indicators, both in paediatric and in adult populations. This will allow us to explore these indicators in other diseases, particularly in chronic diseases in which patient education plays a major role before discharge and may take longer in disadvantaged populations. Additional studies should include hospitals not accustomed to a high rate of deprivation to see if coping mechanisms were at play here and should include additional indicators such as admission rates.
Acknowledgements:
None.
Authors’ contributions:
AR, MM, LDP, AF and KC contributed to the study conception and design. AR, MM and KC wrote the research protocol. KC, AF and LDP were involved in planning and supervising the work. AR and AL-U acquired the data. AR and MM performed the data extraction. AR and MM wrote the statistical programs. AR and MM wrote the first draft of the manuscript. All authors contributed to further drafts and approved the final manuscript. AR is the guarantor of the paper.
Funding:
None.
Competing interests:
None declared.
Ethical approval:
This study was approved by an independent ethics committee (project number 2016-12-09), and the National Commission for Informatics and Liberties granted permission for data collection (declaration 1997097).
References
- 1. Wresinski J. Grande pauvreté et Précarité Economique et sociale, Rapport du Conseil Economique et Social. Paris: Conseil Économique et Social; 1987. [Google Scholar]
- 2. Townsend P. Poverty in the United Kingdom: a survey of household resources and standards of living. Berkeley: University of California Press; 1979. [Google Scholar]
- 3. Yilmaz E, Raynaud D. The influence of social deprivation on length of hospitalisation. Eur J Health Econ. 2013;14(2):243–52. [DOI] [PubMed] [Google Scholar]
- 4. Bréchat P-H, Lansac C, Mathieu-Grenouilleau M. Prise en charge de la précarité dans les établissements de santé. Gestions hospitalières. 2009;486:269–74. [Google Scholar]
- 5. Archimbaud A. Rapport 2013 au Parlement sur le financement des établissements de santé (Loi 2011 1906 du 21 décembre 2011 de financement de la sécurité sociale pour 2012 – Art. L 162-22-19). Paris: Ministère des affaires sociales et de la santé; 2013. [Google Scholar]
- 6. Holstein J, Farge D, Taright N, et al. Hospital LOS, medical complexity and deprivation indicators. Rev Epidemiol Sante Publique. 2009;57(3):205–11. [DOI] [PubMed] [Google Scholar]
- 7. Windenberger F, Rican S, Jougla E, Rey G. Spatiotemporal association between deprivation and mortality: trends in France during the nineties. Eur J Public Health. 2012;22(3):347–53. [DOI] [PMC free article] [PubMed] [Google Scholar]
- 8. Ghosn W, Kassie D, Jougla E, Rican S, Rey G. Spatial interactions between urban areas and cause-specific mortality differentials in France. Health Place. 2013;24:234–41. [DOI] [PubMed] [Google Scholar]
- 9. Raguin G, Sivignon F. Précarité et maladies infectieuses. Rev Méd Interne. 2009;30(Suppl 2):S3–S5. [Google Scholar]
- 10. Sass C, Guéguen R, Moulin JJet al. Comparison of the individual deprivation index of the French health examination centres and the administrative definition of deprivation. Santé Publique. 2006;18(4):513–22. [DOI] [PubMed] [Google Scholar]
- 11. Bihan H, Laurent S, Sass C, et al. Association among individual deprivation, glycemic control, and diabetes complications: the EPICES score. Diabetes Care. 2005;28(11):2680–85. [DOI] [PubMed] [Google Scholar]
- 12. Nahon S, Lahmek P, Saas C, et al. Socioeconomic and psychological factors associated with nonadherence to treatment in inflammatory bowel disease patients: results of the ISSEO survey. Inflamm Bowel Dis. 2011;17(6):1270–6. [DOI] [PubMed] [Google Scholar]
- 13. Bihan H, Takbou K, Cohen R, et al. Impact of short-duration lifestyle intervention in collaboration with general practitioners in patients with the metabolic syndrome. Diabetes Metab. 2009;35(3):185–91. [DOI] [PubMed] [Google Scholar]
- 14. Convers M, Langeron A, Sass Cet al. Is the socioeconomic deprivation EPICES score useful in obstetrics? Gynecol Obstet Fertil 2012;40(4):208–12. [DOI] [PubMed] [Google Scholar]
- 15. Roussel A, Michel M, Lefevre-Utile A, De Pontual L, Faye A, Chevreul K. Impact of social deprivation on length of stay for common infectious diseases in two French university-affiliated general pediatric departments. Arch Pediatr. 2018;25(6):359–64. [DOI] [PubMed] [Google Scholar]
- 16. Labbe E, Blanquet M, Gerbaud L, et al. A new reliable index to measure individual deprivation: the EPICES score. Eur J Public Health. 2015;25(4):604–9. [DOI] [PubMed] [Google Scholar]
- 17. Pardo-Crespo MR, Narla NP, Williams AR, et al. Comparison of individual-level versus area-level socioeconomic measures in assessing health outcomes of children in Olmsted County, Minnesota. J Epidemiol Community Health. 2013;67(4):305–10. [DOI] [PMC free article] [PubMed] [Google Scholar]
- 18. Epstein AM, Stern RS, Tognetti J, et al. The association of patients’ socioeconomic characteristics with the length of hospital stay and hospital charges within diagnosis-related groups. N Engl J Med. 1988;318(24):1579–85. [DOI] [PubMed] [Google Scholar]
- 19. Mathy C, Bensadon M. Le surcoût de l'hospitalisation des patients précaires. J Econ Méd. 2002;20(5):263–78. [Google Scholar]
- 20. De Brasi D, Pannuti F, Antonelli F, de Seta F, Siani P, de Seta L. Therapeutic approach to bronchiolitis: why pediatricians continue to overprescribe drugs? Ital J Pediatr. 2010;36:67. [DOI] [PMC free article] [PubMed] [Google Scholar]
- 21. Cheung CR, Smith H, Thurland K, Duncan H, Semple MG. Population variation in admission rates and duration of inpatient stay for bronchiolitis in England. Arch Dis Child. 2013;98(1):57–9. [DOI] [PubMed] [Google Scholar]
- 22. Nishino Y, Gilmour S, Shibuya K. Inequality in diabetes-related hospital admissions in England by socioeconomic deprivation and ethnicity: facility-based cross-sectional analysis. PLoS One. 2015;10(2):e0116689. [DOI] [PMC free article] [PubMed] [Google Scholar]