Abstract
Cone snail venoms contain a wide variety of bioactive peptides, including insulin-like molecules with distinct structural features, binding modes, and biochemical properties. Here, we report a fully active humanized cone snail venom insulin with an elongated A chain and a truncated B chain, and use cryo-electron microscopy and protein engineering to elucidate its interactions with the human insulin receptor ectodomain. We reveal how an extended A chain can compensate for deletion of B-chain residues, which are essential for activity of human insulin but also compromise therapeutic utility by delaying dissolution from the site of subcutaneous injection. This finding suggests approaches to developing improved therapeutic insulins. Curiously, the receptor displays a continuum of conformations from the symmetric state to a highly asymmetric low-abundance structure that displays novel coordination of a single humanized venom insulin using elements from both of the previously characterized site-1 and site-2 interactions.
INTRODUCTION
Insulin is a conserved peptide hormone found in all animals1. In vertebrates, including fish and human, insulin is secreted as a hexamer that dissociates into a dimer, then a monomer, in order to bind and activate the insulin receptor (IR). Unlike physiological release of insulin from pancreatic β cells, subcutaneous injection results in relatively slow dissolution to the monomer, which can delay diffusion and compromise effective glucose control in people with diabetes2,3. Designing insulin analogs that do not form dimers and hexamers has proven challenging because the region affecting dimerization—near the C terminus of the B chain—is also critically important for IR activation4. Consequently, removal of residues that mediate dimerization—such as in desoctapeptide insulin (DOI, which lacks the last eight residues of the B chain)—results in a near complete loss of biological activity5.
The ~1,000 extant species of marine cone snails utilize complex venoms to capture prey, which can include fish, worms or other snails6. The majority of cone snail toxins target ion channels in the prey’s nervous and locomotor system to elicit rapid paralysis7. We previously showed that some species additionally use insulin as part of their toxin arsenal. Venom insulins rapidly bind and activate the prey’s insulin receptor (IR) and, consequently, induce dangerously low blood glucose levels, rendering the envenomated animal unable to escape8. Venom insulins have hence evolved unique structure-function properties that enable very fast action. We recently showed that these features can inform the design of fast-acting insulin-based drug leads for the treatment of type-1 diabetes9, a disease for which daily insulin injection remains the only effective treatment. Venom insulins from fish-hunting cone snails of the Gastridium clade, Conus geographus and Conus tulipa, lack eight residues at the B-chain C terminus—which, in vertebrate insulins, mediate both dimerization and receptor binding4—yet are able to activate the fish and human IR10,11. Structure-function studies revealed that receptor activation is facilitated by two aromatic residues in the B chain that act as surrogates for the missing C-terminal residues11, and by two mutations in a loop in the A chain. Subsequently, we reported that another venom insulin (Con-Ins K1) from Conus kinoshitai, a divergent fish-hunting species of the Afonsoconus clade, also activates fish and human IR but contains neither the B-chain C-terminal residues nor aromatic substitutes in the B chain10. Instead, unlike any other reported insulin in nature, C. kinoshitai insulin displays a four-amino-acid C-terminal elongation of the A chain. We therefore proposed that, in the absence of the B-chain C-terminal residues, the elongated A chain provides an alternative mechanism for receptor activation10.
Here, we identify several additional venom insulins with varying A-chain elongations, use these sequences to generate a panel of human-venom insulin hybrid analogs lacking B-chain C-terminal residues, and investigate their ability to activate the human IR. In particular, the venom-insulin hybrid (Vh-Ins) analogs, Vh-Ins-HALQ and Vh-Ins-HSLQ (Vh-Ins-H(A/S)LQ), lack the human B-chain residues that mediate insulin dimerization but display activity similar to that of human insulin. Using electron cryo-electron microscopy (cryo-EM), we determined structures of the IR ectodomain in complex with up to four Vh-Ins-HSLQ molecules. This revealed how residues at the A chain C terminus compensate for loss of the B-chain interactions with IR. These findings establish a new paradigm for IR engagement and provide a basis for designing next-generation insulin therapeutics with improved properties, including potential for ultra-rapid action. Moreover, the cryo-EM analysis revealed conformational dynamics within the Vh-Ins:IR complex and a novel binding mode that may be relevant for signaling.
RESULTS
Sequencing and analysis of cone snail venom insulins
Sequencing venom gland transcriptomes of the fish hunters Conus laterculatus and Conus mucronatus from the Phasmoconus clade, identified four new venom insulins, two from each species. Molecular phylogenetics closely grouped these sequences with other cone snail venom insulins, particularly with those from other fish-hunting species (Fig. 1a, red lines). In line with previous observations12, endogenous snail signaling insulins group separately and are less diversified (Fig. 1a, black lines). Aligning with nomenclature for cone snail venom insulins8, the new sequences were named Con-Ins La1 and Con-Ins La2 for the insulins from C. laterculatus, and Con-Ins Mo1 and Con-Ins Mo2 for the insulins from C. mucrontatus. All four precursor sequences have the canonical organization of human preproinsulin, with an N-terminal signal sequence, followed by three regions encoding respectively the B chain, the C peptide(s), and the A chain (Extended Data Fig. 1). Proteolytic processing of the venom preproinsulins is predicted to yield mature venom insulins with the same cysteine framework and disulfide connectivity as vertebrate insulin (Fig. 1b–c). All four sequences lack residues at the B chain C terminus that are critical for receptor activation in vertebrate insulin and the aromatic residues important for receptor binding by other venom insulins, including the C. geographus venom insulin Con-Ins G18 (Fig. 1d).
Fig. 1 |. Alignment of insulin sequences.
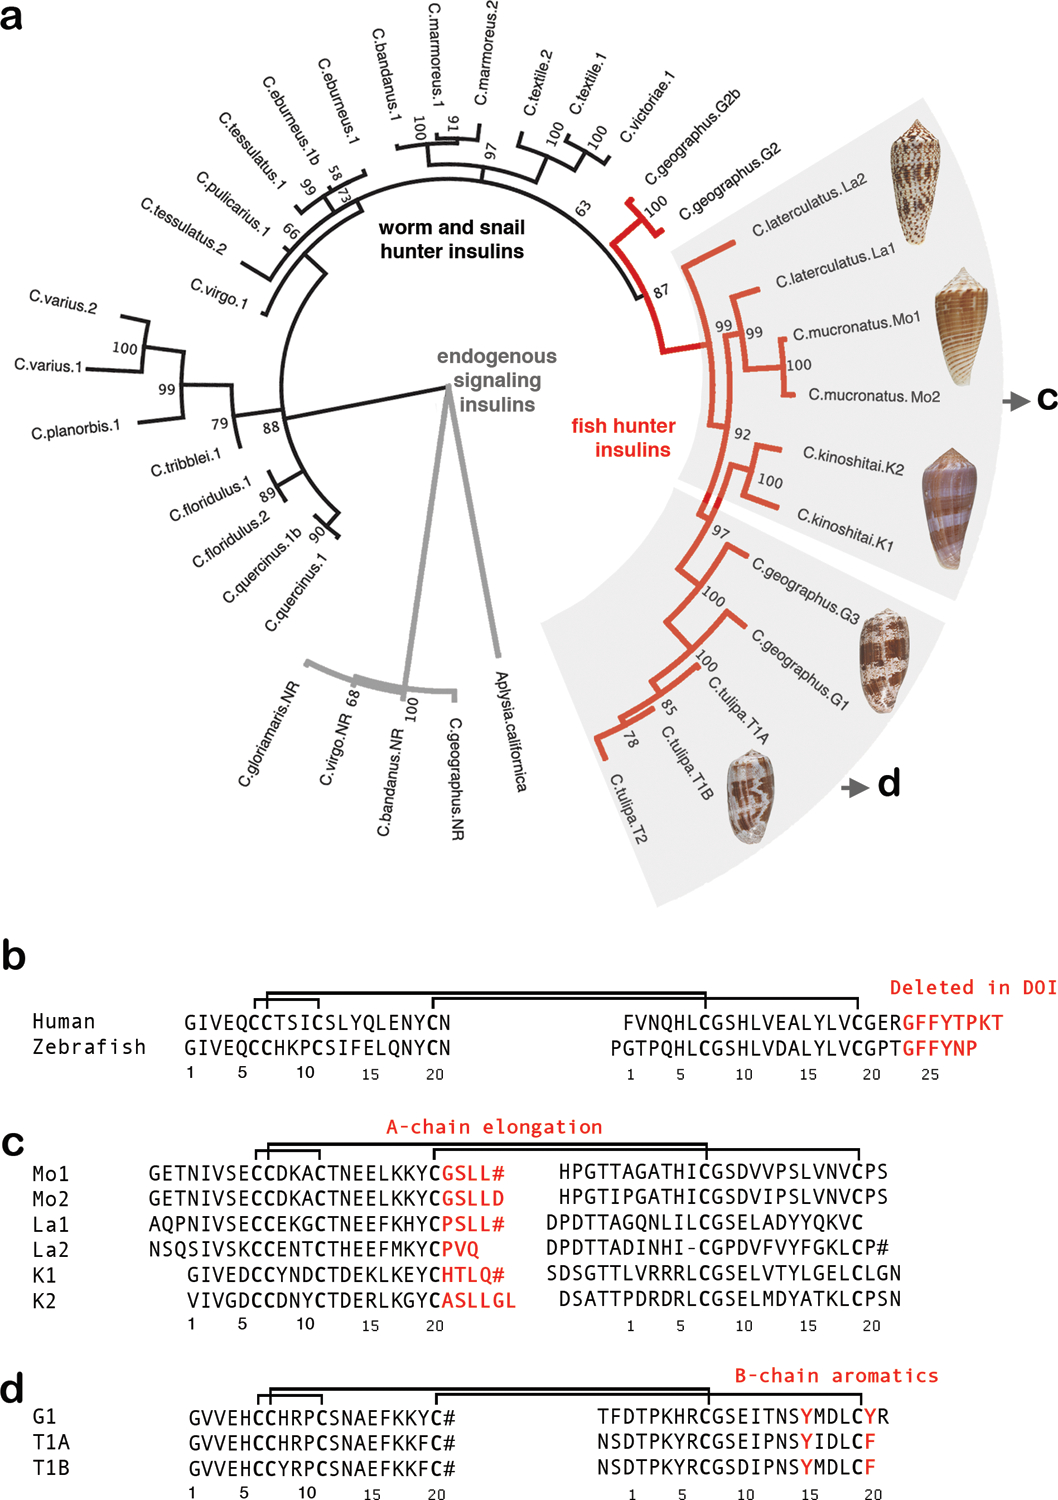
a, Molecular phylogenetics closely groups the newly identified venom insulin sequences with venom insulins previously identified from other fish hunters (red branches in tree). Tree branches of venom insulins from snail and worm-hunters are shown in blue, and those of endogenous signaling insulins are black. b, Sequence alignment of human and zebrafish insulin c, Alignment of venom insulins sequenced here from C. mucronatus (Mo1 and Mo2) and C. laterculatus (La1 and La2) and previously from C. kinoshitai10 (K1 and K2). d, Alignment of venom insulins from C. geographus (G1) and C. tulipa (T1A and T1B)8. B-chain residues deleted in DOI and important for receptor-binding and dimerization (b) or residues unique to venoms and predicted to bind insulin receptor (c and d) are in red. Cysteines are in bold. Disulfide connectivity is shown as black lines. # indicates C-terminal amides.
Strikingly, all the new venom insulin sequences have A chain C-terminal extensions (-GSLL#, -GSLLD, -PSLL#, -PVQ, -HTLQ#, and -ASLLGL (Fig. 1c), where # represents C-terminal amides, a common and bioinformatically-predictable modification in cone snail toxins13). This suggests that C-terminal A-chain elongations play a role in IR activation in this family of venom insulins by functionally substituting for the missing B-chain residues of human (and fish) insulin. To investigate this hypothesis, we synthesized a panel of venom-human hybrid analogs (Vh-Ins) for functional and structural studies.
Design of insulin analogs with elongated A-chains
Because the six venom insulins all display anionic B10 and hydrophobic B20 residues (Fig. 1c), we incorporated GluB10 and LeuB20 mutations into human DOI and attached the respective A-chain elongation motifs from six venom insulins to create six Vh-Ins analogs (Fig. 2a). We measured AKT phosphorylation in IR-overexpressing NIH 3T3 cells to quantify insulin potency. Strikingly, four of the six Vh-Ins molecules with elongated A chains display potency comparable to human insulin (Fig. 2b) and are 400- to 800-fold more potent than DOI (Extended Data Fig. 2). These four potent Vh-Ins molecules all have serine at position A22 and leucine at position A23 within their elongation motifs. On the other hand, the analog containing the A-chain elongated sequence in C. kinoshitai venom, Vh-Ins-HTLQ, which has threonine instead of serine at position A22, has 11-fold lower potency than human insulin. To determine if ThrA22 is responsible for the reduced potency, we mutated it to serine and found that Vh-Ins-HSLQ has equal potency to human insulin (Fig. 2c), thereby verifying the importance of serine at A22. To understand better the importance of specific A-chain elongation residues, we performed alanine scanning mutagenesis on A21–24 in Vh-Ins-HTLQ. This revealed that individual AlaA21 or AlaA24 substitution gives slightly lower potency than Vh-Ins-HTLQ (Fig. 2c). In contrast, AlaA23 substitution gave greatly reduced bioactivity, while AlaA22 substitution displayed comparable bioactivity to human insulin. Two of the analogs—Vh-Ins-HALQ and Vh-Ins-HSLQ—showed potency similar to human insulin (Fig. 2c).
Fig. 2 |. Activities of venom-insulin hybrid (Vh-Ins) analogs based on cone snail venoms containing extended A-chain sequences.
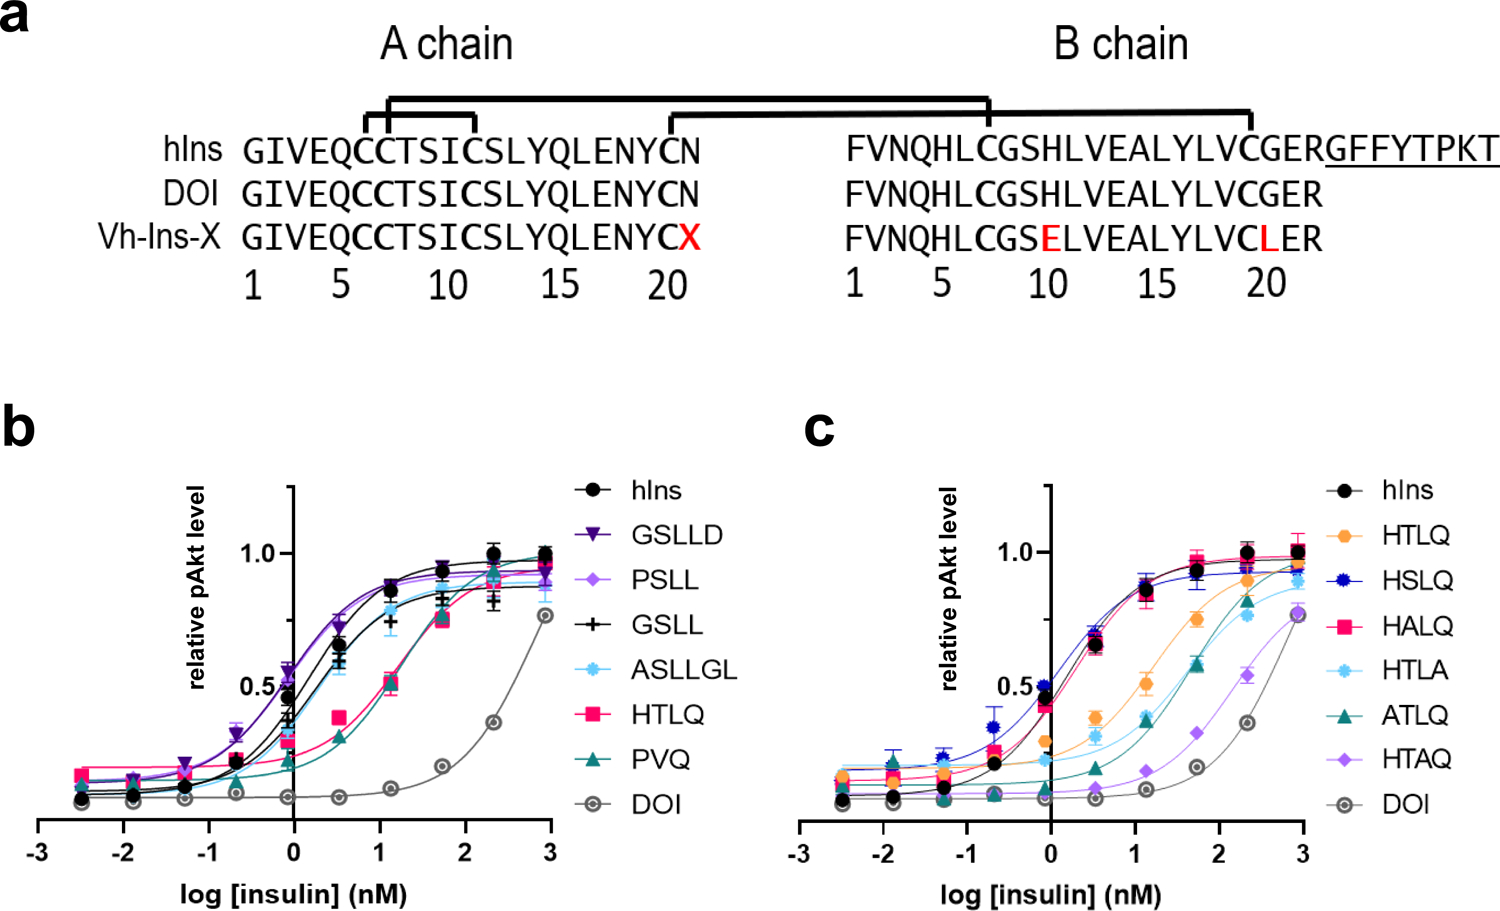
a, Sequences of human insulin, human DOI and venom-DOI hybrids. Red letters indicate altered sequence relative to human insulin, X represents the elongated A chain sequences in Fig. 1c. b, Cellular activities of Vh-Ins analogs as assessed by pAKT in NIH 3T3 cells overexpressing IR-B (all with B10E, B20L substitutions) with various elongated A-chain sequences from cone-snail insulins (without C-terminal amidation). Error bars are shown when greater than the size of the symbols. c, Cellular activities of Vh-Ins analogs with alanine substitutions. All sequences are without C-terminal amidation.
Structures of Vh-Ins-HSLQ:receptor ectodomain complex
To visualize molecular interactions between Vh-Ins-HSLQ and the IR, we used a receptor isoform A (IR-A) ectodomain construct purified from suspension-adapted HEK 293-F cells14. The purified ectodomain (hereafter “the receptor”) comprises wild-type residues 1 to 917 with a C-terminal linker and 8xHis tag. For cryo-EM structure determination, the receptor was incubated with Vh-Ins-HSLQ and applied to holey-carbon Cu grids. Movies were collected on a Titan Krios equipped with a Gatan K2 detector and energy filter. Our analysis focuses on three reconstructions: one of the symmetric insulin-binding “head” region (3.4 Å resolution), one from a subset of particles that additionally shows an ordered C-terminal “stalk” (4.1 Å resolution), and one of an asymmetric conformation (4.4 Å resolution; Fig. 3, Supplementary Figs. 1–3 and Supplementary Table 1).
Fig. 3 |. The symmetric Vh-Ins-HSLQ-receptor structure.
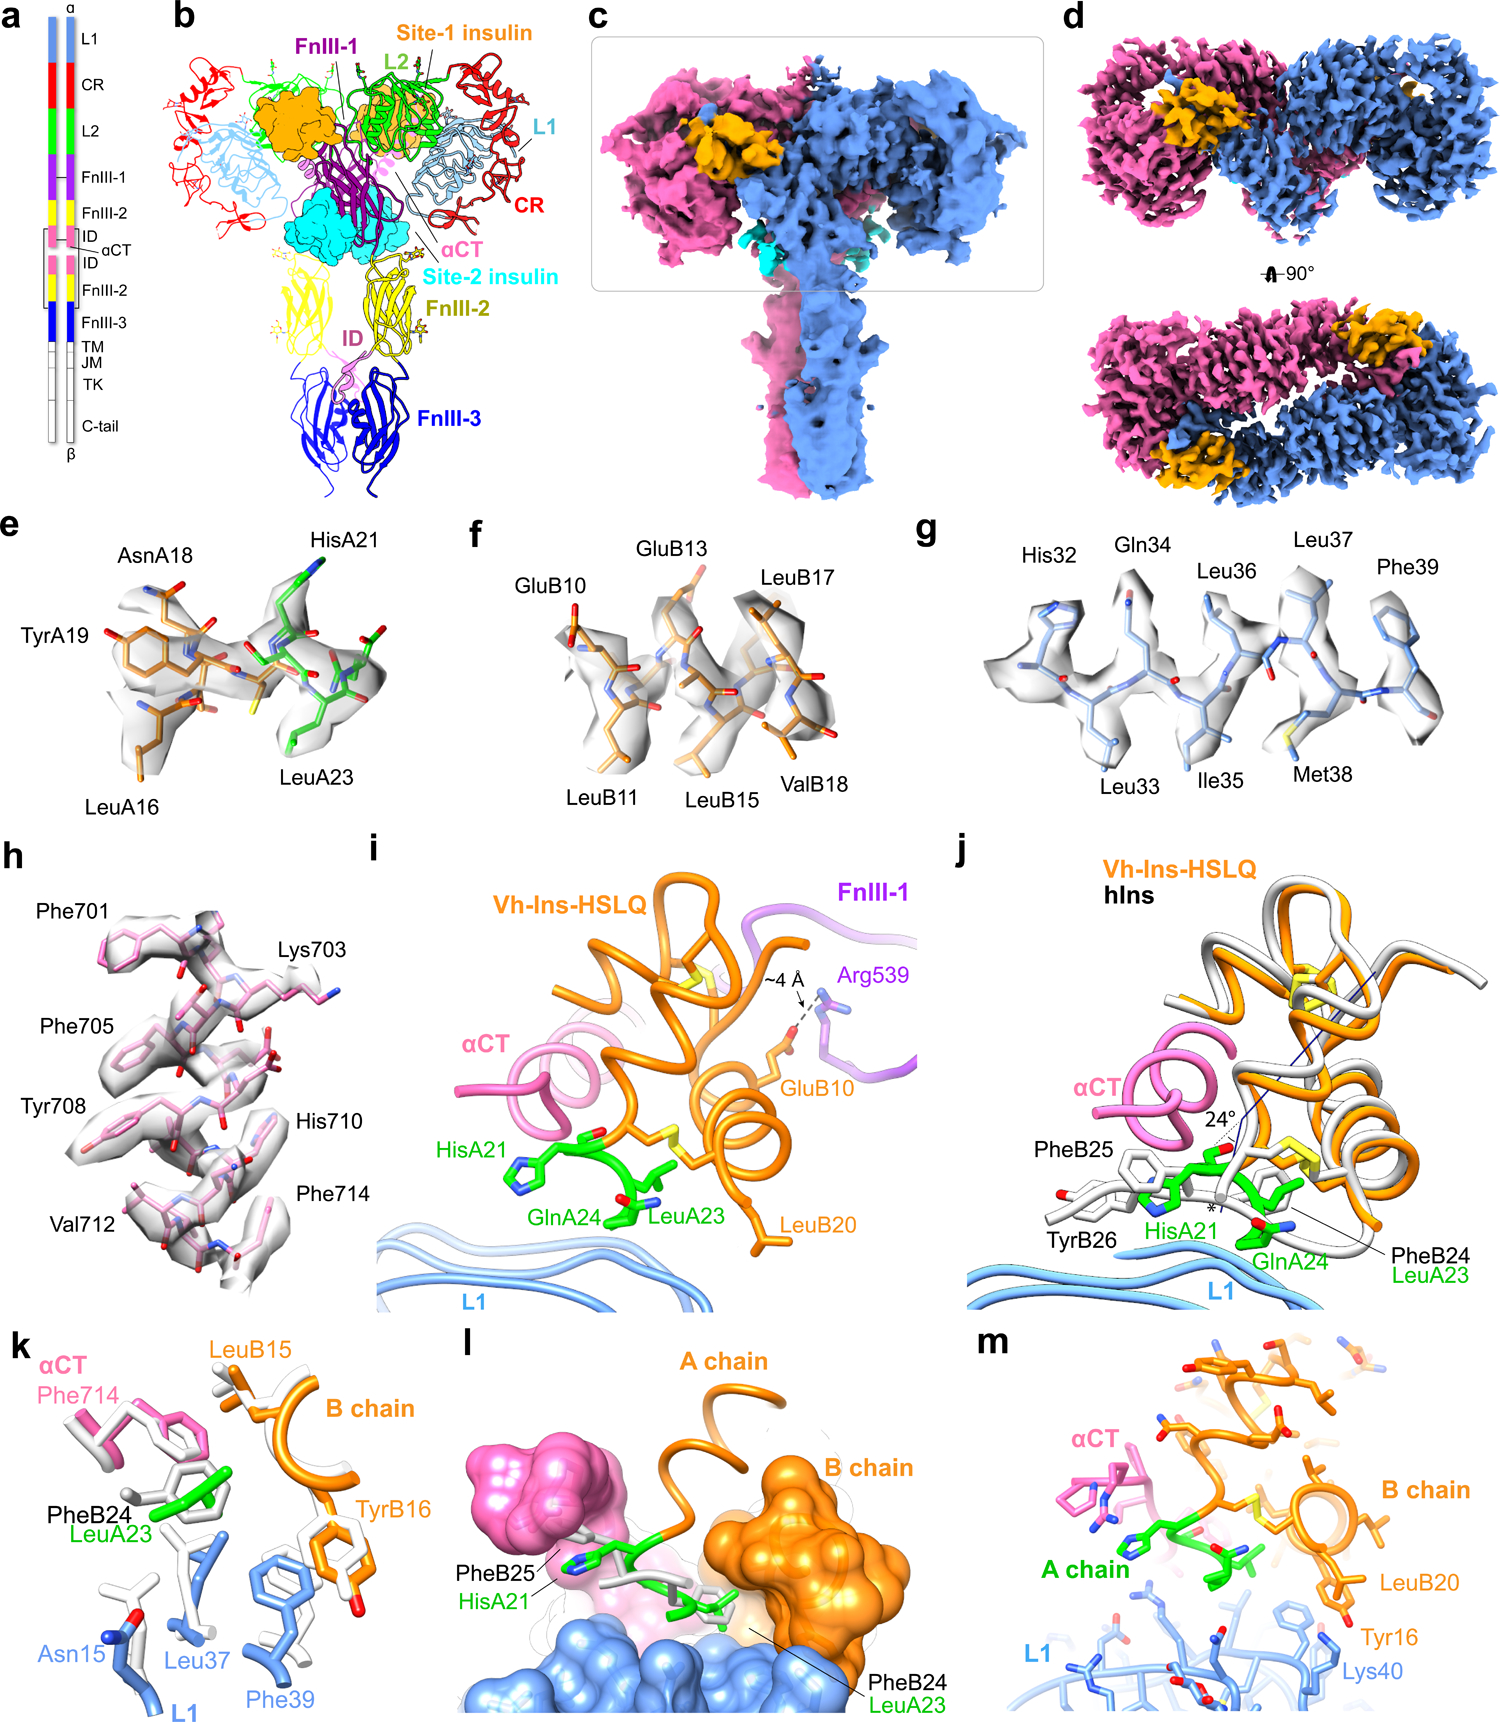
a, Schematic of the insulin receptor domains and disulfide connectivity. b, Structure of the insulin receptor ectodomain with four Vh-Ins-HSLQ molecules bound. Insulins are depicted in surface representation (orange, site 1; cyan, site 2). c, Consensus refinement density of the Vh-Ins-HSLQ-receptor complex (4.1 Å). Box indicates the region selected for focused refinement. Blue and pink, receptor protomers. Vh-Ins-HSLQ orange (site 1) and cyan (site 2). d, Focused refinement map. Site-2 insulins do not contribute significant signal relative to noise at the filter frequency used for the final reconstruction (3.4 Å). e-h, representative density and model for Vh-Ins A chain, Vh-Ins B chain, L1, and αCT residues, respectively. i, The extended A-chain residues (green) are in close proximity to the receptor αCT and L1 domains. LeuB20 contacts L1 and GluB10 interacts with FnIII-1. j, Comparison of site-1 Vh-Ins-HSLQ (orange) and human insulin (white, PDB 6PXW)16 aligned by superposition of L1 and αCT residues. Vn-Ins-HSLQ extended A-chain residues (green) contact the same receptor surface engaged by human insulin PheB24 and PheB25. The helix formed by Vh-Ins-HSLQ residues A13-A23 is kinked 24 ° away from αCT at HisA21 and slightly unwound. The human insulin A-chain C terminus is indicated with an asterisk. k, Vh-Ins-HSLQ LeuA23 binds a hydrophobic pocket in a similar fashion to human insulin PheB24. l, Surface representation of the pocket formed by αCT and L1 and binding by LeuA23 and PheB24. m, Vh-Ins-HSLQ LeuB20 packs against TyrB16 and approaches receptor Lys40.
Symmetric structure
The C2-symmetric structure, which is represented by most of the particles, explains our biochemical and biological findings with venom-derived insulins. This reconstruction is essentially as reported previously (Fig. 3a–b) for IR in complex with two or more human insulin molecules14–16. Density is apparent for four Vh-Ins-HSLQ molecules, one at each of the two symmetry-related site-1 positions and one at each of the two symmetry-related site-2 positions, although the two site-2 Vh-Ins-HSLQ moieties had weaker density and did not contribute notable high-resolution information in the final reconstructions, possibly due to greater flexibility (Fig. 3c–d).
The mode of binding of Vh-Ins-HSLQ at site 1 and site 2 resembles that in previously reported structures of IR:insulin complexes14,16. Following overlay on surrounding receptor residues, the relative displacement of Vh-Ins-HSLQ Cα atoms at the site-1 positions ranges from 0.3 Å to 0.9 Å (B5-B18; A1-A20) compared to insulin-IR complexes (PDB entries 6HN5, 6PXW and 6SOF)14,16,17. Essentially all IR contacts of residues that are common to insulin and Vh-Ins-HSLQ are retained, although several residues unique to either human insulin or Vh-Ins-HSLQ are found at the site-1 interface. Similarly, alignment of IR residues surrounding site 2 show a relative Cα displacement of Vh-Ins-HSLQ versus insulin of 0.5 Å to 2.6 Å (PDB entries 6PXW and 6SOF)14,16, indicating that contacts at site 2 are also largely conserved. In notable contrast to site 1, however, there is almost no change in residue identity between insulin and Vh-Ins-HSLQ at the site-2 interface (Extended Data Fig. 3). Consequently, our analysis of the Vh-Ins-HSLQ interaction focuses primarily on binding at site 1.
Vh-Ins-HSLQ binding at site 1
Vh-Ins-HSLQ, like insulin, binds site 1 through contacts with the receptor L1 domain, αCT, and a loop near the periphery of FnIII-1 (Fig. 3i). The structure reveals how the Vh-Ins-HSLQ A-chain C-terminal elongation compensates for loss of C-terminal B-chain residues. In particular, the new LeuA23 side-chain projects into the receptor pocket otherwise occupied by insulin PheB24, with LeuA23 aligning with one side of the PheB24 benzyl ring (Fig. 3j–l). Despite the resulting difference in docking residue coordination, the conformations and positions of the residues that form this pocket are virtually unchanged compared to human insulin complexes16 (Fig. 3k).
The role of PheB24 and surrounding residues in receptor binding has been characterized through extensive mutagenesis18–20. The equivalent roles seen here for Vh-Ins-HSLQ LeuA23 and insulin PheB24 align with the broader set of hydrophobic side chains that are compatible with receptor recognition at this site. An insulin analog with PheB24 substituted by cyclohexylalanine retained full affinity for IR in competition binding assays, as did substitution of PheB24 by methionine19. Substitution by other hydrophobic residues at B24, showed a preference for side chains larger than alanine, which gave 300-fold weaker affinity than the native phenylalanine. LeuB24 and IleB24 substitutions had similar (~2–3 fold lower) affinities to PheB24, whereas the larger hydrophobic residues tyrosine and tryptophan each had ~20-fold lower affinity than human insulin19. Consistent with structures of insulin-receptor complexes14–18, these data indicate that shape complementarity at B24 is important for binding19. PheA23 might be expected to mimic more exactly the binding of PheB24; however, Vh-Ins-HAFQ showed comparable activity to Vh-Ins-HALQ (Extended Data Fig. 4).
In addition to the extended A chain, LeuB20 and GluB10 substitutions are important for Vh-Ins analog activity, with GluB10 providing a three-fold improvement in the EC50 of Vh-Ins-HTLQ as assessed by AKT phosphorylation (Extended Data Fig. 2, Supplementary Table 2, comparing Vh-Ins-HTLQ, B20Gly with Vh-Ins-HTLQ, B10His, B20Gly). The mechanism of increased insulin receptor affinity for GluB10/AspB10 in the context of insulin X10 and related analogs21—and presumably in the Vh-Ins analogs presented here—was proposed to be due to a formation of a salt bridge between GluB10 and receptor Arg53917. Indeed, the Vh-Ins-HSLQ GluB10 carboxylate is situated near (~4 Å) Arg539 in our atomic model (Fig. 3i), indicating a moderate charge-charge interaction consistent with the expected modest increase in binding energy needed to drive a three-fold change in EC5022.
Substitution of native GlyB20 with LeuB20 also enhanced activity of Vh-Ins-HTLQ, providing a further ~two-fold improvement in the EC50 (Extended Data Fig. 2, Supplementary Table 2). The site-1 Vh-Ins-HALQ LeuB20 side chain excludes 27 Å2 of solvent accessible surface area at the receptor interface. Furthermore, LeuB20 might stabilize the helical binding conformation of B9-B20 due to the twin effects of its more restricted main chain and its side-chain contacts with TyrB16 (Fig. 3m). In human insulin, the conformational range of GlyB20 is important for the formation of a type-II β turn that allows B23-B30 to fold back against the B-chain helix when insulin is not bound to the receptor18. Because B23-B30 are not present in Vh-Ins-HSLQ, there is no functional requirement to maintain a glycine at B20. These observations suggest that this region of Vh-Ins may provide opportunity for further optimization of receptor contacts and stabilization of analog conformation.
Vh-Ins-HSLQ binding at site 2
Focused refinement of site 2 resulted in a reconstruction with an overall resolution of 3.9 Å and recognizable density for Vh-Ins-HSLQ (Extended Data Fig. 3, Supplementary Figure 4). Docking of FnIII-1 and site-2-bound insulin from published insulin-receptor structures14,16 into the site-2 density indicated no discernible difference in the positioning of Vh-Ins-HSLQ at site 2 relative to human insulin.
Residues previously determined to be important for insulin binding at site 2—namely, LeuA13 and LeuB1714,16—are conserved in Vh-Ins-HSLQ, and their interactions with the receptor appear the same as for human insulin. Neither the extended A chain nor LeuB20 approach the receptor at this site. The only other substitution relative to human insulin—GluB10—lacks side-chain density but may approach receptor residues Lys494 and Asp483. The impact of GluB10 on binding affinity at site 2 is unclear, although it is apparent that binding geometry is not substantially altered and that residues in the vicinity of GluB10 are poorly ordered in the structure. These observations support the inference that insulin substitutions within Vh-Ins are highly relevant for binding to site 1 but much less relevant for binding to site 2.
Receptor binding affinity
We performed fluorescence-based competition binding assays with Vh-Ins-HALQ to determine its relative affinity for both full-length IR (Fig. 4a) and full-length IGF-1R (Fig. 4b) that were detergent-solubilized and immobilized. These assays revealed that Vh-Ins-HALQ has full, human-insulin-like affinity for both IR and IGF-1R (Supplementary Table 3). The IGF-1R affinity is notable in the context of the GluB10 mutation present in Vh-Ins-HALQ because previous investigations of insulin variants containing anionic side chains at B10 found a higher affinity for IGF-1R relative to human insulin21. In contrast, we find that Vh-Ins-HALQ has human-insulin-like binding affinity for both IR and IGF-1R.
Fig. 4 |. Receptor binding affinity.
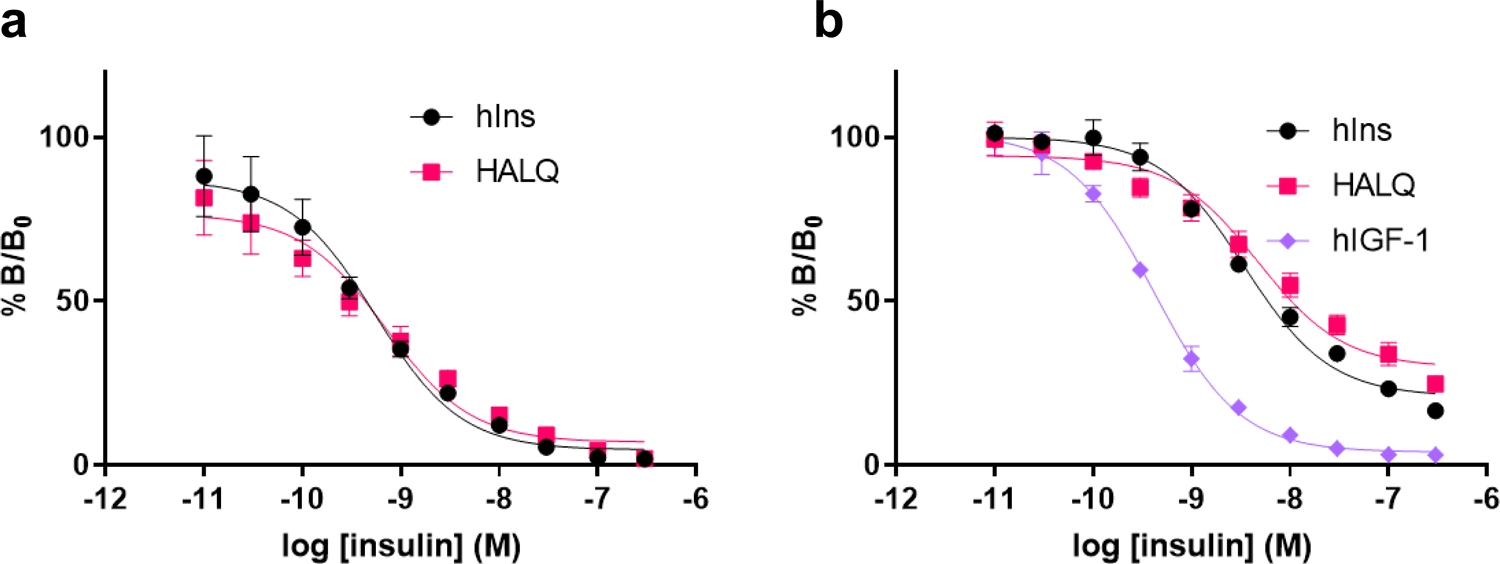
a, Competition binding assays of human insulin and Vh-Ins-HALQ to solubilized and immobilized insulin receptor (IR-B). Note that IR-B generally binds insulin and analogs with similar affinity to IR-A33. Each data point represents the mean of three assays. Error bars (s.e.m.) are shown. b, Type 1 IGF receptor competition binding assay of human insulin, hIGF-I and Vh-Ins-HALQ. Each data point represents the mean of two assays (each with three technical replicates). Error bars (s.e.m.) are shown. Results in a and b are expressed as a percentage of binding in the absence of competing ligand.
Vh-Ins binding to the same soluble IR ectodomain construct used for cryo-EM and the IGF-1R ectodomain was further assessed by nano-differential scanning fluorimetry (nanoDSF) using a label-free approach (Extended Data Fig. 5). While Vh-ins-HALQ addition led to a change in the thermal stability of IR-ECD similar to that of human insulin, IGF-1R-ECD stability was not affected. Further validation of Vh-Ins-HALQ affinity for receptor ectodomains in solution was conducted by microscale thermophoresis, which indicated human-insulin-like affinity for IR but reduced affinity for IGF-1R compared to human insulin. Note that reduced affinities for IR and IGR-1R constructs that lack the transmembrane domains is a known phenomenon 23,24.
Binding to site 1 was also investigated using isothermal titration calorimetry to determine the affinity of Vh-Ins-HALQ for the minimized ectodomain receptor construct (IR485) comprising the three N-terminal IR domains L1, CR and L225 bound to the IR-A αCT peptide (receptor residues 704–719). Consistent with published work4,9, binding of human insulin was ~60-fold weaker in this assay (Kd 3.5 ± 0.5×10⁻⁸ M) than with immobilized full-length receptor, while binding affinity of Vh-Ins-HSLQ was 10-fold weaker (Kd 34.7 ± 4.7×10⁻⁸ M). The inability of the model construct used in this assay to recapitulate the GluB10-Arg539 interaction (due to the absence of domain FnIII-1) might underlie the weaker binding of Vh-Ins-HALQ relative to human insulin. Nevertheless, consistent with the compensating interaction seen in the structure, Vh-Ins-HALQ displays 24-fold tighter binding than DOI (Supplementary Table 4).
Dynamic conformations of Vh-Ins-HSLQ-receptor complexes
Three-dimensional classification revealed a subset of particles that exhibited increased conformational heterogeneity relative to the symmetric state described above, appearing as a blurring of the head region of one of the two receptor protomers. CryoSPARC 3D variability analysis indicated that this subset displayed a continuum of conformations (Supplementary Fig. 1, right side),which was visualized by splitting the particles into eight groups based on their latent coordinates. Subsequent 3D reconstructions produced a series of maps of 6–7 Å resolution (Fig. 5a) in which most of the variability is displayed by just one of the two receptor protomers. The distribution of particles along the latent coordinate space can be inferred from Supplementary Figure 5, with more particles falling into the center and relatively few at either the asymmetric or symmetric extremes of the trajectory. Note, however, that this distribution should not be taken to imply an energy landscape due to the prior exclusion of some particles by 2D and 3D classification (Supplementary Fig. 1). At one extreme, conformations in this trajectory approach our symmetric state (Fig. 3) and published insulin receptor complex structures with two or more insulins14–16. (Fig. 5c). The other most asymmetric extreme of the trajectory reveals three bound Vh-Ins-HSLQ molecules and bears some resemblance to some other previously reported structures15, including an “intermediate state” for the interaction between human receptor ECD and human insulin (EMD-10311)14 (Fig. 5b). Remarkably, however, unlike other reported asymmetric structures, both receptor protomers are ordered with one protomer closely resembling the apo receptor structure26 and the other protomer resembling the symmetric complex14–16 (Extended Data Fig. 6). The protomer that resembles the symmetric structure binds Vh-Ins-HSLQ as expected at site 1 and site 2 (Fig. 5b). In contrast, the apo-like protomer displays novel binding of a Vh-Ins-HSLQ molecule at a composite site that includes features of both site 1 and site 2 (Fig. 5d–e). Notably, the membrane proximal residues occupy essentially identical positions in the symmetric and asymmetric conformations, which implies that the asymmetric state is sufficient for receptor activation and signaling. However, it is important to acknowledge that the isolated receptor ectodomain does not display the negative cooperativity observed for the full-length receptor. Therefore, details of the physiologically-relevant stoichiometry and the possibility of lower stoichiometric states that display the hybrid site-1/2 interaction are questions for further study.
Fig. 5 |. Conformational heterogeneity in Vh-Ins-HSLQ-receptor reconstructions.
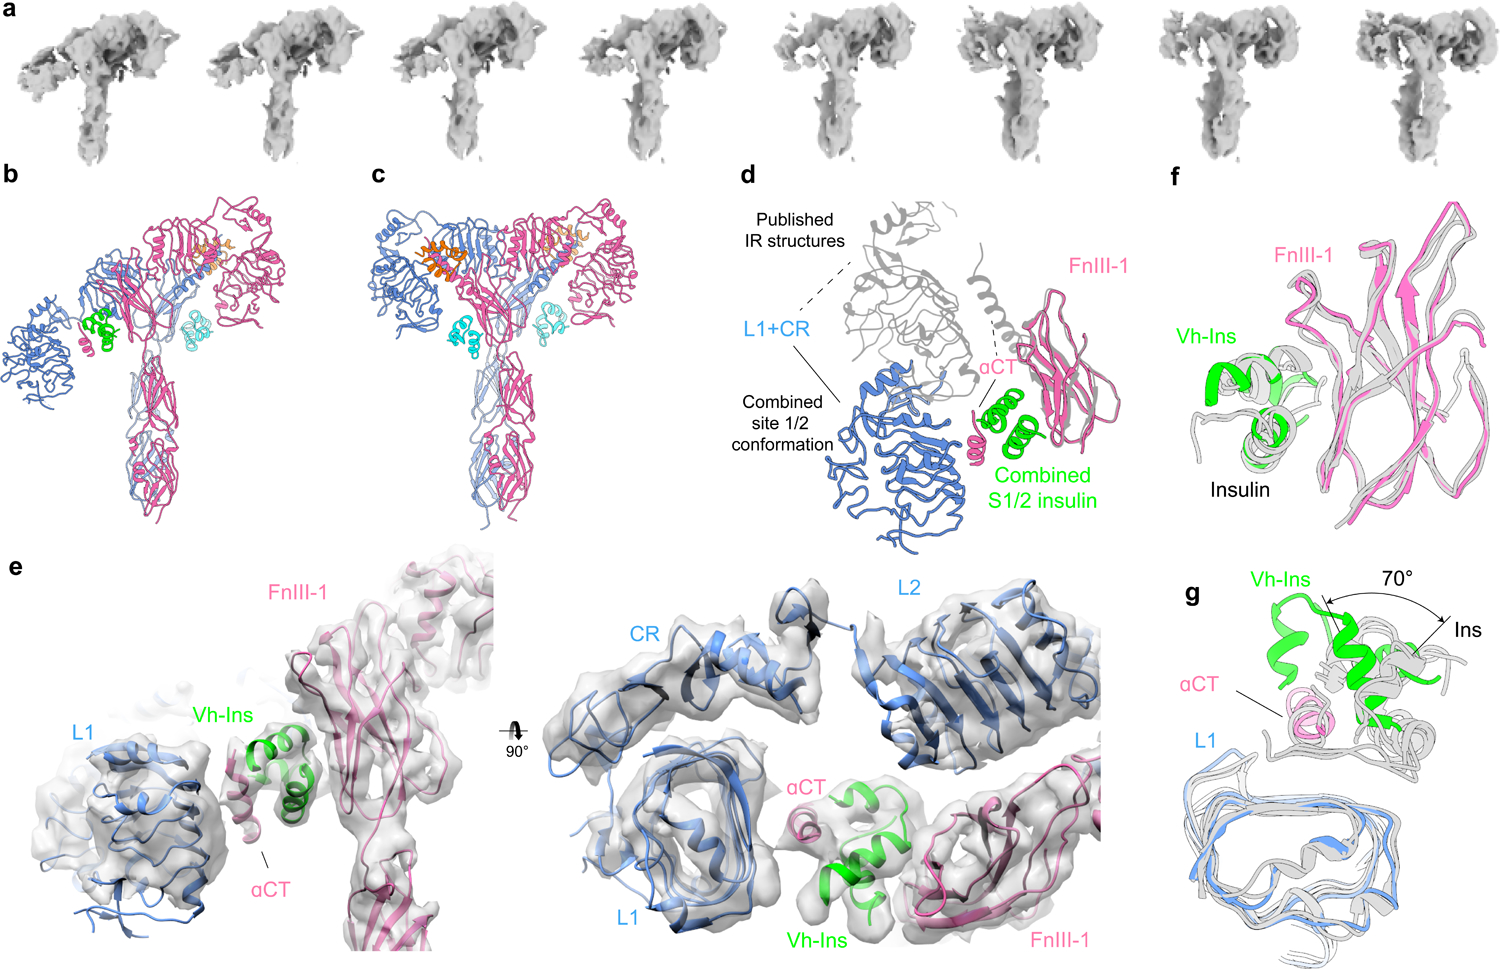
a, The conformational trajectory solved by 3D variability analysis depicted as a series of eight maps b, Model of the most asymmetric extreme. Three Vh-Ins-HSLQ molecules are bound. Site-1 (orange) and site-2 (cyan) positions are occupied for the right-hand “up” protomer of the receptor in the same manner as the symmetric conformation (Fig. 2). One Vh-Ins-HSLQ is bound to the left-hand “down” protomer of the receptor at the combined 1/2 site (green) that approximates a combination of site-1 and site-2 interactions. c, Model of the conformational state that most closely resembles a two-fold symmetric ectodomain complex, built into a 6.0 Å map. Vh-Ins is apparent at both site 1 positions (orange) and for site-2 Vh-Ins (cyan). d, Apparent motion of L1, CR and αCT when site-1 and site-1/2 structures are superimposed on the FnIII-1 domains. e, 4.4 Å map and model of the asymmetric conformation and the combined site 1/2. The resolution is sufficient to model the location and orientation of all domains, although the register of the αCT helix is not clear. f, Comparison of site-2-bound human insulin (PDBs 6SOF14, 6PXW16) with Vh-Ins-HSLQ at the combined site-1/2 position following structural alignment with the FnIII-1 domain g, Comparison of site-1-bound human insulin (PDBs 6HN517, 6SOF14, 6PXW16) with Vh-Ins-HSLQ at the combined site-1/2 position following structural alignment with the L1 domain.
Reconstruction of the asymmetric conformation was further improved to an overall resolution of 4.4 Å using Topaz27 to increase the number of picked particles, followed by focused 3D classification in Relion28 (Supplementary Fig. 1). This revealed that the site-2 interface of the novel Vh-Ins-HSLQ interaction is indistinguishable from that of the canonical site 2 in the symmetric structure (Fig. 5f). In contrast, some differences in the site-1 like interactions are apparent in the relative positioning of Vh-Ins-HSLQ/insulin and αCT with respect to the L1 domain. In particular, Vh-Ins-HSLQ (relative to L1) is rotated approximately 70° along the axis of the αCT helix (Fig 5g). Moreover, the αCT density is shorter than seen in site-1-bound structures, and is more consistent with αCT seen in the apo-IR crystal structure26. Unfortunately, the resolution is insufficient to assign conclusively the register of αCT, which differs between the apo and bound states of receptor site 14. Also of note is the close approach of the extended A-chain residues with αCT, which may allow interactions specific to Vh-Ins-HSLQ.
Although a reported human insulin:IRΔβ-Zip complex17 displays some similarity near the insulin-occupied site 1, the organization of the unoccupied site-1 domains within the opposing protomer (L1, CR, L2, αCT) is distinctly different, and the insulin:IRΔβ-Zip complex does not display a combined site-1/site-2 architecture nor any density for more than the single site-1 insulin molecule.
Vh-Ins-HALQ signaling response
Insulin can stimulate both metabolic and mitogenic responses through the PI3K/AKT and Ras/MAPK/ERK pathways, respectively. To characterize the signaling profile of Vh-Ins-HALQ, we measured IR and IGF-1R autophosphorylation and AKT/ERK activation in cultured human hepatoblastoma cells (Hep-G2) by western blot analysis. Vh-Ins-HALQ induced levels of receptor activation and ERK and AKT phosphorylation comparable to human insulin (Extended Data Fig. 7, Supplementary Fig. 6). These results were further supported in L6 myoblasts overexpressing IR-A, which also showed that the overall ratio of AKT/ERK phosphorylation induced by Vh-Ins-HALQ was the same as human insulin, indicating a native-like signaling profile with no bias towards AKT or ERK (Fig. 6a). To evaluate metabolic efficacy, an in vivo comparison between Vh-Ins-HALQ and human insulin (Humulin R) was evaluated in an insulin tolerance test. Subcutaneous administration of human insulin or Vh-Ins-HALQ (0.017 mg.kg−1) in streptozotocin-induced diabetic rats lowered blood glucose levels and reached similar nadir levels (~60 mg.dL−1) (Fig. 6b). These observations indicate that the metabolic potency of Vh-Ins-HALQ is similar to that of human insulin. As an additional assay of signaling response, the cell-proliferative potency of Vh-Ins-HALQ was assessed by DNA synthesis in L6 myoblasts over-expressing IR-A (Fig. 6c). We found that human insulin was slightly more potent than Vh-Ins-HALQ in its ability to induce DNA synthesis, indicating that Vh-Ins-HALQ may have the desirable property of being slightly less mitogenic than human insulin (insulin EC50 4.9 nM vs Vh-Ins-HALQ EC50 7.3 nM, 95% C.I.s 4.2–5.5 nM, 6.3–9.5 nM, p <0.001).
Fig. 6 |. Activity of Vh-Ins-HALQ relative to human insulin.

a, ERK(pThr202, pTyr204) and AKT(pThr308) signaling profile induced in L6 myoblasts by Vh-Ins-HALQ (pink) and human insulin (black). Data points here and in other panels represent the average of three experiments, and error bars (standard error of the mean) are shown when larger than the symbols. A representative western blot is shown. b, Insulin tolerance test in rats determined by the lowering of blood glucose following subcutaneous injection of 0.017 mg.kg−1 insulin or Vh-Ins-HALQ. c, DNA synthesis as response to concentration of insulin or Vh-Ins-HALQ is shown as percent incorporation of 5-Ethynyl-2’-uridine (EdU) above the basal level. Insulin vs Vh-Ins-HALQ *** p value <0.001 (2-way ANOVA, Dunnett’s multiple comparison test).
Self-association of Vh-Ins-HSLQ
The disruption of insulin self-association is one strategy that has been used to develop fast-acting insulin analogs—with some success in the cases of three widely used fast-acting insulin therapeutics: lispro29, aspart30, and glulisine31. To assess whether the deletion of the C-terminal eight residues on the B chain, which form critical components of the dimer interface, confers monomeric properties to Vh-Ins, we measured the solution self-association of Vh-Ins by sedimentation-velocity analytical ultracentrifugation (SV-AUC). The self-association states for Vh-Ins-HSLQ and the fast-acting insulin analog lispro were assessed in sterile diluent for Humalog and Humalin (Lilly) to match the conditions used in therapeutic formulations. As controls, DOI and recombinant human insulin (hIns) were used to measure the sedimentation coefficients of monomeric and oligomeric insulin respectively (Extended Data Fig. 8). The control DOI and hIns samples were run in phosphate buffer to visualize the hIns dimer and avoid aggregation (Extended Data Fig. 8a), however similar results for the DOI monomer and hIns hexamer were obtained in sterile diluent (Extended Data Fig. 9). Analysis of the SV-AUC data using a continuous c(s) model shows that at the assay concentration of 500 μg·ml−1, which is nearly 7-fold lower than the U-100 formulation (3.47 mg·ml−1), lispro is ~84% hexameric with a small population of lower-association states, including a monomer/dimer peak, whereas Vh-Ins-HSLQ is almost completely monomeric (Extended Data Fig. 8b). These results indicate that in typical insulin formulation conditions Vh-Ins-HSLQ has a much lower propensity for self-association than lispro, suggesting that Vh-Ins-HSLQ has potential as a therapeutic lead for improved fast-acting insulins.
DISCUSSION
Our earlier discovery that fish-hunting cone snails deploy insulins in their venom that rapidly induce hypoglycemia in prey has opened a potential avenue to overcome a critical challenge in the development of therapeutic insulins8,10. Specifically, the venom insulins have dispensed with residues near the B-chain C terminus of the hormone that, in mammalian insulins, mediate both the receptor binding essential for activity and the dimerization that makes human and therapeutic insulins slow acting when injected subcutaneously. Our earlier work demonstrated that an insulin analog inspired by a venom insulin from C. geographus maintains potency in the absence of the C-terminal B-chain residues through four substitutions in the core of the insulin structure9. Here, we report the discovery of additional, highly diverged venom insulins that use an alternative strategy to overcome loss of human insulin B-chain C-terminal residues—namely, the addition of residues at the C terminus of the A chain. Our protein engineering and structural studies demonstrate further that a variant human insulin based on these venom insulins with extended A chains has similar binding affinity and potency to human insulin and makes compensating receptor interactions that explain the retention of potency.
Our discussion of receptor interactions has focused on site 1, which displays substantially altered interactions due to the substitution of Vh-Ins-HSLQ residues at this interface relative to human insulin. In contrast, residues at the site-2 interface are essentially unchanged, with the minor exception of the poorly ordered GluB10. Inspection of site 1 explains how the variations in Vh-Ins-HSLQ substitute for the cognate interactions of insulin and also suggests approaches to further optimize Vh-Ins-H(A/S)LQ as a therapeutic lead compound. Most strikingly, LeuA23 in the A-chain extension substitutes for PheB24, which is within the part of the B chain removed in the fast-acting venom insulins. This substitution affirms earlier predictions derived from molecular dynamics simulations using the insulin-like peptide from the venom of C. kinoshitai (Con-Ins K1)10, from which Vh-Ins-HSLQ is derived. Our results, however, reveal notable differences from the molecular dynamics model of Con-Ins K1 relative to Vh-Ins-HSLQ binding at site 1, particularly in the overall positioning of Con-Ins K1 and αCT with respect to the receptor L1 domain (Supplementary Fig. 7). The substitution LeuB20 likely contributes to binding/potency through stabilizing the conformation of the B-chain helix relative to the cognate glycine residue, though perhaps also through a limited interaction with the receptor. Both of these effects might be further optimized by protein engineering.
Our finding that Vh-Ins-HALQ has very similar biological activity to human insulin (Fig. 6) is particularly interesting in light of the GluB10 mutation present in Vh-Ins-HALQ because previously studied insulin analogs with anionic side-chains and the B10 position, such as analog X1021, are reported to have increased mitogenic potential compared to analogs containing the native histidine. In contrast, Vh-Ins-HALQ appears to have no increased mitogenic potency as assessed by its AKT/ERK signaling profile and its equivalent potency with human insulin in the induction of DNA synthesis in cultured cells.
Our cryo-EM analysis revealed a symmetric 4:1 insulin:receptor complex and an asymmetric 3:1 complex. Moreover, a subset of particles are intermediates between these states, and thereby indicate dynamic receptor motions that underlie transitions between the asymmetric and symmetric conformations (Fig. 5, Supplementary Video 1). It seems probable that human insulin can induce an equivalent asymmetric structure with hybrid [site 1]-[site 2] coordination. Moreover, the [site 1]-[site 2] coordinated state observed here for the Vh-Ins-HALQ analog might reflect an intermediate in the binding of human insulin to its receptor if, as has been suggested32, insulin binds initially to site 2 and is then transferred to site 1. It is important to recognize however, that our studies have been performed with an ectodomain construct, whereas further structural insights might be derived from future studies that mimic a more authentic context, such as the full-length receptor embedded in lipid nanodiscs.
In summary, Vh-Ins-H(A/S)LQ is a minimized insulin that displays native-like in-vivo metabolic potency, receptor affinity, and signaling capability. Vh-Ins-H(A/S)LQ compensates for the lack of insulin B-chain C-terminal residues that are critical for human insulin binding to the receptor site 1 through a novel extended A chain that provides receptor contacts that mimic those of the human insulin B chain. Our cryo-EM structure shows that interactions at site 1 explain Vh-Ins-H(A/S)LQ activity, and our structural and functional data also demonstrate multiple opportunities for further optimization as a fast-acting insulin with the potential to improve therapeutic options for the treatment of diabetes.
METHODS
Sequencing of venom insulins
Total RNA was extracted from frozen venom glands of C. laterculatus and C. mucronatus using the Direct-zol RNA extraction kit (Zymo Research, Irvine, CA, USA) and stored in RNAlater (Thermo Fisher Scientific). cDNA library preparation and sequencing were performed by the University of Utah High Throughput Genomics Core Facility. RNA quality and quantity were determined on an Agilent 2200 TapeStation (Agilent Technologies). A dual-indexed library was constructed with the Illumina TruSeq Stranded mRNA Sample Prep Kit with oligo (dT) selection and average insert size ~150 bp. The library was validated on an Agilent 2200 TapeStation and using a qPCR assay (Kapa Biosystems Library Quantification Kit for Illumina). 125 cycle paired-end sequencing was performed on an Illumina HiSeq2000. Sequence read assembly and analysis was performed as described10. Following assembly, venom insulin transcripts were examined using the Map-to-Reference tool in Geneious (version 11.1.2). Sequences identified have been deposited into the GenBank Nucleotide Database (Accession Numbers: MW091321, MW091322, MW091323, MW091324).
Phylogenetic Analysis
Alignment of insulin sequences obtained here and retrieved from Genbank (Supplementary Table 7) was performed using ClustalW34 (cost matrix BLOSOM, gap open cost 10, gap extend cost 0.1). Signaling insulin from the sea hare Aplysia californica was used as an outgroup. A Bayesian tree was estimated by MrBayes 3.2.635 with four runs each of four Markov chains sampling every 200 generations. The likelihood score stabilized after 200,000 generations. The consensus tree was calculated after omitting the first 25% of the samples as burn-in.
AKT activation assay
pAKT Ser473 levels were measured in NIH 3T3 cells overexpressing human receptor isoform B (IR-B, gift from A. Morrione, Thomas Jefferson University). Cells were cultured in DMEM (Sigma Aldrich) with 10 % fetal bovine serum (Gibco), 100 U/mL penicillin-streptomycin (Thermo Fisher Scientific) and 2 mg·mL−1 puromycin (Thermo Fisher Scientific). For each assay, 40,000 cells and 100 μl per well, were plated in a 96-well plate with culture media containing 1 % FBS. 20 h later, 50 μl of recombinant human insulin (Gibco, A11382IJ) was pipetted into each well after removal of the original media. After 30-min, the insulin solution was removed and the homogeneous time-resolved fluorescence pAKT Ser473 kit (Cisbio, Massachusetts, USA) used to measure pSer473. Cells were treated with lysis buffer (50 μl per well) for 1 h under mild shaking. 16 μL of lysate was added to 4 μL of detecting reagent in a white 384-well plate. After 4 h, the plate was read in a Synergy Neo plate reader (BioTek, Vermont, USA).
CryoEM
IR ectodomain was prepared as described14, flash frozen in 50 mM HEPES, pH 7.5, 150 mM NaCl (HBS) for storage at −80°C and, upon thawing, centrifuged at 9391 rcf for 10 min at 4°C prior to dilution into TBS (25 mM Tris pH 8.5, 150 mM NaCl) to a receptor concentration of 0.9 μM. Vh-Ins-HSLQ was reconstituted in 10 mM Tris, pH 8, 0.03% NaN3 to a concentration of 0.85 mM, and combined with receptor solution 1:24 (vol:vol) to give a final Vh-Ins-HSLQ concentration of 34 μM, and incubated on ice for 30 min before application to grids.
Grids (Quantifoil, 300 and 400 copper mesh, R1.2/1.3 and R2/2) were glow discharged (25 mA, 25 s). 3 μL of complex was applied to grids, blotted for 3–6 s at 4°C, 80 % relative humidity, and flash frozen in liquid ethane using an FEI Vitrobot Mark II. Data were collected on a Titan Krios using a K2 Summit direct electron detector in counting mode with a GIF Quantum LS 967 energy filter with EPU version 2 (Supplementary Table 1).
Data processing (Supplementary Fig. 1) used Relion 3.1.028 and CryoSPARC v3.0-v3.236. Movies from three grids were combined. Motion correction (MotionCor237 in Relion) and patch CTF estimation (CryoSPARC) were followed by particle picking using Topaz27. 1.5 M particles were 2D classified using CryoSPARC. Selected classes (776 k particles) were 3D classified. Symmetric and asymmetric conformations were apparent, and processed independently. Following initial reconstruction using non-uniform refinement, particles were exported to Relion using pyem38 for rounds of Bayesian polishing and CTF refinement. Asymmetric particles were subjected to an additional round of alignment-free 3D classification in Relion using a mask around the dynamic region of the receptor. Classified particles with well-defined L1 + CR domains were imported back into CryoSPARC for final non-uniform refinement and reconstruction at 4.4 Å (Supplementary Fig. 1). For focused refinement of the head region, particles sets were further cleaned using 2D classification and multi-class ab-initio reconstructions prior to production of the final 3.4 Å volume using non-uniform refinement. To resolve the FnIII-1, −2 and −3 domains in the symmetric state, all particles following initial 2D classification and a single consensus refinement (in C2) were subjected to alignment-free 3D classification in Relion, and particles with resolved FnIII domains selected. Supervised heterogeneous refinement in CryoSPARC removed the dynamic/asymmetric conformational state, and remaining symmetric particles were refined in C2 using non-uniform refinement, giving a final resolution of 4.1 Å for the whole unmasked ectodomain. The models were built using Coot39, refined in Phenix40 using symmetry and secondary-structure restraints, and validated using MolProbity41. Figures were made using UCSF Chimera42 and UCSF ChimeraX43.
3D variability analysis on asymmetric particles with intermediates along the trajectory filtered to 8 Å resolution allowed visualization of particle subsets based on the continuous flexible motion observed in one of the two protomers (Supplementary Fig. 1, right side). Modelling of these conformations was performed using PDBs 4ZXB26 and 6PXV16 as starting points while making minimal changes to fit density. αCT was positioned at the combined site by docking 4ZXB and generating the symmetry-related protomer, which placed αCT in density consistent with a helix contacting Vh-Ins-HSLQ. Fitting was optimized using Coot39 and Phenix40.
Competition receptor binding assay
Competition binding assays of solubilized immunocaptured human insulin receptor (isoform B) or IGF-1R with europium-labelled human insulin or IGF-I and increasing concentrations of human insulin, hIGF-I or Vh-Ins-HALQ, were as described44. Time-resolved fluorescence was measured with 340-nm excitation and 612-nm emission filters on a Polarstar Fluorimeter (BMG Labtech). Mean IC50 values were calculated using Prism v7.01 (GraphPad Software) after curve fitting with nonlinear regression (one-site) analysis. Two (type 1 IGF receptor) and three (insulin receptor) independent assays were performed, each comprising three technical replicates per data point.
Isothermal titration calorimetry (ITC)
IR485 was prepared as described45. αCT peptide (IR-A residues 704–719) was synthesized by Genscript (USA). ITC experiments were performed using a MicroCal iTC200 instrument (Malvern Instruments) with the cell held at 25°C. Analysis was performed using the manufacturer’s software within Origin7 (version 7.0).
For titration of DOI against IR485 plus αCT, DOI was at 200 μM in 10 mM HCl, 25 mM Tris, 136 mM NaCl, 2 mM KCl, 0.02% sodium azide, (TBSA, pH 8.0). IR485 was 15 μM in TBSA with 150 μM αCT. Eleven injections were performed in each titration at 180 s intervals, with the first being 1.0 μl and subsequent injections being 2.54 μl. Five technical replicates were performed.
For titration of Vh-Ins-HALQ against IR485 plus αCT, Vh-Ins-HALQ was prepared at (i) 150 μM, (ii) 120 μM, and (iii) 100 μM for injection into IR485 in TBSA at (i) 12 μM with 120 μM αCT peptide, (ii) 10 μM in with 100 μM αCT, and (iii) 10 μM with 100 μM αCT, effectively providing three replicates.
Microscale thermophoresis
Vh-Ins-HALQ, hIns (Sigma-Aldrich, Cat# I2643, LOT SLBR9404V), and hIGF-1 (Sigma, Cat# I3769, LOT 067M4106V) binding to purified IR-ECD and IGF1R-ECD14 were analyzed by microscale thermophoresis (MST) as described14 except that all ligands were reconstituted in 10 mg·mL−1 sodium bicarbonate buffer and stored as single-use aliquots at −80°C until use. Briefly, 200 nM IR-ECD or IGF1R-ECD was labelled with 50 nM tris-nitriloacetic acid conjugated to NT647 (RED-tris-NTA; a kind gift of Jacob Piehler, University Osnabrück46) in HBS-T (50 mM Hepes, pH 7.5, 150 mM NaCl, 0.05% Tween-20) for 30 min in the dark at room temperature. 100-μM ligand stock solutions were prepared in 10 mg·mL−1 bicarbonate buffer and diluted in HBS-T. 10 nM IR-ECD or IGF1R-ECD (25% RED-tris-NTA-labelled protein) was incubated with respective ligands in HBS-T containing 1 mg·mL−1 L NaHCO3 in the dark at 4°C overnight. MST was performed in standard capillaries (MO-K022, Nanotemper Technologies) on a Monolith NT.115Pico (Nanotemper Technologies) at 25°C using the Pico-RED detector with 30% light-emitting diode power, medium MST power, recording 3 s before MST, 20 s MST on-time, and 1 s after MST. Data were analysed with MO.Affinity Analysis 2.2.7 software (NanoTemper Technologies). MST traces were considered only if the initial fluorescence matched ligand-free samples and if no signs of aggregation or adsorption were observed. Thermophoresis traces from 4 to 5 s on-time were used to calculate dissociation constants. Relative fluorescence difference ΔFnorm was plotted against the ligand concentration for dose-response plots. Nonlinear regression (one-site binding) was performed using Prism (version 9.1.2 for Windows, GraphPad Software) to determine the lowest Kd values. The concentration range within which the respective ligand does not impact the MST measurements (e.g., by impeding the non-covalent labelling, interacting non-specifically with the dye, inducing aggregation or adsorption to the capillaries) was determined by titrating the ligands against a RED-tris-NTA–labelled control peptide (comprising the octahistidine-tag and part of the HRV 3C protease cleavage site, i.e., 2HN-HHHHHHHHKLEVLF-CONH2).
Nano-differential scanning fluorimetry (nanoDSF).
nanoDSF was used to assess the conformational stability of ectodomains in the presence or absence of ligands in HBS. 0.8 μM IR-ECD or IGF1R-ECD was incubated with 3.2 μM respective ligand (Vh-Ins-HALQ, hIns (Sigma-Aldrich, Cat# I2643), or hIGF-1 (Sigma-Aldrich, Cat# I3769) for 1 h on ice. nanoDSF was performed with nanoDSF Grade Standard capillaries (PR-C002, NanoTemper Technologies) and a Prometheus NT.48 (NanoTemper Technologies). Thermal unfolding was monitored by recording intrinsic tryptophan fluorescence (emission at 350 and 330nm) during heating in a linear thermal ramp (1°C.min−1; 20°C to 95°C) with an excitation power of 100%. The fluorescence ratio F350/F330 was calculated and normalized to the maximal fluorescence ratio. The first derivative d(F350/F330)/dT was plotted against the temperature to visualize unfolding transitions.
Receptor autophosphorylation and signaling western immunoblots in Hep-G2 cells
Hep-G2 cells (ECACC Cat# 85011430, RRID:CVCL_0027) were maintained in MEM (no glutamine; Gibco, 21090–022) supplemented with 2 mM glutamine (Gibco, 25030–024), non-essential amino acids (Gibco,11140–035), and 10% (v/v) fetal calf serum (FCS; Gibco, 10270–098). Cells were seeded at a density of 4.5 × 10⁵ cells/ml in a 12-well cell culture plate (Cell Star, 665102). Next day, cells were washed with 1x PBS two times and medium was replaced with starvation medium, MEM (no glutamine; Gibco, 21090–022), 2 mM glutamine (Gibco, 25030–024), non-essential amino acids (Gibco,11140–035) and 0.1 % (w/v) cell culture tested BSA. After 24 h, medium was replaced with fresh starvation medium for 2 h. Before ligand stimulation, cell medium was again replaced with fresh starvation medium (1 ml/well). Cells were treated with human insulin (Sigma Aldrich, Cat# I2643) or analogs at the indicated concentrations and times, and incubated at 37°C, 5% CO2 for 5, 10, 20, and 30 min. Cells were washed twice with ice-cold PBS followed by the addition of 150 μL lysis buffer (50 mM HEPES, pH 7.4, 150 mM NaCl, 2 % NP-40, 0.2 % SDS, 1 mM EGTA, 20 mM beta-glycerophosphate, 2 mM activated Na3VO4, 10 μM E64 and 1X EDTA-free Roche protease inhibitor cocktail. Cells were scraped, incubated 10 min on ice, and transferred into pre-chilled tubes. Lysate was centrifuged at 16,000 g for 20 min at 4°C. Samples were boiled for 5 min, and visualized by SDS PAGE (4–12% Bis-Tris gels, MOPS SDS buffer; Thermo Fisher Scientific). Proteins were transferred to polyvinylidene difluoride membranes for immunodetection. Membranes were blocked overnight with 5% (w/v) non-fat dry milk powder in TBST (0.1% [v/v] Tween-20 in 20 mM Tris, pH 7.4, 150 mM NaCl) supplemented with phosphatase inhibitors (1 μM Na3VO4 and 20 μM β-glycerophosphate). The following antibodies were used for detection: monoclonal rabbit anti-phospho-IR beta (Y1150/1151) (19H7, Cell Signaling Technology, Cat# 3024, RRID:AB_331253), monoclonal rabbit anti-phospho-IGF-1 Receptor beta (Y980) (C14A11, Cell Signaling Technology, Cat# 4568, RRID:AB_2122279), and the secondary antibody goat anti-rabbit IgG (H+L; Bio-Rad Laboratories, Cat# 170–6515; RRID, AB_11125142) conjugated to horseradish peroxidase. Detection was performed using SuperSignal West Femto maximum-sensitivity substrate electrochemiluminescence substrate (Thermo Fisher Scientific) with a charge-coupled device imager (Imager 600; GE Healthcare). Band intensities were quantified using Fiji. Rectangular areas around bands were selected and histograms indicating the intensity of each band plotted. Figures were produced using ggplot247, dplyr48, gridExtra49 on Rstudio50 (R Core Team, 2020).
pAKT and pERK western immunoblots in L6 myoblasts
Induction of signaling was assessed by immunoblotting as described51. L6 myoblasts overexpressing IR-A (240,000 cells/well) were seeded in 6-well plates, grown to confluence (~48 hours), and stimulated with 10 nM human insulin or Vh-Ins-HALQ for different times. Lysates were precipitated with trichloroacetic acid, pH neutralized with 1M Tris pH8.0, separated on 10% SDS-PAGE, transferred to nitrocellulose membrane, and immunoblotted with primary antibodies for 16 h at 4 °C. Antibodies used were phospho-AKT (T308) (New England Biolabs #9275S), phospho p44/42 MAPK (ERK1/2) (T202/Y204) (New England Biolabs #9101S) and mouse anti-β-tubulin (Invitrogen #32–2600). β-tubulin was used as loading control for pAKT and pERK1/2 normalization. Quantitation of blots was performed using Image Studio Lite software. Activation was expressed as a percentage of the response to insulin at 10 min (three independent experiments).
Insulin tolerance test
Insulin tolerance tests were performed in 10-week-old STZ (65 mg.kg−1) diabetic Sprague-Dawley rats following a 3–4 h fast. Human insulin (Humulin R, Eli Lily) and Vh-Ins were reconstituted in 10 mg/ml sodium bicarbonate buffer and diluted in insulin diluent (Eli Lilly). Following baseline blood glucose measurements, diabetic rats were injected with either human insulin (0.017 mg.kg−1) or Vh-Ins (0.017 mg.kg−1) subcutaneously. Tail vein samples were obtained to assess blood glucose levels every 15 min over 210 min using a glucometer (Ascensia Contour BG monitors, Bayer HealthCare, IN). Animal protocols were approved by the local IACUC committee.
DNA Synthesis Assay
DNA synthesis assays were performed as described52 with some modifications. L6 rat skeletal myoblasts overexpressing human IR-A, were plated in a 96-well flat bottom plate (32 × 104 cells / well) and grown overnight at 37 °C under 5 % CO2 as described53. Cells were starved in SFM for 2 h prior to treatment with insulin or Vh-Ins-HALQ (0.01 – 300 nM) for 18 h in DMEM / 1 % BSA at 37 °C / 5% CO2. The cells were incubated with 10 μM of 5-Ethynyl-2’-deoxyuridine (EdU) for 4 h, washed with filtered PBS / 1% BSA, and fixed in dark for 15 min with 4% paraformaldehyde (PFA). Fixed cells were washed with PBS / 1 % BSA and permeabilized for 20 min with 0.5% Triton X-100. A click chemistry labelling cocktail (2 μM FAM-Azide 488 / 100 mM Tris pH 7.5 / 4 mM CuSO4 / 100 mM sodium ascorbate) was added to the cells for 30 min at room temperature in the dark. Finally, cells were washed thrice with PBS / 1 % BSA and fluorescence was measured using 485 nm excitation and 535 nm emission filters with a PerkinElmer VICTOR X4 2030 Multilabel Reader. Assays were performed in triplicate in at least three independent experiments.
Sedimentation velocity analytical ultracentrifugation
Sedimentation velocity analytical ultracentrifugation (SV-AUC) was performed using a Beckman Coulter XL-I centrifuge. Desoctapeptide insulin (DOI) was prepared from human insulin (hIns; Gibco A11382IJ) by trypsin digestion as described54. hIns (775 μg·mL−1) and DOI (100 μg·mL−1) were run as oligomerizing and monomeric controls, respectively, in phosphate buffer (137 mM NaCl, 2.7 mM KCl, 5.3 mM Na2HPO4, 1.8 mM KH2PO4, pH 7.4) using the absorbance optical system. Concentrations of samples in phosphate buffer were determined by absorbance at 280 nm using a NanoDrop Onec spectrophotometer. The hIns concentration of 775 μg·mL−1 was selected to better visualize the higher-order oligomers. DOI was run at the low end of the detection range to favor a monomeric state. Humalog (U100, insulin lispro injection) and sterile diluent (16 mg·mL−1 glycerol, 1.6 mg·mL−1 m-cresol, 0.65 mg·mL−1 phenol, 3.8 mg·mL−1 Na2HPO4, pH 7.4) were obtained from Lilly USA, LLC (Indianapolis, IN 46285, USA). Lyophilized Vh-Ins-HSLQ, hIns, and DOI were reconstituted in sterile diluent and dialyzed overnight against 100 sample-volumes of sterile diluent. Lispro samples were dialyzed against the sterile diluent prior to dilution with the dialysate. Concentrations of Vh-Ins-HSLQ, Lispro, DOI and hIns in sterile diluent were determined using a Direct Detect spectrometer (EMD Millipore, USA) in AM1 quantification mode. All AUC samples were spun at 50,000 RPM. Data collection using the absorbance optics was conducted with sample volumes of 408 μl in 12 mm path-length epon resin centerpieces with quartz windows. Data for analogs in sterile diluent were collected using the interference optics, 12 mm meniscus-matching epon centerpieces, and sapphire windows. 350 μl of dialysate was loaded into the reference chamber and 330 μl of insulin analog into the sample chamber. An initial spin at 3,000 rpm was conducted to match the menisci, after which samples were removed and mixed by gentle agitation prior to data collection. Data were collected for ~15 h (absorbance optics) or until the maximum number of scans had been recorded (interference optics, 999 scans with 30 second interval, ~8.5 h). Buffer density, viscosity, and partial specific volume of insulin analogs were calculated using SEDNTERP 355. Data analysis was performed using the continuous c(s) model in the sedfit56 software (v16.1c) with maximum-entropy regularization and an F-ratio of 0.68 (one standard deviation). Linear regression was performed with alternating use of the Marquardt-Levenberg and simplex algorithms with meniscus position, frictional ratio, and time-invariant noise floated until the model RMSD reached a minimum value. Interference data were fit with radius-invariant noise as an additional parameter. SV-AUC figures were generated with the GUSSI57 software.
Extended Data
Extended Data Fig. 1. Precursor sequence alignment of venom insulins identified in this study.
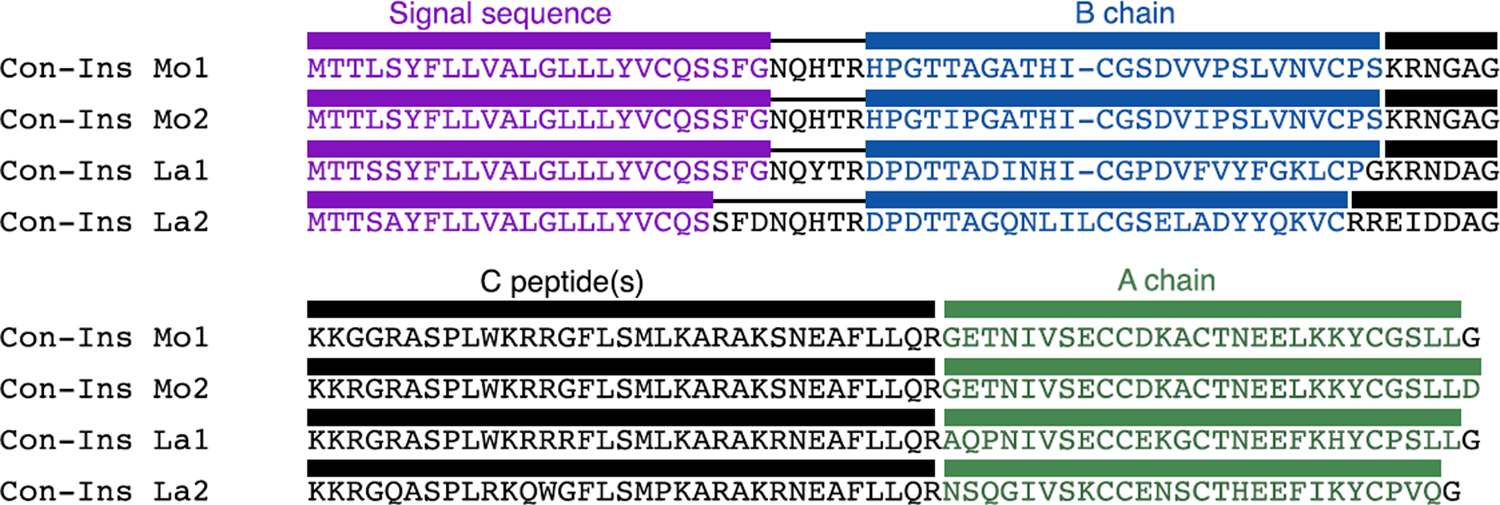
Canonical arrangement of preproinsulins with N-terminal signal sequences (purple) followed by the B chain (blue), C-peptide region (black) and A chain (green). The signal sequence, C peptide(s), and additional black-colored residues are predicted to be cleaved during post-translational processing.
Extended Data Fig. 2. AKT phosphorylation activity of Vh-Ins-HTLQ and related analogs.
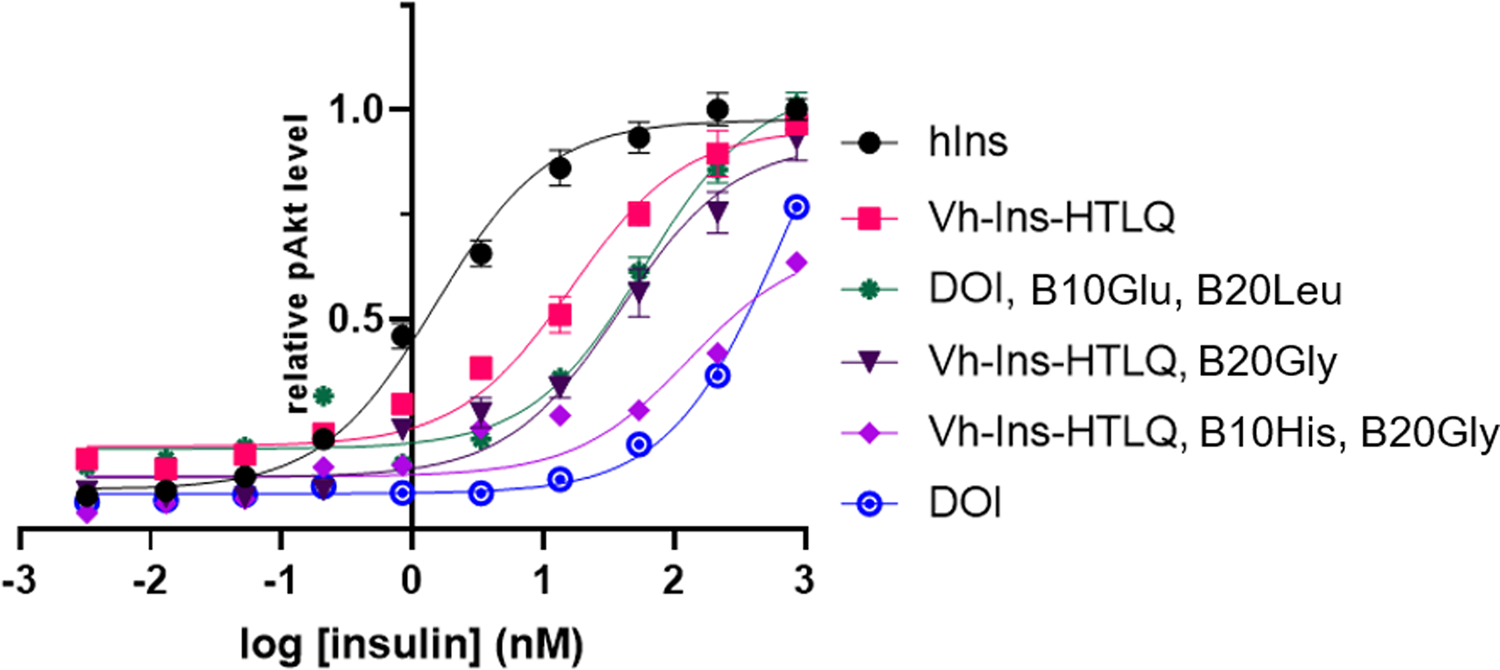
NIH 3T3 cells overexpressing IR-B were stimulated with insulin analogs and pAkt was quantified using a homogeneous time-resolved fluorescence assay. Error bars (s.e.m. of 4 biological replicates) are shown when larger than the symbols. Two substitutions on the B chain, GluB10 and LeuB20, were found to increase the relative activity of Vh-Ins-HTLQ. These substitutions were subsequently included in later stages of design of Vh-Ins molecules.
Extended Data Fig. 3. Vh-Ins-HSLQ at site 2.
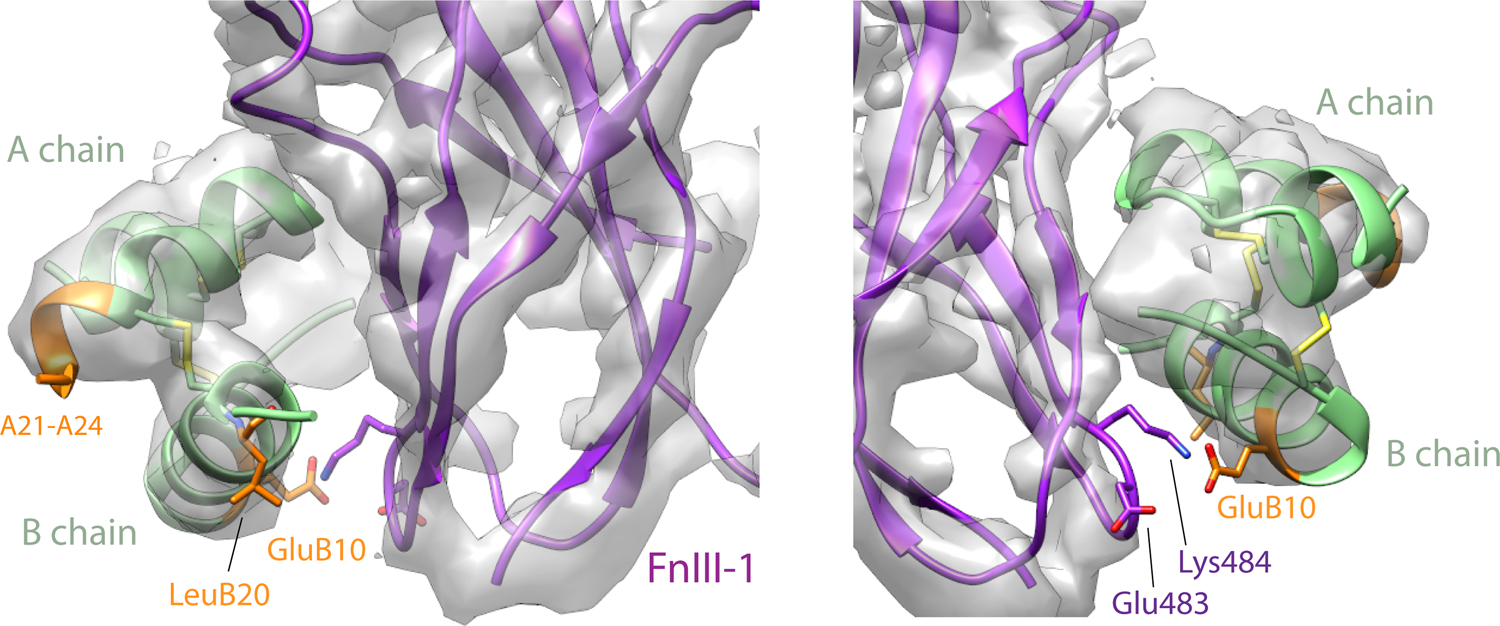
Density is shown around Vh-Ins-HSLQ. Vh-Ins-HSLQ green, with Vh-Ins mutated residues relative to native human insulin shown in orange. Receptor FnIII-1 domain, purple. The only Vh-specific residue that approaches receptor at site 2 is GluB10, which has poor density. Nearby receptor side chains lack density but are shown explicitly for illustrative purposes.
Extended Data Fig. 4. Activity of Vh-Ins analogs with single-residue substitutions in the extended A-chain residues (A21-A24).
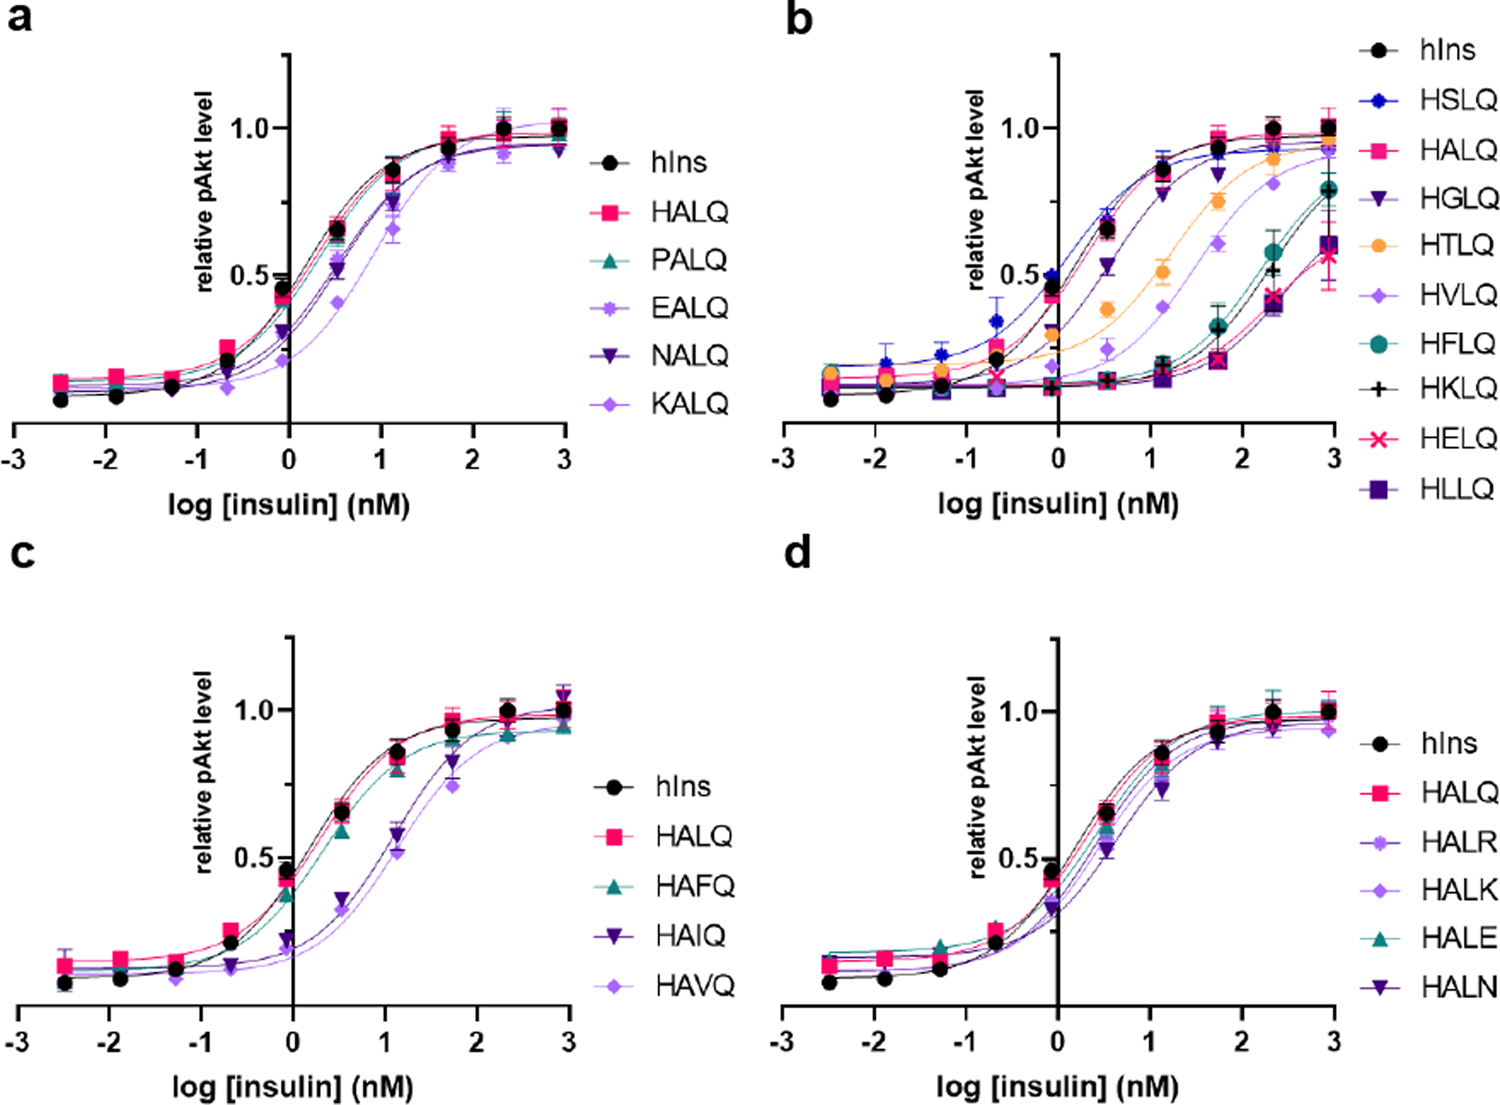
NIH 3T3 cells overexpressing IR-B were stimulated with insulin analogs and pAkt was quantified using a homogeneous time-resolved fluorescence assay. Error bars (s.e.m. of 4 biological replicates) are shown when larger than the symbols.
Extended Data Fig. 5. Vh-Ins-HALQ binding to IR and IGF-1R ectodomains.
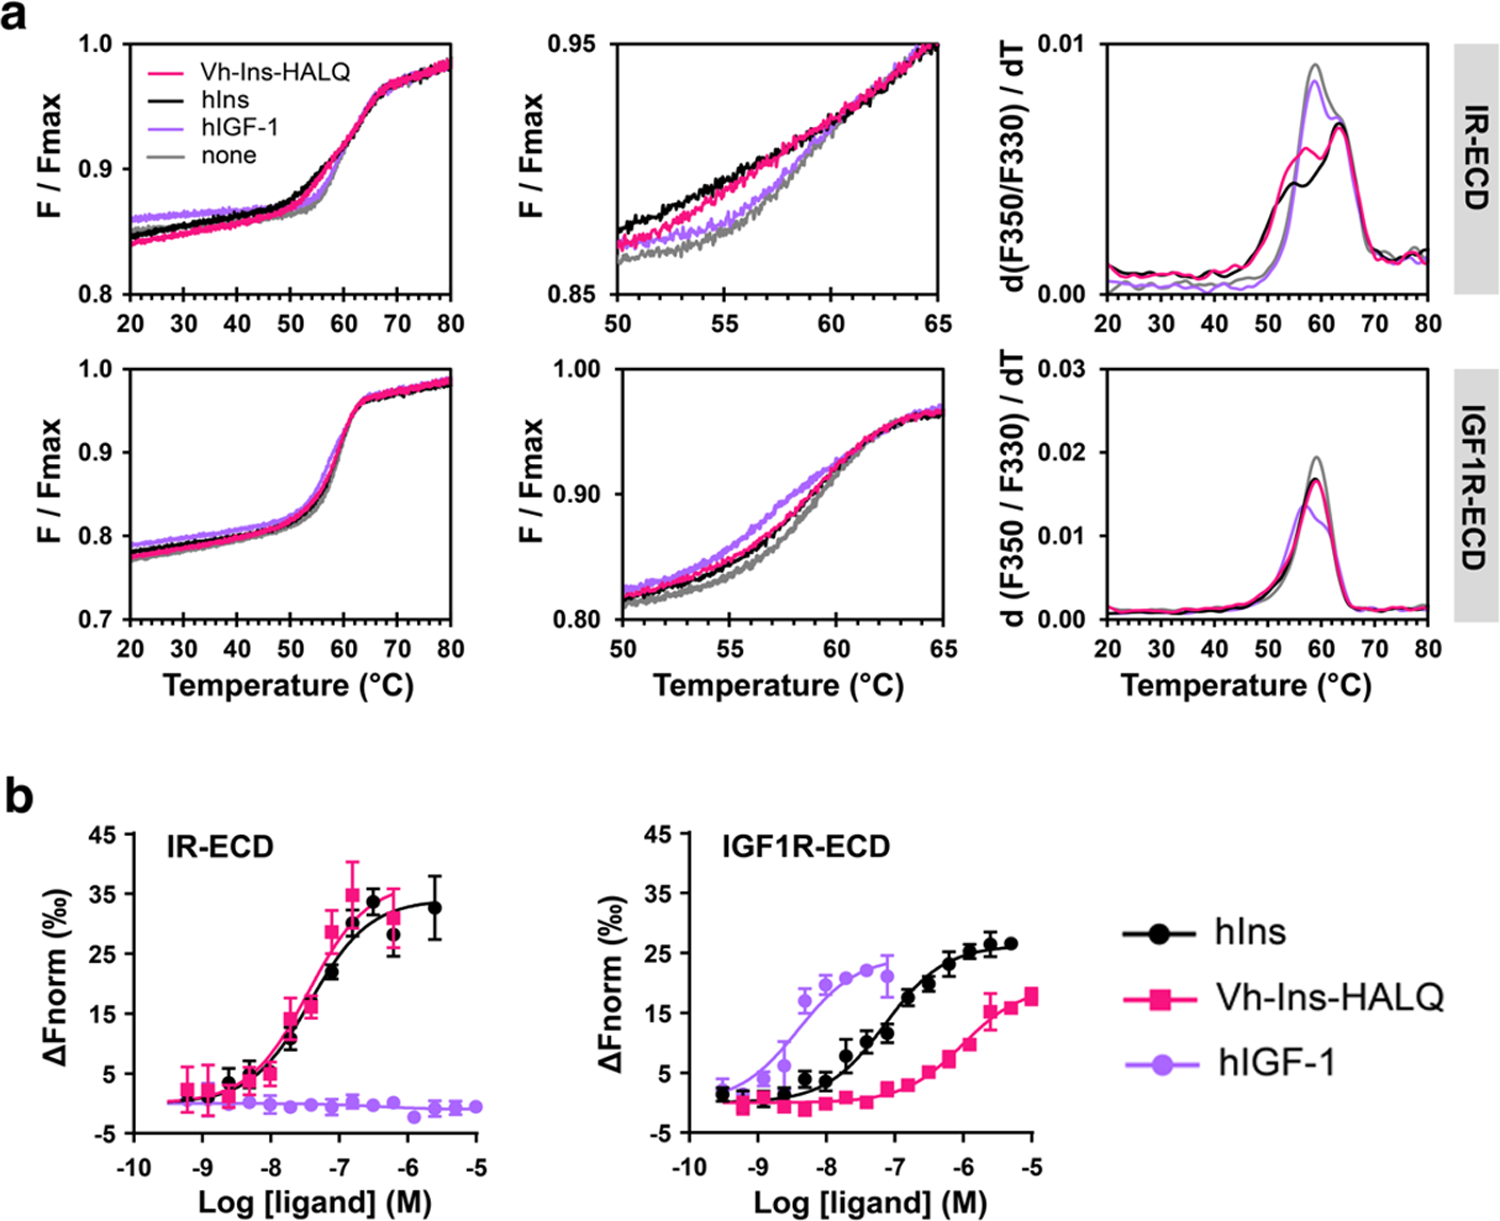
a, NanoDSF monitoring of intrinsic protein fluorescence to determine the thermal conformational stability of IR-ECD (top) or IGF1R-ECD (bottom) in the presence of respective ligands in four-times molar excess. Apo-IR-ECD displays two detectable unfolding transitions Tmlow and Tmhigh at 59.2 °C and 63.2 °C, respectively (Supplementary Table 5). The presence of Vh-Ins-HALQ leads to a decrease in Tmlow to 56.3 °C indicating conformational changes induced by ligand binding similarly to insulin (Tmlow = 54.3 °C). Apo-IGF1R-ECD displays a single transition temperature Tmhigh, while binding to hIGF-I leads to an additional melting transition at 57.4 °C. No significant changes in unfolding transitions were observed for IR-ECD in the presence of hIGF-I or for IGF1R-ECD in the presence of Vh-Ins-HALQ or hIns as compared to the respective ligand-free ectodomains. b, MST with IR-ECD (left) and IGF1R-ECD (right) to determine dissociation constants of binding to respective ligands (Supplementary Table 6; n=3, error bars show standard deviations).
Extended Data Fig. 6. Comparison of the two receptor protomers in the asymmetric conformation against previously reported structures.
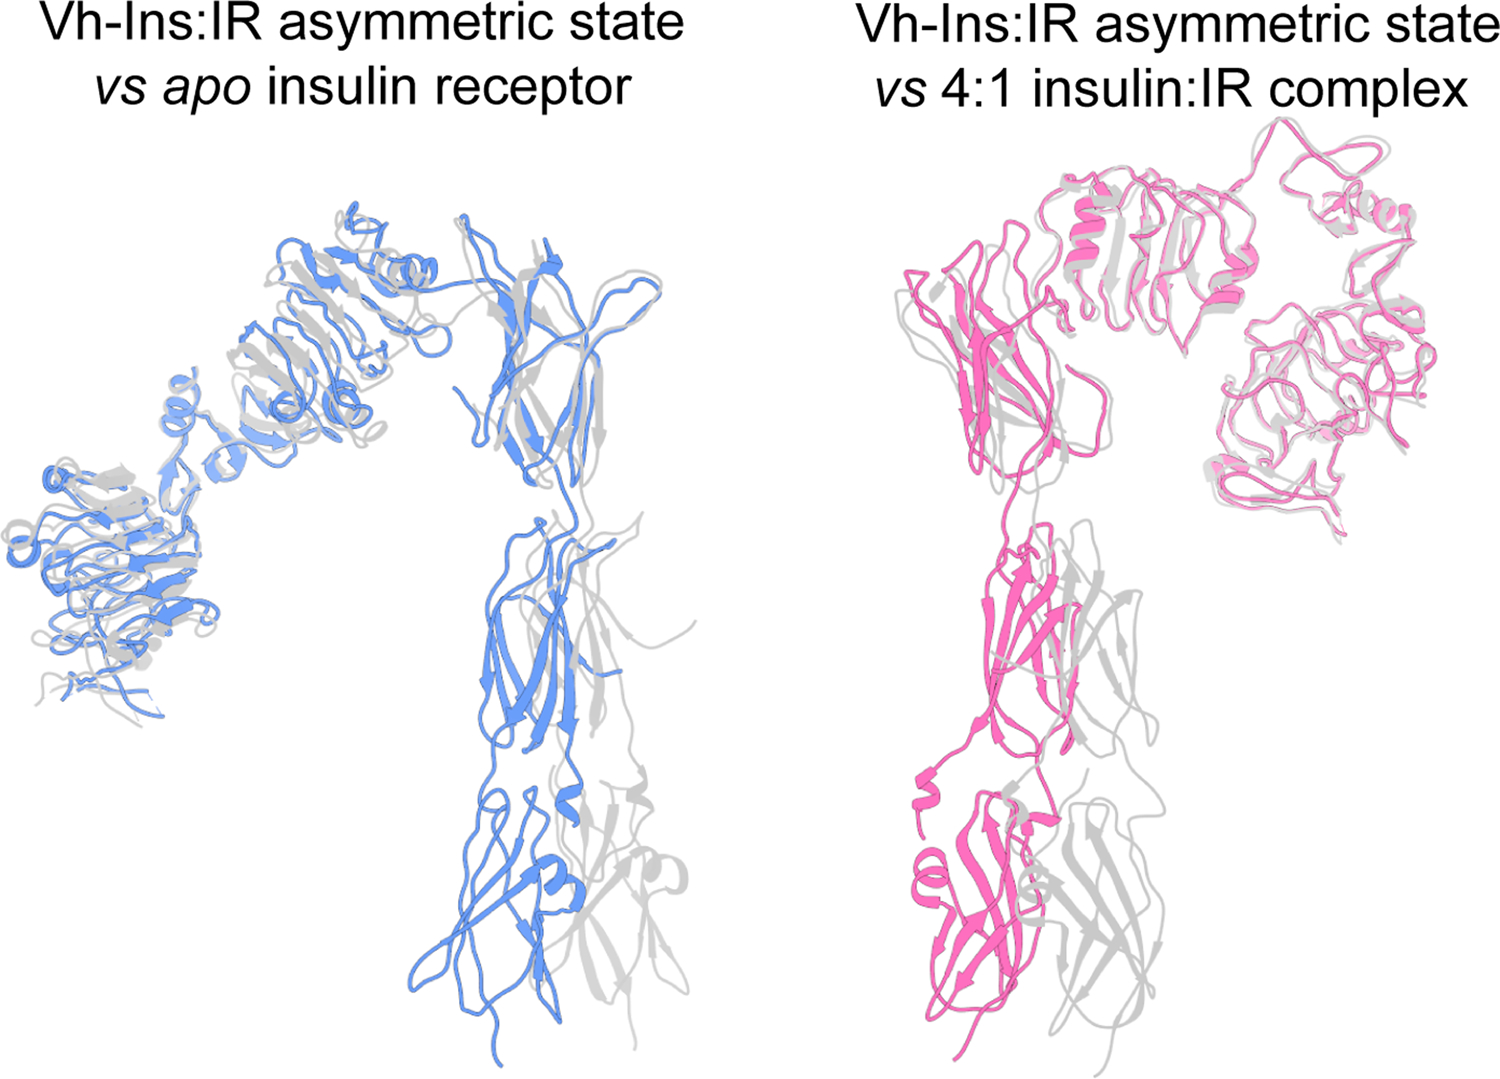
Left, Vh-Ins:IR asymmetric state apolike protomer (blue) vs apo IR (PDBs 4ZXB). Right, the second Vh-Ins:IR protomer (pink) vs insulin-bound receptor (6PXV) following alignment on L1, CR, L2, and FnIII-1 domains.
Extended Data Fig. 7. Vh-Ins-HALQ signal transduction in Hep-G2 cells.
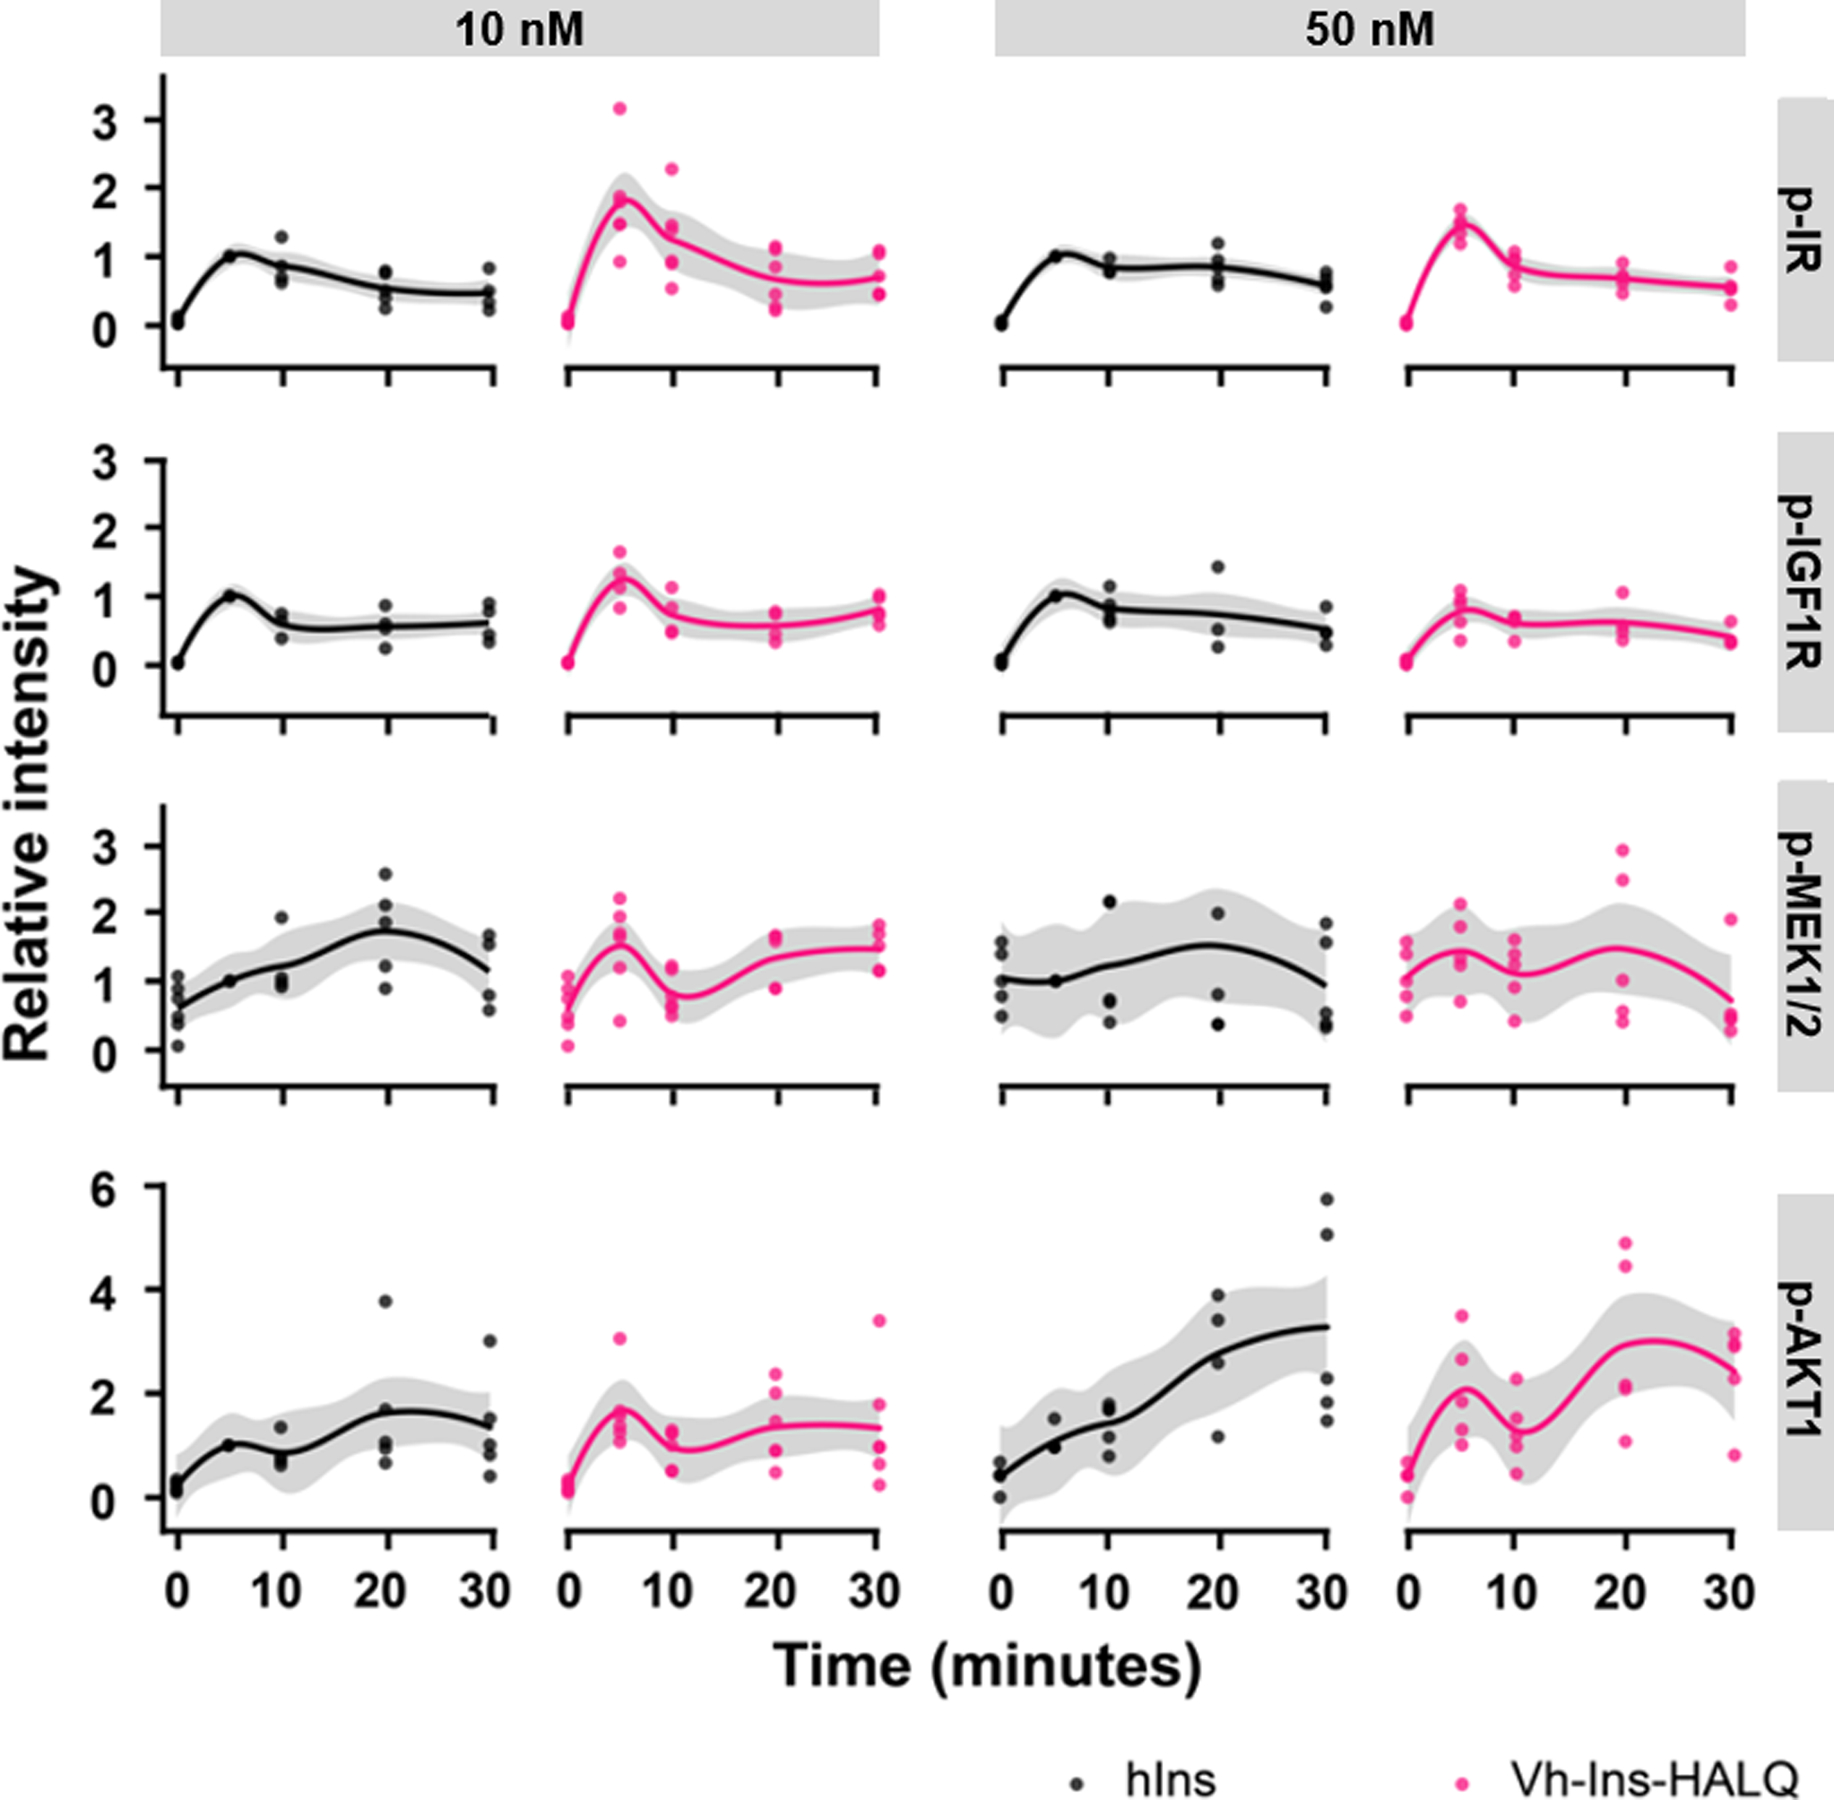
Signal transduction in Hep-G2 hepatoblastoma cells induced by Vh-Ins-HALQ and hIns at 10 or 50 nM was assessed by Western blot and densitometry (4–6 biological replicates for each condition). Phosphorylation-specific antibodies were used to detect phosphorylated IR (Y1150/115), IGF1R (Y980), AKT1 (S473), and MEK-1/2 (S217/221). Relative intensities of specific protein bands were normalized to the GAPDH loading control and then to the respective signal after 5 min of insulin treatment.
Extended Data Fig. 8. SV-AUC c(s) analysis of insulin analogs.
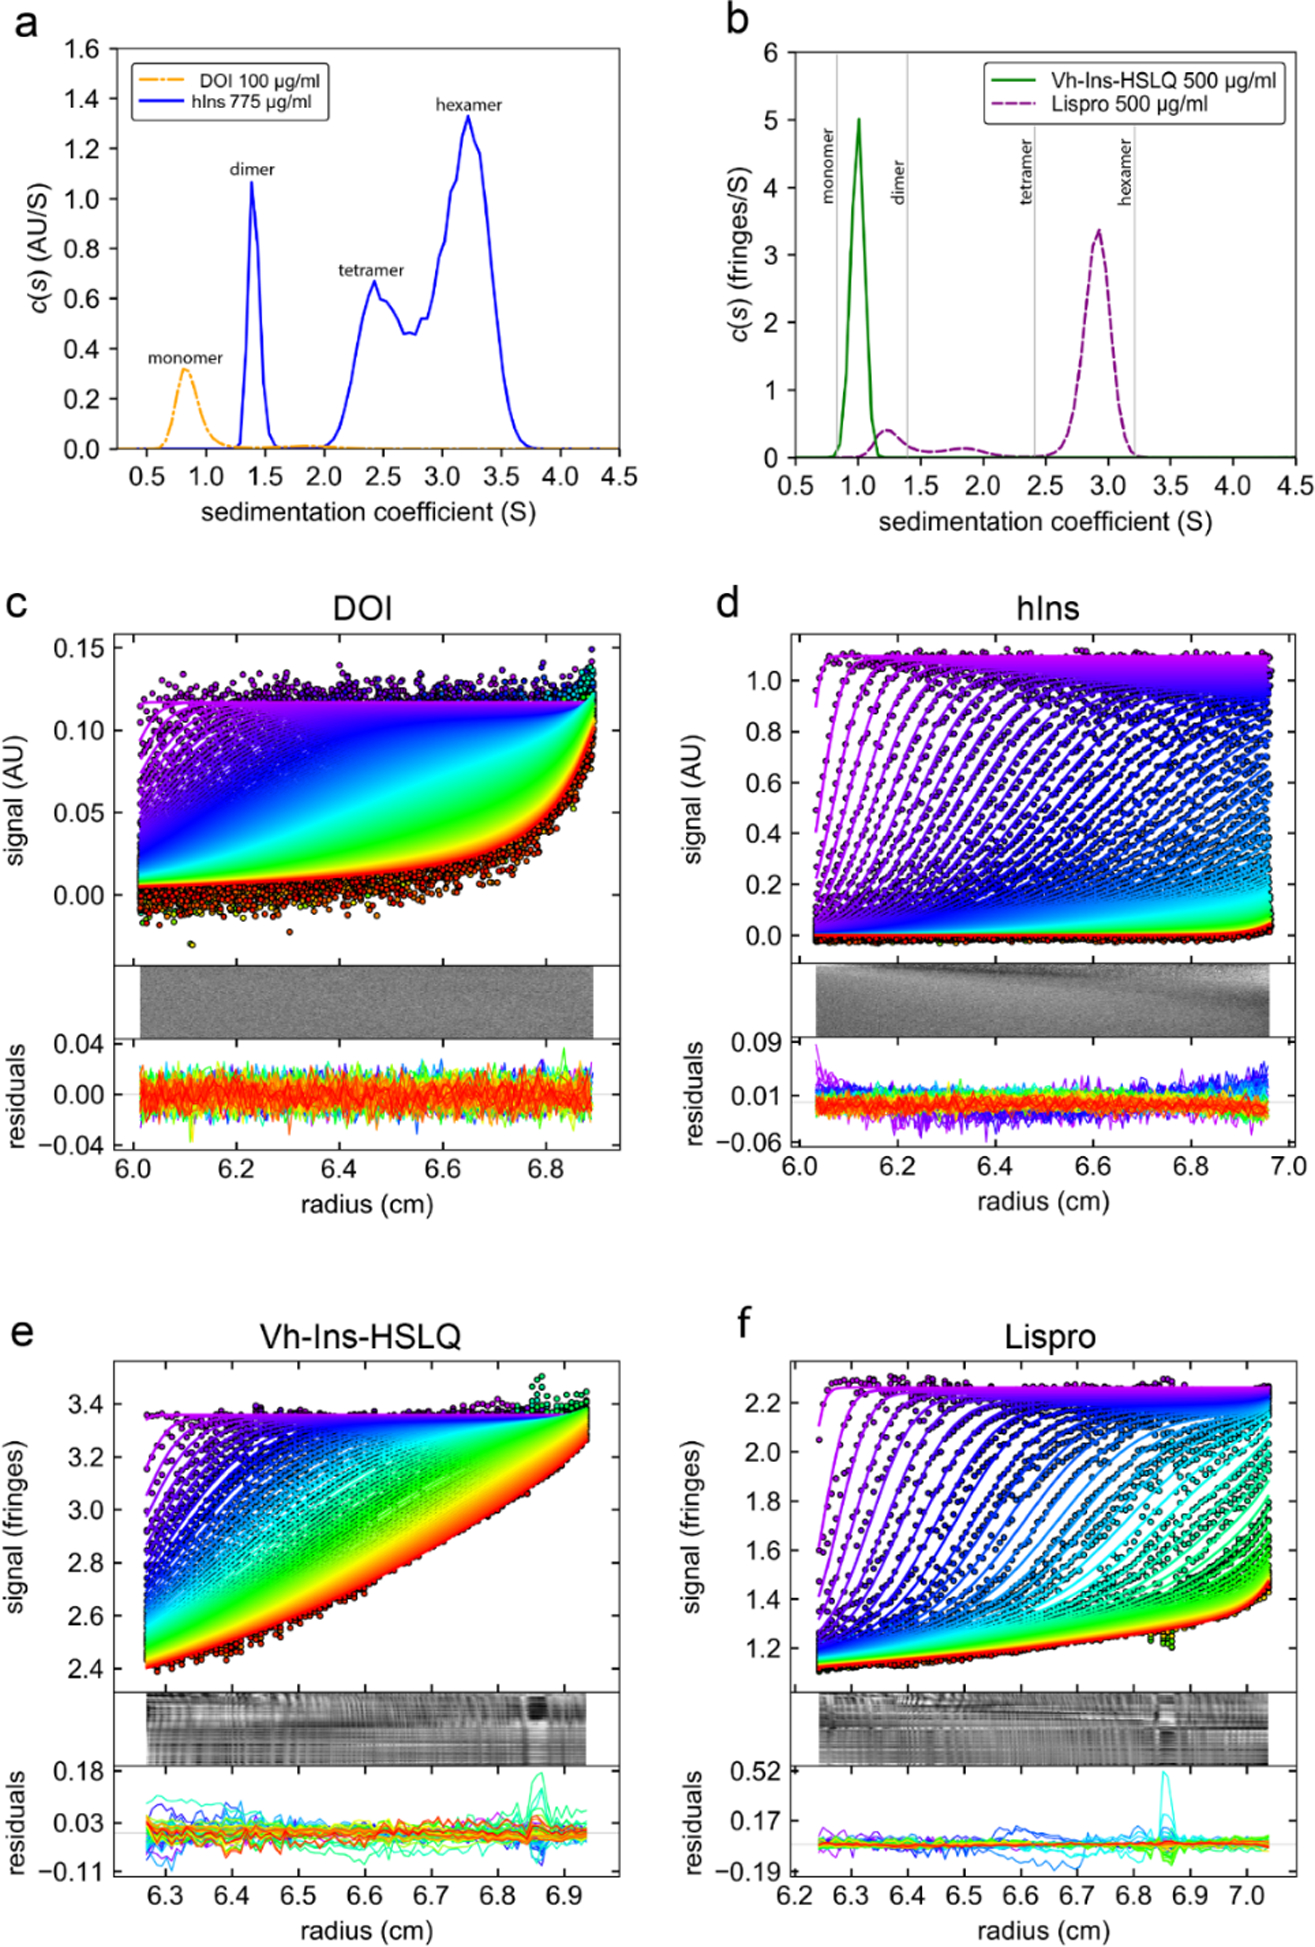
a, DOI (des octapeptide insulin) and hIns (human insulin) controls at a concentration of 100 μg/ml and 775 μg/ml respectively in phosphate buffer (137 mM NaCl, 2.7 mM KCl, 5.3 mM Na2HPO4, 1.8 mM KH2PO4, pH 7.4). b, Vh-Ins-HSLQ and Lispro both at 500 μg/ml in sterile insulin diluent (16 mg/ml glycerol, 1.6 mg/ml m-cresol, 0.65 mg/ml phenol, 3.8 mg/ml Na2HPO4, pH 7.4). c-d, Data fit and residuals for DOI, hIns, Vh-Ins-HSLQ and lispro, respectively. For clarity, some scans are omitted from the figures shown but all scans were used for the c(s) analysis. The interval between the scans shown in each panel is ~9 minutes.
Extended Data Fig. 9. SV-AUC of DOI and hIns in sterile diluent.

a, c(s) analysis of DOI and hIns in sterile diluent. For reference the Vh-Ins-HSLQ trace from Fig. S11 is shown. b-c, data fit and residuals for DOI and hIns in sterile diluent, respectively. hIns shows increasing concentrations at higher radii in early scans, indicative of aggregation during the experiment.
Supplementary Material
A series of volumes derived from 3D variability analysis show a range of flexible motion in one of the two receptor protomers. Models were built into the conformational extremes and used to create a series of molecular motions that were fit into the experimental density. In the asymmetric extreme, three Vh-Ins molecules are apparent in the complex, including one in a combined site 1/site 2 position. As the receptor moves toward the symmetric state, L1 and CR move away from their position near the combined site and separate density for both site-1- and site-2-bound Vh-Ins becomes apparent.
ACKNOWLEDGMENTS
We thank Baldomero M. Olivera for cone snail collection and identification and insightful discussions, Peter Shen for advice with structure determination and editing, and David Timm for electron microscopy screening and data collection at the University of Utah Electron Microscopy Core Laboratory. The support and resources from the Center for High Performance Computing and the High Throughput Genomics Core Facility at the University of Utah are gratefully acknowledged. Financial support was provided by the National Institutes of Health NIDDK (DK120430 to D.H.C., DK127268 to C.P.H., and DK118082 to S.J.F.), NIGMS (GM125001 to D.H.C.), Juvenile Diabetes Research Foundation (5-CDA-2018–572-A-N to D.H.C. and 1-INO-2017–441-A-N to H-S.-H.), German Federal Ministry of Education and Research (BMBF) grant to the German Center for Diabetes Research (DZD e.V. to Ü.C.), Deutsche Forschungsgemeinschaft (DFG 251981924 – TRR 83 to Ü.C. and DFG 347368302 to Ü.C. and T.G.), the Australian National Health and Medical Research Council (APP1143546 to M.C.L. and B.E.F.). Support of M.C.L.’s research is also made possible at WEHI through Victorian State Government Operational Infrastructure Support and the Australian NHMRC Independent Research Institutes Infrastructure Support Scheme. H.S-H. acknowledges fellowship support from the Villum Foundation (19063) and the Carlsberg Foundation (CF19–0445).
Footnotes
Competing interests
A patent application related to this work was filed by the University of Utah.
Data availability
RNA sequencing data have been deposited into the GenBank Nucleotide Database (accession numbers: MW091321, MW091322, MW091323, MW091324). Coordinates of the refined atomic models have been deposited in the Protein Data Bank (“head”: PDB entry 7MQO; “whole”: PDB entry 7MQR; “asymmetric”: PDB entry 7MQS). The associated cryo-EM maps have been deposited in the Electron Microscopy Data Bank (“head”: entry EMD-23949; “whole”: entry EMD-23950; “asymmetric”: entry EMD-23951). Raw cryo-EM movies are available on the Electron Microscopy Public Image Archive (accession code: EMPIAR-10736). Other data are available from the corresponding authors upon reasonable request.
REFERENCES
- 1.Shabanpoor F, Separovic F & Wade JD The human insulin superfamily of polypeptide hormones. Vitam Horm 80, 1–31 (2009). [DOI] [PubMed] [Google Scholar]
- 2.Heinemann L Variability of Insulin Absorption and Insulin Action. Diabetes Technology & Therapeutics 4(2004). [DOI] [PubMed] [Google Scholar]
- 3.Gradel AKJ et al. Factors Affecting the Absorption of Subcutaneously Administered Insulin: Effect on Variability. J Diabetes Res 2018, 1205121 (2018). [DOI] [PMC free article] [PubMed] [Google Scholar]
- 4.Menting JG et al. How insulin engages its primary binding site on the insulin receptor. Nature 493, 241–245 (2013). [DOI] [PMC free article] [PubMed] [Google Scholar]
- 5.Carpenter FH Relationship of structure to biological activity of insulin as revealed by degradative studies. The American Journal of Medicine 40, 750–758 (1966). [DOI] [PubMed] [Google Scholar]
- 6.Cruz LJ, Gray WR, Yoshikami D & Olivera BM Conus Venoms - A Rich Source of Neuroactive Peptides. Journal of Toxicology-Toxin Reviews 4, 107–132 (1985). [Google Scholar]
- 7.Olivera BM Conus Venom Peptide: Reflections from the Biology of Clades and Species. Annual Review of Ecology and Systematics 33, 25–47 (2002). [Google Scholar]
- 8.Safavi-Hemami H et al. Specialized insulin is used for chemical warfare by fish-hunting cone snails. Proc Natl Acad Sci U S A 112, 1743–8 (2015). [DOI] [PMC free article] [PubMed] [Google Scholar]
- 9.Xiong X et al. A structurally minimized yet fully active insulin based on cone-snail venom insulin principles. Nat Struct Mol Biol 27, 615–624 (2020). [DOI] [PMC free article] [PubMed] [Google Scholar]
- 10.Ahorukomeye P et al. Fish-hunting cone snail venoms are a rich source of minimized ligands of the vertebrate insulin receptor. eLife 8(2019). [DOI] [PMC free article] [PubMed] [Google Scholar]
- 11.Menting JG et al. A minimized human insulin-receptor-binding motif revealed in a Conus geographus venom insulin. Nature Structural & Molecular Biology 23, 916–920 (2016). [DOI] [PubMed] [Google Scholar]
- 12.Safavi-Hemami H et al. Venom Insulins of Cone Snails Diversify Rapidly and Track Prey Taxa. Mol Biol Evol 33, 2924–2934 (2016). [DOI] [PMC free article] [PubMed] [Google Scholar]
- 13.Ul-Hasan S et al. Characterization of the peptidylglycine alpha-amidating monooxygenase (PAM) from the venom ducts of neogastropods, Conus bullatus and Conus geographus. Toxicon 74, 215–24 (2013). [DOI] [PMC free article] [PubMed] [Google Scholar]
- 14.Gutmann T et al. Cryo-EM structure of the complete and ligand-saturated insulin receptor ectodomain. Journal of Cell Biology 219(2020). [DOI] [PMC free article] [PubMed] [Google Scholar]
- 15.Scapin G et al. Structure of the insulin receptor–insulin complex by single-particle cryo-EM analysis. Nature 556, 122–125 (2018). [DOI] [PMC free article] [PubMed] [Google Scholar]
- 16.Uchikawa E, Choi E, Shang G, Yu H & Bai X -c. Activation mechanism of the insulin receptor revealed by cryo-EM structure of the fully liganded receptor–ligand complex. eLife 8(2019). [DOI] [PMC free article] [PubMed] [Google Scholar]
- 17.Weis F et al. The signalling conformation of the insulin receptor ectodomain. Nat Commun 9, 4420 (2018). [DOI] [PMC free article] [PubMed] [Google Scholar]
- 18.Menting JG et al. Protective hinge in insulin opens to enable its receptor engagement. Proc Natl Acad Sci U S A 111, E3395–404 (2014). [DOI] [PMC free article] [PubMed] [Google Scholar]
- 19.Pandyarajan V et al. Aromatic Anchor at an Invariant Hormone-Receptor Interface. Journal of Biological Chemistry 289, 34709–34727 (2014). [DOI] [PMC free article] [PubMed] [Google Scholar]
- 20.Žáková L et al. Structural Integrity of the B24 Site in Human Insulin Is Important for Hormone Functionality. Journal of Biological Chemistry 288, 10230–10240 (2013). [DOI] [PMC free article] [PubMed] [Google Scholar]
- 21.Hansen BF, Kurtzhals P, Jensen AB, Dejgaard A & Russell-Jones D Insulin X10 revisited: a super-mitogenic insulin analogue. Diabetologia 54, 2226–2231 (2011). [DOI] [PubMed] [Google Scholar]
- 22.Schreiber G & Fersht AR Energetics of protein-protein interactions: Analysis ofthe Barnase-Barstar interface by single mutations and double mutant cycles. Journal of Molecular Biology 248, 478–486 (1995). [DOI] [PubMed] [Google Scholar]
- 23.Hoyne PA et al. High affinity insulin binding by soluble insulin receptor extracellular domain fused to a leucine zipper. FEBS Letters 479, 15–18 (2000). [DOI] [PubMed] [Google Scholar]
- 24.Whittaker J, Garcia P, Yu GQ & Mynarcik DC Transmembrane domain interactions are necessary for negative cooperativity of the insulin receptor. Mol Endocrinol 8, 1521–7 (1994). [DOI] [PubMed] [Google Scholar]
- 25.Lou M et al. The first three domains of the insulin receptor differ structurally from the insulin-like growth factor 1 receptor in the regions governing ligand specificity. Proc Natl Acad Sci U S A 103, 12429–34 (2006). [DOI] [PMC free article] [PubMed] [Google Scholar]
- 26.Croll TI et al. Higher-Resolution Structure of the Human Insulin Receptor Ectodomain: Multi-Modal Inclusion of the Insert Domain. Structure 24, 469–76 (2016). [DOI] [PMC free article] [PubMed] [Google Scholar]
- 27.Bepler T et al. Positive-unlabeled convolutional neural networks for particle picking in cryo-electron micrographs. Nat Methods 16, 1153–1160 (2019). [DOI] [PMC free article] [PubMed] [Google Scholar]
- 28.Zivanov J et al. New tools for automated high-resolution cryo-EM structure determination in RELION-3. Elife 7(2018). [DOI] [PMC free article] [PubMed] [Google Scholar]
- 29.Brems DN et al. Altering the association properties of insulin by amino acid replacement. Protein Eng 5, 527–33 (1992). [DOI] [PubMed] [Google Scholar]
- 30.Gammeltoft S et al. Insulin aspart: a novel rapid-acting human insulin analogue. Expert Opin Investig Drugs 8, 1431–42 (1999). [DOI] [PubMed] [Google Scholar]
- 31.Rakatzi I et al. A novel insulin analog with unique properties: LysB3,GluB29 insulin induces prominent activation of insulin receptor substrate 2, but marginal phosphorylation of insulin receptor substrate 1. Diabetes 52, 2227–38 (2003). [DOI] [PubMed] [Google Scholar]
- 32.Lawrence MC Understanding insulin and its receptor from their three-dimensional structures. Mol Metab, 101255 (2021). [DOI] [PMC free article] [PubMed] [Google Scholar]
- 33.Jiráček J & Žáková L Structural Perspectives of Insulin Receptor Isoform-Selective Insulin Analogs. Frontiers in Endocrinology 8(2017). [DOI] [PMC free article] [PubMed] [Google Scholar]
- 34.Larkin MA et al. Clustal W and Clustal X version 2.0. Bioinformatics 23, 2947–2948 (2007). [DOI] [PubMed] [Google Scholar]
- 35.Huelsenbeck JP & Ronquist F MRBAYES: Bayesian inference of phylogenetic trees. Bioinformatics 17, 754–5 (2001). [DOI] [PubMed] [Google Scholar]
- 36.Punjani A, Rubinstein JL, Fleet DJ & Brubaker MA cryoSPARC: algorithms for rapid unsupervised cryo-EM structure determination. Nature Methods 14, 290–296 (2017). [DOI] [PubMed] [Google Scholar]
- 37.Zheng SQ et al. MotionCor2: anisotropic correction of beam-induced motion for improved cryo-electron microscopy. Nat Methods 14, 331–332 (2017). [DOI] [PMC free article] [PubMed] [Google Scholar]
- 38.Asarnow D, Palovcak E & Cheng Y UCSF pyem v0.5. Zenodo; (2019). [Google Scholar]
- 39.Emsley P, Lohkamp B, Scott WG & Cowtan K Features and development ofCoot. Acta Crystallographica Section D Biological Crystallography 66, 486–501 (2010). [DOI] [PMC free article] [PubMed] [Google Scholar]
- 40.Liebschner D et al. Macromolecular structure determination using X-rays, neutrons and electrons: recent developments in Phenix. Acta Crystallographica Section D Structural Biology 75, 861–877 (2019). [DOI] [PMC free article] [PubMed] [Google Scholar]
- 41.Williams CJ et al. MolProbity: More and better reference data for improved all-atom structure validation. Protein Sci 27, 293–315 (2018). [DOI] [PMC free article] [PubMed] [Google Scholar]
- 42.Pettersen EF et al. UCSF Chimera--a visualization system for exploratory research and analysis. J Comput Chem 25, 1605–12 (2004). [DOI] [PubMed] [Google Scholar]
- 43.Goddard TD et al. UCSF ChimeraX: Meeting modern challenges in visualization and analysis. Protein Sci 27, 14–25 (2018). [DOI] [PMC free article] [PubMed] [Google Scholar]
- 44.Denley A et al. Structural determinants for high-affinity binding of insulin-like growth factor II to insulin receptor (IR)-A, the exon 11 minus isoform of the IR. Mol Endocrinol 18, 2502–12 (2004). [DOI] [PubMed] [Google Scholar]
- 45.Menting JG, Ward CW, Margetts MB & Lawrence MC A thermodynamic study of ligand binding to the first three domains of the human insulin receptor: relationship between the receptor alpha-chain C-terminal peptide and the site 1 insulin mimetic peptides. Biochemistry 48, 5492–500 (2009). [DOI] [PubMed] [Google Scholar]
- 46.Lata S, Reichel A, Brock R, Tampe R & Piehler J High-affinity adaptors for switchable recognition of histidine-tagged proteins. J Am Chem Soc 127, 10205–15 (2005). [DOI] [PubMed] [Google Scholar]
- 47.Wickham H ggplot2: Elegant Graphics for Data Analysis. Springer-Verlag; New York: (2016). [Google Scholar]
- 48.Wickham H, François R, Henry L & Müller K dplyr: A Grammar of Data Manipulation. R package (2021). [Google Scholar]
- 49.Auguie B & Antonov A gridExtra: Miscellaneous Functions for “Grid” Graphics. R package. (2017). [Google Scholar]
- 50.Team, R. RStudio: Integrated Development for R. (2020). [Google Scholar]
- 51.Rajapaksha H & Forbes BE Ligand-Binding Affinity at the Insulin Receptor Isoform-A and Subsequent IR-A Tyrosine Phosphorylation Kinetics are Important Determinants of Mitogenic Biological Outcomes. Front Endocrinol (Lausanne) 6, 107 (2015). [DOI] [PMC free article] [PubMed] [Google Scholar]
- 52.Salic A & Mitchison TJ A chemical method for fast and sensitive detection of DNA synthesis in vivo. Proc Natl Acad Sci U S A 105, 2415–20 (2008). [DOI] [PMC free article] [PubMed] [Google Scholar]
- 53.Gauguin L et al. Structural basis for the lower affinity of the insulin-like growth factors for the insulin receptor. J Biol Chem 283, 2604–13 (2008). [DOI] [PubMed] [Google Scholar]
- 54.Disotuar MM et al. Facile synthesis of insulin fusion derivatives through sortase A ligation. Acta Pharmaceutica Sinica B (2020). [DOI] [PMC free article] [PubMed] [Google Scholar]
- 55.Hayes DB, Laue T & Philo J SEDNTERP. (1995).
- 56.Schuck P, Perugini MA, Gonzales NR, Howlett GJ & Schubert D Size-distribution analysis of proteins by analytical ultracentrifugation: strategies and application to model systems. Biophys J 82, 1096–111 (2002). [DOI] [PMC free article] [PubMed] [Google Scholar]
- 57.Brautigam CA Calculations and Publication-Quality Illustrations for Analytical Ultracentrifugation Data. Methods Enzymol 562, 109–33 (2015). [DOI] [PubMed] [Google Scholar]
Associated Data
This section collects any data citations, data availability statements, or supplementary materials included in this article.
Supplementary Materials
A series of volumes derived from 3D variability analysis show a range of flexible motion in one of the two receptor protomers. Models were built into the conformational extremes and used to create a series of molecular motions that were fit into the experimental density. In the asymmetric extreme, three Vh-Ins molecules are apparent in the complex, including one in a combined site 1/site 2 position. As the receptor moves toward the symmetric state, L1 and CR move away from their position near the combined site and separate density for both site-1- and site-2-bound Vh-Ins becomes apparent.
Data Availability Statement
RNA sequencing data have been deposited into the GenBank Nucleotide Database (accession numbers: MW091321, MW091322, MW091323, MW091324). Coordinates of the refined atomic models have been deposited in the Protein Data Bank (“head”: PDB entry 7MQO; “whole”: PDB entry 7MQR; “asymmetric”: PDB entry 7MQS). The associated cryo-EM maps have been deposited in the Electron Microscopy Data Bank (“head”: entry EMD-23949; “whole”: entry EMD-23950; “asymmetric”: entry EMD-23951). Raw cryo-EM movies are available on the Electron Microscopy Public Image Archive (accession code: EMPIAR-10736). Other data are available from the corresponding authors upon reasonable request.


