Abstract
Purpose:
To present a proton computed tomography (pCT) reconstruction approach that models the integral depth dose (IDD) of the clinical scanning proton beam into beamlets. Using a multilayer ionization chamber (MLIC) as the imager, the proposed pCT system and the reconstruction approach can minimize extra ambient neutron dose and simplify the beamline design by eliminating an additional collimator to confine the proton beam.
Methods:
Monte Carlo simulation was applied to digitally simulate the IDDs of the exiting proton beams detected by the MLIC. A forward model was developed to model each IDD into a weighted sum of percentage depth doses of the constituent beamlets separated laterally by 1 mm. The water equivalent path lengths (WEPLs) of the beamlets were determined by iteratively minimizing the squared L2-norm between the forward projected and simulated IDDs. The final WEPL values were reconstructed to pCT images, that is, proton stopping power ratio (SPR) maps, through simultaneous algebraic reconstruction technique with total variation regularization. The reconstruction process was tested with a digital cylindrical water-based phantom and an ICRP adult reference computational phantom. The mean of SPR within regions of interest (ROIs) and the WEPL along a 4 mm-wide beam (WEPL4mm) were compared with the reference values. The spatial resolution was analyzed at the edge of a cortical insert of the cylindrical phantom.
Results:
The percentage deviations from reference SPR were within ±1% in all selected ROIs. The mean absolute error of the reconstructed SPR was 0.33%, 0.19%, and 0.27% for the cylindrical phantom, the adult phantom at the head and lung region, respectively. The corresponding percentage deviations from reference WEPL4mm were 0.48 ± 0.64%, 0.28 ± 0.48%, and 0.22 ± 0.49%. The full width at half maximum of the line spread function (LSF) derived from the radial edge spread function (ESF) of a cortical insert was 0.13 cm. The frequency at 10% of the modulation transfer function (MTF) was 6.38 cm–1. The mean signal-to-noise ratio (SNR) of all the inserts was 2.45. The mean imaging dose was 0.29 and 0.25 cGy at the head and lung region of the adult phantom, respectively.
Conclusion:
A new pCT reconstruction approach was developed by modeling the IDDs of the uncollimated scanning proton beams in the pencil beam geometry. SPR accuracy within ±1%, spatial resolution of better than 2 mm at 10% MTF, and imaging dose at the magnitude of mGy were achieved. Potential side effects caused by neutron dose were eliminated by removing the extra beam collimator.
Keywords: model-based reconstruction, Monte Carlo simulation, proton computed tomography, stopping power ratio
1 |. INTRODUCTION
Proton therapy is advantageous in confining most of the radiation dose within the target tumor volume and sparing surrounding healthy tissues or organs-at-risk due to the Bragg peak property of the proton beams.1 This allows proton therapy to achieve similar treatment results while causing fewer side effects than photon therapy.2–4 However, this advantage strongly depends on the accuracy of the determined proton range, which was currently computed by converting the Hounsfield Units (HUs) in the x-ray computed tomography (xCT) simulation images to proton stopping power ratios (SPRs) using a stoichiometric calibration.5 Despite a leap forward compared with the direct measurement,6 the stoichiometric calibration process can still cause SPR uncertainties of approximately 5% for low-density tissue (lung),1.6% for soft tissue, and 2.4% for high-density tissue (bone).7 The final combined uncertainties for different treatment sites are in the range of 3.0–3.4%,7 warranting an extra distal margin of 3.5% of the beam range in treatment planning, in addition to another 1–3 mm margin that accounts for other uncertainties besides the conversion from HU to SPR, such as energy fluctuation, quality assurance, and treatment apparatus. This formula is widely accepted and executed by most proton therapy centers.8
To minimize additional uncertainty in the xCT HU to SPR conversion process, multiple designs of proton radiography and proton computed tomography (pCT) have been proposed and developed to directly measure the proton SPR. These designs can be grouped into two categories:proton tracking systems and proton integrating systems.9,10
In a proton tracking system, protons were released one by one at a frequency up to 1 MHz.11 A pair of position-sensitive detectors were placed before and after the imaging object to track the direction and position of the entering and exiting proton. The most likely path (MLP) formalism was applied to compute the MLP for each proton12–15 and a residual energy range detector was employed to measure the residual energy of the exiting proton.9 Algebraic iterative reconstruction methods, together with MLP, were applied for image reconstruction.14 It was reported that the electron density resolution ~1% and the spatial resolution <1 mm were achieved in the reconstructed pCT. Nevertheless, this type of system requires accurate control in proton release and rapid detection speed, leading to sophisticated hardware that is not readily available for clinical use.16
Proton integrating systems detect the residual energy of a bundle of protons assuming a straight path of proton beam across the imaging object. This type of system uses therapeutic proton beams as the image source and does not need a sophisticated mechanism to synchronize the measurement of individual protons entering and exiting the imaging object. It is a simpler design and easier to integrate with proton treatment machines from the perspective of engineering. Image reconstruction of the proton integrating system requires deriving water equivalent path lengths (WEPLs) from proton residual energy measurements. A proton integrating system using range-modulated passive scattering fields was evaluated by Lu,17 where the time dependence of the dose distribution delivered by the scattering fields was calibrated to WEPL. In 2017, this method was further improved by Zhang et al.18 by integrating the intensity information of the time-resolved dose rate function. The mean absolute percentage error of the reconstructed SPR was reported as 0.66% for all inserts of the Gammex Phantom (Sun Nuclear Corp., Melbourne, FL). A spatial resolution of 1–2 mm and a range resolution of 1–2 mm of WEPL were achieved. However, their results were limited by the range mixing effect of protons, which is a shared challenge among proton integrating systems.
Our group’s previous simulation study validated the feasibility of a novel design of a proton CT system equipped with a multilayer ionization chamber (MLIC) and two strip ionization chamber plates.19 The MLIC was designed to measure proton residual dose at different depths. The two strip ionization chamber plates in front of the MLIC were designed to determine positions and lateral profiles of the exiting proton beams, which can provide information to further improve SPR accuracy. As a proton integrating system, our design has great potential to be implemented in the proton treatment room. For a full gantry system, the detection can be installed opposite to the proton snout. For a half gantry system, the detector can be installed on an additional robotic C-arm that shares the same isocenter and radius with the treatment gantry. The C-arm can be mounted on the ceiling or the wall and be pulled out only when it is needed for the image acquisition. The acquisition speed depends on the scanning speed, spot size, and gantry movement. Given a typical scanning speed of 20 m/s, the estimated time to acquire a set of volumetric images for a typical adult head is about 36 s with spot size of 4 mm and 180 projections.
Since the design used the clinical scanning proton pencil beams as the imaging source and the minimum proton spot size (1σ) in-air at isocenter is between 3 and 4 mm at various proton delivery platforms,20–22 a cylindrical collimator with an open field diameter of 1 mm at the center was used to confine the proton spot size to 1 mm to achieve an imaging resolution of 5 lp/cm. However, in addition to the modification of the beamline, the cylindrical collimator would induce additional problems, such as theextra neutron dose to the patient and a small shift of proton energy spectrum after the collimator.
In this study, we present a new pCT system design and the corresponding new image reconstruction approach. The key contributions are: (1) the additional collimator that required beamline modification was avoided to reduce the neutron dose. (2) To reconstruct the image, the integral depth doses (IDDs) of the scanning proton beams were modeled as the weighted sum of percentage depth doses (PDDs) of constituent narrow beamlets. Through the pCT system and the reconstruction approach, the uncertainty of the reconstructed SPR image was reduced to <1%, and the image resolution was improved to better than 2 mm. The proposed new pCT system and the corresponding reconstruction approach can be easily modified for different proton spot sizes and thus provide a universal pCT solution for all proton delivery platforms.
2 |. MATERIALS AND METHODS
2.1 |. Overview of the pCT system
The new design of the pCT system is illustrated in Figure 1. The imaging process is similar to a rotate/translate CT system, where the proton beam and the detector unit rotate around the imaging isocenter for 180° and translate laterally to cover the diameter of the imaging object at each rotation angle. The residual energy of the proton beam at different depths is detected by the MLIC. The lateral position and profile of the exit beam are detected by two perpendicular strip ionization chamber plates on top of the MLIC. The effective detector area is 25.6 × 25.6 cm2, thus the maximum volume of the object for scanning is 1.68 × 104 cm3. Additional details of the detector design can be found in our previous publication.19 In this study, the source to isocenter distance and the source to detector center distance were set to be 184 and 224 cm, accordingly.
FIGURE 1.
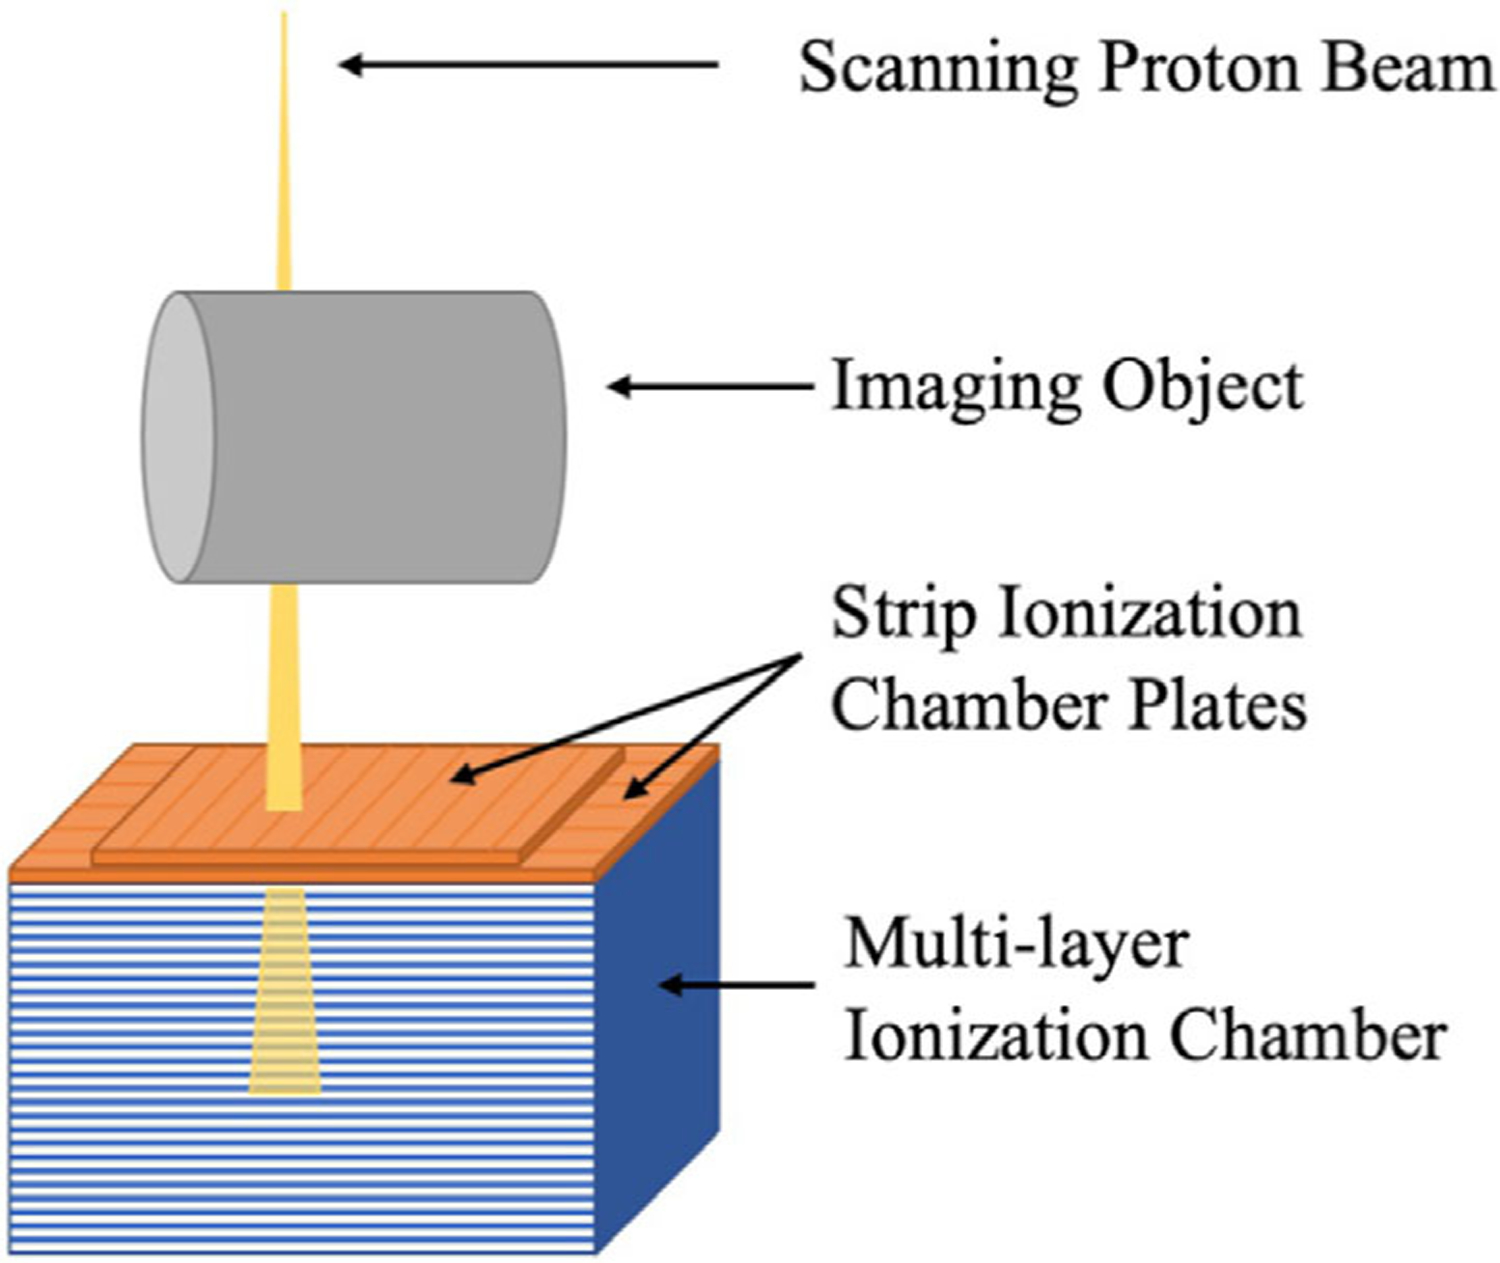
Schematic diagram of the pCT system. The integral depth dose of the exiting proton beam is detected by the MLIC, while the lateral profile of the exiting proton beam is detected by the strip ionization chamber plates on top of the MLIC
2.2 |. Forward model
Since the imaging proton beam’s spot size in the air is much larger than the desired image resolution, the measured IDD of the exiting proton beam was modeled as an ensemble of narrow beamlets emanating from individual point sources laterally separated apart by 1 mm. Hence, the IDD of the transmitted proton beam was calculated as a weighted sum of the PDDs of the constituent beamlets. The corresponding weights followed the source profile of the proton beam, which had a Gaussian distribution with a standard deviation (STD) (σ) of 4 mm. Thus, at gantry angle α, the predicted IDD gα as a function of depth in the MLIC, d, and spot position, x0, can be written as
| (1) |
where xi denotes the lateral offset of the beamlet i relative to the spot of interest x0, and n stands for the total number of the beamlets. In this study, 21 beamlets from lateral offset −10 mm to 10 mm were adopted empirically to cover 98.8% of the source distribution. βα(x0, d) represents electronic noise and the noise induced by large angle scattering that cannot be modeled by multiple Coulomb scattering (MCS). Additionally,
| (2) |
is the WEPL across the imaging object along a specific path determined by gantry angle α and beamlet position x. ρs stands for SPR of the imaging object, which is in the coordinate of the imaging object defined by (x′, y′).Finally,
| (3) |
is the Bragg curve function modified from the Bortfeld function,23,24 which approximates the PDD of a narrow proton beamlet. A polynomial term was added to the original Bortfeld function to account for the energy spread and dose deposition caused by secondary particles.24 For a water phantom scorer, the modified Bragg curve function can be written as
| (4) |
| (5) |
where z is the water equivalent thickness, is the parabolic cylinder function, and Φ0 is proportional to the fluence. Parameters R0, δ, ε, a, b, c, and d, depending on the initial kinetic energy of incident protons, can be determined by fitting the measured or simulated IDD.
2.3 |. Determination of WEPL
Values of WEPL were determined at every gantry angle. At gantry angle α, a loss function was defined as the squared L2-norm between IDDs calculated by the forward model gα(x0, d) and IDDs from the simulation mα(x0, d) over all depths in detector and spots positions:
| (6) |
The loss function was minimized by adjusting the WEPLs of narrow beamlets defined by Equation (2). Replacing gα(x0, d) in Equation (6) with Equation (1), and neglecting β(α, x0) for simplicity, the determination of WEPL can be formalized as finding that satisfies
| (7) |
2.4 |. Reconstruction algorithm
The minimization of the loss function was conducted based on the trust-region reflective algorithm in MATLAB®.25,26 Gradient of the forward model was derived and provided to the algorithm to accelerate the minimization. The initial value of WEPL through each beamlet was determined by the shift between Bragg peak locations in the IDDs with and without the imaging object as described in our previous publication.19 To avoid local minima, two iterations of WEPL determination were performed with an intermediate smoothing in between ensuring different starting points of the minimization. After the WEPL values were determined, the SPR distribution was reconstructed via simultaneous algebraic reconstruction technique with total variation regularization (SART-TV)27,28 using TIGRE,29 which stands for tomographic iterative GPU-based reconstruction toolbox.
2.5 |. Simulation study
Monte Carlo simulation was implemented using TOPAS Toolkit,30,31 which is a user-friendly extension of Geant4 Simulation Toolkit.32,33 TOPAS version 3.5 was employed in this study, sharing the same physics models, processes, and interaction cross-section with Geant4 10.06.p01. To image the cylindrical phantom with 10 cm diameter, proton beams with initial kinetic energy of 150 ± 0.6 MeV were simulated, which matches the measurement of the proton machine at Siteman Cancer Center. To image the human phantom with maximum diameter of around 28 cm, monoenergetic proton beam of 230 MeV was used in the simulation. The energy spread of 230 MeV proton beams was considered negligible. Each proton beam consisted of 2000 protons in a Gaussian distribution with the STD σ = 4 mm. The spot spacing was 1 mm and the gantry rotates by half circle in the incrementation of 1°. The IDDs scored in 1 mm resolution for the cylindrical phantom and 2 mm for the adult phantom along the beam direction were used as inputs of the reconstruction.
2.6 |. Cylindrical water-based phantom
A digital cylindrical water-based phantom of 10 cm in diameter containing 12 tissue-equivalent inserts (each is 1 cm in diameter) was generated as the imaging object. The inserts were arranged in two concentric rings around the center of the water phantom. Four bony tissue inserts, including femur, cortical, mandible, and sacrum were equally distributed on the inner ring with a radius of 2 cm from the center. Eight soft tissue inserts, namely lung, breast, liver, heart, adipose, thyroid, muscle, and brain, were spread evenly around the outer ring with 4 cm radius. Figure 2 demonstrates the axial cross-section of the phantom annotated with tissue name and reference SPR of each insert.5
FIGURE 2.
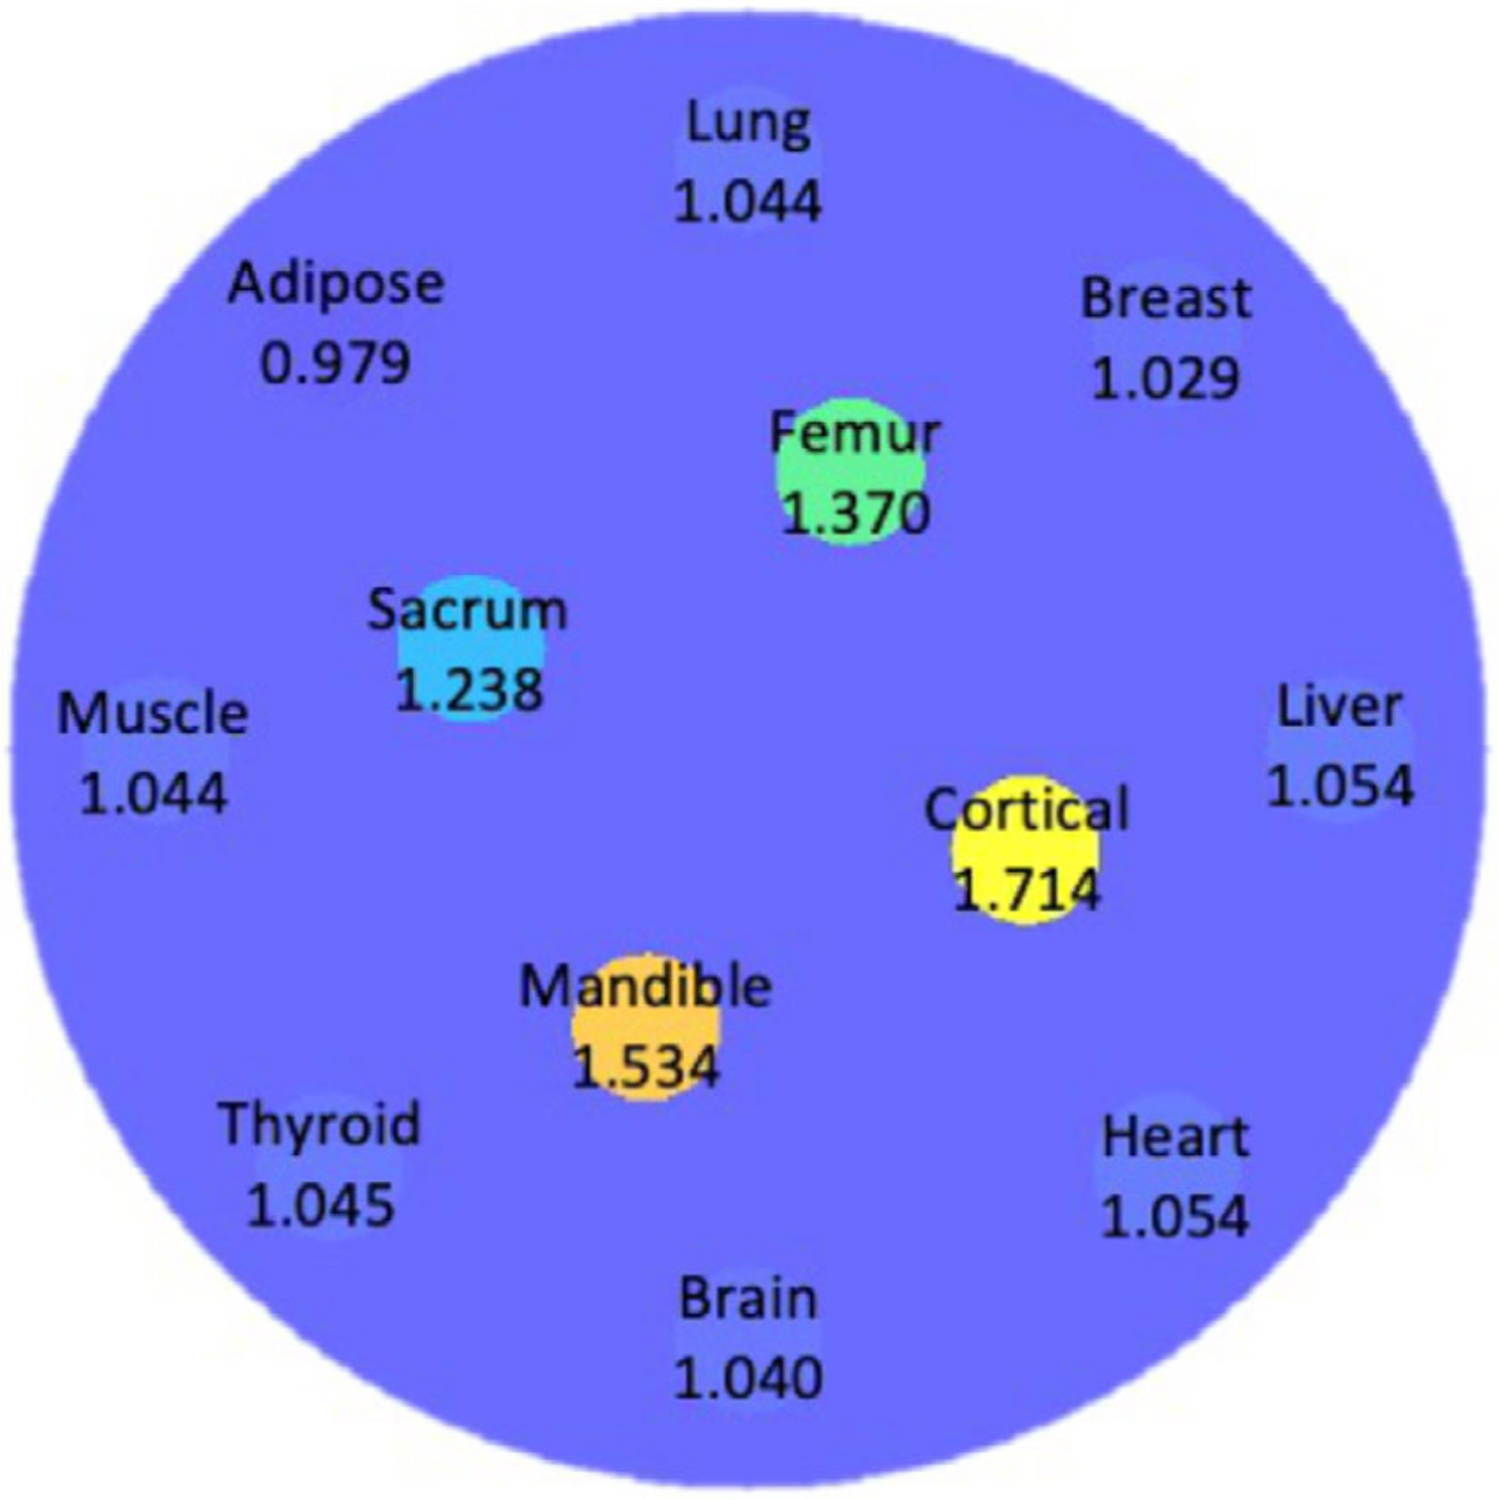
Axial cross-section of the cylindrical water-based phantom with 12 human tissue inserts. Materials and corresponding reference SPR values of the inserts were annotated
2.7 |. Human phantom study
The reconstruction approach was also tested on a female adult reference computational phantom with tissues contoured by the ICRP.34 Every voxel in the adult phantom was assigned to have a “MaterialTagNumber” based on the phantom mask. A look-up table that converts the “MaterialTagNumber” to chemical composition was entered manually into TOPAS using the chemical composition provided explicitly by the ICRP. Two slices of the adult phantom, representing the head and lung region, respectively, were displayed in Figure 3. In each slice, human tissues were labeled in different colors and numbers. Tissue names and reference values of SPR corresponding to label numbers were summarized in Table 1.
FIGURE 3.
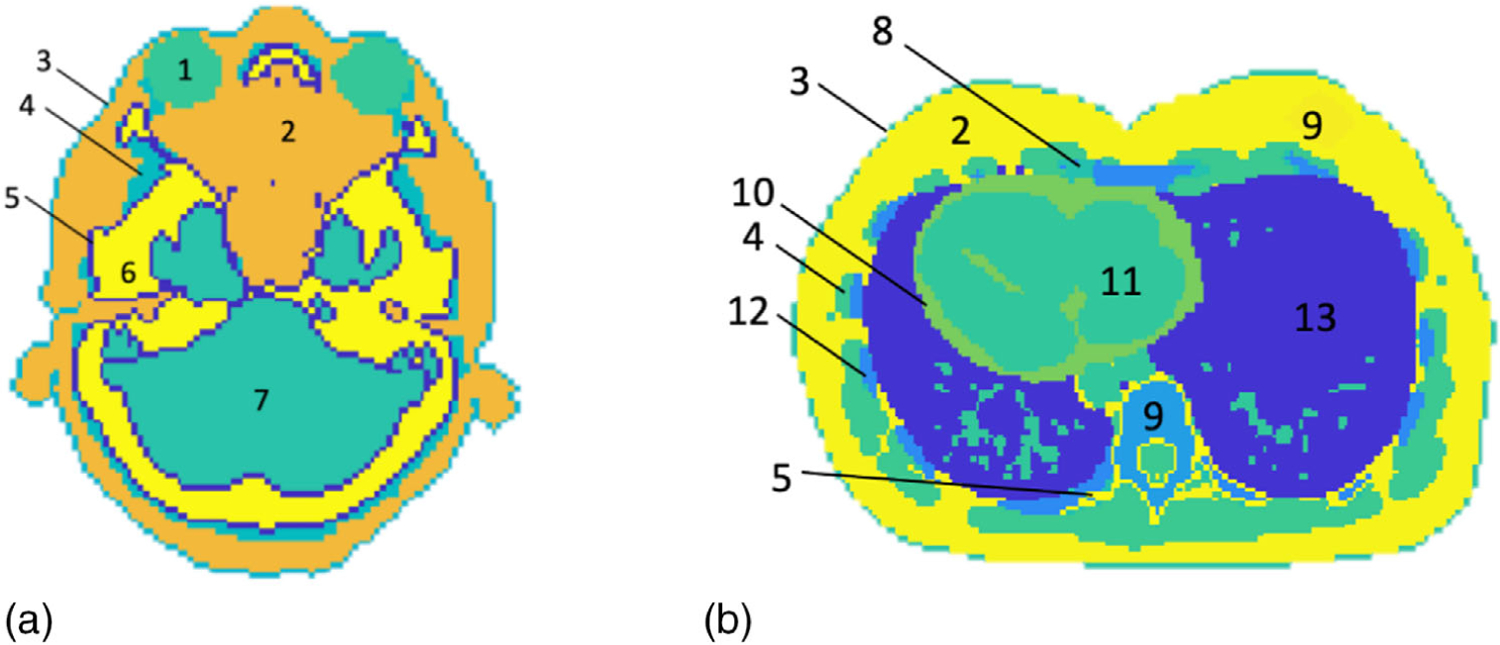
Two slices of the adult phantom representing (a) the head and (b) the lung region. The tissue names and SPRs corresponding to the labels were tabulated in Table 1
TABLE 1.
Tissue names and reference values of SPR corresponding to label numbers in Figure 3
| Label | Tissue | True SPR |
|---|---|---|
| 1 | Eye lens | 1.060 |
| 2 | Adipose | 0.979 |
| 3 | Skin | 1.084 |
| 4 | Muscle | 1.044 |
| 5 | Cortical bone | 1.714 |
| 6 | Cranium | 1.480 |
| 7 | Brain | 1.040 |
| 8 | Cartilage | 1.081 |
| 9 | Breast | 1.029 |
| 10 | Heart | 1.054 |
| 11 | Blood | 1.053 |
| 12 | Rib | 1.329 |
| 13 | Inflated lung | 0.258 |
2.8 |. SPR accuracy and image quality
For each insert of the cylindrical phantom, the mean and STD of the SPR were calculated in a circular region of interest (ROI) with 3.5 mm radius around the center of the insert. Percentage deviations of mean SPR in ROIs from reference values were also calculated. The difference map and a profile comparison between reconstructed and reference SPR were presented. WEPL along a proton beam with 4 mm width (WEPL4mm) of the reconstructed SPR was compared with that of true SPR at different locations and angles. The accuracy in WEPL4mm is more clinically meaningful than the accuracy of individual pixels as it represents the proton range prediction of a therapeutic proton beam. The mean and STD of WEPL4mm were derived from a normal distribution fitting the histogram of the WEPL4mm deviations.
The radial edge spread function (ESF) of the cortical bone insert was studied to evaluate the spatial resolution using Richard’s method.35 The ESF was fitted by an error function to reduce the impact of the noise at the uniform region.36 From the fitted ESF, line spread function (LSF) and modulation transfer function (MTF) were derived. The MTF was further interpolated to find the frequency at 10% MTF. The STD of the cylinder phantom’s water background was calculated as the noise level of the reconstructed image. The mean signal-to-noise ratio (SNR) of all inserts was reported.
For the adult phantom, the mean and STD of the SPR were calculated for selected ROIs representing different human tissues. The radius of all ROIs of human tissue was 5 mm. Percentage deviation of SPR from ground truth was derived in each ROI. The difference map and the profile comparison between reconstructed and reference SPR were included. Similarly, WEPL4mm was evaluated at different lateral offsets and angles for the adult phantom. The mean and STD of WEPL4mm were derived from a normal distribution fitting the histogram of the WEPL4mm deviations.
2.9 |. Noise reduction of the reconstructed SPR maps
To reduce the noise in the reconstructed SPR of the head slice and the lung slice, an additional cubic smoothing spline was applied to the corrected WEPL after the second iteration. The SPR was then reconstructed from the further smoothed WEPL using the SART-TV algorithm. The SPR accuracy was analyzed in the selected ROIs. Profile comparison between smoothed SRP and reference SPR was displayed.
2.10 |. Imaging dose
Total imaging dose was calculated at the head and lung region of the ICRP adult phantom. Same number of protons per beam (2000 protons/beam), lateral spot space (1 mm), and gantry angles (half-scan in 1° increment) as the ones used for reconstruction were adopted in the dose calculation. The contribution of scattering protons when imaging the neighboring slices within ±10 cm was included in the calculation of dose distribution. For a slice thickness of 1.5 mm, the dose calculation included 133 slices sandwiching the slice of interest.
2.11 |. Clinical translatability
The reference SPR image of the ICRP adult phantom was used to create a posterior fossa boost plan on a planning target volume (PTV) of 3 cm in diameter in RayStation (v10A). Three proton beams, one posterior and two posterior oblique beams, were employed to deliver a uniform dose to the PTV. The plan was recalculated with the SPR image from our pCT reconstruction. The dose distribution and dose volume histogram (DVH) at the PTV were compared between the two images for one fraction.
2.12 |. Comparison with single-energy CT
The proposed reconstruction approach was compared with the single-energy CT (SECT) method using a CIRS electron density phantom (model 062 M), which has tissue-equivalent inserts with known composition provided by the vendor. Same water-based cylindrical phantom as the one introduced in Sec 2. F was assigned with CIRS inserts materials in the pCT simulation. 230 MeV proton beams and 2 mm detector resolution along the beam direction were employed in the simulation. The SECT scan was performed on the Phillips Big Bore scanner at 120 kVp with 3 mm collimation. A standard filtered back-projection was applied to reconstruct the SECT images, which were then converted to SPR images using the standard stoichiometric calibration.37 Mean SPR of each insert was computed in an ROI of 3.5 mm in radius for both pCT and SECT image and was compared to the reference SPR calculated from the material composition.38
3 |. RESULTS
3.1 |. Accuracy of the forward model
Typical examples of the IDDs from the forward model and the simulation were normalized and plotted together for comparison in Figure 4. These IDDs were calculated with the cylindrical water-based phantom introduced in Sec 2.F at gantry angle 0° and lateral offsets relative to the imaging isocenter from 0 to 55 mm with 5 mm spacing. IDDs calculated through the forward model matched well with those directly scored from the Monte Carlo simulation. Root-mean-square-error and R2 between the two sets of IDDs at all lateral offsets and rotation angles were 0.02 and 0.99, respectively.
FIGURE 4.
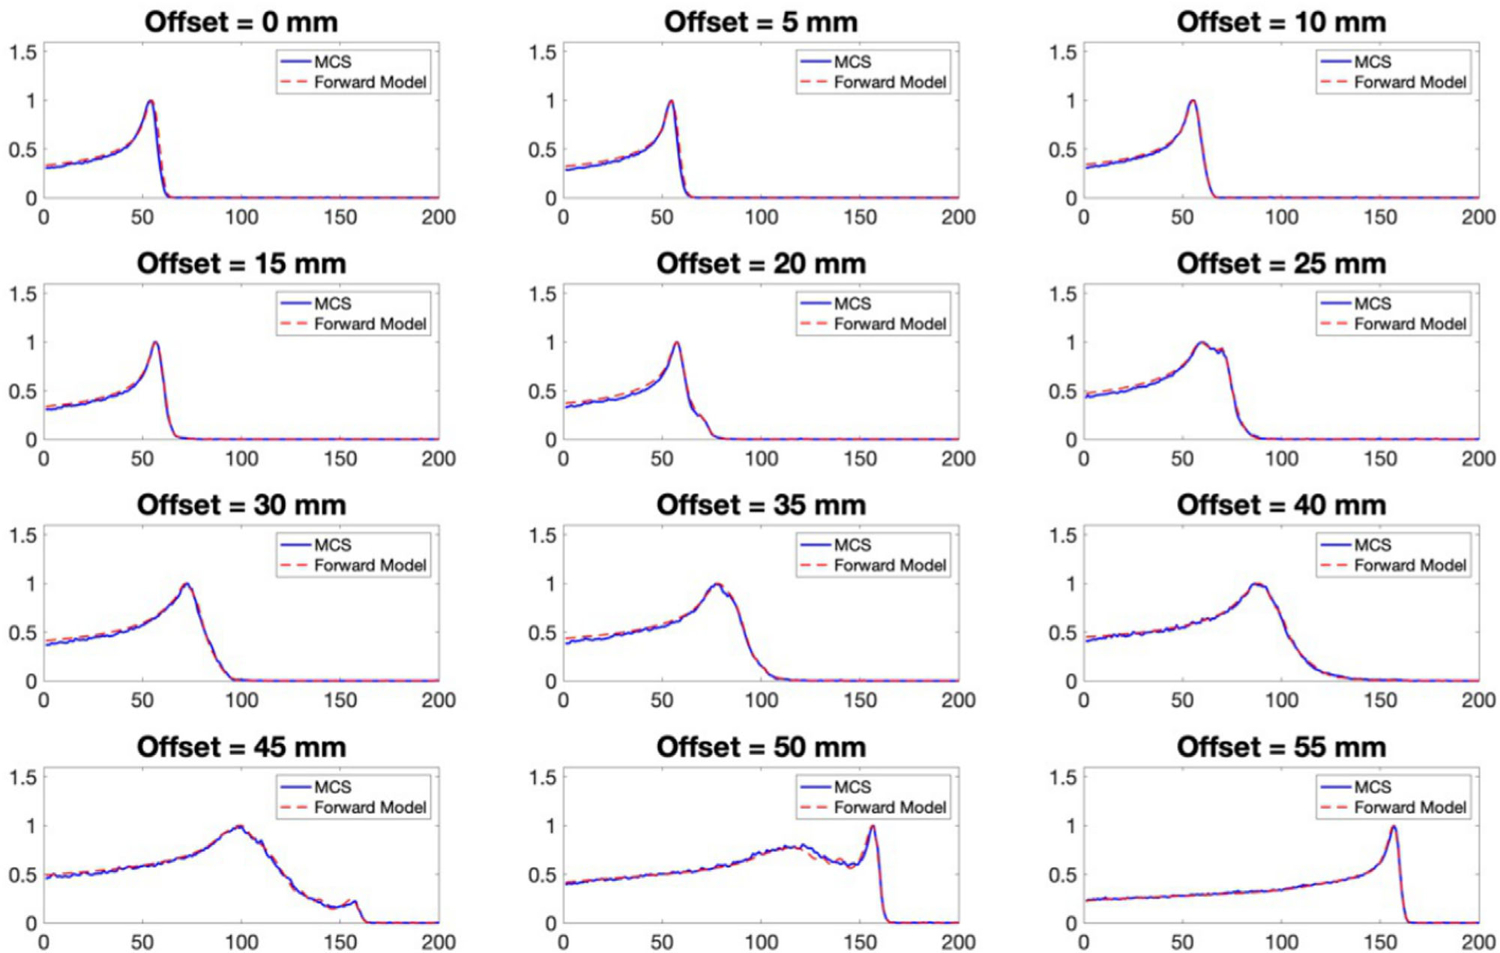
Examples of IDDs calculated from the forward model (red dashed line) compared with the corresponding IDDs obtained from the Monte Carlo simulation (blue solid line), with the cylindrical water-based phantom at gantry angle 0° and different offsets from 0 to 55 mm
3.2 |. Reconstructed SPR of the cylindrical water-based phantom
Initial values of WEPL, or sinogram, calculated from the shift of the IDDs with and without the presence of the imaging object and the corresponding SPR map obtained from SART-TV reconstruction were presented in Figures 5(a) and 5(b), respectively. The external contour of the cylinder phantom can be seen, but the inserts appear blurry and connected due to the large proton spot size. After the first iteration, the WEPL captured more structures of the imaging object (Figure 5(c)) and the outlines of the inserts in the SPR map appear distinctively (Figure 5(d)). However, overcorrections in the first round of WEPL determination led to artifacts in the SPR map. The accuracy of WEPL was further improved in the second iteration. The final corrected WEPL and its corresponding SPR map were presented in Figures 5(e) and 5(f), respectively. It can be seen in Figure 5(f) that all the 12 inserts can be clearly distinguished from the water background with reduced artifacts.
FIGURE 5.
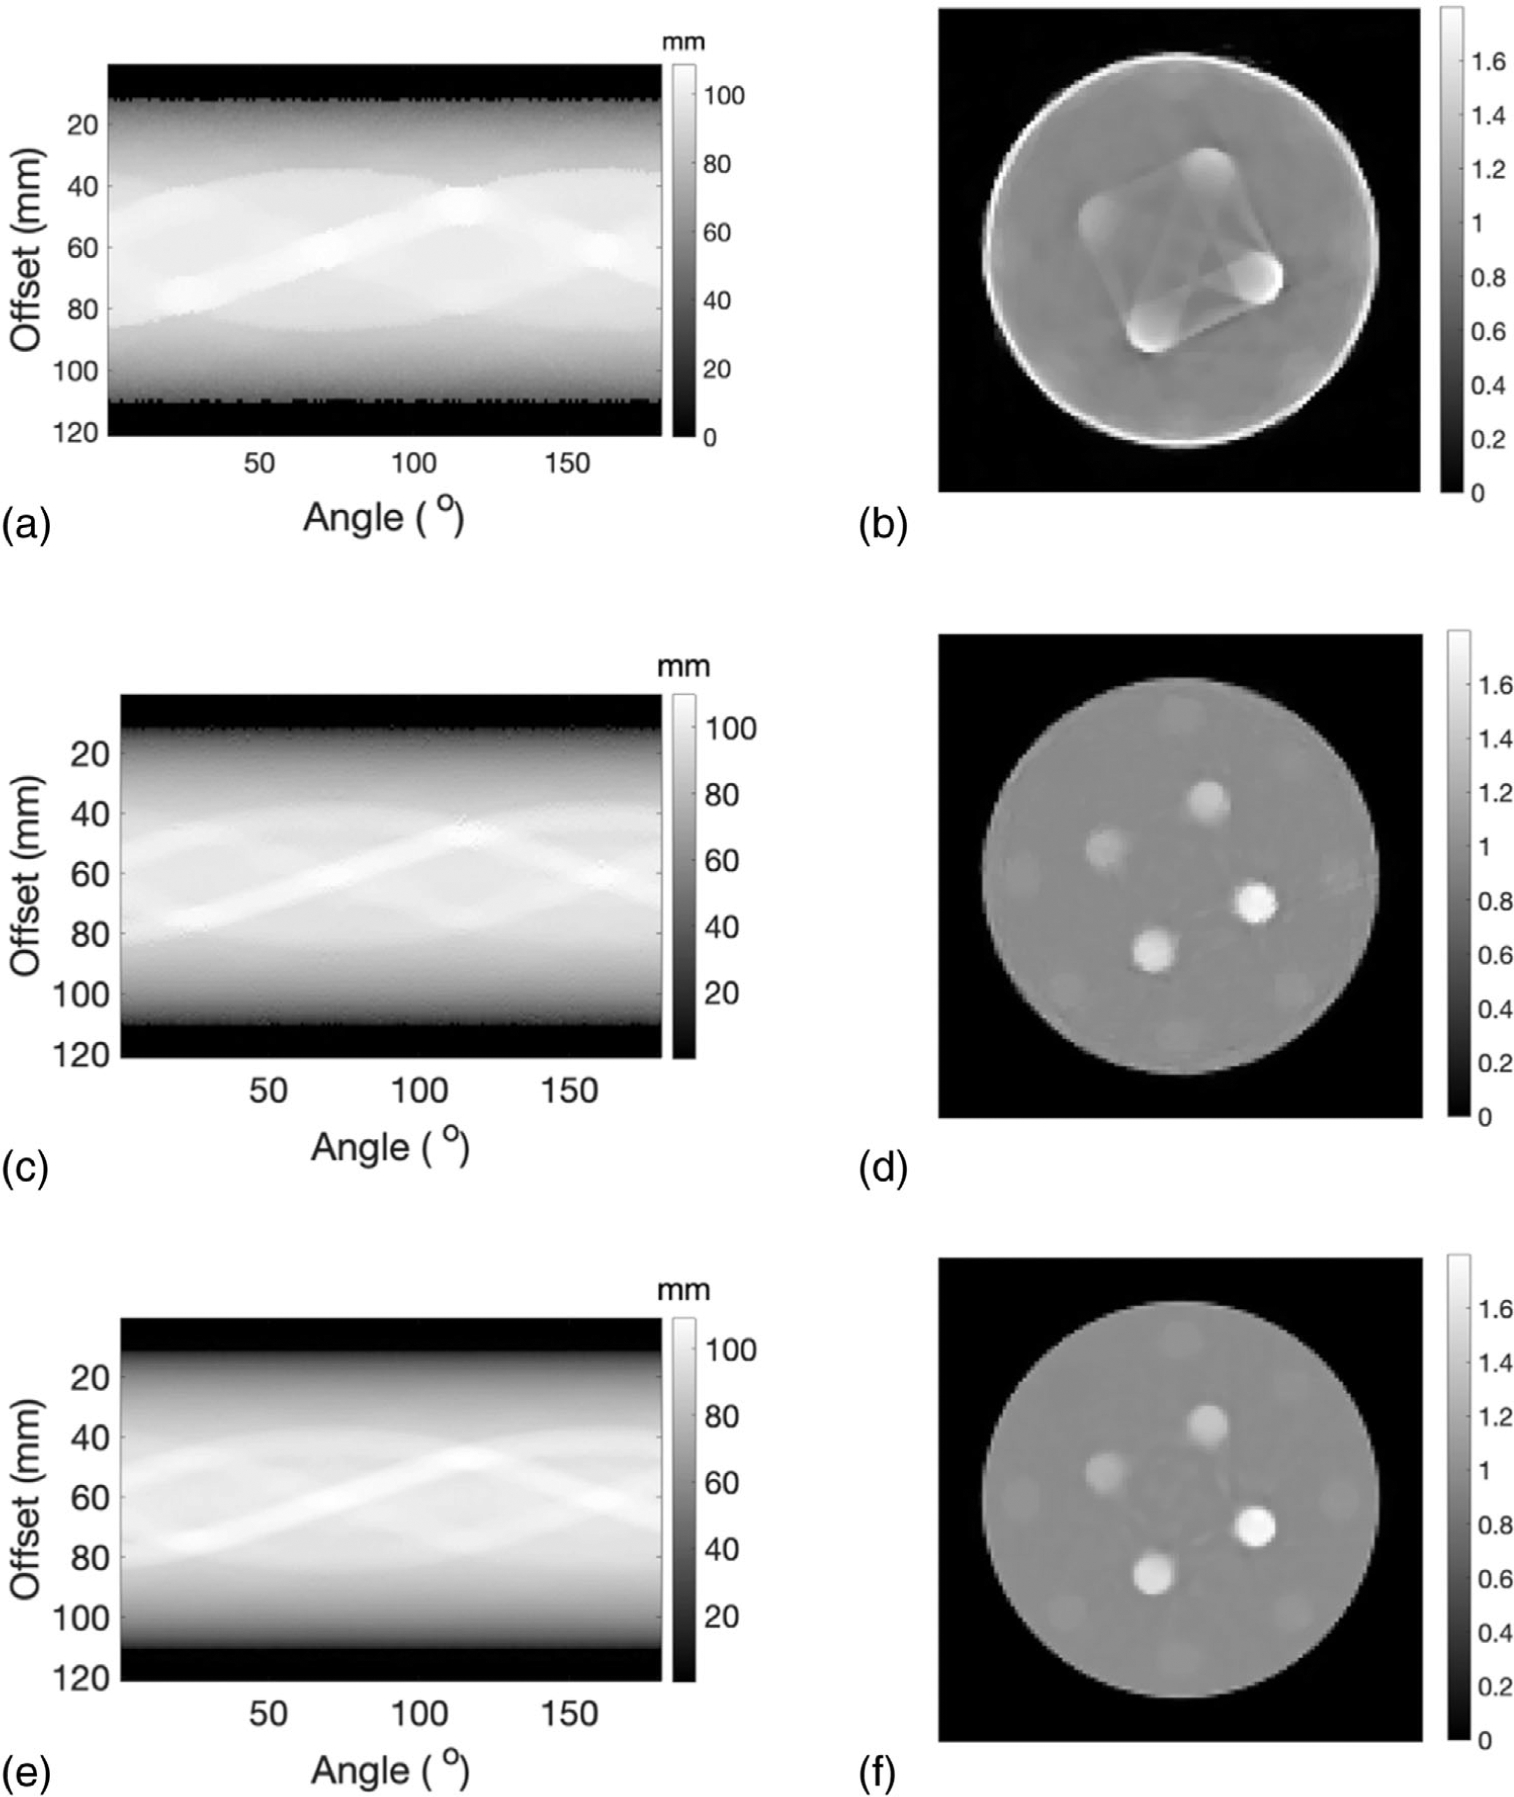
(a) The initial WEPL determined through shift between Bragg peak locations with and without the imaging object. (b) SPR distribution reconstructed from the initial values of WEPL. (c) Corrected WEPL after first iteration. (d) SPR distribution reconstructed from corrected WEPL after the first iteration. (e) Corrected WEPL and its corresponding (f) SPR distribution after the second iteration
3.3 |. SPR accuracy and spatial resolution
ROIs of the 12 inserts were identified by the red circles in Figure 6(a). The yellow line in Figure 6(a) indicated the line along which the profiles of reconstructed and reference SPR were compared. Mean SPR calculated in the ROIs were plotted against the reference values with error bars denoting the STD (Figure 6(b)). Deviations of the mean SPR in the ROIs from the reference values were summarized in Figure 6(c), where the two red dashed lines delineated the ±1% error boundaries, which were the targeted maximum uncertainty for proton CT. The deviations of mean SPR from the ground truth in all inserts were within ±1%. The mean of absolute deviation in all inserts was 0.33%. Figure 6(d) showed the pixel-wise difference between reconstructed SPR and reference SPR. The most pronounced difference was observed around the edges of the inserts and the phantom due to proton range mixing caused by scattering. Figure 6(e) further compared the profile of the reconstructed SPR with that of the ground truth SPR along the line crossing the mandible and cortical inserts depicted by the yellow line in Figure 6(a).
FIGURE 6.
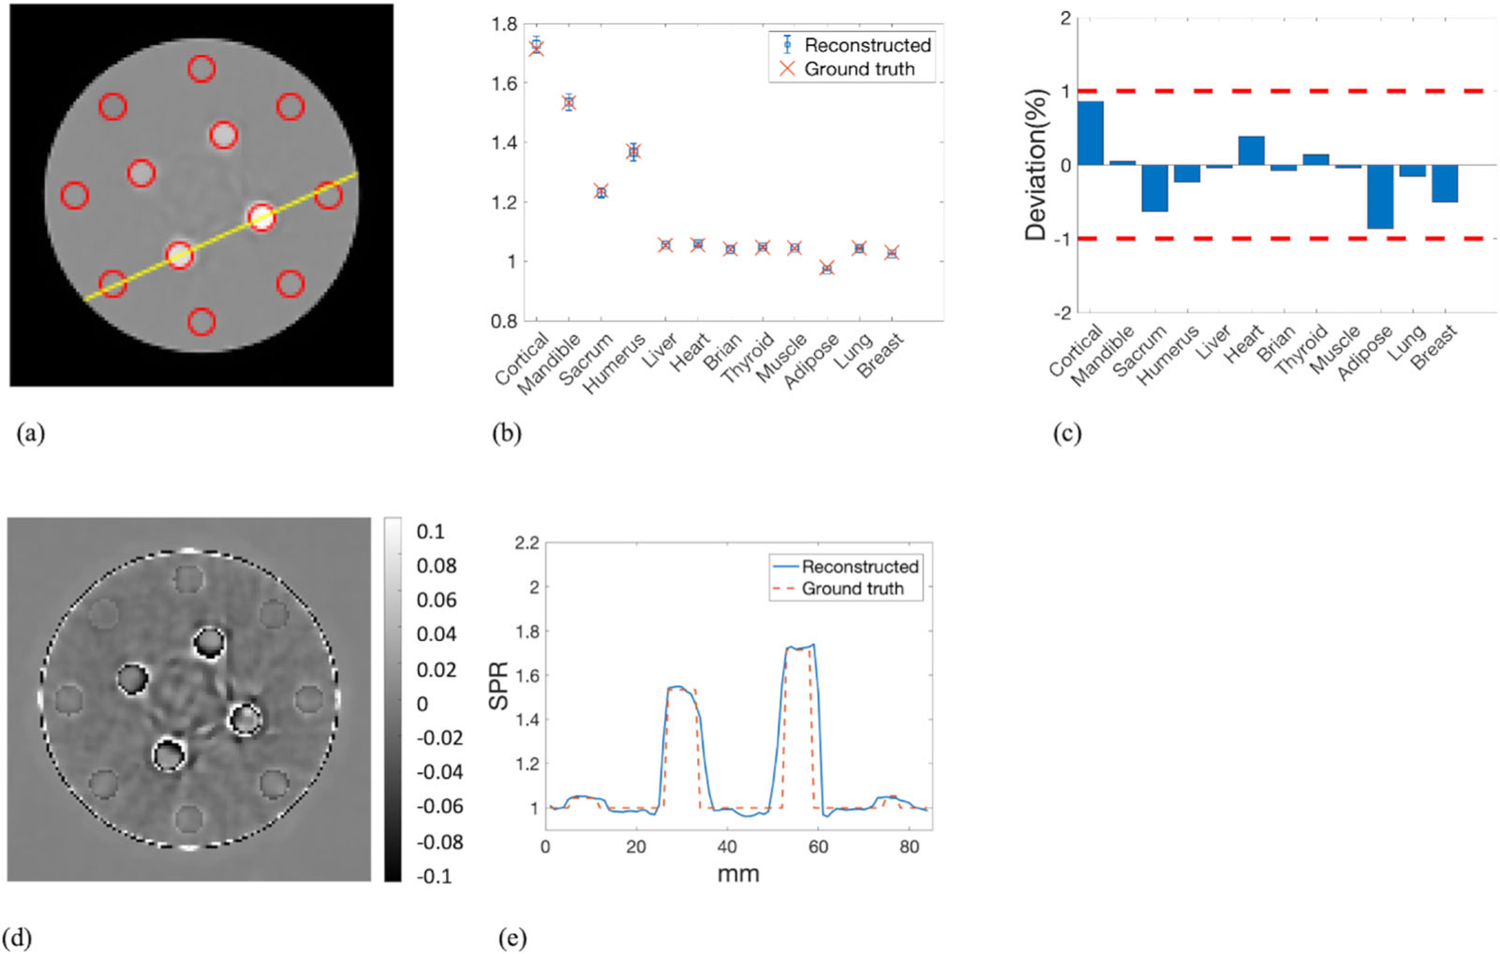
(a) ROIs of the inserts over which the mean and STD of the SPR were calculated. The yellow line indicated the line along which the profiles of reconstructed SPR and reference SPR were compared. (b) The mean value of the reconstructed SPR in each ROI with the associated error bar indicating the STD was plotted along with the reference values of SPR. (c) The deviations of the mean SPR in the ROIs from the ground truth. (d) Pixel-wise difference map between reconstructed SPR and reference SPR. (e) Profile comparison of reconstructed SPR and reference SPR along the line depicted in panel (a)
WEPL4mm of the reconstructed SPR was compared with that of the reference SPR at beam offset −20, 0, and 20 mm relative to the isocenter (Figures 7(a)–7(c)). At each offset, WEPL4mm was calculated around the isocenter from 0° to 180° with 1° increments. The corresponding percentage deviation in WEPL4mm from ground truth was displayed below each WEPL4mm comparison plot with two red dashed lines highlighting the ±1% target deviation. The histogram of percentage deviations in WEPL4mm was presented in Figure 7(d). The mean and STD of the fitting normal distribution were 0.48% and 0.64%, accordingly.
FIGURE 7.
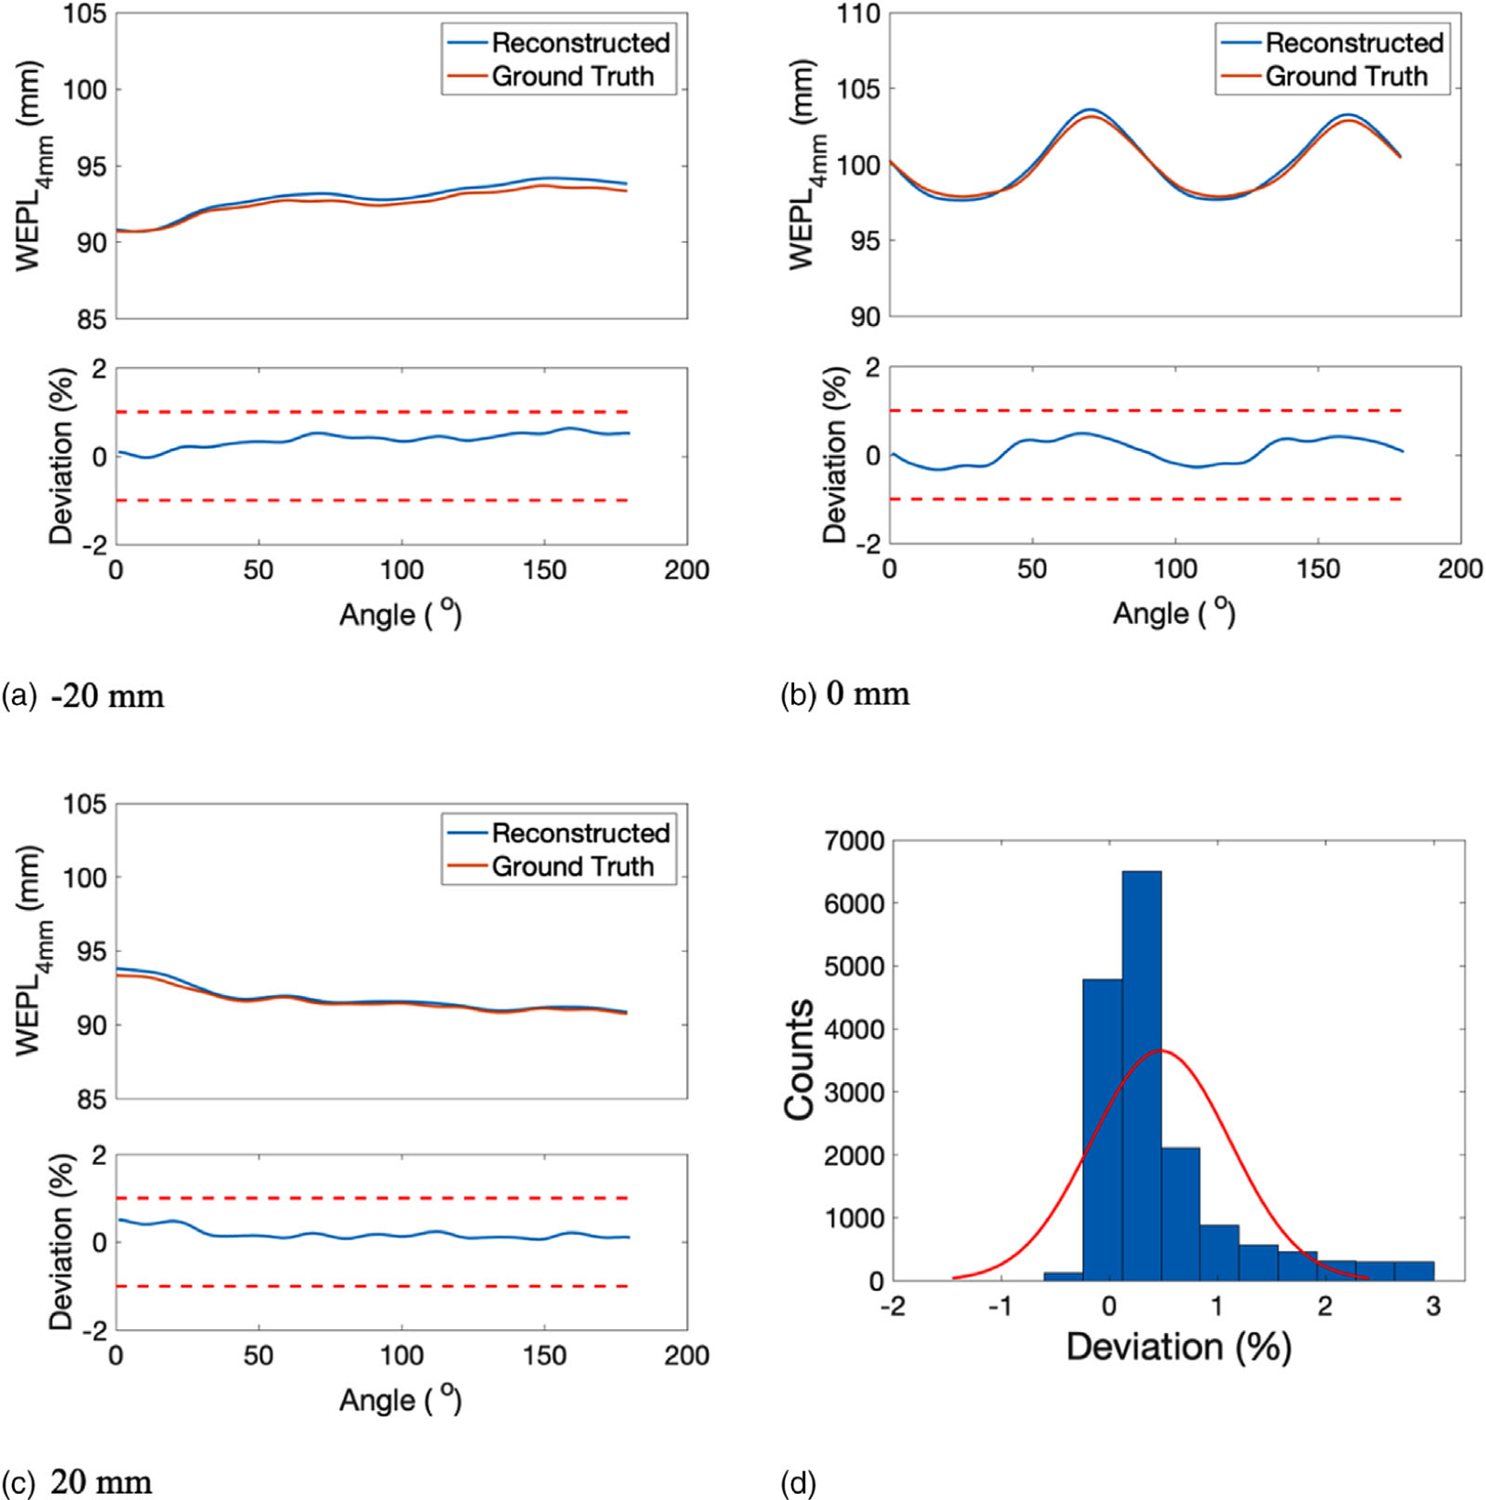
WEPL4mm of the reconstructed SPR and the reference SPR at beam offset of (a) −20 mm, (b) 0 mm, and (c) 20 mm. The corresponding deviation in WEPL4mm was displayed below each WEPL comparison plot. (d) Histogram of the deviations in WEPL4mm fitted by a normal distribution (red curve)
The radial ESF at the edge of the cortical inserts was fitted by an error function and compared with the true edge in Figure 8(a). The corresponding LSF was displayed in Figure 8(b), from which the full width at half maximum was measured as 0.13 cm. Furthermore, the MTF was derived and interpolated in Figure 8(c). The frequency where the MTF dropped to 10% was 6.38 cm–1. The mean SNR of all inserts was 2.45.
FIGURE 8.

(a) Edge spread function, (b) line spread function, and (c) modulation transfer function derived and interpolated at the edge of the cortical insert
3.4 |. Patient phantom
3.4.1 |. Head region of the adult phantom
In this section, reconstruction results of a single slice that represents the head region of the adult phantom were presented. Initial values of WEPL and the corresponding SPR distribution for a slice representing the head region of the adult phantom were displayed in Figures 9(a) and 9(b), respectively. Similar to the cylindrical phantom, the initial SPR had low resolution due to the large spot size. Optimized WEPL after the first and second iteration and the corresponding SPR distributions were presented in Figures 9(c)–9(f).SPR resolution was improved significantly by the first iteration, while artifacts caused by local minima can be observed. Artifacts were alleviated after the second iteration.
FIGURE 9.
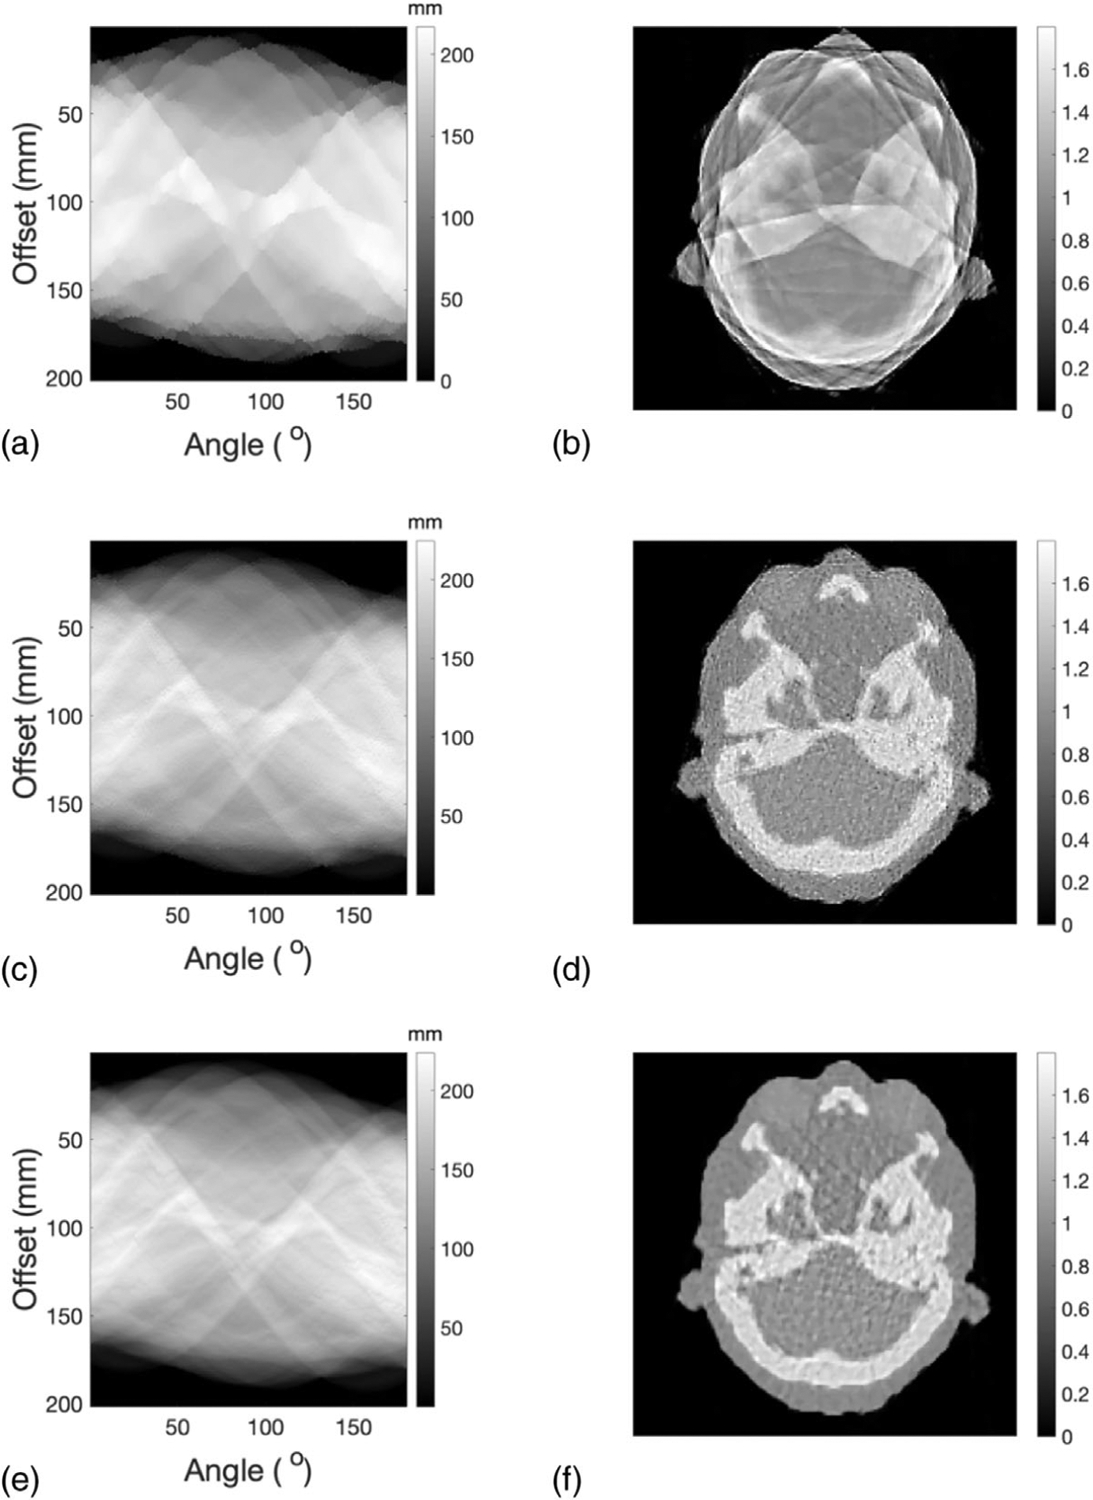
(a) Initial values of WEPL for a slice of adult phantom representing the head region. (b) SPR distribution reconstructed from the initial values of WEPL. (c) Optimized WEPL after the first iteration. (d) SPR distribution reconstructed from corrected WEPL after the first iteration. (e) Optimized WEPL and its corresponding (f) SPR distribution after the second iteration
The mean and STD of SPR were calculated in the ROIs that were selected for different tissue types as illustrated by the red circles in Figure 10(a). The yellow line in Figure 10(a) indicated the line along which the profiles of reconstructed SPR and reference SPR were compared. The mean values of the SPR in ROIs were then compared with the reference values in Figure 10(b). Percentage deviations in mean SPR from the reference values were summarized in Figure 10(c), where the two red dashed lines indicates the target ±1% boundary. The mean absolute deviation of averaged SPR in selected ROIs was 0.19%. The pixel-wise difference between reconstructed SPR and reference SPR was shown in Figure 10(d). The most noticeable difference was observed around the interfaces between bony tissue and soft tissue. Figure 10(e) plotted the profile of the reconstructed SPR compared with that of the reference SPR along the yellow line shown in Figure 10(a).
FIGURE 10.
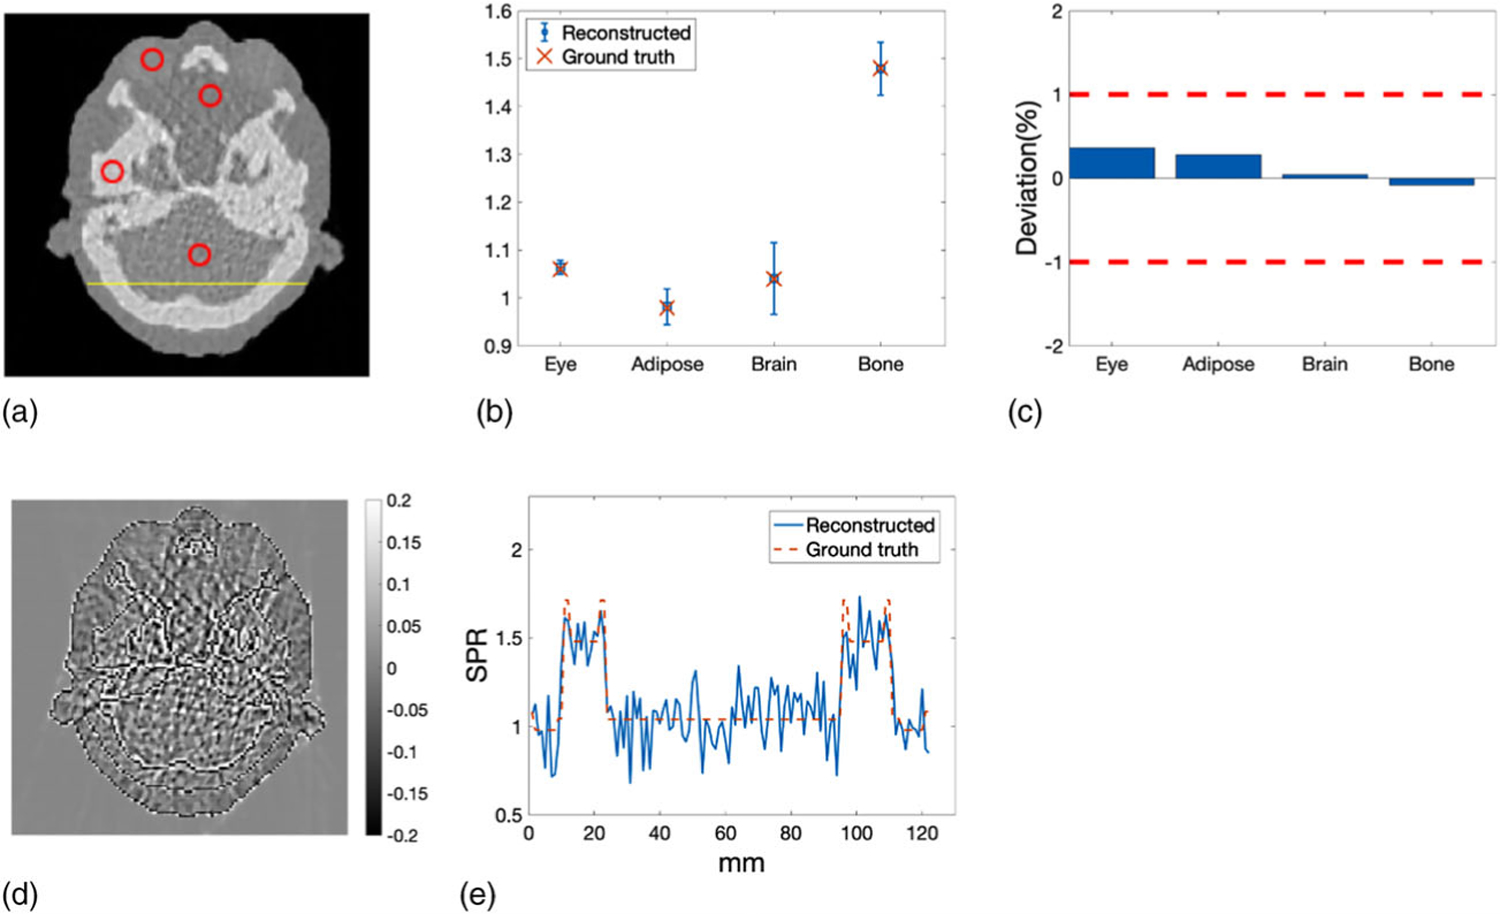
(a) ROIs representing different tissue types where the mean and STD of SPR were calculated. The yellow line indicated the line along which the profiles of reconstructed SPR and reference SPR were compared. (b) Mean SPR in the ROIs compared with the reference values of SPR. Error bars indicate the STD of the SPR within the ROIs. (c) Deviations of the mean SPR in the ROIs from the reference values of SPR. (d) Pixel-wise difference between reconstructed SPR and reference SPR of the head slice. (e) Profile comparison of reconstructed SPR and reference SPR along the yellow line depicted in panel (a)
WEPL4mm of reconstructed SPR at the head region of the adult phantom was compared with that of the reference SPR at a beam offset of −40, 0, and 40 mm (Figures 11(a)–11(c)). The corresponding percentage deviation from the reference WEPL4mm was shown below each WEPL4mm plot, with red dashed lines showing the ±1% boundary. The histogram of the deviations in WEPL4mm was shown in Figure 11(d), from which the mean and STD of the fitting normal distribution were calculated as 0.28% and 0.48%, respectively.
FIGURE 11.
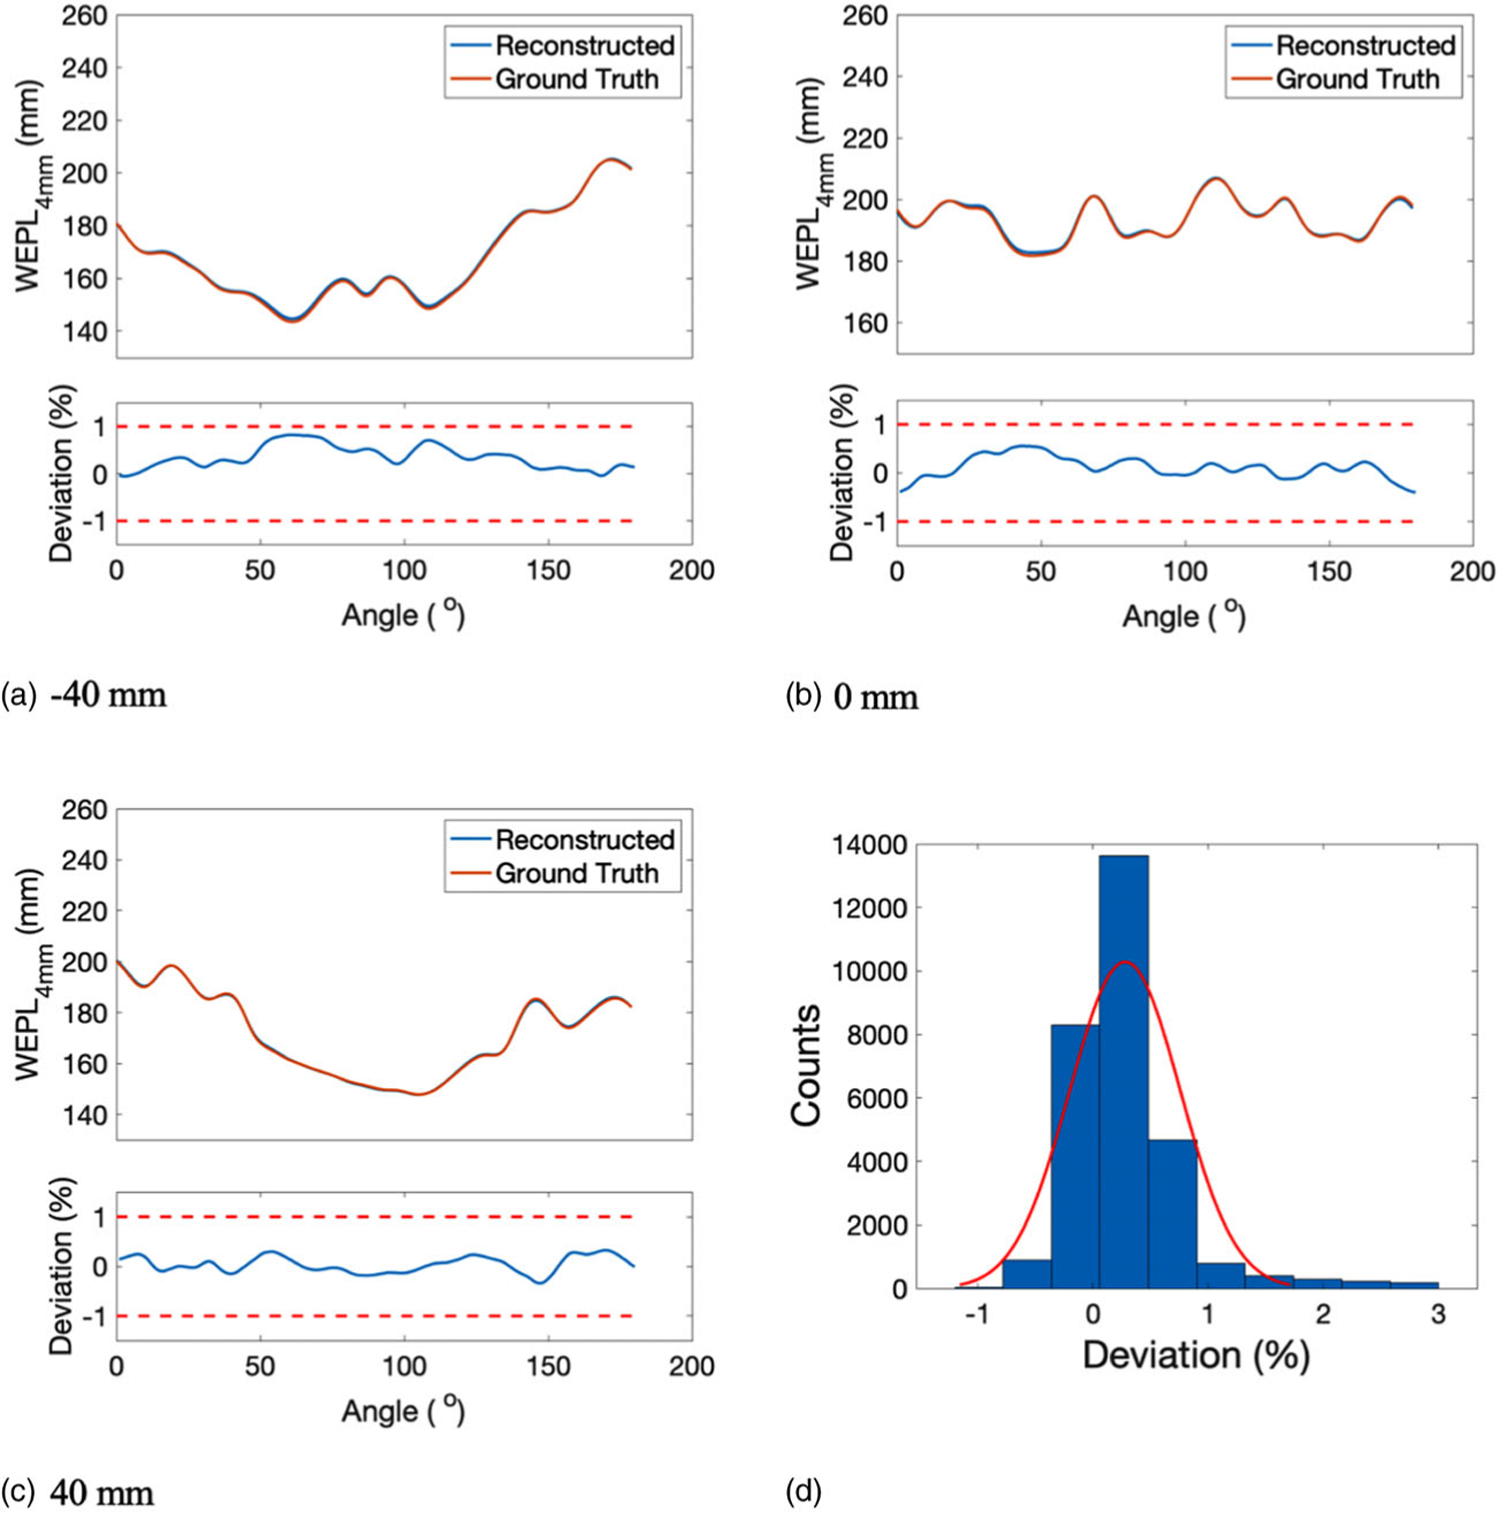
WEPL4mm of the reconstructed SPR and the reference SPR at beam offset of (a) −40 mm, (b) 0 mm, and (c) 40 mm. The corresponding deviation in WEPL4mm was displayed below each WEPL4mm plot. (d) Histogram of the deviations between the reconstructed and the reference WEPL4mm, which was fitted by a normal distribution illustrated by the red curve
3.4.2 |. Lung region of the adult phantom
The reconstructed results of a single slice representing the lung region of the adult phantom were presented in the same order as the reconstructed results of the head slice elaborated in the previous section. The process of the WEPL determination, including the initial starting point and optimized WEPL after the first and second iteration, were listed in Figures 12(a), 12(c), and 12(e), respectively. Their corresponding SPR images were shown in Figures 12(b), 12(d), and 12(f). SPR distribution of lung slice was reconstructed with acceptable spatial resolution and little artifacts after two iterations of WEPL correction.
FIGURE 12.
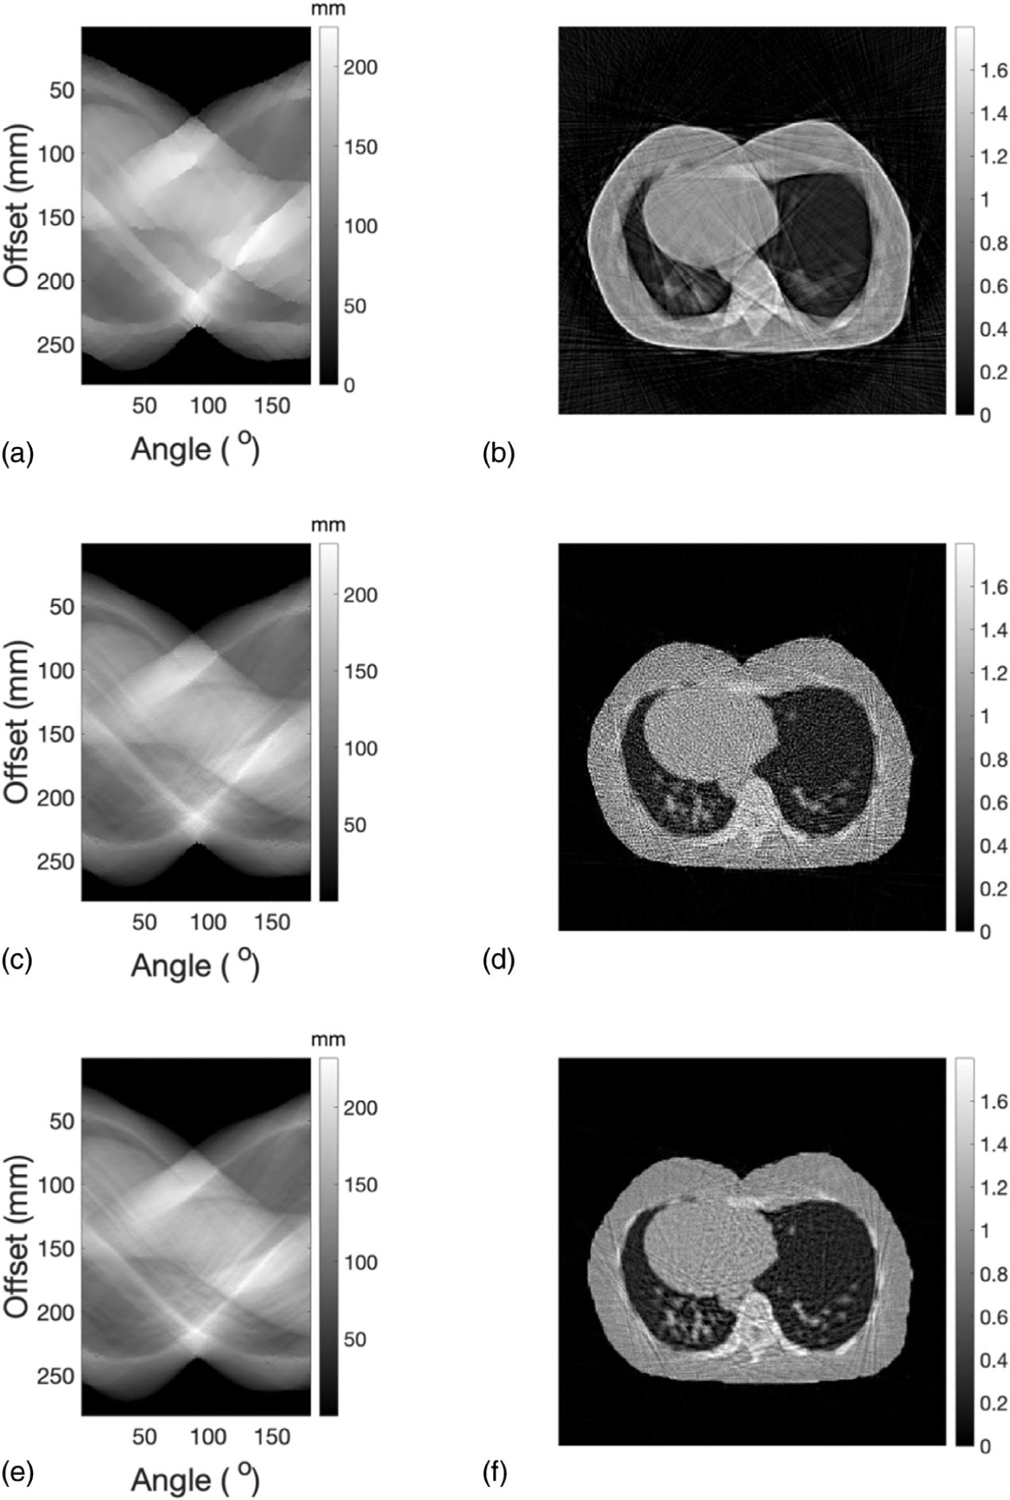
(a) Initial WEPL for a slice representing the lung region of the adult phantom. (b) SPR distribution reconstrued from the initial values of WEPL. (c) Corrected WEPL after the first iteration. (d) SPR distribution reconstructed from corrected WEPL after the first iteration. (e) Corrected WEPL and its corresponding (f) SPR distribution after the second iteration
Mean and STD of the SPR in selected ROIs, indicated by the red circles in Figure 13(a), were plotted along with their reference values in Figure 13(b).Deviations of SPR in selected ROIs from reference values were within ±1% boundary, as shown in Figure 13(c). The mean absolute deviation of SPR in selected ROIs was 0.27%.The pixel-wise difference between reconstructed SPR and reference SPR was shown in Figure 13(d). Figure 13(e) presented a comparison between the reconstructed SPR profile and the reference SPR profile along the yellow line delineated in Figure 13(a).
FIGURE 13.
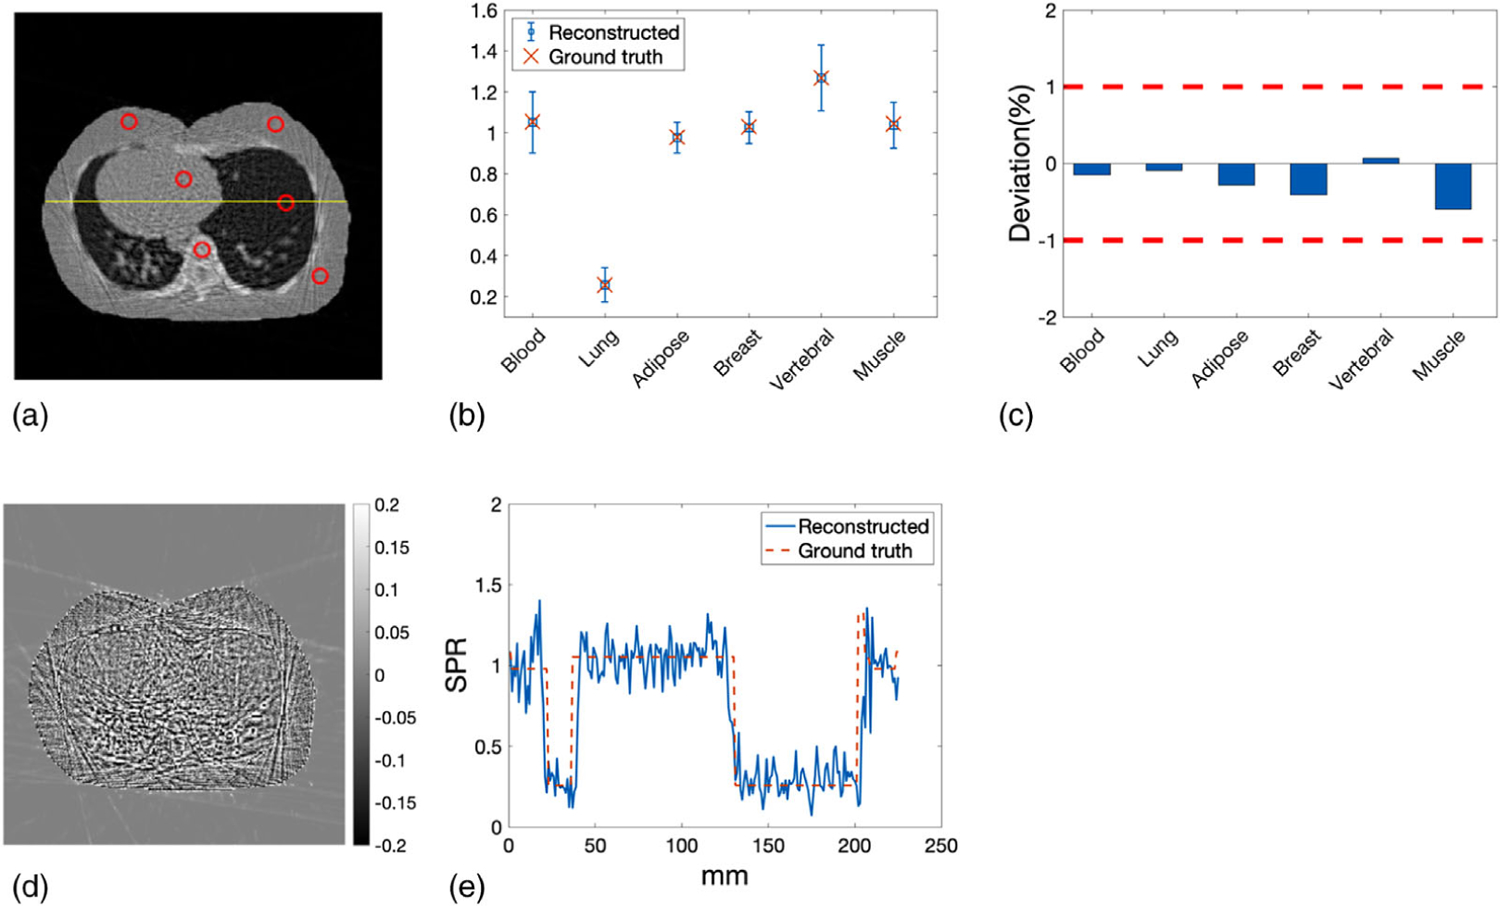
(a) ROIs representing different tissue types in the lung slice where the mean and STD of SPR were calculated. (b) The mean of reconstructed SPR in every ROIs compared with ground truths. Error bars indicate the STD of SPR within each ROI. (c) Deviations of reconstructed SPR in ROIs from the ground truths. (d) Difference between reconstructed SPR and reference SPR of the lung slice. (e) Profile comparison of reconstructed SPR and reference SPR along the yellow line delineated in panel (a)
WEPL4mm of the reconstructed lung slice was compared with that of the reference lung slice at beam offset of −40, 0, and 40 mm (Figures 14(a)–14(c)). The corresponding percentage deviations from reference WEPL4mm were displayed below the WEPL4mm comparison plot. The histogram of the deviations in WEPL4mm at all offsets and angles was shown in Figure 14(d), which was fitted by a normal distribution shown by the red curve. The mean and STD of the normal distribution were 0.22% and 0.49%, respectively.
FIGURE 14.
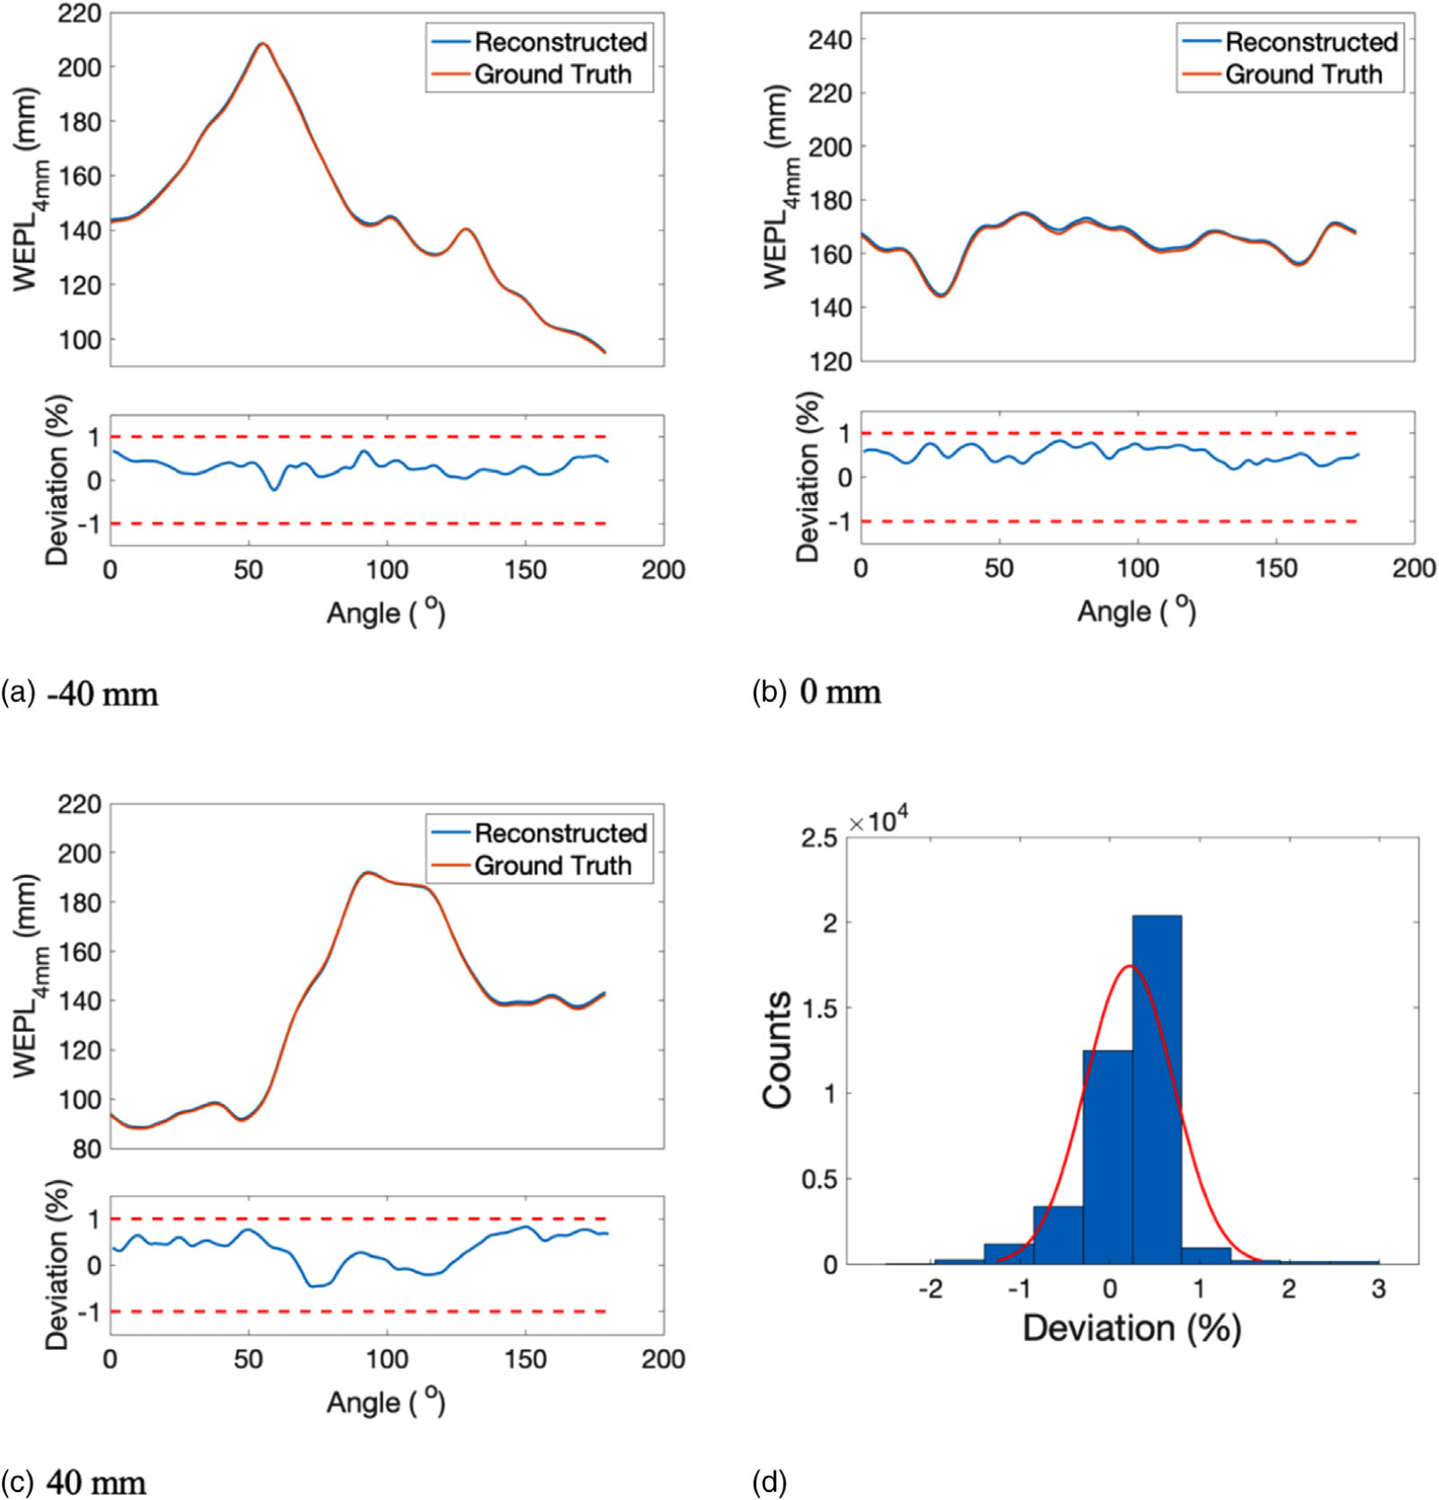
WEPL4mm of the reconstructed SPR and the reference SPR at beam offset of (a) −40 mm, (b) 0 mm, and (c) 40 mm. The corresponding deviation in WEPL4mm was displayed underneath each WEPL4mm plot. (d) Histogram of the deviations between the reconstructed and the reference WEPL4mm, which was fitted by a normal distribution illustrated by the red curve
3.4.3 |. Noise reduction of the reconstructed SPR images
SPR distribution of the head slice reconstructed from smoothed WEPL was shown in Figure 15(a). Its corresponding mean and STD of SPR calculated in the ROIs depicted by Figure 10(a) were shown in Figure 15(b). The STD was reduced compared with Figure 10(b) because of the additional smoothing applied on the corrected WEPL. Percentage deviations of the mean SPR from reference values were demonstrated in Figure 15(c). All deviations were within ±1%, with absolute mean of 0.33%. In Figure 15(d), profile of smoothed SPR and reference SPR were compared along the line illustrated in Figure 10(a). Similarly, Figures 15(e) and 15(f) were SPR reconstructed from smoothed WEPL, mean and STD of SPR in selected ROIs, percentage deviation of mean SPR from reference values, and SPR profile comparison with ground truth for the lung slice, respectively. The STD of SPR in selected ROIs was reduced by the additional smoothing without sacrificing the SPR accuracy.
FIGURE 15.
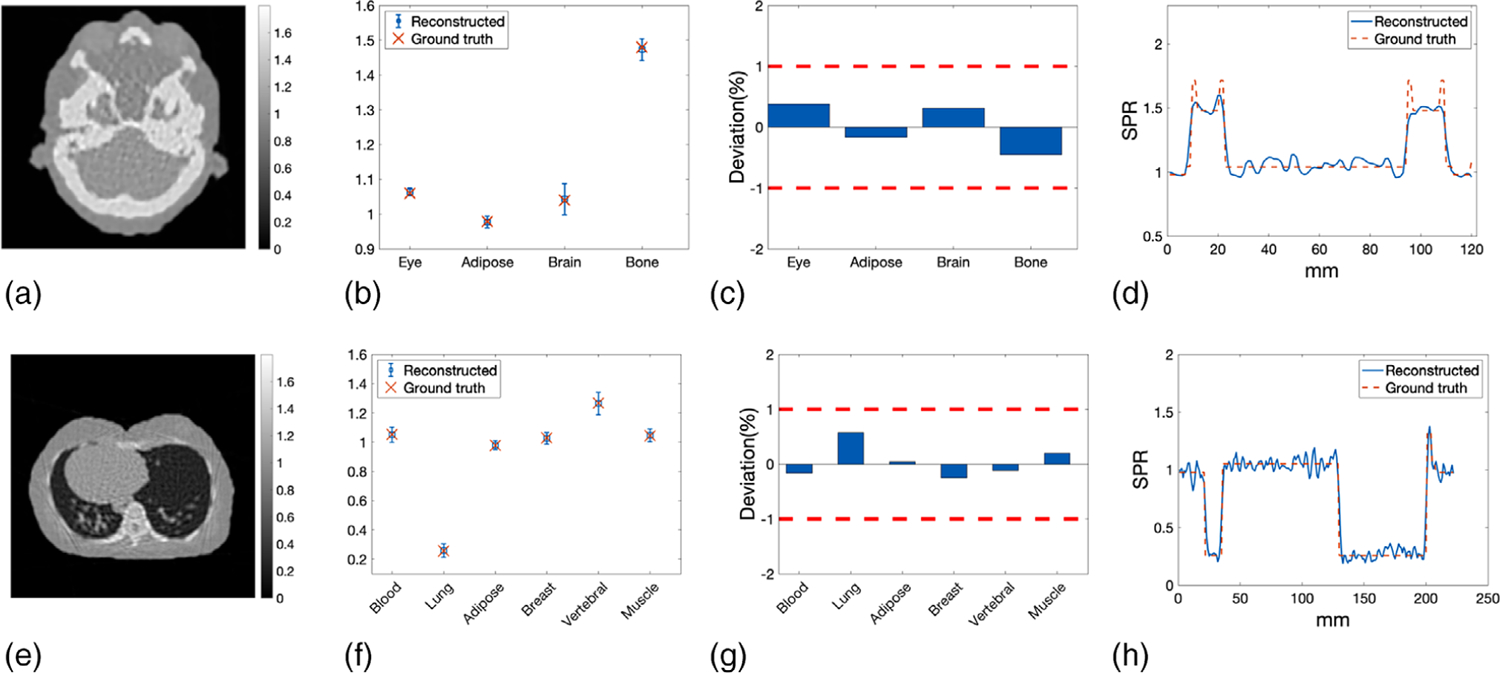
(a) Reconstructed SPR distribution of the head slice from the corrected WEPL with additional smoothing. (b) Mean and STD of smoothed SPR of the head slice calculated in selected ROIs compared with reference values. (c) Percentage deviation of mean SPR of the head slice from the reference values. The two red dashed lines indicated the ±1% target deviation. (d) Profile along the line delineated in Figure 10(a) of smoothed SPR compared with that of the reference SPR. (e) Reconstructed SPR distribution of the lung slice from the corrected WEPL with additional smoothing. (f) Mean and STD of smoothed SPR calculated in selected ROIs of the lung slice compared with reference values. (g) Percentage deviation of mean SPR of the lung slice from the reference values. The two red dashed lines indicated the ±1% target deviation. (h) Profile along the line delineated in Figure 13(a) of smoothed SPR compared with that of the reference SPR
3.5 |. Dose distribution of the adult phantom
Simulated imaging dose distributions at the head and lung region of the ICRP phantom were displayed in Figure 16. The average dose was calculated as 0.29 and 0.25 cGy over the entire area of the head and lung, respectively.
FIGURE 16.
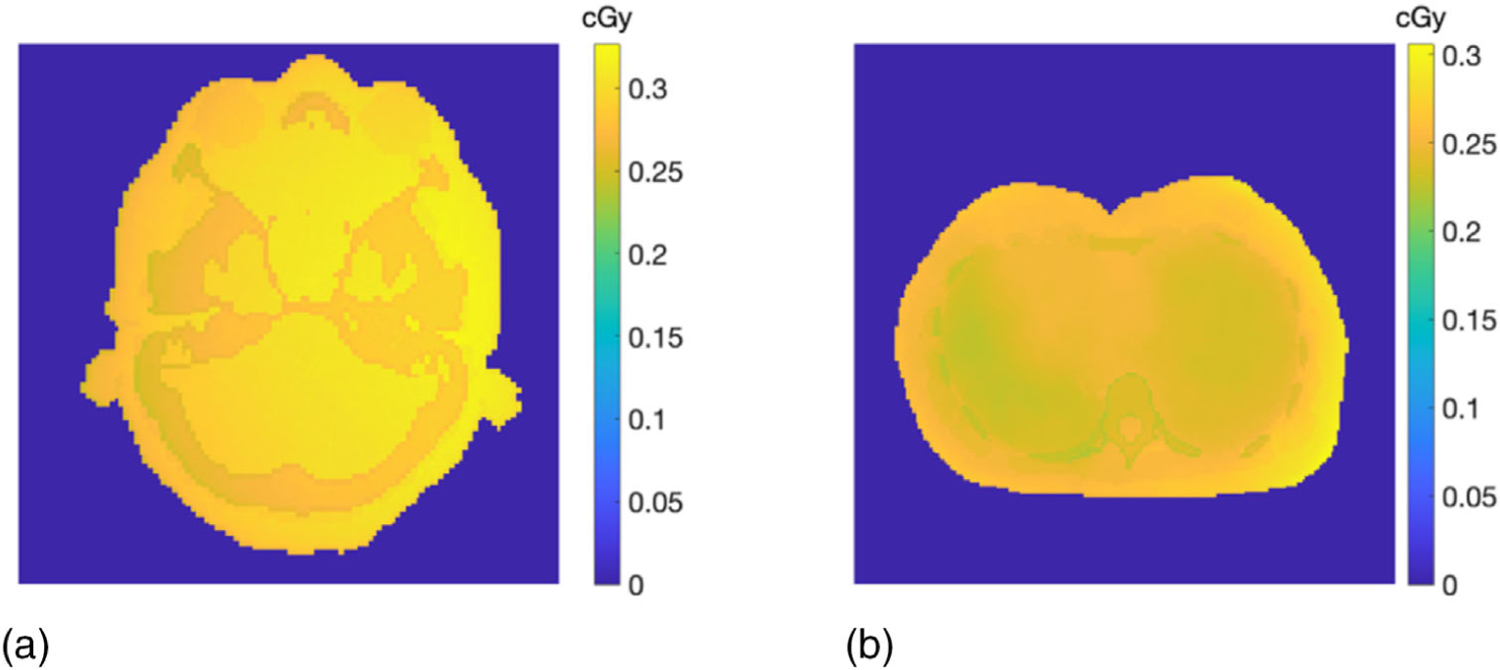
Simulated imaging dose at (a) the head and (b) the lung region of the ICRP adult phantom
3.6 |. Clinical translatability
The dose distribution calculated from the reference ICRP and reconstructed pCT SPR images was shown in Figures 17(a) and 17(b), accordingly. The dose difference between the two images was displayed in Figure 17(c). The accuracy and spatial resolution of the reconstructed SPR were sufficient to recalculate the treatment plan optimized on the reference ICRP images. Figure 17(d) compared the DVHs of the PTV calculated from the reference ICRP and reconstructed SPR images. The two DVHs overlapped well with each other. The percentage deviation from the ground truth volume within the PTV receiving 90% of the prescription dose was −0.62%.
FIGURE 17.
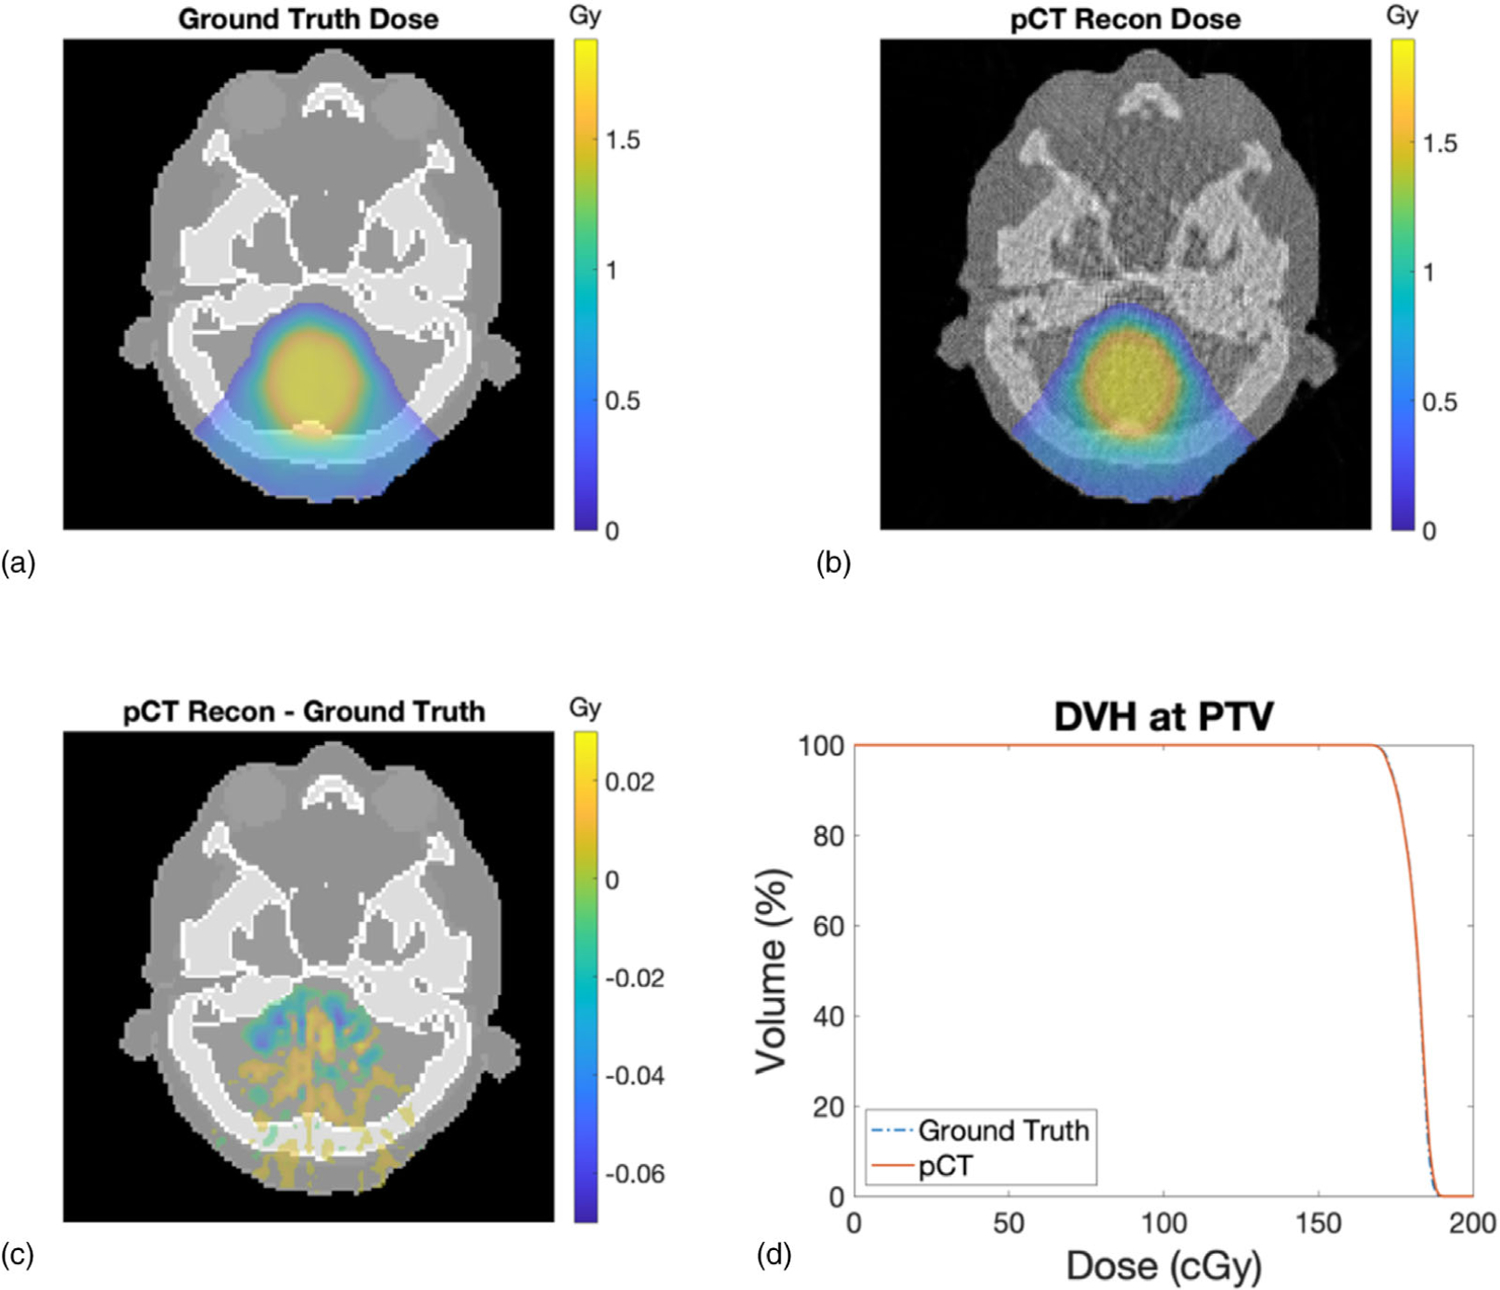
(a) Dose distribution calculated on the reference ICRP SPR image. (b) Dose distribution calculated on the reconstructed SPR image from the pCT simulation. (c) Dose difference between the reference ICRP and reconstructed pCT SPR images. (d) Comparison of PTV DVH
3.7 |. Comparison with SECT
Percentage deviations from the reference SPR through the pCT and SECT methods were compared in Figure 18(a). The SPR deviations calculated from the pCT approach were all within 1% (indicated by two red dash lines) with mean absolute deviation of 0.33%. The SPR deviations calculated from stoichiometric calibration on the SECT image were noticeably larger in most inserts with mean absolute deviation of 1.91%. The mean and STD of the insert SPRs were shown with the ground truth in Figure 18(b).
FIGURE 18.
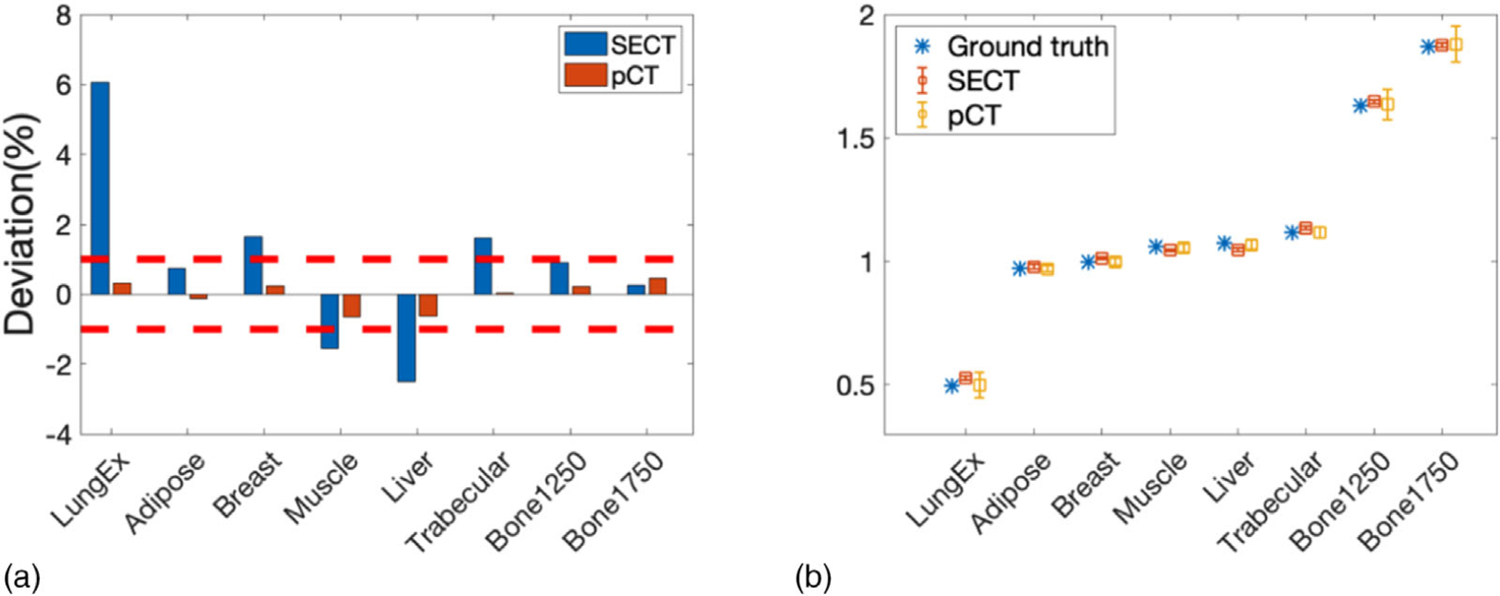
(a) Percentage deviation from the reference SPR at each insert calculated from the pCT and SECT approach. The two red dashed lines indicate 1% deviation. (b) Mean and STD of SPR of each insert calculated from the pCT and SECT approach compared with reference SPR
4 |. DISCUSSION
In this study, the IDD of a wide proton beam passing through the imaging object was modeled as a weighted sum of PDDs of several narrow beamlets. Reconstruction aiming to minimize the difference between the forward model and simulation data was established and tested on a cylindrical phantom and a realistic human phantom with irregular organ contours. This reconstruction approach enabled a proton CT equipped with an MLIC to achieve potential improvements in spatial resolution and SPR accuracy without introducing an additional collimator. Thus, issues such as extra neutron dose to the patient and energy spectrum shift imposed by the collimator can be avoided.
After the reconstruction procedure was verified with a radial symmetric cylinder phantom, it was extended to a realistic adult phantom without modification. Our technique succeeded in reconstructing SPR distribution for body region with large bony structures (head slice) and body region with a large low-density area (lung slice). Therefore, the generality of this technique was validated. Although the algorithm was developed and tested in 2-dimensional (2D) space, it can be easily extended to 3-dimensional (3D) space with larger computer power and memory. Note that, two separate scanning magnets are used in some systems. This configuration creates two separate virtual source positions in the inline and crossline directions, respectively, leading to different beam divergence in the two directions. Therefore, to reconstruct a 3D object, the source profile in the inline and crossline directions need to be accounted for independently in the forward model. Such forward model was derived in Appendix A. Since source profile sigma along both directions are predetermined parameters and will be applied to the forward model as weighting factors, modeling the source profile in an extra direction will not increase the complexity of the reconstruction. The reconstruction for a 3D object will achieve similar results as the reconstruction on a slice if optimal parameters can be determined for the 3D forward model and loss function minimization.
In the previous study, only the peak location of the IDD was used to determine the WEPL,19 while the approach developed in this study utilized the IDD values at all depths of the MLIC to determine the WEPL. In this way, the contribution of protons covering different lateral positions of the imaging object can be separated, and thus the spatial resolution was improved without confining the proton spot size. The spatial resolution can be further improved by increasing the spot density or decomposing a spot into beamlets with smaller spacing (<1 mm).The spatial resolution will eventually be limited by the effects of MCS, which is determined by the material composition of the imaging object and proton beam energy.
In the forward model of this study, we considered the effect of 0.4% energy spread when imaging with 150 MeV proton beams, which matches with the typical measurement of a proton machine. Although individual protons undergo multiple scattering, the path of a bundle of protons can be modeled as straight lines statistically with energy loss in MCS included in our forward model implicitly. The initial angular spread of the source was also ignored to simplify the reconstruction, given the negligible impact on the result with a small proton source (4 mm spot size in air at isocenter) located at 184 cm from the isocenter. The most pronounced discrepancies between reconstructed SPR through our approach and the reference SPR were observed on the interfaces between different materials. This is because the current forward model is not adequate to compensate for proton range mixing due to MCS. At the material interfaces, protons passing through higher density region undergo stronger scattering, resulting overshadowing of protons in the lower density region. Furthermore, the material composition and density changed rapidly at the interfaces, even the 1 mm wide beamlet may undergo partial volume effect, causing notable artifacts around the interfaces. Future studies of the reconstruction will include a better correction for MCS explicitly.
The effects of MCS can be included in the forward model by using depth-dependent weights for the narrow beamlets based on analytical expressions of scattering such as Molière’s theory.39 Since our pCT detector records the lateral profile of the exiting proton spot, this information would also help us define MCS within the imaging object. The inclusion of MCS in the forward model will further improve SPR accuracy and spatial resolution. Notice that protons also interact with matter through inelastic collisions with atomic nuclei, which reduces the fluence of protons, but those interactions are very rare thus can be treated as a higher level of correction than what is discussed here.
The accuracy of the reconstructed SPR was comparable to the one reconstructed with the collimator in our previous study. The maximum SPR deviation in one of the 12 inserts was 1.02% in our previous work.19 The uncertainties of SPR and WEPL determined through this approach were also on the same magnitude as those reported by the experimental studies of the proton tracking system. (Accuracy in SPR ≤ 1.6% for all inserts40; accuracy in WEPL about 3.0 mm per proton in the 260 mm range.41) Furthermore, our approach will be affected less by the noise in the detector, since the IDDs were integrated over the whole plane at each depth of the MLIC. More importantly, our goal was not to compete with the proton tracking systems in terms of SPR accuracy, but to achieve the SPR accuracy that has a clinical impact with a compact pCT system that can be easily incorporated into the clinical workflow.
Two iterations of WEPL determination were employed to achieve the best efficiency and SPR accuracy using the proposed approach. The first iteration improved spatial resolution greatly from the initial WEPL, and thus improved spatial resolution of the SPR distribution. After the smoothing step, the second iteration started at the WEPL values slightly different from the results of the first iteration to overcome local minima. Repeating the smoothing step and adding more iterations of WEPL determination beyond two iterations did not improve the spatial resolution or SPR accuracy significantly.
Since the determination of WEPL at different gantry angles is independent of each other, the computation was divided according to gantry angles. With a 64-core workstation, the whole reconstruction including two iterations of WEPL determination, and an intermediate smoothing took about 1 hour for each slice. The computation time can be further reduced by parallel computing using a more powerful cluster.
5 |. CONCLUSION
We have presented a reconstruction approach that models the IDDs of the scanning proton beams for a pCT system in an uncollimated proton beam geometry. Spatial resolution less than 2 mm and SPR accuracy less than 1% were achieved, without additional hardware to confine the beam width, but through the reconstruction algorithm that minimized the discrepancy between the forward model and measurements. Spatial resolution and SPR accuracy achieved by the reconstruction approach are comparable to those typically achievable in a collimated proton beam geometry, however, without the introduction of additional neutron dose caused by the collimator. The reconstruction approach has good flexibility to be modified for different pencil beam scanning machines and great potential to further improve SPR accuracy by incorporating the scattering information of the protons in the forward model.
ACKNOWLEDGEMENTS
This work was supported in part from grant R01 CA212638, J. O’Sullivan, Principal Investigator, awarded by the National Institutes of Health. Additional support was provided by grant T32 EB014855 (to M. J. M. M.) from the National Institutes of Health. The authors would like to acknowledge Dr.Ruirui Liu at Emory University for generously sharing ideas and comments on this study. The authors would also like to thank Winter Smith at Washington University School of Medicine for helping with aligning and scanning the CIRS electron density phantom.
Funding information
National Institutes of Health, Grant/Award Numbers: R01 CA212638, T32 EB014855
APPENDIX A: 3D FORWARD MODEL
The 3D forward model that considers different source profiles along the X and Y direction was derived in this section. Instead of dividing the beam into a set of beamlets laterally separated by 1 mm, in the 3D model, the beam was divided into a set of beamlets evenly distributed on a 2D plane, along each dimension, the beamlets were separated by 1 mm. The IDD of the transmitted proton spot was calculated as a weighted sum of the PDDs of the constituent beamlets, where the weights were derived from the 2D beam profile characterized by different beam sigma, σx and σy, for the X and Y directions, respectively. Thus, at gantry angle α, the predicted IDD gα as a function of depth in the MLIC, d, and spot position, (x0, y0), can be written as
| (A.1) |
where xi and yj denote the offset of the beamlet relative to the spot of interest (x0, y0). m and n stand for the total number of the beamlets along the X and Y directions. βα(x0, y0, d) represents the electronic noise and noise induced by large angle scattering.
Similar to the 2D model,
| (A.2) |
is the WEPL across the imaging object along a specific path determined by gantry angle α and beamlet position (x, y). ρs stands for SPR of the imaging object, which is in the coordinate of the imaging object defined by (x′, y′, z′). The modified Bortfeld function B(·) in Equation (A.1) is defined by Equations (3)–(5).
Footnotes
CONFLICT OF INTEREST
The authors have no conflict of interest to report.
DATA AVAILABILITY STATEMENT
The data that support the findings of this study are available from the corresponding author upon reasonable request.
REFERENCES
- 1.Mohan R, Grosshans D. Proton therapy – present and future. Adv Drug Deliv Rev. 2017;109:26–44. 10.1016/j.addr.2016.11.006. [DOI] [PMC free article] [PubMed] [Google Scholar]
- 2.Noel G, Gondi V. Proton therapy for tumors of the base of the skull. Chinese Clin Oncol. 2016;5(4). 10.21037/cco.2016.07.05. [DOI] [PubMed] [Google Scholar]
- 3.Yuan TZ, Zhan ZJ, Qian CN. New frontiers in proton therapy: applications in cancers. Cancer Commun. 2019;39(1). 10.1186/s40880-019-0407-3. [DOI] [PMC free article] [PubMed] [Google Scholar]
- 4.Baumann BC, Mitra N, Harton JG, et al. Comparative effectiveness of proton vs photon therapy as part of concurrent chemoradiotherapy for locally advanced cancer. JAMA Oncol. 2020;6(2):237–246. 10.1001/jamaoncol.2019.4889. [DOI] [PMC free article] [PubMed] [Google Scholar]
- 5.Schneider U, Pedroni E, Lomax A. The calibration of CT Hounsfield units for radiotherapy treatment planning. Phys Med Biol. 1996;41(1):111. [DOI] [PubMed] [Google Scholar]
- 6.Constantinou C, Harrington JC, DeWerd LA. An electron density calibration phantom for CT-based treatment planning computers. Med Phys. 1992;19(2):325–327. 10.1118/1.596862. [DOI] [PubMed] [Google Scholar]
- 7.Yang M, Zhu XR, Park PC, et al. Comprehensive analysis of proton range uncertainties related to patient stopping-power-ratio estimation using the stoichiometric calibration. Phys Med Biol. 2012;57(13):4095–4115. 10.1088/0031-9155/57/13/4095. [DOI] [PMC free article] [PubMed] [Google Scholar]
- 8.Paganetti H. Range uncertainties in proton therapy and the role of Monte Carlo simulations. Phys Med Biol. 2012;57(11):R99. http://stacks.iop.org/0031-9155/57/i=11/a=R99. [DOI] [PMC free article] [PubMed] [Google Scholar]
- 9.Poludniowski G, Allinson NM, Evans PM. Proton radiography and tomography with application to proton therapy. Br J Radiol. 2015;88(1053):20150134. 10.1259/bjr.20150134. [DOI] [PMC free article] [PubMed] [Google Scholar]
- 10.Chen X, Zhao T. Proton radiography and proton computed tomography. In: Darafsheh A, ed. Radiation Therapy Dosimetry: A Practical Handbook. CRC Press; 2021:457–464. Chapter 29. [Google Scholar]
- 11.Johnson RP, Bashkirov V & Giacometti V et al. Results from a pre-clinical head scanner for proton CT. In: 2014 IEEE Nuclear Science Symposium and Medical Imaging Conference (NSS/MIC); 2014:1–5. 10.1109/NSSMIC.2014.7430876 [DOI] [Google Scholar]
- 12.Li T, Liang Z, Singanallur JV, Satogata TJ, Williams DC, Schulte RW. Reconstruction for proton computed tomography by tracing proton trajectories: a Monte Carlo study. Med Phys. 2006;33(3):699–706. 10.1118/1.2171507. [DOI] [PMC free article] [PubMed] [Google Scholar]
- 13.Schulte RW, Penfold SN, Tafas JT, Schubert KE. A maximum likelihood proton path formalism for application in proton computed tomography. Med Phys. 2008;35(11):4849–4856. 10.1118/1.2986139. [DOI] [PubMed] [Google Scholar]
- 14.Civinini C, Bonanno D, Brianzi M, et al. Proton computed tomography: iterative image reconstruction and dose evaluation. J Instrum. 2017;12(01):C01034–C01034. 10.1088/1748-0221/12/01/C01034. [DOI] [Google Scholar]
- 15.Johnson RP. Review of medical radiography and tomography with proton beams. Rep Prog Phys. 2018;81(1):016701. 10.1088/1361-6633/aa8b1d. [DOI] [PubMed] [Google Scholar]
- 16.Poludniowski G, Allinson NM, Evans PM. Proton radiography and tomography with application to proton therapy. Br J Radiol. 2015;88(1053):20150134. 10.1259/bjr.20150134. [DOI] [PMC free article] [PubMed] [Google Scholar]
- 17.Lu H-M. A potential method for in vivo range verification in proton therapy treatment. Phys Med Biol. 2008;53(5):1413. http://stacks.iop.org/0031-9155/53/i=5/a=016. [DOI] [PubMed] [Google Scholar]
- 18.Zhang R, Jee K-W, Cascio E, Sharp GC, Flanz JB, Lu H-M. Improvement of single detector proton radiography by incorporating intensity of time-resolved dose rate functions. Phys Med Biol. 2017;63(1):015030. 10.1088/1361-6560/aa9913. [DOI] [PubMed] [Google Scholar]
- 19.Chen X, Liu R, Zhou S, et al. A novel design of proton computed tomography detected by multiple-layer ionization chamber with strip chambers: a feasibility study with Monte Carlo simulation. Med Phys. 2020;47(2):614–625. 10.1002/mp.13909. [DOI] [PMC free article] [PubMed] [Google Scholar]
- 20.Langner UW, Eley JG, Dong L, Langen K. Comparison of multi-institutional Varian ProBeam pencil beam scanning proton beam commissioning data. J Appl Clin Med Phys. 2017;18(3):96–107. 10.1002/acm2.12078. [DOI] [PMC free article] [PubMed] [Google Scholar]
- 21.Pidikiti R, Patel BC, Maynard MR, et al. Commissioning of the world’s first compact pencil-beam scanning proton therapy system. J Appl Clin Med Phys. 2018;19(1):94–105. 10.1002/acm2.12225. [DOI] [PMC free article] [PubMed] [Google Scholar]
- 22.Gillin MT, Sahoo N, Bues M, et al. Commissioning of the discrete spot scanning proton beam delivery system at the University of Texas M.D. Anderson Cancer Center, Proton Therapy Center, Houston. Med Phys. 2010;37(1):154–163. 10.1118/1.3259742. [DOI] [PMC free article] [PubMed] [Google Scholar]
- 23.Bortfeld T. An analytical approximation of the Bragg curve for therapeutic proton beams. Med Phys. 1997;24(12):2024–2033. 10.1118/1.598116. [DOI] [PubMed] [Google Scholar]
- 24.Zhang X, Liu W, Li Y, et al. Parameterization of multiple Bragg curves for scanning proton beams using simultaneous fitting of multiple curves. Phys Med Biol. 2011;56(24):7725–7735. 10.1088/0031-9155/56/24/003. [DOI] [PubMed] [Google Scholar]
- 25.Coleman TF, Li Y. An interior trust region approach for nonlinear minimization subject to bounds. SIAM J Optim. 1996;6(2):418–445. [Google Scholar]
- 26.Coleman TF, Li Y. On the convergence of interior-reflective Newton methods for nonlinear minimization subject to bounds. Math Program. 1994;67(1–3):189–224. [Google Scholar]
- 27.Andersen A. Simultaneous Algebraic Reconstruction Technique (SART): A Superior Implementation of the ART Algorithm. Elsevier. 10.1016/0161-7346(84)90008-7. [DOI] [PubMed] [Google Scholar]
- 28.Jia X, Lou Y, Lewis J, et al. GPU-based fast low-dose cone beam CT reconstruction via total variation. J Xray Sci Technol 2011;19(2):139–154. [DOI] [PubMed] [Google Scholar]
- 29.Biguri A, Dosanjh M, Hancock S, Soleimani M. TIGRE: a MATLAB-GPU toolbox for CBCT image reconstruction. Biomed Phys Eng Express. 2016;2(5):055010. 10.1088/2057-1976/2/5/055010. [DOI] [Google Scholar]
- 30.Perl J, Shin J, Schümann J, Faddegon B, Paganetti H. TOPAS: an innovative proton Monte Carlo platform for research and clinical applications. Med Phys. 2012;39(11):6818–6837. 10.1118/1.4758060. [DOI] [PMC free article] [PubMed] [Google Scholar]
- 31.Faddegon B, Ramos-Méndez J, Schuemann J, et al. The TOPAS tool for particle simulation, a Monte Carlo simulation tool for physics, biology and clinical research. Phys Med. 2020;72:114–121. [DOI] [PMC free article] [PubMed] [Google Scholar]
- 32.Agostinelli S, Allison J, Amako K, et al. GEANT4—a simulation toolkit. Nucl Instrum Methods Phys Res Sect A Accel Spectrom Detect Assoc Equip. 2003;506(3):250–303. [Google Scholar]
- 33.Allison J, Amako K, Apostolakis JEA, et al. Geant4 developments and applications. IEEE Trans Nucl Sci. 2006;53(1):270–278. [Google Scholar]
- 34.Menzel HG, Clement C, Deluca P. Realistic reference phantoms: an ICRP/ICRU joint effort. Ann ICRP. 2009;39(2):3–5. 10.1016/j.icrp.2009.09.001. [DOI] [PubMed] [Google Scholar]
- 35.Richard S, Husarik DB, Yadava G, Murphy SN, Samei E. Towards task-based assessment of CT performance: system and object MTF across different reconstruction algorithms. Med Phys. 2012;39(7Part1):4115–4122. 10.1118/1.4725171. [DOI] [PubMed] [Google Scholar]
- 36.Khellaf F, Krah N, Létang JM, Collins-Fekete CA, Rit S. A comparison of direct reconstruction algorithms in proton computed tomography. Phys Med Biol. 2020;65(10):105010. 10.1088/1361-6560/ab7d53. [DOI] [PubMed] [Google Scholar]
- 37.Schneider U, Pedroni E, Lomax A. The calibration of CT Hounsfield units for radiotherapy treatment planning. Phys Med Biol. 1996;41(1):111–124. 10.1088/0031-9155/41/1/009. [DOI] [PubMed] [Google Scholar]
- 38.Fano U. Penetration of protons, alpha particles, and mesons. Annu Rev Nucl Sci. 1963;13(1):1–66. 10.1146/ANNUREV.NS.13.120163.000245. [DOI] [Google Scholar]
- 39.Gottschalk B, Koehler AM, Schneider RJ, Sisterson JM, Wagner MS. Multiple Coulomb scattering of 160 MeV protons. Nucl Inst Methods Phys Res B. 1993;74(4):467–490. 10.1016/0168-583X(93)95944-Z. [DOI] [Google Scholar]
- 40.Esposito M, Waltham C, Taylor JT, et al. PRaVDA: the first solid-state system for proton computed tomography. Phys Med. 2018;55:149–154. 10.1016/j.ejmp.2018.10.020. [DOI] [PMC free article] [PubMed] [Google Scholar]
- 41.Bashkirov VA, Schulte RW, Hurley RF, et al. Novel scintillation detector design and performance for proton radiography and computed tomography. Med Phys. 2016;43(2):664–674. 10.1118/1.4939255. [DOI] [PMC free article] [PubMed] [Google Scholar]
Associated Data
This section collects any data citations, data availability statements, or supplementary materials included in this article.
Data Availability Statement
The data that support the findings of this study are available from the corresponding author upon reasonable request.


