

Abstract
Polypeptides encoded by long noncoding RNAs (lncRNAs) are a novel class of functional molecules. However, whether these hidden polypeptides participate in the TP53 pathway and play a significant biological role is still unclear. Here, we discover that TP53-regulated lncRNAs can encode peptides, two of which are functional in various human cell lines. Using ribosome profiling and RNA-seq approaches in HepG2 cells, we systematically identified more than 300 novel TP53-regulated lncRNAs and further confirmed that 15 of these TP53-regulated lncRNAs encode peptides. Furthermore, several peptides were validated by mass spectrometry. Ten of the novel translational lncRNAs are directly inducible by TP53 in response to DNA damage. We show that the TP53-inducible peptides TP53LC02 and TP53LC04, but not their lncRNAs, can suppress cell proliferation. TP53LC04 peptide also has a function associated with cell proliferation by regulating the cell cycle in response to DNA damage. This study shows that TP53-regulated lncRNAs can encode new functional peptides, leading to the expansion of the TP53 tumor-suppressor network and providing novel potential targets for cancer therapy.
TP53 is the most prominent tumor suppressor that is essential for cells to maintain genomic integrity (Levine et al. 1991; Vogelstein et al. 2000). In response to DNA damage, the TP53 protein is activated as a transcription factor to regulate many genes that cause cell-cycle arrest, DNA repair, and cell apoptosis (Mirza 2003; Riley et al. 2008). The modes of TP53 regulation include transcriptional activation and repression (Riley et al. 2008). The vast majority of TP53-inducible genes are transactivated by TP53 through direct binding to the consensus TP53 response elements (REs) on their promoters (Waldman et al. 1995; Rouault et al. 1996; Müller et al. 1998; Nakano and Vousden 2001; Riley et al. 2008). Earlier research on TP53-inducible genes mainly focused on the protein-coding genes, such as CDKN1A, FAS, and BTG2 (Waldman et al. 1995; Rouault et al. 1996; Müller et al. 1998), but the TP53 regulatory network has been enlarging with the involvement of noncoding RNAs in recent years (He et al. 2007; Huarte et al. 2010; Barsotti et al. 2012; Blume et al. 2015).
Long noncoding RNAs (lncRNAs) are a group of linear transcripts >200 nucleotides (nt) (Eddy 2001, 2002), which have been reported to play vital roles in various biological processes (Zhao et al. 2008; Dimitrova et al. 2014; Fatica and Bozzoni 2014). Recent studies have shown that lncRNAs represent a new layer of TP53 regulatory network (Huarte et al. 2010; Hu et al. 2018). For example, TP53COR1 (also known as lincRNA-p21) serves as a tumor repressor in TP53-dependent transcriptional responses by interacting with HNRNPK (Huarte et al. 2010). GUARDIN (also known as LNCTAM34A), a TP53-responsive lncRNA, is important for maintaining genomic integrity under steady-state conditions and after exposure to exogenous genotoxic stress (Hu et al. 2018). Despite these intriguing studies of individual lncRNAs in the TP53 regulatory network, the extent of the contributions of numerous lncRNAs to the TP53 pathway in response to DNA damage in human cells still remains largely unclear.
Although the definition of a lncRNA is an RNA transcript that does not encode a protein (Eddy 2001, 2002), recent studies have shown that a small subset of short open reading frames (sORFs) located on lncRNAs are actually activated in human cells (Slavoff et al. 2013; Ma et al. 2014). Especially, ribosome profiling, also called Ribo-seq, which is a newly developed method for genome-wide measurement of the translation of RNAs by deep sequencing of ribosome-protected RNA fragments (RPFs) (Ingolia et al. 2009; Ingolia 2014), has revealed that a significant proportion of lncRNAs are coupled with ribosomes (Ingolia et al. 2014; Ruiz-Orera et al. 2014; Ji et al. 2015). Moreover, several functional peptides encoded by annotated lncRNAs have been reported in human tissues or cells (Choi et al. 2019; Meng et al. 2020), involving in the regulation of muscle performances and regeneration (Anderson et al. 2015; Nelson et al. 2016; Matsumoto et al. 2017; Zhang et al. 2017). However, systematic identification of novel peptides involved in cell signaling pathways is still lacking. As mentioned in the above description, TP53-regulated lncRNAs have been reported to play vital roles in the TP53 signaling pathway (Huarte et al. 2010; Hu et al. 2018), but whether these known or unknown TP53-regulated lncRNAs can encode peptides or even functioning as peptides is still unclear.
In this study, we aimed to explore the possibility that lncRNA-encoded peptides might constitute part of the TP53 network. For this purpose, we combined CRISPR-Cas9 technology with the DNA-damage responsive system to investigate the expression of TP53-regulated lncRNAs, following by ribosome profiles and mass spectrometry (MS) methods to explore the translational potentials of lncRNAs in adriamycin (ADR)-treated HepG2 cells, and confirmed the function of selected lncRNA-encoded peptides in human cell lines.
Results
Genome-wide identification of TP53-regulated lncRNAs in HepG2 cells
To identify TP53-regulated lncRNAs responsive to DNA damage in human HepG2 cells, we conducted paired-end and strand-specific RNA-seq using HepG2 wild-type (WT) and TP53-deleted (HepG2TP53−/−) cells, which were devoid of the full-length TP53 protein using the CRISPR-Cas9 system (Fig. 1A; Supplemental Fig. S1), treated with or without the DNA-damaging agent ADR (Fig. 1B). The RNA-seq reads were aligned to the GENCODE v30 reference, and the mapped genes were categorized into four groups: mRNAs, lncRNAs, pseudogenes, and others. We compared the expression of the annotated genes in different samples to perform a genome-wide analysis of the TP53 regulatory network. The comparison group of WT-ADR+ versus WT-ADR− (|log2FC| ≥ 1; P < 0.05) contained 4572 (73.75%) annotated mRNAs, 1053 (16.99%) annotated lncRNAs, 422 (6.81%) annotated pseudogenes, and 152 (2.45%) other types of noncoding RNAs (Fig. 1C, top; Supplemental Table S1). The other comparison group was between WT-ADR+ and TP53−/−-ADR+ (|log2FC| ≥ 1; P < 0.05), which contained 3336 (71.47%) annotated mRNAs, 839 (17.97%) annotated lncRNAs, 330 (7.07%) annotated pseudogenes, and 163 (3.49%) other types of noncoding RNAs (Fig. 1C, bottom; Supplemental Table S1). The well-known canonical TP53 targets such as CDKN1A, BTG2, and FAS were significantly differentially expressed in both the comparison groups of WT-ADR+ versus WT-ADR− and WT-ADR+ versus TP53−/−-ADR+ (Supplemental Fig. S2A; Supplemental Table S1). The KEGG analysis also showed that the TP53 signaling pathway was well enriched in both the comparison groups, especially in the comparison group of WT-ADR+ versus TP53−/−-ADR+ (Supplemental Fig. S2B; Supplemental Table S1). We further identified 2012 candidates as TP53-regulated protein genes in response to DNA damage by overlapping the two comparison groups (Supplemental Fig. S2C; Supplemental Table S1). In addition, by performing an integrative analysis of all four RNA-seq data sets (WT-ADR+, WT-ADR−, TP53−/−-ADR+, TP53−/−-ADR−) through the modeling framework from DESeq2 suitable for two conditions, two genotypes, and an interaction term, we found 2251 TP53-regulated protein genes in response to DNA damage (Supplemental Fig. S2D; Supplemental Table S2). As expected, there is a significant coverage (∼70%, P-value < 2.2 × 10⁻¹⁶) between the above overlapped gene set and the integrative gene set (Supplemental Fig. S2E). The overlap genes contained many well-known TP53 targets, such as BTG2, GADD45A (Kastan et al. 1992), and BBC3 (also known as PUMA) (Nakano and Vousden 2001). All of these results indicate that our analysis for the RNA-seq data provides a comprehensive and bona fide TP53 regulatory network in response to DNA damage.
Figure 1.

Genome-wide analysis of the differential transcriptomes of HepG2 cells and HepG2TP53−/− cells upon DNA damage. (A) The TP53 protein level in HepG2 and HepG2TP53−/− cells untreated or treated with ADR for 24 h. GAPDH is shown as the loading control for the samples. (B) Experimental model showing the treatment to the samples for RNA-seq. (C) Biotype distribution of the differentially expressed transcripts in the RNA-seq analysis. (Top) The comparison group between HepG2 cells treated or not treated with ADR for 24 h (WT-ADR+ vs. WT-ADR−). (Bottom) The comparison group between HepG2 cells and HepG2TP53−/− cells treated with ADR for 24 h (WT-ADR+ vs. TP53−/−-ADR+). (D) Biotype distribution of the differentially expressed lncRNAs in the two comparison groups above. (E) The heatmaps of the differentially expressed lncRNAs in the two comparison groups (left, WT-ADR+ vs. WT-ADR−; right, WT-ADR+ vs. TP53−/−-ADR+) across two replicates of HepG2 cells and HepG2TP53−/− cells with or without ADR treatment. (F) The Venn diagram showing the overlap of lncRNAs between the two groups above. The overlap lncRNAs represented TP53-dependent lncRNAs in response to DNA damage.
In addition to protein-coding genes, we also identified the differentially expressed lncRNAs regulated by TP53 in response to DNA damage (Supplemental Fig. S3A). By excluding lncRNAs overlapped with protein-coding genes in the same sense strand, we obtained 876 and 649 differently expressed lncRNAs in the WT-ADR+ versus WT-ADR− and WT-ADR+ versus TP53−/−-ADR+ groups, respectively. Of note, lincRNAs and antisense lncRNAs represented the major proportion of differentially expressed lncRNAs in both groups (Fig. 1D; Supplemental Table S3). The heatmaps revealed high quality and repeatability of our data, and there were 715 lncRNAs up-regulated and 161 lncRNAs down-regulated (|log2FC| ≥ 1; P < 0.05) in the group of WT-ADR+ versus WT-ADR−. In the other group (WT-ADR+ vs. TP53−/−-ADR+), 388 lncRNAs were up-regulated and 261 lncRNAs were down-regulated (|log2FC| ≥ 1; P < 0.05) (Fig. 1E; Supplemental Table S3). By further intersecting the differentially expressed lncRNAs in two comparison groups, we identified 380 overlapping lncRNAs as TP53-regulated lncRNAs (Fig. 1F; Supplemental Table S3), which included some well-known TP53 targets, such as NEAT1 (Adriaens et al. 2016), TP53TG1 (Diaz-Lagares et al. 2016), PVT1 (Barsotti et al. 2012), GUARDIN (Hu et al. 2018), PURPL (Matsumoto et al. 2017), TRINGS (also known as AC097478.1) (Khan et al. 2017), and PINCR (Chaudhary et al. 2017), suggesting the high accuracy of our experimental and analysis methods for the identification of TP53-regulated genes. By the integrative analysis described above, we obtained 322 TP53-dependent lncRNAs in response to DNA damage (Supplemental Fig. S3B; Supplemental Table S2). Expectedly, the identified TP53-dependent lncRNAs in response to DNA damage also have a significant coverage (∼60%, P-value < 2.2 × 10⁻¹⁶) between the above overlapped gene set and the integrative gene set (Supplemental Fig. S3C). Thus, we obtained an overview of the TP53 regulatory network in response to DNA damage, and more than 300 lncRNAs have been identified as TP53-regulated lncRNAs in HepG2 cells.
Ribo-seq analysis reveals hundreds of lncRNAs with coding potential in ADR-treated HepG2 cells
To globally analyze the lncRNAs with potential coding ability upon DNA damage, we performed Ribo-seq using ADR-treated HepG2 cells. The HepG2 cells were treated with 500 ng/mL ADR for 24 h, and cycloheximide (CHX) was added to inhibit the translational elongation of ribosomes. The 26- to 30-nt RPFs were isolated to generate ribosome profiling sequencing libraries (Fig. 2A). The RiboCode (Xiao et al. 2018) analysis showed that the RPF reads with ∼29–30 nt from the ADR-treated HepG2 cells showed a strong 3-nt periodicity from their 5′end to the start and stop codons, and their P-site positions were mainly at +12 (Fig. 2B), which was consistent with the general pattern from previous research (Ingolia et al. 2009), suggesting the high quality of our Ribo-seq data.
Figure 2.

Genome-wide analysis of translated ORFs with the Ribo-seq data of ADR-treated HepG2 cells. (A) Schematic of the experimental procedures of ribosome profiling. (B) RiboCode analysis for 29-nt and 30-nt RPF reads. The P-site positions are color-coded according to the frame. (C) Biotype distribution of all of the translated ORFs identified by the RiboCode method in ADR-treated HepG2 cells (left, ORF ratio; right, ORF numbers). (D) The fraction of putative lncRNA-encoded peptides within different length ranges. (E) Density plots showing the translational efficiency (TE) of translated ORFs between two types of transcripts: the lncRNAs and the annotated protein-coding genes. (F) The conservation of the predicted coding lncRNAs and the annotated protein-coding genes. (G) Distribution of reads for two lncRNA ORFs reported to encode peptides.
We next identified the candidate ORFs according to the selected RPF reads using the RiboCode software (Xiao et al. 2018). The types of predicted ORFs (P < 0.05) were composed of seven parts: (1) 37,031 (59.89%) annotated protein-coding ORFs, (2) 1335 (2.16%) upstream ORFs (uORFs), (3) 2598 (4.2%) overlapping ORFs, (4) 3415 (5.52%) downstream ORFs (dORFs), (5) 16,739 (27.07%) novel ORFs in noncoding transcripts of protein-coding genes, (6) 556 (0.9%) novel lncRNA ORFs, and (7) 156 (0.25%) novel other ORFs (Fig. 2C; Supplemental Table S4). Among them, the 556 ORFs in lncRNAs were derived from 338 lncRNA genes. We then excluded the portion of these lncRNAs overlapping with protein-coding genes in the same sense strand and obtained 249 candidates, which were predicted to encode a total of 404 peptides. Among these lncRNA-encoded peptides, 80.44% (325 out of 404) were sORF-encoded polypeptides (SEPs, fewer than100 amino acids [aa]) (Fig. 2D; Supplemental Table S5). There were up to 79 peptides and 24 peptides longer than or equal to 100 aa and 150 aa, respectively, indicating that lncRNAs can encode not only SEPs (fewer than 100 aa) but also small proteins (100 aa or more). Furthermore, compared with the annotated protein-coding ORFs, the translatable ORFs in lncRNAs had similar ribosome relative densities but much weaker conservation (Fig. 2E,F). To assess the 3-nt periodicity distribution of the ORFs in lncRNAs, we took the ORFs of MYMX (also known as MINION) (Zhang et al. 2017) and MTLN (previously known as LINC00116) (Chugunova et al. 2019) as examples (Fig. 2G), which used to be annotated as lncRNAs but were proven to encode peptides recently. The distribution of RPFs in these ORFs showed a strong 3-nt periodicity (Supplemental Fig. S4), indicating that our Ribo-seq data were of high enough quality to identify the lncRNA-encoded peptides. Taken together, via analyzing the Ribo-seq data of ADR-treated HepG2 cells, we have identified more than 200 lncRNAs with coding potential following DNA damage.
Identification of translatable ORFs from putative TP53-regulated lncRNAs
Given the findings that numerous lncRNAs were predicted to encode peptides in ADR-treated HepG2 cells, we further systematically identified the peptides encoded by TP53-regulated lncRNAs. We obtained 58 lncRNA candidates by overlapping the genes between 380 TP53-regulated lncRNAs and 249 lncRNAs with translated ORFs (P < 0.05). Next, 18 randomly selected candidates and AC004264.1, which was a strong putative TP53 target with a translated ORF (P = 0.057) in our RNA-seq data and Ribo-seq data, were chosen for further validation (Supplemental Table S6) and named as TP53LC (TP53-regulated lncRNAs with coding potential) plus numbers (from TP53LC01 to TP53LC19) (Supplemental Fig. S5A).
To validate the RNA-seq results, we performed quantitative RT-PCR (qRT-PCR) to detect the expression of TP53LC genes in HepG2 and HepG2TP53−/− cells with or without the ADR treatment. The results showed that except for TP53LC16, the other 18 TP53LC genes were differentially expressed (17 up-regulated and one down-regulated) in both comparison groups (HepG2 ADR+ 24 h vs. HepG2 0 h and HepG2 ADR+ 24 h vs. HepG2TP53−/−ADR+ 24 h), which was consistent with the tendency from RNA-seq (Fig. 3A).
Figure 3.

Validation of translation of the overlapping lncRNA ORFs between the RNA-seq and Ribo-seq analyses. (A) The relative expression of the selected TP53LC genes and the positive control genes (TINCR and MINION) detected by qRT-PCR assays in HepG2 and HepG2TP53−/− cells with or without ADR treatment for 24 h. (B) Western blot assays for validating the coding ability of the TP53LC-3xFLAG vectors using the FLAG antibody in HepG2 and SK-HEP-1 cells. The TINCR and MINION vectors were used as positive controls. The pCFH vector was used as a negative control. (C) The protein levels of TP53LC-3xFLAG in HepG2 and SK-HEP-1 cells transfected with the TP53LC-3xFLAG and TP53LC-FS-3xFLAG vectors. (FS) Frameshift mutant. Data are represented as mean ± SEM. (*) P < 0.05, (**) P < 0.01, and (***) P < 0.001.
To confirm whether the 19 TP53LC genes encode peptides, we chose TINCR and MINION as positive controls. TINCR used to be considered as a classic lncRNA (Kretz et al. 2013) but was annotated as a protein-coding gene with a conserved ubiquitin domain containing ORF in the recent GENCODE data sets, and MINION was reported to encoded an 84-aa homologous mouse peptide required for muscle development (Zhang et al. 2017). Both TINCR and MINION were first verified to be regulated by TP53 upon DNA damage in our RNA-seq data and qRT-PCR assays (Fig. 3A). Then, we constructed 21 transient overexpression vectors by inserting the longest translated ORFs predicted by RiboCode into the universal C-terminal 3xFLAG-tagged vector, pCFH (Supplemental Fig. S5B). In addition to the positive controls (TINCR and MINION), 16 TP53LC peptides were detected by the anti-FLAG antibody. Except for the TP53LC14 and TP53LC18 peptides, which could only be detected in HepG2 cells, the other 14 TP53LC peptides were verified in both HepG2 and SK-HEP-1 cells (Fig. 3B). However, no peptides were detected when the other three TP53LC vectors (TP53LC15, TP53LC17, and TP53LC19) were overexpressed in both cells. To further validate the coding ability of the predicted ORFs, we constructed a set of frameshift (FS) mutation vectors for the 16 encoded TP53LC ORFs (Supplemental Table S11). As expected, all these 16 ORFs lost their coding ability after FS mutations, suggesting that they could actually encode peptides (Fig. 3C). We further separated the cytoplasm and nucleus of HepG2 cells to detect the subcellular localization of these peptides. As shown in Supplemental Figure S5C, the TP53LC01, TP53LC05, TP53LC06, TP53LC13, TP53LC16, and TP53LC18 peptides were detected in the cytoplasm only, whereas the TP53LC03, TP53LC07, TP53LC10, TP53LC11, and TP53LC14 peptides entirely localized in the nucleus. The TP53LC02, TP53LC04, TP53LC08, TP53LC09, TP53LC12, and TINCR peptides were detected in both the cytoplasm and nucleus, but the TP53LC04, TP53LC08, and TP53LC12 peptides mainly existed in the nucleus. Therefore, combining the above results of qRT-PCR and western blot, we have identified 15 translatable ORFs from putative TP53-regulated lncRNAs among the 19 TP53LC candidates.
Peptides encoded by putative lncRNAs are endogenously expressed in human cells
We next aimed at the direct observation of potential endogenous new microproteins encoded by these TP53-regulated lncRNAs with MS assays. In consideration of the shorter candidates compared with the known proteins, we first performed shotgun MS analysis on the low-molecular proteomics. With the classical standard of searching new proteins, we identified only one unique peptide segment from TP53LC04 out of the 15 candidates above (Fig. 4A; Supplemental Table S7). However, shotgun MS is not a targeting method aimed at identifying specific proteins but is for the whole proteome detection. For most polypeptides with low abundance, signals obtained by shotgun MS are probably not so impressive and convincing. Therefore, to improve the reliability of the MS validation, we performed the targeting parallel reaction monitoring (PRM) and multiple reaction monitoring (MRM) MS methods to present more details about the new microproteins, and referenced the HPP Guideline 3.0 criteria for database searches (Deutsch et al. 2019). Through PRM MS data analysis, we could successfully obtain two unique peptides (WPASPLGVR, GSGAGGGAGPGAAVSASPSGPR) from TP53LC02 and one unique peptide (IYRPALPTSQHPAWQR) from TP53LC04 (Fig. 4B,C; Supplemental Table S7). In MRM assays, the synthetic heavy peptides were introduced as spike-in standards for more accurate quantification of the potential peptides in HepG2-ADR+ samples. Taking the rules for designing the heavy peptides for MRM into consideration, we selected 11 TP53LCs out of the 15 candidates above for further investigation, which contained at least one unique peptide. Benefit from the one-by-one optimization on the synthetic peptide–based MRM analysis, we could further identify three different unique peptide segments from TP53LC02 (one is also identified in PRM), two from TP53LC03, and two from TP53LC04 (one is also identified in PRM) in the cell lysates, respectively (Fig. 4D–F; Supplemental Fig. S6A–C; Supplemental Table S8). Taking the results of PRM and MRM together, only TP53LC02 and TP53LC04 perfectly met the HPP Guideline 3.0 criteria, which require at least two distinct uniquely-mapping, nonnested peptide sequences of a length of nine aa or more. Although there is only one unique peptide segment longer than nine aa for TP53LC03, in consideration that the design of the synthetic signature peptides in MRM is largely limited by the length and sequence of new protein itself, we also regarded TP53LC03 as a putative endogenous microprotein confirmed by MS analysis.
Figure 4.

Identification of the natural, endogenous peptides encoded by lncRNA ORFs using mass spectrometry (MS). (A) The unique peptide of TP53LC04 was identified using shotgun MS in HepG2-ADR+ cells. (B,C) The unique peptides of TP53LC02 (B) and TP53LC04 (C) were identified using PRM MS in HepG2-ADR+ cells. (D–F) The unique peptides of TP53LC02 (D), TP53LC03 (E), and TP53LC04 (F) were identified using multiple reaction monitoring MS (MRM-MS) in HepG2-ADR+ cells. Mass chromatograms of the corresponding endogenous peptides are showed on the left, and the corresponding heavy-peptides are indicated on the right. (G) Immunoblotting validation of antibodies against TP53LC04. The indicated protein levels of cells overexpressing TP53LC04, and stable sh-TP53LC04 cells treated with ADR are shown.
To directly verify that the TP53LC peptides were endogenously produced in cells, we selected a TP53LC04 peptide identified by MS for antibody design. TP53LC04 consists of 100 aa and is encoded by a 300-nt ORF of the annotated lncRNA AC022075.1, which is currently under the accession of KLRK1-AS1 in GENCODE v39 (Supplemental Fig. S7A–C). By using two specific shRNA oligos against TP53LC04 and detecting through qRT-PCR, we successfully obtained HepG2, HCT116, and U2OS, three TP53 WT cell lines from various tumor types, with stable knockdown of TP53LC04 in response to DNA damage (Supplemental Fig. S8A). In addition, the overexpression and knock-down coupled with Western blotting assays was applied to determine the specificity of the anti-TP53LC04 antibody. As expected, the antibody could detect the endogenous TP53LC04, as well as overexpressed tagged or nontagged peptides (Fig. 4G; Supplemental Fig. S8B–D). Moreover, the TP53LC04 peptide level decreased when the TP53LC04 was stably silenced in the three cell lines treated with ADR, suggesting that the anti-TP53LC04 antibody could specifically detect the endogenously produced TP53LC04 peptide (Fig. 4G). Immunofluorescence staining with the anti-TP53LC04 antibody also showed that the subcellular location of TP53LC04 peptide is mainly localized in the nucleus of HepG2 cells (Supplemental Fig. S8E). In conclusion, these results showed that peptides encoded by putative TP53-regulated lncRNAs are endogenously expressed in human cells.
The lncRNA-encoded peptides are directly induced by TP53 upon DNA damage
Upon DNA damage, TP53 can be activated and induces a group of genes through direct and indirect ways (Riley et al. 2008). To determine if the identified peptides are directly induced by TP53, we analyzed the TP53 ChIP-seq peaks around the transcriptional start site (TSS; from 5 kb upstream to 5 kb downstream) of all annotated genes with the data downloaded from ChIPBase v2.0 (Zhou et al. 2017) and obtained a total of 9437 entries of lncRNAs with TP53-binding peaks in the lncRNA annotation set. According to our analysis, all of the 15 translated TP53LCs were included in this group of lncRNAs (Fig. 5A). The results also showed that among all the newly validated peptide genes, 10 TP53LC peptide genes were supported by at least 10 TP53 ChIP-seq samples (n ≥ 10). Thus, these peptides were considered as candidates for TP53-inducible peptides (Fig. 5B), three of which were encoded by well-known TP53-activated lncRNAs (Barsotti et al. 2012; Diaz-Lagares et al. 2016; Hu et al. 2018). Here, three representative TP53LCs—(1) one classic TP53 target lncRNA, LNCTAM34A (referring to TP53LC18), and (2) two novel TP53-regulated genes, TP53LC01 and TP53LC04—were selected to show their enrichment in TP53 ChIP-seq (Fig. 5C; Supplemental Fig. S9A), indicating that these 10 TP53LC peptide genes might all be strong candidates induced by TP53.
Figure 5.

Screening for TP53-inducible lncRNA candidates and verification of the binding of TP53 to these genes. (A) Venn plot showing the overlapping genes between lncRNAs with TP53-binding peaks from the ChIPBase v2.0 and TP53-regulated lncRNAs with translated ORFs. (B) The list of the candidates of TP53-inducible peptides. The number of supported samples for TP53 binding is shown in the list. (C) ChIP-seq tracks of normalized sequence tags show enrichment for TP53 along the TP53LC04 (also known as AC010501.1) loci in relative treatment visualized on IGV software. The box under the track represents the TP53 enrichment peak; “Dox+” represents samples treated with doxorubicin (dox), also called adriamycin (ADR); and “DDP+” represents the samples treated with cisplatin. (D) The putative TP53 binding motifs around the TSS of the candidates above. (E) ChIP-qPCR assays showing the binding of TP53 to the putative motifs above upon DNA damage. The HepG2 cells were treated with or without ADR for 24 h. BBC3 (also known as PUMA) was used as a positive control gene, and IgG was used as a negative control antibody. The values of ChIP efficiencies are given as the relative expression of TP53-IP normalized by IgG-IP. (F) Schematic diagram of the pGL4-minP vectors containing the wild-type or mutant putative TP53 binding motifs. The minimal TATA-box promoter is indicated as minP. (G) The luciferase reporter assays measuring the promoter activity of the indicated vectors in HepG2 treated or not treated with ADR for 24 h. The pGL4-minP vector was used as a negative control and a TP53 reporter vector as a positive control. (H) The indicated protein levels in HepG2 and HepG2TP53−/− cells with or without ADR treatment for 48 h. Data are represented as mean ± SEM. (*) P < 0.05, (**) P < 0.01, and (***) P < 0.001.
To confirm the binding of TP53 to the regions around the TSSs of these 10 peptide genes in HepG2 cells upon DNA damage, we first analyzed the TP53 consensus motifs RRRCWWGYYY(n)RRRCWWGYYY (Jordan et al. 2008) in these regions according to the TP53 binding peaks in ChIPBase v2.0 (Fig. 5D). We then performed ChIP-qPCR assays to validate the binding of TP53 to these predicted motifs in HepG2 cells treated with or without ADR. As expected, the results showed that by taking BBC3 (Nakano and Vousden 2001), one of the TP53 target genes, as the positive control, the binding of TP53 to the predicted motifs of all 10 peptide genes was much stronger in ADR-treated HepG2 cells compared with the binding in the normal condition (Fig. 5E). In line with ChIP-qPCR results, we found that the activity of luciferase reporters containing the consensus TP53-binding sites (TP53-BSs) from peptide genes were markedly stronger than those with TP53-BS mutants, especially under the ADR treatment (Fig. 5F,G), indicating the directly transcriptional activation by TP53 upon DNA damage. Moreover, by monitoring the peptide level with immunoblotting in various human cell lines, ADR treatment could significantly activate the expression of TP53LC04, whereas deletion or knockdown of TP53 diminished its peptide level in both the normal condition and ADR treatment (Fig. 5H; Supplemental Fig. S9B,C). Taken together, these 10 peptides were determined all to be TP53-inducible peptides, especially TP53LC04 (Supplemental Fig. S9D).
Knockdown of TP53LC04 peptide promotes cell proliferation by controlling cell cycle in response to DNA damage
To explore the function of endogenous TP53LC peptides encoded by unreported lncRNAs, TP53LC02 and TP53LC04 peptides were selected as the candidates, and TP53LC03 encoded by LINC00324 was excluded, which was reported to regulate cellular proliferation (Zou et al. 2018). To further test whether these two TP53-inducible peptides are functional, we performed CCK-8 assays and colony formation assays to investigate their effects on cell proliferation after overexpressing TP53LC02 and TP53LC04 peptides and their FS mutant vectors, or stably knocking-down TP53LC02 and TP53LC04 peptides in HepG2, HCT116, and U2OS cells. In both CCK-8 and colony formation assays, the overexpression of TP53LC02 or TP53LC04, but not its FS mutants, significantly inhibited proliferation rates (Fig. 6A–D; Supplemental Figs. S10A–E, S11A–E). In addition, we inspected the cell proliferation of ADR-treated cells with stable depletion of TP53LC02 or TP53LC04. As expected, the CCK-8 and colony formation assays showed a significant increase of the ability for cell growth and colony formation when TP53LC04 was stably depleted in the presence of ADR treatment (Fig. 6E–G; Supplemental Fig. S10F). TP53LC02 stably silenced cell lines (HepG2, HCT116 and U2OS) in response to DNA damage also showed a consistent phenotype (Supplemental Fig. S11F–I). Orthometric EdU assays further confirmed the function of TP53LC02 and TP53LC04 in regulating cell proliferation (Supplemental Figs. S10F, S11J). We next monitored the cell cycle of TP53LC04 above stably silenced cells under DNA-damage conditions and found a significant decrease in the cell proportion at G2/M phase and an increase at G0/G1 phase (Fig. 6H). Given the arrest of cells at the G2/M phase upon ADR treatment (Giono et al. 2017), the decrease of G2/M-phase cells and an increase of G0/G1-phase cells in TP53LC04-knockdown cells after ADR treatment revealed that TP53LC04 promotes cell-cycle transition. Thus, the function of TP53LC04 in regulating cell-cycle progression is consistent with the effect observed in cell proliferation.
Figure 6.

The TP53-inducible TP53LC04 peptide suppresses cell proliferation and regulates cell cycle in human cells. (A) The immunofluorescence assays showing the overexpression and subcellular location of the TP53LC04 peptide in HepG2 cells. HepG2 cells were transfected with the indicated vectors, and then the TP53LC04 peptide was immunostained using the anti-FLAG antibody. Scale bar, 10 μm. (B) CCK-8 assays showing the cell viability in HepG2, HCT116, and U2OS cells transfected with the indicated TP53LC04 vectors. (C,D) Colony formation assays showing the abilities of colony formation in HepG2, HCT116, and U2OS cells transfected with the indicated TP53LC04 vectors. The representative pictures of colonies are shown in C, and the number of colonies are counted in D. (E) CCK-8 assays showing the cell viability in HepG2, HCT116, and U2OS cells stably silenced TP53LC04 with the DNA-damage drug ADR treatment for 24 h. (F,G) Colony formation assays showing the abilities of colony formation in HepG2, HCT116, and U2OS cells stably silenced TP53LC04. The representative pictures of colonies are showed in F, and the number of colonies are counted in G. (H) The proportions of each cell-cycle phase in the indicated cells above. (I) The qPCR assays showing the expression of TP53LC04 in HepG2TP53−/− stably knocked down TP53LC04 with ADR treatment. (J) The proportions of each cell-cycle phase in sh-TP53LC04 HepG2TP53−/− recovering wild-type TP53 and sh-resistant TP53LC04. Data are represented as mean ± SEM. (*) P < 0.05, (**) P < 0.01, and (***) P < 0.001.
To further investigate whether the function of TP53LC04 peptide is interlinked to the function of TP53 in cell-cycle progression, we established TP53LC04 stably silenced in the TP53 negative cell line HepG2TP53−/− (HepG2TP53−/−-sh-TP53LC04) (Fig. 6I) and monitored the cell-cycle distribution under various conditions in response to DNA damage. By recovering WT TP53 in HepG2TP53−/−-sh-TP53LC04, the cell-cycle distribution partially restored with an increase at G2/M phase and a decrease at G0/G1 phase. Moreover, simultaneous overexpression of WT TP53 and sh-resistant TP53LC04 could further enhance the effect of restoration, indicating that the TP53LC04 peptide plays a role in the TP53 functions of cell cycle controlling in response to DNA damage (Fig. 6J; Supplemental Fig. S10G).
To illustrate the potential mechanisms for the TP53LC04, we then turned to investigate how this TP53-inducible peptide could affect the global transcriptome. As the RNA-seq analyses showed, there were 1854 differentially expressed genes comparing the sh-TP53LC04-1 samples to the control samples (sh-LacZ) in HepG2 cells under DNA-damage treatment conditions (819 up-regulated and 1035 down-regulated) (Supplemental Fig. S12A; Supplemental Table S9). To explore how many differentially expressed genes generated by knocking down TP53LC04 in response to DNA damage are also regulated by TP53, we intersected two comparison groups (sh-TP53LC04-1 vs. sh-LacZ in ADR+, WT vs. TP53−/− in ADR+) and identified three subsets of genes, including 1211 only dependent on TP53LC04 and 643 regulated by both TP53LC04 and TP53 (Supplemental Fig. S12B; Supplemental Table S9), indicating that TP53LC04 could function alone on gene expression or participate in the transcriptional regulation mediated by TP53. Next, we selected a set of genes that are associated with cell proliferation (E2F7, CCNE1, CCNE2, etc.) for further verification. In line with our RNA-seq analysis, the qRT-PCR assays showed that most of the selected genes differentially express in the sh-TP53LC04 cells treated with ADR (Supplemental Fig. S12C). Moreover, GO and KEGG analyses showed that several genes involved in G1 cell-cycle arrest and DNA-damage responses were found to be altered after knocking down TP53LC04 in the treatment of ADR (Supplemental Fig. S12D,E). Of the differentially expressed genes we detected, some may be directly regulated by TP53LC04; the others may be indirectly caused by the TP53LC04-related cell phenotype, which remains for further study. Recently, Lindsly et al. (2021) had reported 229 genes with cell-cycle-biased expression (CBE) from the cell-cycle-sorted cells for RNA-seq. By integrative analysis, we also identified five differentially expressed genes in our data that could be found in the CBE evidence at a transcriptional level. Together, all these results revealed that the TP53-inducible peptide TP53LC04, rather than its original lncRNAs, inhibited proliferation and regulated the cell cycle in human cancer cells, indicating that it might play important roles in TP53-regulated tumor suppression, especially in the DNA-damage response.
Discussion
TP53 is an important tumor suppressor and transcription factor that can be activated upon DNA damage to regulate a series of genes involved in the cell cycle, apoptosis, and DNA repair (Levine et al. 1991; Vogelstein et al. 2000; Mirza 2003). Previous research showed that the TP53 regulatory network mainly includes protein-coding and noncoding genes, such as lncRNAs and miRNAs (Riley et al. 2008; Hermeking 2012; Zhang et al. 2014). However, in our study, we first systematically identified a group of novel regulators, peptides encoded by putative TP53-regulated lncRNAs, among which the TP53-inducible peptide TP53LC04 could effectively repress cell proliferation and regulate the cell cycle in human cancer cells, suggesting that their roles were in line with that of TP53 (Fig. 7). Thus, our work added new types of lncRNA-encoded microproteins to the TP53 pathway, leading to a better understanding on the complexity of TP53 regulatory network.
Figure 7.
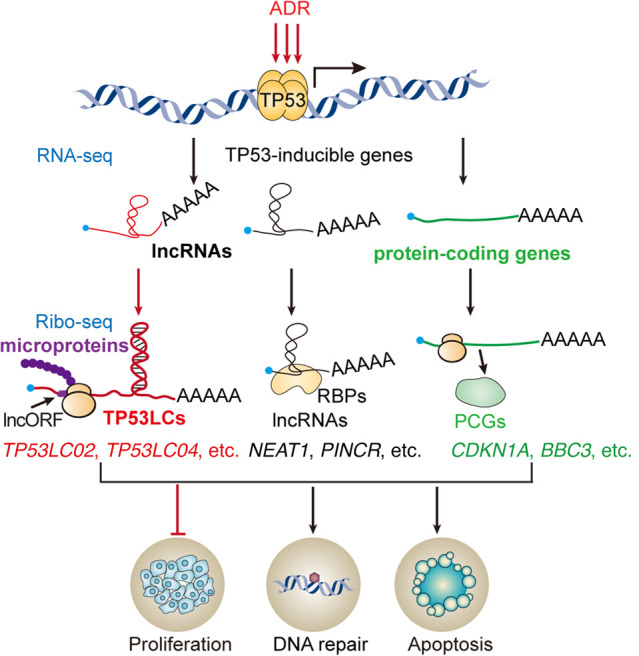
The expanded TP53 network. Network of the main TP53-inducible coding and noncoding RNAs in human cells as found in this screen. LncRNAs are marked in black; protein-coding genes (PCGs) are marked in green; and novel TP53-regulated-lncRNA-encoded peptides discovered in human cells are highlighted in bold red.
Although recent advances in bioinformatics and MS methodologies have shown that it is possible for lncRNAs to encode numerous concealed peptides, only a few have been found and validated by biochemical methods until now (Yeasmin et al. 2018; Choi et al. 2019). Here, we have identified 15 novel lncRNA-encoded peptides from 18 randomly selected TP53LC genes through combining the analysis of Ribo-seq with experimental validation in HepG2 cells. Among these newly identified peptides, nine were longer than or equal to 100 aa, which broke through the limitation of the past understanding on the lengths of these novel molecules, leading to an enlarged scope of lncRNA-encoded peptides. Furthermore, given the high verified rate of >80% in this study, we infer that approximately 40 putative TP53-regulated lncRNAs and 200 TP53-unrelated lncRNAs with translated ORFs may encode novel peptides in ADR-treated HepG2 cells. Considering that our study was only performed in HepG2 cells and that the majority of lncRNAs are tissue/cell specific, the number of lncRNA-encoded peptides may remain highly underrepresented in genome annotations, primarily owing to the difficulty of discovering short ORFs in lncRNAs. Therefore, detailed analysis of novel peptides from different cell lineages by more powerful methods such as Ribo-seq may provide the most comprehensive list of the microproteins regulated by TP53.
A batch of TP53-induced lncRNAs have been reported to play important roles in tumor suppression as RNA molecules (Grossi et al. 2016). However, our study showed that several well-known TP53-induced lncRNAs, such as PVT1 (herein referred to as TP53LC09), TP53TG1 (herein referred to as TP53LC12), and GUARDIN (herein referred to as TP53LC18), which were reported to regulate cellular proliferation (Barsotti et al. 2012; Diaz-Lagares et al. 2016; Hu et al. 2018), could encode peptides and be expressed in HepG2 cells. Hence, whether these previously identified functions are entirely dependent on the lncRNA, the lncRNA-encoded peptide, or both needs to be thoroughly investigated in the future.
Thus far, in humans and mice, the known functional peptides encoded by lncRNAs mainly participate in normal physiological processes (Anderson et al. 2015; Nelson et al. 2016; D'Lima et al. 2017; Matsumoto et al. 2017; Zhang et al. 2017; Chu et al. 2019; Chugunova et al. 2019), and only a few were functionally verified and characterized during tumorigenesis (Huang et al. 2017; Polycarpou-Schwarz et al. 2018; Deng et al. 2019). In this study, we identified and uncovered the anticancer functions of TP53-inducible peptides encoded by lncRNAs in human cancer cells for the first time. Our study highlights the functions of “hidden peptides” encoded by TP53-regulated lncRNAs in cancer cells and provides new insights for therapeutic targeting in cancer.
In summary, our study shows that TP53-regulated lncRNAs encode peptides and that these peptides can regulate cell proliferation and cell cycle in human cancer cells. Our study not only indicates that lncRNA-encoded peptides are a novel class of components of the TP53 regulatory network but also represents a new microproteome for future biological insights. Most importantly, our work explores a new research perspective for the TP53 pathway with the accession of a series of novel peptides.
Methods
Deletion of TP53
The HepG2TP53−/− cell line was generated as previously described (Deng et al. 2019). For the deletion of TP53 in HepG2 cells, two specific sgRNAs targeting exon 5 of the human TP53 gene were cloned into PX462 (Addgene 62987) to generate the PX462-KO-TP53 plasmid. The primers for detection of the TP53 gene mutation and the sgRNAs designed for the TP53 gene in this study are listed in Supplemental Table S10.
Cell culture and treatments
Human HEK293T, SK-HEP-1, HCT116, and U2OS cells were cultured in DMEM medium (Gibco C11995500BT) supplemented with 10% fetal bovine serum (Gibco 10270-106), penicillin, and streptomycin. HepG2 and HepG2TP53−/− cells were cultured in MEM medium (Gibco 41500034) supplemented with 1.5 g/L NaHCO3 (Sigma-Aldrich S5761), 110 mg/L sodium pyruvate (Sigma-Aldrich P5280), and 10% fetal bovine serum plus antibiotics. Cells were maintained in a 5% CO2 atmosphere at 37°C. Cells mentioned above were obtained from the Cell Bank, China Academy of Sciences. HepG2 and HepG2TP53−/− cells were treated with 500 ng/mL ADR (Sigma-Aldrich D1515) for 24 h for RNA-seq and Ribo-seq. The cells were transfected with plasmids using ViaFect reagent (Promega E4982) according to the manufacturer's instructions.
Construction of stable TP53, TP53LC02, and TP53LC04-silenced cell lines
For target genes knockdown, the expression of TP53 protein and TP53LC02 and TP53LC04 peptides was stably decreased by the shRNA oligos against TP53, TP53LC02, and TP53LC04, respectively. The shRNA oligos were annealed, ligated into pLKO.1-TRC vector (Addgene 10878), and then cotransfected into HEK293T cells with psPAX2 (Addgene 12260) and pMD2.G (Addgene 12259) packaging plasmids using ViaFect reagent. The supernatants were harvested and used to infect HepG2, HepG2TP53−/−, HCT116, and U2OS cells treated with 2 μg/mL polybrene (Sigma-Aldrich TR-1003), and stable clones were screened with 2 mg/mL puromycin (Sigma-Aldrich OGS269) for 2 wk. All sequences of the shRNAs are listed in Supplemental Table S10.
RNA-seq library preparation and RNA-seq analysis
For RNA-seq profiling, the total RNA was purified from HepG2 and HepG2TP53−/− cells untreated or treated with 500 ng/mL ADR for 24 h, with two independent samples, respectively. Paired-end and strand-specific RNA-seq libraries were prepared according to Illumina's instructions and sequenced on HiSeq X Ten (ANOROAD) with a sequence length of 150 bp. Raw RNA-seq data reads were aligned to the UCSC (Casper et al. 2018) hg38 reference genome using HISAT2 (version 2.0.5) (Kim et al. 2015) with default parameters. LncRNAs, protein-coding genes, and other genes annotated by GENCODE v30 were used in the present study. Furthermore, we eliminated lncRNAs overlapping with protein-coding genes in RefSeq, Ensembl, and GENCODE v30 using BEDTools (version 2.18.0) (Quinlan and Hall 2010) to obtain a more accurate lncRNA annotation set. The DESeq2 (version 1.18.1) (Love et al. 2014) package was used to detect the differentially expressed genes (P < 0.05 and |log2FC| ≥ 1). KEGG enriched items of the differentially expressed genes were analyzed by the clusterProfiler (version 3.6.0) (Yu et al. 2012) package. The heatmap of differentially expressed lncRNAs was drawn by the pheatmap (version 1.0.10) package using FPKM values, which are calculated by the DESeq2 package (Love et al. 2014).
Next, an integrative analysis of all four RNA-seq data sets (WT-ADR+, WT-ADR−, TP53−/−-ADR+, TP53−/−-ADR−) was performed using the modeling framework from DESeq2 suitable for two conditions, two genotypes, and an interaction term. Differentially expressed lncRNAs and protein genes caused by ADR-treating effect for WT genotype (|log2FC| ≥ 1, P < 0.05) were the output, as well as lncRNAs and protein genes with no significant difference on ADR-treating effect across WT and TP53−/− genotype (P ≥ 0.05). By excluding the latter gene set from the former one, the TP53-dependent lncRNAs and protein genes in response to DNA damage were obtained. In the integrative analysis, similar methods were used to eliminate lncRNAs to obtain an accurate lncRNA annotation set.
Ribosome profiling library preparation and Ribo-seq analysis
HepG2 cells were treated with 500 ng/mL ADR for 24 h. Then, to prepare cell lysis, the cell medium was discarded, and the cells were washed with ice-cold PBS containing 100 µg/mL CHX (MP Biomedicals 0219452701). The ribosome profiling assay was performed as previously described (Calviello et al. 2016). For the analysis of Ribo-seq data, sequenced reads trimmed for the adaptor sequence were aligned to the UCSC hg38 reference genome by STAR (version 2.4.2a) (Dobin et al. 2013) with parameters provided by the RiboCode (version 1.2.10) manual (Xiao et al. 2018). RNA-seq reads also used the same parameters to align to the genome by STAR. Conservative analysis of the peptides was calculated by the phyloP (Siepel et al. 2006) score downloaded from the UCSC Genome Browser. The translation efficiency (Ingolia et al. 2009) was calculated as the ratio of FPKM values of an ORF in Ribo-seq data to the FPKM values of this ORF in RNA-seq data.
In-gel digestion of low-molecular-weight proteins for shotgun MS analysis
HepG2 cells (1 × 10⁷) were treated with 500 ng/mL ADR for 24 h. Then, the cells were extracted by RIPA buffer supplemented with protease inhibitor cocktail, and the lysates were separated in Novex 10%–20% tricine gels (Thermo Fisher Scientific EC6625BOX). By silver staining, 5- to 25-kDa bands were excised from the gel and subjected to in-gel trypsin digestion as previously described (Wang et al. 2013; Lu et al. 2019). Peptide samples were reconstituted in solvent A (0.1% formic acid and 2% ACN) and further analyzed in an Orbitrap Fusion Lumos mass spectrometer (Thermo Fisher Scientific).
PRM MS analysis
PRM was performed to validate the presence of candidate peptides in HepG2-ADR+ samples as previously described (Lu et al. 2019). Briefly, the cell lysates were digested with trypsin, and then the peptides were separated with a C18 reverse-phase column (150-μM diameter, 20-cm length, 1.9-μM particle size), followed by injection into the Orbitrap Fusion Lumos mass spectrometer. The peptide precursors were isolated via a quadrupole at the window of 1.2 Th. Fragment ions were generated in the HCD mode and detected at a resolution of 15 K.
Heavy-isotope-labeled peptide-referenced MRM
Heavy-labeled targeted peptides (heavy-peptides) were synthesized from GuoPing Pharmaceutical (Anhui). Technical requirements follow the standard procedures as previously described (Lu et al. 2019). The synthesized heavy-peptides were first mixed and subjected to the data-dependent acquisition (DDA) MS analysis with an Orbitrap Fusion Lumos mass spectrometer. Each target heavy-peptide was imported into the Skyline software to generate the transition list for 2+ and 3+ precursors, considering both the b-ions and y-ions. Then 400 fmol diluted heavy-peptides were reconstituted with 0.1% FA, mixed with unlabeled peptides, and sequentially loaded into the trap column (150 μM × 2 cm, C18, 1.9 μM) and the nano column (150 μM × 20 cm, C18, 1.9 μM) with an UltiMate 3000 RSLCnano HPLC System (Thermo Fisher Scientific). Next, the peptides were eluted with the gradient buffer (80% ACN, 0.1% FA) for 60 min at a flow rate of 600 nL/min. The TSQ Quantiva system (Thermo Fisher Scientific) was used for the collection, and Nanospray NG ion source was used in the positive ion mode. MS conditions were set as follows: ion spray voltage, 2300 V; ion transfer tube temperature, 320°C; CID gas, 1.5 m Torr; and cycle time, 3 sec.
MS analysis
Deep proteome data of HepG2 cells treated with ADR were obtained by MS sequences. The shotgun and PRM raw MS files were analyzed by the Thermo Scientific Proteome Discoverer software package (version 2.4.1.15). As previously described (Lu et al. 2019), database searches were performed using the protein products from all translating genes in the human UniProt database and predicted ORFs from the translating lncRNAs. We adopted the criteria for confident identification with false-discovery rate (FDR) < 0.01 at protein level for Proteome Discoverer searches (Colaert et al. 2011; Al Shweiki et al. 2017). Other parameters were left default. The MRM raw data were analyzed using Skyline software, and endogenous peptides were considered to be validated when the following criteria were met: (1) the synthesized standard (heavy) peptide and transition generated from endogenous peptide (light) shared the same elution profile on the liquid chromatograph; (2) at least three transitions from the same precursor were detected with S/N > 3; and (3) the calculated bias of light/heavy peptides from each transition of the same precursors was <20%. The three to six most intense transitions of each target heavy-peptide and its relevant three to six transitions of light peptide were output as a single transition list, using the CE value that supported the highest intensity and the retention time.
RNA extraction and qRT-PCR
The total RNA was isolated from cells using the RNA isolation reagent TRIzol (Thermo Fisher Scientific 15596018). cDNA was synthesized using a PrimeScript RT reagent kit with a gDNA eraser kit (TaKaRa RR047A) according to the manufacturer's protocol. qPCR assays were performed in triplicate with the SYBR Premix Ex Taq II (TaKaRa RR820A). Normalization was performed to GAPDH. The ΔΔCt method for the relative quantitation (RQ) of gene expression was used to determine the expression of genes. The corresponding primers used in this study according to the RiboCode analysis of transcripts with potential coding capability are provided in Supplemental Table S10.
Plasmid construction
To generate FLAG fusion peptide constructs with ORFs of the candidate TP53LC genes (ORF-FLAG), the corresponding ORF sequences were amplified with and without the endogenous 10-bp Kozak or 5′ UTR region by PCR from HepG2 or HepG2-ADR+ cells cDNA and cloned into the pCFH vector (built by our laboratory, with the C-terminal 3xFLAG epitope tag into the pCH vector) (Xu et al. 2020). A FS mutation construct (5′UTR-ORF-FS-FLAG), in which the ORF start codon was FS-mutated to ATTG, was generated using a homologous reorganization kit (Vazyme C112-01). When FLAG could still be expressed after the FS mutation of the start codon ATG, two or three mutations would be undertaken until the FLAG was no longer expressed at the protein level. An identical TP53LC04 construct without a FLAG tag and two more alternative vectors by mutating or deleting the start codon of inserted TP53LC04 ORF were generated in a same way. WT TP53 and sh-resistant TP53LC04 vectors were constructed using the pcDNA3.0 vector backbone (Invitrogen). For construction of TP53 promoter–reporter vectors, the promoters of TP53LCs predicted to contain consensus TP53-BSs were designed as oligos, annealed, and ligated into the pGL4-minP vector modified using the pGL4.11[luc2P] vector backbone (Promega E6661) to generate the pGL4-wt-promoter vectors, as previously described (Sotelo et al. 2010). Similarly, the pGL4-mt-promoter vectors were obtained by inserting a nonsynonymous mutation into the TP53-BS sequences of TP53LCs and using the pGL4.38 [luc2P/TP53 RE/Hygro] vector (Promega E365A) as the positive control vector. The corresponding mutation sequences are shown in Supplemental Table S11, and the primers and oligos used in this study are listed in Supplemental Table S10.
Immunofluorescence staining
HepG2 cells (4 × 10⁵) were plated on glass coverslips and transfected with the indicated plasmids for 48 h. Then, the cells were fixed with 4% paraformaldehyde for 30 min at room temperature. Cells were subsequently permeabilized with 0.5% Triton X-100 in PBS and then blocked with PBS-T containing 5% BSA for 1 h. Blocked cells were incubated with anti-FLAG antibody (Sigma-Aldrich F1804) overnight at 4°C and subsequently incubated with the corresponding Alexa Fluor 594 antibody (Thermo Fisher Scientific A21207). Cellular nuclei were stained with Hoechst (Sigma-Aldrich 94403). Imaging was conducted using a Zeiss 63 × plan apochromat oil immersion lens on the LSM880.
Anti-TP53LC04 antibody production
The polyclonal antibody against the TP53LC04 peptide was customized from GL Biochem (Shanghai). Briefly, rabbits were immunized with a synthetic peptide containing the sequence of the KLH-coupled peptide ILGPRGQERPGI-Cys. The antibodies were collected from the serum and then purified using affinity chromatography with columns containing the corresponding peptides.
Western blotting
Cells were harvested and suspended in strong RIPA lysis buffer (50 mM Tris-HCl at pH 7.4, 150 mM NaCl, 0.1% SDS, 2 mM EDTA, 1% Triton X-100, 1% sodium deoxycholate, 1 mM PMSF, and protease inhibitor cocktail) for 30 min on ice and then denatured for 10 min at 99°C supplemented with 5 × SDS loading buffer and β-mercaptoethanol. For the detection of the TP53LC or TP53LC-3xFLAG peptides, whole-cell lysates were separated on 12% tricine-SDS-polyacrylamide gel electrophoresis (SDS-PAGE) and then electroblotted onto a 0.2-μM nitrocellulose (NC) membrane (Millipore). Western blotting was performed using anti-FLAG (1:5000), anti-TP53LC04 (1:200; GL Biochem N/A), anti-TP53 (1:2000; Santa Cruz Biotechnology sc-126), anti-LaminB1 (1:5000; Proteintech 12987-1-AP), and anti-GAPDH (1:10000; Proteintech 60004-1-Ig) antibodies.
Cell proliferation assays
For the cell proliferation assays, HepG2, HCT116, and U2OS cells were seeded onto 96-well culture plates at 3 × 10³, 1 × 10³, and 2 × 10³ per well, respectively, after transfection with the indicated plasmids for 24 h; 7.5 × 10³ per well of TP53LC02 or TP53LC04 stably silenced cells were seeded onto 96-well plates after treating with 500 ng/mL ADR for 24 h. Cell viability was counted at 0, 24, 48, 72, and 96 h using the CCK-8 kit (DOJinDO CK04) according to the manufacturer's instructions.
Colony formation assays
For colony formation assays, 5 × 10³ per dish of HepG2, HCT116, and U2OS cells were seeded onto 60-mm dishes after transfection with the indicated plasmids for 24 h, and 7.5 × 10⁴ per dish of TP53LC02 or TP53LC04 stably silenced cells were seeded onto 60-mm dishes after treatment with 500 ng/mL ADR for 24 h. After being cultured for 14 d, the cells were fixed with 4% paraformaldehyde for 30 min and stained with 0.1% crystal violet solution for 20 min. The number or relative area of cell colonies was counted using the ImageJ software.
Cell cycle analysis
For cell-cycle analysis, 2.5 × 10⁵ of the indicated stably silenced cells per well were seeded onto 12-well plates. After 24 h, the sh-TP53LC04-TP53-positive cell medium was replaced with serum-free culture condition for 24 h, and the sh-TP53LC04-TP53-negative cells were transfected with the indicated plasmids. Then the cells above were treated with 500 ng/mL ADR for another 24 h. These cells were labelled with propidium iodide (PI) according to the cell cycle staining kit (MultiSciences CCS012) and measured in the FACS Calibur flow cytometer (BD Biosciences). The data were analyzed by FlowJo software.
EdU assays
For EdU assays, the indicated stably silenced cells were seeded onto 24-well plates that enveloped glass coverslips with PLL at 5 × 10⁴ cells per well. After treated with 500 ng/mL ADR for 24 h, the cells were cultured with fresh medium containing EdU in a final concentration of 10 μM for 2 h. Cell viability was then counted using an EdU kit (BeyoClick EdU-488, C0071S) according to the manufacturer's instructions.
Subcellular fractionation
The subcellular fractionation method was modified based on the method published in Nature Protocol (Gagnon et al. 2014). After being transfected with the indicated plasmids for 48 h, the HepG2 cells were trypsinized, washed once with cold PBS, and then collected by centrifugation at 500g for 5 min at 4°C. The pellets were resuspended in 200 μL of HLB lysis buffer (10 mM Tris-HCl at pH 7.5, 3 mM MgCl2, 10 mM NaCl, 0.3% NP-40, 10% glycerol) supplemented with protease inhibitor cocktail (Roche 4693132001), incubated for 10 min on ice, and then collected by centrifugation at 10,000g for 3 min at 4°C. Approximately 120 μL of supernatant (cytoplasmic fraction) was collected, and the rest was discarded, leaving the pellet (nuclear fraction). The total nuclear fraction was resuspended in 1 mL of HLB without the protease inhibitor cocktail and collected by centrifugation at 200g for 2 min at 4°C. Then, the supernatant was discarded, and the pellet was washed for two more times with the HLB buffer. The nuclear fraction was resuspended in 120 μL of RIPA with the protease inhibitor cocktail and incubated for 30 min on ice. Finally, 30 μL of 5 × SDS loading buffer with β-mercaptoethanol was added to all of the tubes for subsequent protein denaturation for 10 min at 99°C. The cytoplasmic fraction and nuclear fraction samples were analyzed by western blotting.
ChIP-seq data analysis
For the TP53 ChIP-seq analysis, we manually collected high-throughput data sets under accession numbers GSM1366697, GSM1366696, GSM1366691, GSM1142696, and GSM1133486 from the Gene Expression Omnibus (GEO; https://www.ncbi.nlm.nih.gov/geo/) database (Barrett et al. 2013). HISAT2 and MACS2 (Zhang et al. 2008) were used for the mapping and peak calling of the ChIP-seq data respectively. Subsequently, bigWig files were generated by BEDTools (v 2.27.1) (Quinlan and Hall 2010), and the reads coverage and peaks distribution were visualized with the Integrative Genomics Viewer (IGV) (v 2.8.12) (Robinson et al. 2011).
ChIP assays
A total of 1 × 10⁷ HepG2 cells untreated or treated with 500 ng/mL ADR for 24 h were cross-linked with 1% formaldehyde for 10 min at room temperature. Glycine was gently added for 5 min at 25°C to a final concentration of 0.125 M, and then the cells were collected with a cell scraper. The cell pellet was resuspended in cell lysis buffer, and the nuclear pellet was recovered by centrifugation and resuspended in nuclear lysis buffer. Nuclear extracts were sonicated using a Bioruptor U-200 and collected by centrifugation at 12,000g for 10 min at 4°C. The chromatin supernatant was precleared by adding 20 μL of Dynabeads Protein G (Thermo Fisher Scientific 10007D) for 1 h at 4°C and then incubated overnight with 2 μg of TP53 (1C12) mouse mAb antibody (CST 2524S). After immunoprecipitation, 50 μL of Protein G magnetic beads was added and incubated for another 2 h at 4°C. Then, the precipitates were washed one time with low-salt wash buffer, one time with high-salt wash buffer, one time with LiCl wash buffer, and two times with 1 × TE, each for 5 min. The chromatin DNA was eluted in elution buffer and supplemented with RNase A (Thermo Fisher Scientific MAN0012003) for 30 min at 37°C. Then, the Proteinase K (Thermo Fisher Scientific EO0492) was added and incubated for 2 h at 62°C. Finally, the eluted chromatin DNA complex DNA was purified using a QIAquick PCR purification kit (Qiagen 28104) for real-time PCR. The primers for ChIP-qPCR used in this study are listed in Supplemental Table S10.
Luciferase assays
For promoter luciferase assays, 1.5 × 10⁴ HepG2 cells was seeded onto 96-well plates. After culture for 24 h, the above pGL4-minP, pGL4-wt-promoter, and pGL4-mt-promoter vectors were transfected into the indicated cells for luciferase activity. After 24 h of incubation, the above cells were treated with 500 ng/mL ADR for another 24 h. Cells were lysed using the passive lysis buffer, and the luciferase activity was detected using the dual-luciferase assay system (Promega).
Poly(A)-RNA-seq analysis
For gene differentially expression profiling after knockdown of TP53LC04 peptide, the RNA-seq libraries were prepared from purified poly(A) RNA from ADR-treated HepG2 with stably silenced TP53LC04 cells and the relative control cells (sh-LacZ) for 24 h, including three independent samples, respectively. High-throughput sequences were aligned to hg38 genome with HISAT2 (with parameters “‐‐no-softclip ‐‐no-unal”) (Kim et al. 2015), and SAM files were converted to BAM format with SAMtools (v 1.10) (Li et al. 2009). In the search for differentially expressed genes, we used featureCounts (v 1.6.0) (Liao et al. 2014) to count each gene expressed in the knockdown and control samples (with parameters “-g gene_id -p”) and further applied edgeR (Robinson et al. 2010) for the retrieval of the dysregulated genes of sh-TP53LC04-1 (each group contains three replicates). We considered that these genes are up-regulated with “FC ≥ 1 and P-value < 0.05” and down-regulated with “FC ≤ 1/2 and P-value < 0.05.” Then these dysregulated genes in the sh-TP53LC04-1 samples were used for downstream analysis. Finally, Metascape (Zhou et al. 2019) was applied for GO and KEGG analysis.
Statistics and reproducibility
The results were expressed as the mean ± SEM unless otherwise noted. We used the paired Student t-test for comparisons between the two experimental groups. All statistics were performed using GraphPad Prism 8, and the significance P-values here are denoted by asterisks as follows: (*) P < 0.05, (**) P < 0.01, and (***) P < 0.001.
Data access
All sequencing data generated in this study have been submitted to the NCBI Gene Expression Omnibus (GEO; https://www.ncbi.nlm.nih.gov/geo/) under accession numbers GSE125756 (RNA–seq) and GSE125757 (Ribo-seq).
Supplementary Material
Acknowledgments
This work was supported in part by the National Key R&D Program of China (2019YFA0802202, 2017YFA0504400), the National Natural Science Foundation of China (91940304, 31971228, 31370791, 31471223, 91440110, 31770879, 31900903, 32000892, and 81702945), funds from Guangdong Province (2017A030313106 and 2017A030313483), Youth Science and Technology Innovation Talent of Guangdong TeZhi Plan (2019TQ05Y181), and China Postdoctoral Science Foundation (232600). This research was supported in part by the Guangdong Province Key Laboratory of Computational Science (13lgjc05), Guangdong Basic and Applied Basic Research Foundation (2019A1515110166), and the Guangdong Province Computational Science Innovative Research Team (14lgjc18).
Author contributions: J.H.Y., L.H.Q., W.L.X., C.L., and B.D. conceived and designed the entire project. J.H.Y. and L.H.Q. designed and supervised the research. W.L.X., C.L., B.D., P.H.L., Z.H.S., A.R.L., J.J.X., Y.Y.L., K.R.Z., X.Q.Z., Q.J.H., H.Z., Q.Y.H., B.L., L.H.Q., and J.H.Y. performed the experiments and/or data analyses. W.L.X., C.L., B.D., P.H.L., and J.H.Y. performed the genome-wide or transcriptome-wide data analyses. B.L., Q.Y.H., L.H.Q., and J.H.Y. contributed reagents/analytic tools and/or grant support. W.L.X., C.L., B.D., P.H.L., Z.H.S., A.R.L., J.J.X., Y.Y.L., K.R.Z., X.Q.Z., Q.J.H., H.Z., Q.Y.H., B.L., L.H.Q., and J.H.Y. wrote and revised the paper. All authors discussed the results and commented on the manuscript.
Footnotes
[Supplemental material is available for this article.]
Article published online before print. Article, supplemental material, and publication date are at https://www.genome.org/cgi/doi/10.1101/gr.275831.121.
Competing interest statement
The authors declare no competing interests.
References
- Adriaens C, Standaert L, Barra J, Latil M, Verfaillie A, Kalev P, Boeckx B, Wijnhoven PW, Radaelli E, Vermi W, et al. 2016. p53 induces formation of NEAT1 lncRNA-containing paraspeckles that modulate replication stress response and chemosensitivity. Nat Med 22: 861–868. 10.1038/nm.4135 [DOI] [PubMed] [Google Scholar]
- Al Shweiki MR, Mönchgesang S, Majovsky P, Thieme D, Trutschel D, Hoehenwarter W. 2017. Assessment of label-free quantification in discovery proteomics and impact of technological factors and natural variability of protein abundance. J Proteome Res 16: 1410–1424. 10.1021/acs.jproteome.6b00645 [DOI] [PubMed] [Google Scholar]
- Anderson DM, Anderson KM, Chang CL, Makarewich CA, Nelson BR, McAnally JR, Kasaragod P, Shelton JM, Liou J, Bassel-Duby R, et al. 2015. A micropeptide encoded by a putative long noncoding RNA regulates muscle performance. Cell 160: 595–606. 10.1016/j.cell.2015.01.009 [DOI] [PMC free article] [PubMed] [Google Scholar]
- Barrett T, Wilhite SE, Ledoux P, Evangelista C, Kim IF, Tomashevsky M, Marshall KA, Phillippy KH, Sherman PM, Holko M, et al. 2013. NCBI GEO: archive for functional genomics data sets: update. Nucleic Acids Res 41: D991–D995. 10.1093/nar/gks1193 [DOI] [PMC free article] [PubMed] [Google Scholar]
- Barsotti AM, Beckerman R, Laptenko O, Huppi K, Caplen NJ, Prives C. 2012. p53-Dependent induction of PVT1 and miR-1204. J Biol Chem 287: 2509–2519. 10.1074/jbc.M111.322875 [DOI] [PMC free article] [PubMed] [Google Scholar]
- Blume CJ, Hotz-Wagenblatt A, Hüullein J, Sellner L, Jethwa A, Stolz T, Slabicki M, Lee K, Sharathchandra A, Benner A, et al. 2015. p53-Dependent non-coding RNA networks in chronic lymphocytic leukemia. Leukemia 29: 2015–2023. 10.1038/leu.2015.119 [DOI] [PubMed] [Google Scholar]
- Calviello L, Mukherjee N, Wyler E, Zauber H, Hirsekorn A, Selbach M, Landthaler M, Obermayer B, Ohler U. 2016. Detecting actively translated open reading frames in ribosome profiling data. Nat Methods 13: 165–170. 10.1038/nmeth.3688 [DOI] [PubMed] [Google Scholar]
- Casper J, Zweig AS, Villarreal C, Tyner C, Speir ML, Rosenbloom KR, Raney BJ, Lee CM, Lee BT, Karolchik D, et al. 2018. The UCSC Genome Browser database: 2018 update. Nucleic Acids Res 46: D762–D769. 10.1093/nar/gkx1020 [DOI] [PMC free article] [PubMed] [Google Scholar]
- Chaudhary R, Gryder B, Woods WS, Subramanian M, Jones MF, Li XL, Jenkins LM, Shabalina SA, Mo M, Dasso M, et al. 2017. Prosurvival long noncoding RNA PINCR regulates a subset of p53 targets in human colorectal cancer cells by binding to Matrin 3. eLife 6: e23244. 10.7554/eLife.23244 [DOI] [PMC free article] [PubMed] [Google Scholar]
- Choi SW, Kim HW, Nam JW. 2019. The small peptide world in long noncoding RNAs. Brief Bioinform 20: 1853–1864. 10.1093/bib/bby055 [DOI] [PMC free article] [PubMed] [Google Scholar]
- Chu Q, Martinez TF, Novak SW, Donaldson CJ, Tan D, Vaughan JM, Chang T, Diedrich JK, Andrade L, Kim A, et al. 2019. Regulation of the ER stress response by a mitochondrial microprotein. Nat Commun 10: 4883. 10.1038/s41467-019-12816-z [DOI] [PMC free article] [PubMed] [Google Scholar]
- Chugunova A, Loseva E, Mazin P, Mitina A, Navalayeu T, Bilan D, Vishnyakova P, Marey M, Golovina A, Serebryakova M, et al. 2019. LINC00116 codes for a mitochondrial peptide linking respiration and lipid metabolism. Proc Natl Acad Sci 116: 4940–4945. 10.1073/pnas.1809105116 [DOI] [PMC free article] [PubMed] [Google Scholar]
- Colaert N, Barsnes H, Vaudel M, Helsens K, Timmerman E, Sickmann A, Gevaert K, Martens L. 2011. thermo-msf-parser: an open source Java library to parse and visualize Thermo Proteome Discoverer msf files. J Proteome Res 10: 3840–3843. 10.1021/pr2005154 [DOI] [PubMed] [Google Scholar]
- Deng B, Xu W, Wang Z, Liu C, Lin P, Li B, Huang Q, Yang J, Zhou H, Qu L. 2019. An LTR retrotransposon-derived lncRNA interacts with RNF169 to promote homologous recombination. EMBO Rep 20: e47650. 10.15252/embr.201847650 [DOI] [PMC free article] [PubMed] [Google Scholar]
- Deutsch EW, Lane L, Overall CM, Bandeira N, Baker MS, Pineau C, Moritz RL, Corrales F, Orchard S, Van Eyk JE, et al. 2019. Human proteome project mass spectrometry data interpretation guidelines 3.0. J Proteome Res 18: 4108–4116. 10.1021/acs.jproteome.9b00542 [DOI] [PMC free article] [PubMed] [Google Scholar]
- Diaz-Lagares A, Crujeiras AB, Lopez-Serra P, Soler M, Setien F, Goyal A, Sandoval J, Hashimoto Y, Martinez-Cardúus A, Gomez A, et al. 2016. Epigenetic inactivation of the p53-induced long noncoding RNA TP53 target 1 in human cancer. Proc Natl Acad Sci 113: E7535–E7544. 10.1073/pnas.1608585113 [DOI] [PMC free article] [PubMed] [Google Scholar]
- Dimitrova N, Zamudio JR, Jong RM, Soukup D, Resnick R, Sarma K, Ward AJ, Raj A, Lee JT, Sharp PA, et al. 2014. LincRNA-p21 activates p21 in cis to promote Polycomb target gene expression and to enforce the G1/S checkpoint. Mol Cell 54: 777–790. 10.1016/j.molcel.2014.04.025 [DOI] [PMC free article] [PubMed] [Google Scholar]
- D'Lima NG, Ma J, Winkler L, Chu Q, Loh KH, Corpuz EO, Budnik BA, Lykke-Andersen J, Saghatelian A, Slavoff SA. 2017. A human microprotein that interacts with the mRNA decapping complex. Nat Chem Biol 13: 174–180. 10.1038/nchembio.2249 [DOI] [PMC free article] [PubMed] [Google Scholar]
- Dobin A, Davis CA, Schlesinger F, Drenkow J, Zaleski C, Jha S, Batut P, Chaisson M, Gingeras TR. 2013. STAR: ultrafast universal RNA-seq aligner. Bioinformatics 29: 15–21. 10.1093/bioinformatics/bts635 [DOI] [PMC free article] [PubMed] [Google Scholar]
- Eddy SR. 2001. Non-coding RNA genes and the modern RNA world. Nat Rev Genet 2: 919–929. 10.1038/35103511 [DOI] [PubMed] [Google Scholar]
- Eddy SR. 2002. Computational genomics of noncoding RNA genes. Cell 109: 137–140. 10.1016/S0092-8674(02)00727-4 [DOI] [PubMed] [Google Scholar]
- Fatica A, Bozzoni I. 2014. Long non-coding RNAs: new players in cell differentiation and development. Nat Rev Genet 15: 7–21. 10.1038/nrg3606 [DOI] [PubMed] [Google Scholar]
- Gagnon KT, Li LD, Janowski BA, Corey DR. 2014. Analysis of nuclear RNA interference in human cells by subcellular fractionation and Argonaute loading. Nat Protoc 9: 2045–2060. 10.1038/nprot.2014.135 [DOI] [PMC free article] [PubMed] [Google Scholar]
- Giono LE, Resnick-Silverman L, Carvajal LA, St Clair S, Manfredi JJ. 2017. Mdm2 promotes Cdc25C protein degradation and delays cell cycle progression through the G2/M phase. Oncogene 36: 6762–6773. 10.1038/onc.2017.254 [DOI] [PMC free article] [PubMed] [Google Scholar]
- Grossi E, Sánchez Y, Huarte M. 2016. Expanding the p53 regulatory network: LncRNAs take up the challenge. Biochim Biophys Acta 1859: 200–208. 10.1016/j.bbagrm.2015.07.011 [DOI] [PubMed] [Google Scholar]
- He L, He X, Lim LP, de Stanchina E, Xuan Z, Liang Y, Xue W, Zender L, Magnus J, Ridzon D, et al. 2007. A microRNA component of the p53 tumour suppressor network. Nature 447: 1130–1134. 10.1038/nature05939 [DOI] [PMC free article] [PubMed] [Google Scholar]
- Hermeking H. 2012. MicroRNAs in the p53 network: micromanagement of tumour suppression. Nat Rev Cancer 12: 613–626. 10.1038/nrc3318 [DOI] [PubMed] [Google Scholar]
- Hu WL, Jin L, Xu A, Wang YF, Thorne RF, Zhang XD, Wu M. 2018. GUARDIN is a p53-responsive long non-coding RNA that is essential for genomic stability. Nat Cell Biol 20: 492–502. 10.1038/s41556-018-0066-7 [DOI] [PubMed] [Google Scholar]
- Huang JZ, Chen M, Chen DE, Gao XC, Zhu S, Huang H, Hu M, Zhu H, Yan GR. 2017. A peptide encoded by a putative lncRNA HOXB-AS3 suppresses colon cancer growth. Mol Cell 68: 171–184.e6. 10.1016/j.molcel.2017.09.015 [DOI] [PubMed] [Google Scholar]
- Huarte M, Guttman M, Feldser D, Garber M, Koziol MJ, Kenzelmann-Broz D, Khalil AM, Zuk O, Amit I, Rabani M, et al. 2010. A large intergenic noncoding RNA induced by p53 mediates global gene repression in the p53 response. Cell 142: 409–419. 10.1016/j.cell.2010.06.040 [DOI] [PMC free article] [PubMed] [Google Scholar]
- Ingolia NT. 2014. Ribosome profiling: new views of translation, from single codons to genome scale. Nat Rev Genet 15: 205–213. 10.1038/nrg3645 [DOI] [PubMed] [Google Scholar]
- Ingolia NT, Ghaemmaghami S, Newman JRS, Weissman JS. 2009. Genome-wide analysis in vivo of translation with nucleotide resolution using ribosome profiling. Science 324: 218–223. 10.1126/science.1168978 [DOI] [PMC free article] [PubMed] [Google Scholar]
- Ingolia NT, Brar GA, Stern-Ginossar N, Harris MS, Talhouarne GJS, Jackson SE, Wills MR, Weissman JS. 2014. Ribosome profiling reveals pervasive translation outside of annotated protein-coding genes. Cell Rep 8: 1365–1379. 10.1016/j.celrep.2014.07.045 [DOI] [PMC free article] [PubMed] [Google Scholar]
- Ji Z, Song RS, Regev A, Struhl K. 2015. Many lncRNAs, 5′ UTRs, and pseudogenes are translated and some are likely to express functional proteins. eLife 4: e08890. 10.7554/eLife.08890 [DOI] [PMC free article] [PubMed] [Google Scholar]
- Jordan JJ, Menendez D, Inga A, Noureddine M, Bell DA, Resnick MA. 2008. Noncanonical DNA motifs as transactivation targets by wild type and mutant p53. PLoS Genet 4: e1000104. 10.1371/journal.pgen.1000104 [DOI] [PMC free article] [PubMed] [Google Scholar]
- Kastan MB, Zhan Q, el-Deiry WS, Carrier F, Jacks T, Walsh WV, Plunkett BS, Vogelstein B, Fornace AJ Jr. 1992. A mammalian cell cycle checkpoint pathway utilizing p53 and GADD45 is defective in ataxia-telangiectasia. Cell 71: 587–597. 10.1016/0092-8674(92)90593-2 [DOI] [PubMed] [Google Scholar]
- Khan MR, Xiang S, Song Z, Wu M. 2017. The p53-inducible long noncoding RNA TRINGS protects cancer cells from necrosis under glucose starvation. EMBO J 36: 3483–3500. 10.15252/embj.201696239 [DOI] [PMC free article] [PubMed] [Google Scholar]
- Kim D, Langmead B, Salzberg SL. 2015. HISAT: a fast spliced aligner with low memory requirements. Nat Methods 12: 357–360. 10.1038/nmeth.3317 [DOI] [PMC free article] [PubMed] [Google Scholar]
- Kretz M, Siprashvili Z, Chu C, Webster DE, Zehnder A, Qu K, Lee CS, Flockhart RJ, Groff AF, Chow J, et al. 2013. Control of somatic tissue differentiation by the long non-coding RNA TINCR. Nature 493: 231–235. 10.1038/nature11661 [DOI] [PMC free article] [PubMed] [Google Scholar]
- Levine AJ, Momand J, Finlay CA. 1991. The p53 tumour suppressor gene. Nature 351: 453–456. 10.1038/351453a0 [DOI] [PubMed] [Google Scholar]
- Li H, Handsaker B, Wysoker A, Fennell T, Ruan J, Homer N, Marth G, Abecasis G, Durbin R, 1000 Genome Project Data Processing Subgroup. 2009. The Sequence Alignment/Map format and SAMtools. Bioinformatics 25: 2078–2079. 10.1093/bioinformatics/btp352 [DOI] [PMC free article] [PubMed] [Google Scholar]
- Liao Y, Smyth GK, Shi W. 2014. featureCounts: an efficient general purpose program for assigning sequence reads to genomic features. Bioinformatics 30: 923–930. 10.1093/bioinformatics/btt656 [DOI] [PubMed] [Google Scholar]
- Lindsly S, Jia W, Chen H, Liu S, Ronquist S, Chen C, Wen X, Stansbury C, Dotson GA, Ryan C, et al. 2021. Functional organization of the maternal and paternal human 4D nucleome. iScience 24: 103452. 10.1016/j.isci.2021.103452 [DOI] [PMC free article] [PubMed] [Google Scholar]
- Love MI, Huber W, Anders S. 2014. Moderated estimation of fold change and dispersion for RNA-seq data with DESeq2. Genome Biol 15: 550. 10.1186/s13059-014-0550-8 [DOI] [PMC free article] [PubMed] [Google Scholar]
- Lu S, Zhang J, Lian X, Sun L, Meng K, Chen Y, Sun Z, Yin X, Li Y, Zhao J, et al. 2019. A hidden human proteome encoded by “non-coding” genes. Nucleic Acids Res 47: 8111–8125. 10.1093/nar/gkz646 [DOI] [PMC free article] [PubMed] [Google Scholar]
- Ma J, Ward CC, Jungreis I, Slavoff SA, Schwaid AG, Neveu J, Budnik BA, Kellis M, Saghatelian A. 2014. Discovery of human sORF-encoded polypeptides (SEPs) in cell lines and tissue. J Proteome Res 13: 1757–1765. 10.1021/pr401280w [DOI] [PMC free article] [PubMed] [Google Scholar]
- Matsumoto A, Pasut A, Matsumoto M, Yamashita R, Fung J, Monteleone E, Saghatelian A, Nakayama KI, Clohessy JG, Pandolfi PP. 2017. mTORC1 and muscle regeneration are regulated by the LINC00961-encoded SPAR polypeptide. Nature 541: 228–232 10.1038/nature21034 [DOI] [PubMed] [Google Scholar]
- Meng N, Chen M, Chen DE, Chen XH, Wang JZ, Zhu S, He YT, Zhang XL, Lu RX, Yan GR. 2020. Small protein hidden in lncRNA LOC90024 promotes “cancerous” RNA splicing and tumorigenesis. Adv Sci (Weinh) 7: 1903233. 10.1002/advs.201903233 [DOI] [PMC free article] [PubMed] [Google Scholar]
- Mirza A, Wu Q, Wang L, McClanahan T, Bishop WR, Gheyas F, Ding W, Hutchins B, Hockenberry T, Kirschmeier P, et al. 2003. Global transcriptional program of p53 target genes during the process of apoptosis and cell cycle progression. Oncogene 22: 3645–3654. 10.1038/sj.onc.1206477 [DOI] [PubMed] [Google Scholar]
- Müller M, Wilder S, Bannasch D, Israeli D, Lehlbach K, Li-Weber M, Friedman SL, Galle PR, Stremmel W, Oren M, et al. 1998. p53 activates the CD95 (APO-1/Fas) gene in response to DNA damage by anticancer drugs. J Exp Med 188: 2033–2045. 10.1084/jem.188.11.2033 [DOI] [PMC free article] [PubMed] [Google Scholar]
- Nakano K, Vousden KH. 2001. PUMA, a novel proapoptotic gene, is induced by p53. Mol Cell 7: 683–694. 10.1016/S1097-2765(01)00214-3 [DOI] [PubMed] [Google Scholar]
- Nelson BR, Makarewich CA, Anderson DM, Winders BR, Troupes CD, Wu FF, Reese AL, McAnally JR, Chen XW, Kavalali ET, et al. 2016. A peptide encoded by a transcript annotated as long noncoding RNA enhances SERCA activity in muscle. Science 351: 271–275. 10.1126/science.aad4076 [DOI] [PMC free article] [PubMed] [Google Scholar]
- Polycarpou-Schwarz M, Groß M, Mestdagh P, Schott J, Grund SE, Hildenbrand C, Rom J, Aulmann S, Sinn HP, Vandesompele J, et al. 2018. The cancer-associated microprotein CASIMO1 controls cell proliferation and interacts with squalene epoxidase modulating lipid droplet formation. Oncogene 37: 4750–4768. 10.1038/s41388-018-0281-5 [DOI] [PubMed] [Google Scholar]
- Quinlan AR, Hall IM. 2010. BEDTools: a flexible suite of utilities for comparing genomic features. Bioinformatics 26: 841–842. 10.1093/bioinformatics/btq033 [DOI] [PMC free article] [PubMed] [Google Scholar]
- Riley T, Sontag E, Chen P, Levine A. 2008. Transcriptional control of human p53-regulated genes. Nat Rev Mol Cell Bio 9: 402–412. 10.1038/nrm2395 [DOI] [PubMed] [Google Scholar]
- Robinson MD, McCarthy DJ, Smyth GK. 2010. edgeR: a Bioconductor package for differential expression analysis of digital gene expression data. Bioinformatics 26: 139–140. 10.1093/bioinformatics/btp616 [DOI] [PMC free article] [PubMed] [Google Scholar]
- Robinson JT, Thorvaldsdóttir H, Winckler W, Guttman M, Lander ES, Getz G, Mesirov JP. 2011. Integrative genomics viewer. Nat Biotechnol 29: 24–26. 10.1038/nbt.1754 [DOI] [PMC free article] [PubMed] [Google Scholar]
- Rouault JP, Falette N, Guéhenneux F, Guillot C, Rimokh R, Wang Q, Berthet C, Moyret-Lalle C, Savatier P, Pain B, et al. 1996. Identification of BTG2, an antiproliferative p53-dependent component of the DNA damage cellular response pathway. Nat Genet 14: 482–486. 10.1038/ng1296-482 [DOI] [PubMed] [Google Scholar]
- Ruiz-Orera J, Messeguer X, Subirana JA, Alba MM. 2014. Long non-coding RNAs as a source of new peptides. eLife 3: e03523. 10.7554/eLife.03523 [DOI] [PMC free article] [PubMed] [Google Scholar]
- Siepel A, Pollard KS, Haussler D. 2006. New methods for detecting lineage-specific selection. In Computational Molecular Biology. RECOMB 2006. Lecture Notes in Computer Science (ed. Apostolico A, et al. ), Vol. 3909, pp. 190–205. Springer, Berlin. [Google Scholar]
- Slavoff SA, Mitchell AJ, Schwaid AG, Cabili MN, Ma J, Levin JZ, Karger AD, Budnik BA, Rinn JL, Saghatelian A. 2013. Peptidomic discovery of short open reading frame-encoded peptides in human cells. Nat Chem Biol 9: 59–64. 10.1038/nchembio.1120 [DOI] [PMC free article] [PubMed] [Google Scholar]
- Sotelo J, Esposito D, Duhagon MA, Banfield K, Mehalko J, Liao H, Stephens RM, Harris TJ, Munroe DJ, Wu X. 2010. Long-range enhancers on 8q24 regulate c-Myc. Proc Natl Acad Sci 107: 3001–3005. 10.1073/pnas.0906067107 [DOI] [PMC free article] [PubMed] [Google Scholar]
- Vogelstein B, Lane D, Levine AJ. 2000. Surfing the p53 network. Nature 408: 307–310. 10.1038/35042675 [DOI] [PubMed] [Google Scholar]
- Waldman T, Kinzler KW, Vogelstein B. 1995. p21 is necessary for the p53-mediated G1 arrest in human cancer cells. Cancer Res 55: 5187–5190. [PubMed] [Google Scholar]
- Wang T, Cui Y, Jin J, Guo J, Wang G, Yin X, He QY, Zhang G. 2013. Translating mRNAs strongly correlate to proteins in a multivariate manner and their translation ratios are phenotype specific. Nucleic Acids Res 41: 4743–4754. 10.1093/nar/gkt178 [DOI] [PMC free article] [PubMed] [Google Scholar]
- Xiao ZT, Huang RY, Xing XD, Chen YL, Deng HT, Yang XR. 2018. De novo annotation and characterization of the translatome with ribosome profiling data. Nucleic Acids Res 46: e61. 10.1093/nar/gky179 [DOI] [PMC free article] [PubMed] [Google Scholar]
- Xu W, Deng B, Lin P, Liu C, Li B, Huang Q, Zhou H, Yang J, Qu L. 2020. Ribosome profiling analysis identified a KRAS-interacting microprotein that represses oncogenic signaling in hepatocellular carcinoma cells. Sci China Life Sci 63: 529–542. 10.1007/s11427-019-9580-5 [DOI] [PubMed] [Google Scholar]
- Yeasmin F, Yada T, Akimitsu N. 2018. Micropeptides encoded in transcripts previously identified as long noncoding RNAs: a new chapter in transcriptomics and proteomics. Front Genet 9: 144. 10.3389/fgene.2018.00144 [DOI] [PMC free article] [PubMed] [Google Scholar]
- Yu G, Wang LG, Han Y, He QY. 2012. clusterProfiler: an R package for comparing biological themes among gene clusters. OMICS 16: 284–287. 10.1089/omi.2011.0118 [DOI] [PMC free article] [PubMed] [Google Scholar]
- Zhang Y, Liu T, Meyer CA, Eeckhoute J, Johnson DS, Bernstein BE, Nusbaum C, Myers RM, Brown M, Li W, et al. 2008. Model-based Analysis of ChIP-Seq (MACS). Genome Biol 9: R137. 10.1186/gb-2008-9-9-r137 [DOI] [PMC free article] [PubMed] [Google Scholar]
- Zhang A, Xu M, Mo YY. 2014. Role of the lncRNA–p53 regulatory network in cancer. J Mol Cell Biol 6: 181–191. 10.1093/jmcb/mju013 [DOI] [PMC free article] [PubMed] [Google Scholar]
- Zhang Q, Vashisht AA, O'Rourke J, Corbel SY, Moran R, Romero A, Miraglia L, Zhang J, Durrant E, Schmedt C, et al. 2017. The microprotein minion controls cell fusion and muscle formation. Nat Commun 8: 15664. 10.1038/ncomms15664 [DOI] [PMC free article] [PubMed] [Google Scholar]
- Zhao J, Sun BK, Erwin JA, Song JJ, Lee JT. 2008. Polycomb proteins targeted by a short repeat RNA to the mouse X chromosome. Science 322: 750–756. 10.1126/science.1163045 [DOI] [PMC free article] [PubMed] [Google Scholar]
- Zhou KR, Liu S, Sun WJ, Zheng LL, Zhou H, Yang JH, Qu LH. 2017. ChIPBase v2.0: decoding transcriptional regulatory networks of non-coding RNAs and protein-coding genes from ChIP-seq data. Nucleic Acids Res 45: D43–D50. 10.1093/nar/gkw965 [DOI] [PMC free article] [PubMed] [Google Scholar]
- Zhou Y, Zhou B, Pache L, Chang M, Khodabakhshi AH, Tanaseichuk O, Benner C, Chanda SK. 2019. Metascape provides a biologist-oriented resource for the analysis of systems-level datasets. Nat Commun 10: 1523. 10.1038/s41467-019-09234-6 [DOI] [PMC free article] [PubMed] [Google Scholar]
- Zou Z, Ma T, He X, Zhou J, Ma H, Xie M, Liu Y, Lu D, Di S, Zhang Z. 2018. Long intergenic non-coding RNA 00324 promotes gastric cancer cell proliferation via binding with HuR and stabilizing FAM83B expression. Cell Death Dis 9: 717. 10.1038/s41419-018-0758-8 [DOI] [PMC free article] [PubMed] [Google Scholar]
Associated Data
This section collects any data citations, data availability statements, or supplementary materials included in this article.