Abstract
A Deep-Learning (DL) based segmentation tool was applied to a new magnetic resonance imaging dataset of pregnant women with suspected Placenta Accreta Spectrum (PAS). Radiomic features from DL segmentation were compared to those from expert manual segmentation via intraclass correlation coefficients (ICC) to assess reproducibility. An additional imaging marker quantifying the placental location within the uterus (PLU) was included. Features with an ICC > 0.7 were used to build logistic regression models to predict hysterectomy. Of 2059 features, 781 (37.9%) had ICC >0.7. AUC was 0.69 (95% CI 0.63–0.74) for manually segmented data and 0.78 (95% CI 0.73–0.83) for DL segmented data.
1. INTRODUCTION
The placenta is a critical and complex organ that provides oxygen, nutrition, and removes waste during pregnancy. Pregnant women may develop placenta accreta spectrum (PAS) when there is a defect in the endometrial-myometrial junction that leads to the placenta becomes adherent or invasive1–4. Life-threatening complications occur when the placenta does not detach from the uterine wall at delivery. Current clinical management for the most severe cases requires cesarean hysterectomy. However, there is an unmet clinical need for quantitative and objective measures of abnormal placentation that can serve as predictors of risk of hysterectomy.
Prediction of hysterectomy in pregnant women with suspected PAS has been investigated with MRI and radiomic features5–7. Texture features have shown potential in computer-aid-diagnosis (CAD)6. Extraction of these features requires an experienced radiologist to manually segment the placenta and uterus or a reproducible machine learning based segmentation algorithm. Our goal is to construct a pipeline that includes (semi)automatic segmentation of the placenta and uterus to predict the need for hysterectomy in women with suspected PAS.
We have developed a deep learning (DL) based semi-automatic segmentation8. Dice similarity coefficient (DSC)9 was reported to be 92% and 82% for uterus and placenta on average. However, the reproducibility of the radiomic features between expert manual (reference standard) and DL based segmentations have not been assessed.
In addition to conventional library of radiomic features, the relative location of placenta within in uterus is one of the most notable clinical imaging markers for the association with cesarean hysterectomy10. We proposed an approach to quantify placental location within uterus based on the centers of mass of the segmented placenta and uterus.
In this paper, our primary aim was to assess the reproducibility of the shape, texture features and the relative location of placenta in the uterus between DL segmented data and the expert manually segmented data. Our secondary aim was to develop statistical models to predict hysterectomy using those textural features with the segmented data that were deemed reproducible.
2. METHODS
2.1. Data
We performed an IRB approved retrospective review of 100 pregnancies, from our 2006–2019 MR database referred for clinically suspected PAS. Sagittal MR images from this database were included in previous publications6, 8. The DL segmented data on axial T2-weighted images are now reported. All images were acquired on a 1.5T MR scanner (Avanto, Siemens Healthcare, Erlangen, Germany). Half Fourier single shot turbo spin echo (HASTE) T2-weighted axial imaging sequence covering the entire gravid uterus was evaluated. In-plane spacing varied from 0.82 to 1.56 mm. Slice thickness was set at 7mm, 0 gap. For each patient, a researcher (Q.N.D.) under supervision of an expert radiologist (D.M.T.) manually segmented the uterine cavity and placenta volumes. These expert manual segmentations were considered as reference standard. Delivery surgical outcome, including clinical and pathologic diagnosis of placental tissue collected at delivery, was obtained. A binary variable indicating whether the patients had a cesarean hysterectomy at delivery was used as the clinical outcome for prediction.
2.2. Radiomic Feature Extraction
All shape, and texture radiomic features were extracted following the image biomarker standardization initiative (IBSI) guideline11 using the pyRadiomics package12. All shape features (n=14) were acquired in 3D. Because of the thick through plane spacing (7mm), all texture features were acquired in 2D. In-plane spacing was resampled to 1.5mm ×1.5mm with B spline interpolation. Texture features were extracted only from the segmented placenta data. We included various combination of processing schemes for normalization, digitization, filtering and texture feature classes (Table 1). For z score normalization, voxels with value outside ± 2SD were censored and a scaler of 100 was applied. For histogram equalization, the images were rescaled to 0–255. In total, 2058 conventional radiomic features were calculated.
Table 1:
List of key radiomics extraction parameters for texture features.
| Normalization | Digitization | Filters | Texture Features |
|---|---|---|---|
| z score histogram equalization | fixed bin count (FBC:100) fixed bin size (FBS:5) | Original Laplacian of Gaussian (LoG, σ = 2, 5) wavelet (HH, HL, LH, LL) | GLCM (n=22) |
| GLDM (n=14) | |||
| GLRLM (n=16) | |||
| GLSZM (n=16) | |||
| NGTDM (n=5) |
2.3. Placental Location within Uterus (PLU)
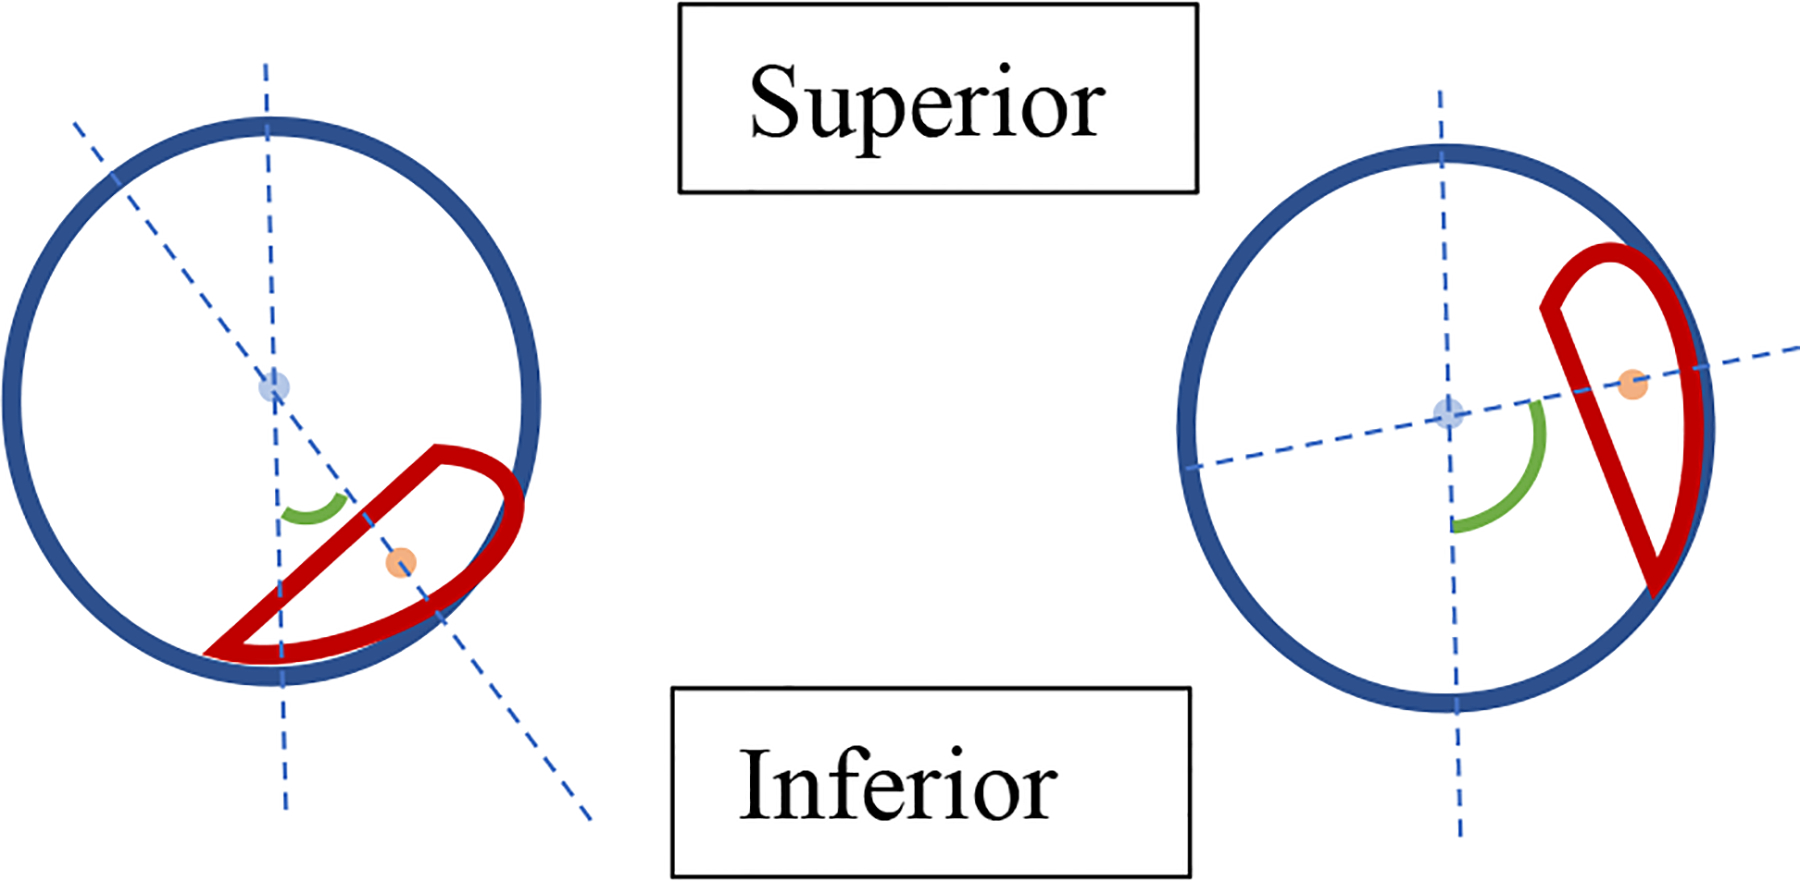
The placental location within the uterus has important clinical significance, especially as related to the diagnosis of PAS7. We propose a new imaging marker that describes the relative location of placenta within the uterus. We defined this marker, PLU, as the angle between the vertical line defining the center of mass of uterus and the line defining the center of mass of uterus and the center of mass of the placenta (Figure 1). Our hypothesis was: the smaller the angle, the lower the placenta to the uterus, and the higher the likelihood of hysterectomy. We calculated this angle from both the expert manual segmentation and the DL based segmentation.
Figure 1:

A 2D illustration (sagittal) of the Placental Location within Uterus (PLU). The blue circle and light blue dot represent the uterus and its center of mass (CM), the red object and light red dot represent the placenta and its CM. The two dashed reference lines represent the vertical line going through the CM of uterus and the line going through both CM of uterus and CM of placenta. Green angle (in absolute value) is the proposed marker (PLU).
2.4. Statistical methods
Dice similarity coefficient (DSC) between DL based segmentation and expert manual segmentation were calculated for placenta and uterus respectively for each patient. Intraclass correlation coefficient using two-way mixed model for consistency agreement (ICC (3,1)) was used to assess the reproducibility of the DL segmented data. A linear mixed model was used to assess the effect of normalization and digitization on reproducibility. To be specific, a mixed effects model with ICC as the response variable; filter, digitization, normalization and their 2- and 3-way interaction terms as fixed effects and features as random effects was used. Percent of variation that was explained by each effect was calculated by dividing the corresponding sum of squares by the total sum of squares.
PLU was compared between patients with and without cesarian hysterectomy via Wilcoxon rank sum test. All features with an ICC > 0.7 were used to build a logistic regression model to predict cesarian hysterectomy. Variable selection was done using N (LASSO). The tuning parameter, lambda, is selected when deviance from logistic regression is minimized. Nested 10-fold/10-fold cross validation was also incorporated. The inner 10-fold loop was used for calculating cross-validated deviance and tuning lambda, while the outer loop was used for testing. The entire nested cross validation scheme was repeated 100 times resulting 1000 different models. Feature selection frequency, ROCs curve and AUCs from the outer loop for both DL segmented data and manually segmented data were reported.
All analyses were done in R 4.0.213 and SAS 9.5 (SAS institute, Inc., Cary, NC). ICC was calculated using the irr package14. Linear mixed model was perfumed using the GLM procedure in SAS. LASSO regression was performed using the glmnet package15. ROC curves and AUC were calculated using the pROC package16.
3. RESULTS
DL segmentation failed in placenta in one subject via visual inspection and was removed from subsequent analyses. Median DSC was 74% for both placenta and uterus (Q1-Q3: 62% - 81% (placenta), 69% - 77% (uterus)).
3.1. Reproducibility of Conventional Radiomic Features
871 (37.9%) of the 2058 conventional radiomic features met the 0.7 cutoff for reproducibility. However, none of the shape features met the 0.7 cutoff (Supplementary Table 1 and 2).
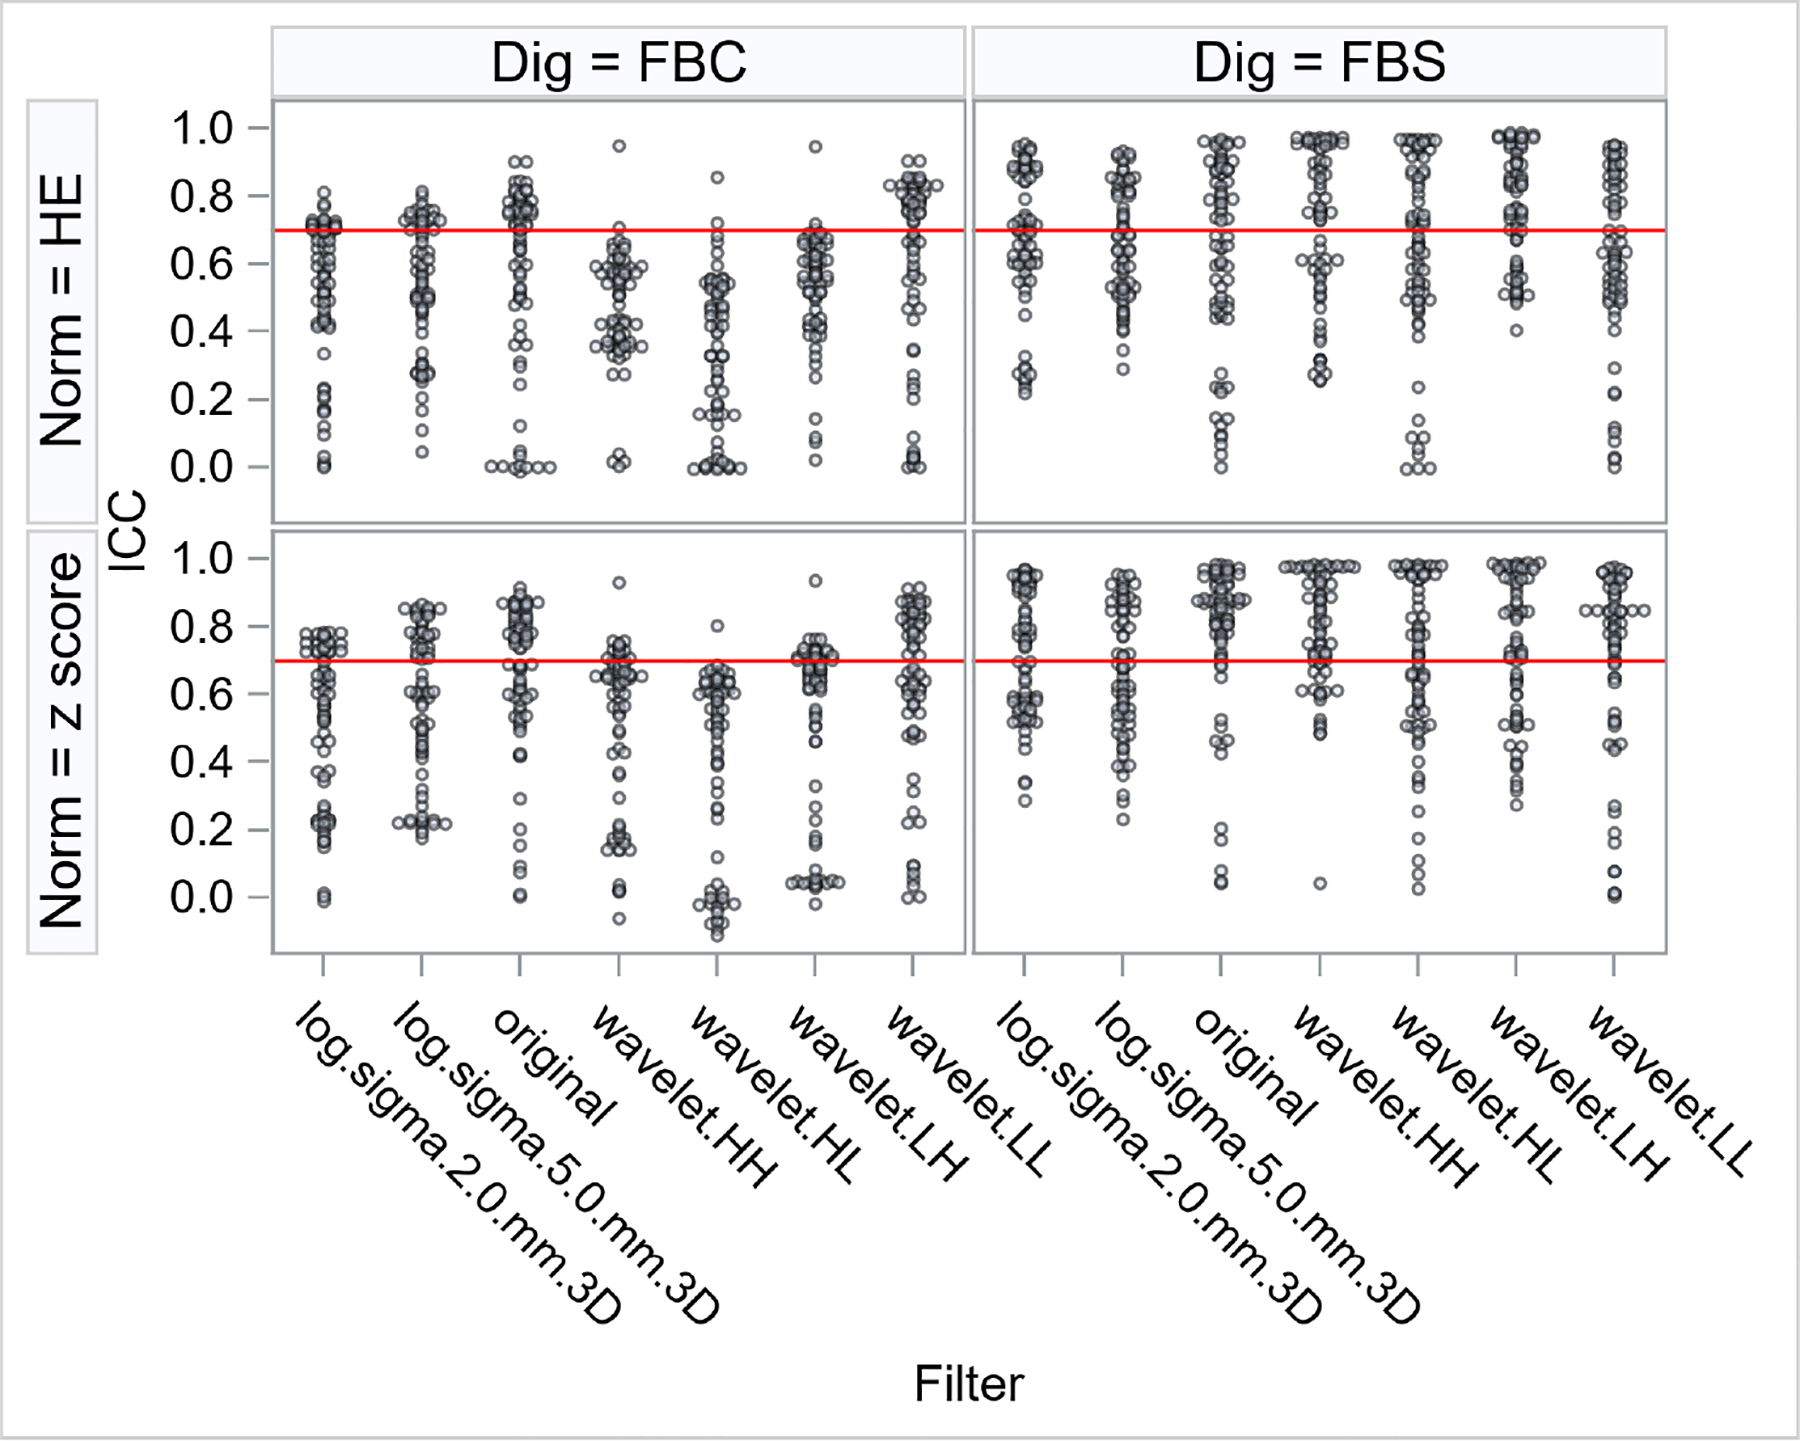
For texture features, digitization alone has the most impact on reproducibility by explaining 12% of the variability (p<.0001 in Table 2). FBS had higher ICC on average comparing to FBC (figure 2). The improvement in ICC was most prominent when wavelet or a LoG filter was applied (This also corresponded to the significant interaction effect of Digitization*Filter in Table 2).
Table 2:
Analysis of Variance table of the mixed effects model
| Source of variation | DF | Type III SS | Mean Square | F Value | Pr > F | % explained |
|---|---|---|---|---|---|---|
| Digitization | 1 | 16.46 | 16.46 | 651.44 | <.0001 | 12.39% |
| Filter | 6 | 3.71 | 0.62 | 24.49 | <.0001 | 2.79% |
| Digitization*Filter | 6 | 3.83 | 0.64 | 25.26 | <.0001 | 2.88% |
| Normalization | 1 | 1.17 | 1.17 | 46.3 | <.0001 | 0.88% |
| Digitization*Normalization | 1 | 0.05 | 0.05 | 2.16 | 0.1414 | 0.04% |
| Filter*Normalization | 6 | 0.92 | 0.15 | 6.04 | <.0001 | 0.69% |
| Digitization*Filter*Normalization | 6 | 0.10 | 0.02 | 0.67 | 0.6756 | 0.08% |
| Features | 66 | 57.32 | 0.87 | 34.38 | <.0001 | 43.16% |
| Residual | 1950 | 49.26 | 0.03 | |||
| Total | 2043 | 132.81 |
Figure 2:

Distribution of intraclass correlation coefficients (ICC) of the texture features for different combinations of normalization (Norm = z score, histogram equalization (HE)), digitization (Dig = fixed bin count (FBC), fixed bin size (FBS)) and Filter (Laplacian of Gaussian (log), original, wavelet). Each point represents one radiomic texture feature under a certain normalization, digitization and filter combination. Red horizontal line represents the 0.7 cutoff for reproducibility.
3.2. Placental Location within Uterus (PLU)
ICC in PLU between manual and DL segmentation was 0.83 (95% CI 0.76 – 0.88). PLU was significantly lower in patients with cesarean hysterectomy (median (IQR): 38° (33°)) comparing to those without (median (IQR): 58° (57°), p value = 0.02).
3.3. Diagnostic Performance
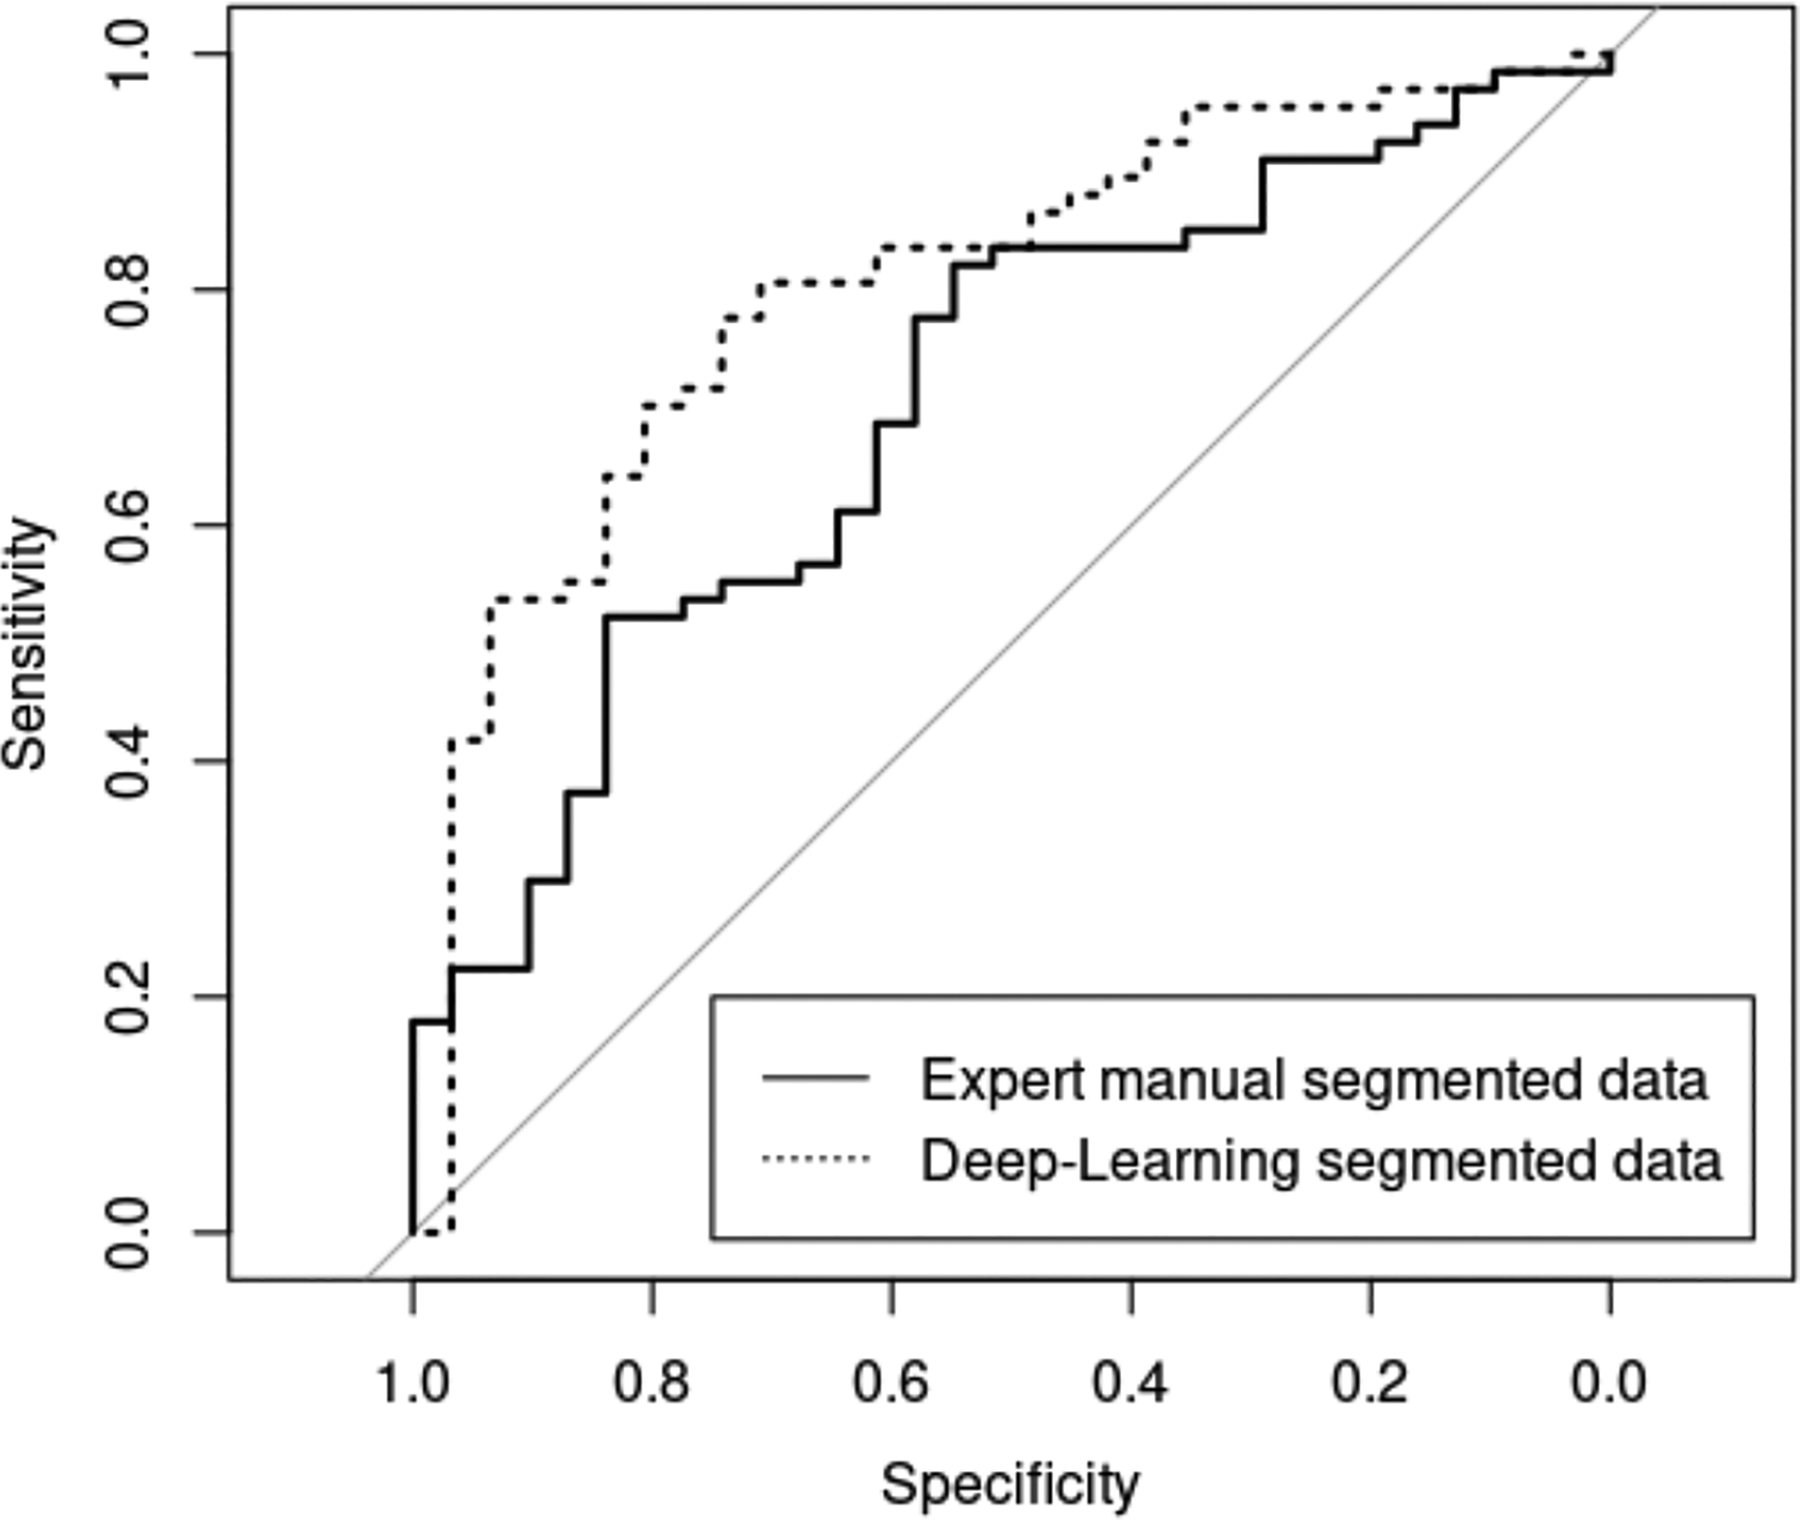
AUC of the testing loop was 0.69 (95% CI 0.63 – 0.74) for manually segmented data and 0.78 (95% CI 0.73 – 0.83) for DL segmented data (Figure 3). Features selected in more than 30% of the iterations were listed in Table 3. PLU was selected in almost all iterations.
Figure 3:

Averaged ROC curves of the outer cross-validation for the expert manually segmented data and Deep-Learning segmented data.
Table 3:
List of features that were selected more than 30% of the time and their selected frequency.
| Feature Names | Manual segmentation | DL segmentatio n |
|---|---|---|
| PLU | 98% | 95% |
| FBC_z_log.sigma.5.0.mm.3D_glcm_InverseVariance | 55% | - |
| FBC_z_log.sigma.5.0.mm.3D_glcm_MaximumProbability | - | 51% |
| FBC_z_original_glcm_DifferenceVariance | 31% | - |
| FBC_z_wavelet.LH_glcm_InverseVariance | 81% | 31% |
| FBC_HE_log.sigma.2.0.mm.3D_glcm_InverseVariance | - | 43% |
| FBC_HE_log.sigma.5.0.mm.3D_gldm_DependenceVariance | 40% | - |
| FBC_HE_original_glcm_Contrast | - | 70% |
| FBC_HE_wavelet.HL_glszm_GrayLevelNonUniformity | - | 82% |
| FBS_z_wavelet.HH_ngtdm_Complexity | - | 39% |
| FBS_z_wavelet.HL_glcm_Correlation | - | 33% |
| FBS_z_wavelet.HL_glcm_SumSquares | - | 52% |
| FBS_z_wavelet.HL_glrlm_GrayLevelNonUniformity | - | 38% |
| FBS_z_wavelet.HL_ngtdm_Busyness | - | 62% |
| FBS_z_wavelet.HL_ngtdm_Contrast | 60% | - |
| FBS_z_wavelet.LH_gldm_DependenceVariance | 36% | - |
| FBS_HE_log.sigma.2.0.mm.3D_gldm_DependenceVariance | 76% | 86% |
| FBS_HE_log.sigma.2.0.mm.3D_glszm_LargeAreaHighGrayLevelEmphasis | - | 47% |
| FBS_HE_log.sigma.5.0.mm.3D_glszm_LargeAreaHighGrayLevelEmphasis | 41% | - |
| FBS_HE_wavelet.HH_glszm_SizeZoneNonUniformityNormalized | - | 55% |
| FBS_HE_wavelet.HL_gldm_GrayLevelNonUniformity | - | 64% |
| FBS_HE_wavelet.LH_glcm_ClusterShade | 65% | 72% |
| FBS_HE_wavelet.LH_gldm_DependenceVariance | 56% | 30% |
| FBS_HE_wavelet.LH_glszm_GrayLevelVariance | 59% | 93% |
PLU: relative location of placenta to uterus; FBC: fixed bin count; FBS: fixed bin size; z: z score normalization; HE: histogram equalization; Log: Laplacian of Gaussian filter.
4. DISCUSSION
This is a major step forward in constructing an automated pipeline for identifying PAS patients at high-risk for cesarean hysterectomy at delivery. Currently diagnosis of PAS severe enough to result in cesarean hysterectomy by MR studies is subjective and problematic, requiring meticulous review of parameters by an experienced radiologist at specialized academic centers. A quantitative deep learning process has great potential implications to be more consistent in interpretation and offer universal applications in situations where access is limited to a specialized expert radiologist. We investigated the impact of common digitization and normalization method to feature reproducibility and have identified reproducible MR imaging markers (including a handcrafted marker, PLU) with good predictability.
Performance of machine learning based segmentation algorithms were commonly assess by DSC in terms of spatial overlap with the reference standard. However, excellent DSC maybe a sufficient but not necessary condition for good reproducibility in radiomic features. Through different combination of normalization, digitization and filtering, some radiomic features can be more robust to segmentation errors. In our study, DSC between DL based and manual segmentation of the placenta was moderate to good (median DSC 74%, Q1-Q3: 62% - 81%), while many radiomic texture features had excellent reproducibility under the fix bin size (FBS) digitization method.
On the other hand, conventional radiomic shape features had poor to mild ICC. This highlighted the challenge in accurate segmentation of the boundary of the placenta, which usually has a complicated non-convex shape. Partial voluming due to the thick MR slice thickness could be another contributing factor.
In addition to the conventional radiomic features, we proposed a clinically derived image marker, Placental Location within Uterus (PLU). It had good reproducibility between DL based and manual segmentation due to only utilizing the center of mass of the placenta and uterus. It also had excellent contribution in predicting hysterectomy in our study population.
Our work has limitations. First, an external validation is not available. All subjects were from the same local clinic. We have performed nested cross validation to avoid overfitting but generalization to other population may be limited. Second, our sample size is small, and only 80% of the data was used for training within each iteration. With a larger sample size, the full potential of the model could be explored. Third, only T2-weighted images were used. Other sequences such as T1-weighted images and functional MRI including diffusion weighted images (DWI), blood oxygenation level dependent (BOLD) and arterial spin labeled (ASL) MRI may provide additional information.
5. CONCLUSIONS
We have identified reproducible texture radiomics features despite moderate DSC and demonstrated comparable diagnostic performance between deep learning based segmented data and expert manual segmented data. We have also confirmed that the relative location of placenta within the uterus can be automatically assessed with high reproducibility and lower PLU was a significant risk factor in predicting hysterectomy. It was, in fact, the most frequently selected feature when building the predictive model.
Supplementary Material
REFERENCES
- 1.Jauniaux E, et al. , FIGO consensus guidelines on placenta accreta spectrum disorders: Epidemiology. Int J Gynaecol Obstet, 2018. 140(3): p. 265–273. [DOI] [PubMed] [Google Scholar]
- 2.Leyendecker JR, et al. , MRI of pregnancy-related issues: abnormal placentation. AJR Am J Roentgenol, 2012. 198(2): p. 311–20. [DOI] [PubMed] [Google Scholar]
- 3.Maldjian C, et al. , MRI appearance of placenta percreta and placenta accreta. Magn Reson Imaging, 1999. 17(7): p. 965–71. [DOI] [PubMed] [Google Scholar]
- 4.Silver RM and Barbour KD, Placenta accreta spectrum: accreta, increta, and percreta. Obstet Gynecol Clin North Am, 2015. 42(2): p. 381–402. [DOI] [PubMed] [Google Scholar]
- 5.Do QN, et al. , Texture analysis of magnetic resonance images of the human placenta throughout gestation: A feasibility study. PLoS One, 2019. 14(1): p. e0211060. [DOI] [PMC free article] [PubMed] [Google Scholar]
- 6.Do QN, et al. , MRI of the Placenta Accreta Spectrum (PAS) Disorder: Radiomics Analysis Correlates With Surgical and Pathological Outcome. J Magn Reson Imaging, 2020. 51(3): p. 936–946. [DOI] [PubMed] [Google Scholar]
- 7.Happe SK, et al. , Predicting Placenta Accreta Spectrum: Validation of the Placenta Accreta Index. J Ultrasound Med, 2020. [DOI] [PubMed] [Google Scholar]
- 8.Shahedi M, et al. , Segmentation of uterus and placenta in MR images using a fully convolutional neural network. Proc SPIE Int Soc Opt Eng, 2020. 11314. [DOI] [PMC free article] [PubMed] [Google Scholar]
- 9.Dice LR, Measures of the Amount of Ecologic Association Between Species. Ecology, 1945. 26(3): p. 297–302. [Google Scholar]
- 10.Clark HR, et al. , Placenta Accreta Spectrum: Correlation of MRI Parameters With Pathologic and Surgical Outcomes of High-Risk Pregnancies. AJR Am J Roentgenol, 2020. 214(6): p. 1417–1423. [DOI] [PubMed] [Google Scholar]
- 11.Zwanenburg A, et al. , The Image Biomarker Standardization Initiative: Standardized Quantitative Radiomics for High-Throughput Image-based Phenotyping. Radiology, 2020. 295(2): p. 328–338. [DOI] [PMC free article] [PubMed] [Google Scholar]
- 12.van Griethuysen JJM, et al. , Computational Radiomics System to Decode the Radiographic Phenotype. Cancer Res, 2017. 77(21): p. e104–e107. [DOI] [PMC free article] [PubMed] [Google Scholar]
- 13.R Core Team. R: A Language and Environment for Statistical Computing. R Foundation for Statistical Computing. 2020. [Google Scholar]
- 14.Gamer M, Lemon J, and Singh IFP, irr: Various Coefficients of Interrater Reliability and Agreement. 2019.
- 15.Simon N, et al. , Regularization Paths for Cox’s Proportional Hazards Model via Coordinate Descent. J Stat Softw, 2011. 39(5): p. 1–13. [DOI] [PMC free article] [PubMed] [Google Scholar]
- 16.Robin X, et al. , pROC: an open-source package for R and S+ to analyze and compare ROC curves. BMC Bioinformatics, 2011. 12: p. 77. [DOI] [PMC free article] [PubMed] [Google Scholar]
Associated Data
This section collects any data citations, data availability statements, or supplementary materials included in this article.


